

Abstract
During hybrid speciation, homoeologues combine in a single genome. Homoeologue expression bias (HEB) occurs when one homoeologue has higher gene expression than another. HEB has been well characterized in plants but rarely investigated in animals, especially invertebrates. Consequently, we have little idea as to the role that HEB plays in allopolyploid invertebrate genomes. If HEB is constrained by features of the parental genomes, then we predict repeated evolution of similar HEB patterns among hybrid genomes formed from the same parental lineages. To address this, we reconstructed the history of hybridization between the New Zealand stick insect genera Acanthoxyla and Clitarchus using a high‐quality genome assembly from Clitarchus hookeri to call variants and phase alleles. These analyses revealed the formation of three independent diploid and triploid hybrid lineages between these genera. RNA sequencing revealed a similar magnitude and direction of HEB among these hybrid lineages, and we observed that many enriched functions and pathways were also shared among lineages, consistent with repeated evolution due to parental genome constraints. In most hybrid lineages, a slight majority of the genes involved in mitochondrial function showed HEB towards the maternal homoeologues, consistent with only weak effects of mitonuclear incompatibility. We also observed a proteasome functional enrichment in most lineages and hypothesize this may result from the need to maintain proteostasis in hybrid genomes. Reference bias was a pervasive problem, and we caution against relying on HEB estimates from a single parental reference genome.
Keywords: asexual, gene expression, hybrid, Phasmatodea, transcriptomics
1. INTRODUCTION
Hybridization can result in new species that reproduce asexually via parthenogenesis (Mallet, 2007; Neiman et al., 2014). During hybrid speciation, or allopolyploidization, the set of alleles from one species, known as homoeologues (Glover et al., 2016), are combined with the alleles of another species. This can result in a highly heterozygous hybrid genome, even more so if polyploid (Birky, 1996). Homoeologues can have different levels of fitness in hybrid genomes relative to the parental genomes, sometimes leading to Dobzhansky–Muller incompatibilities (Orr & Turelli, 2001; Sloan et al., 2023; Swamy et al., 2022). The impact of hybridization on evolutionary trajectories is therefore highly variable.
Homoeologue expression bias (HEB), where homoeologues from one parent are expressed at a higher level than those from the other parent (Adams et al., 2003), is relatively well characterized in plant genomes (Bird et al., 2018; Edger et al., 2017). The intense focus on plant genomes results from the high frequency that allopolyploidy occurs in plants, including species of economic importance (Renny‐Byfield & Wendel, 2014). Allopolyploid plant genomes often show HEB (Grover et al., 2012), although balanced expression among homoeologues has also been inferred (Mu et al., 2023). However, there are few studies on HEB in hybrid animal lineages, with most focusing on fish and amphibians (Garcia et al., 2014; Matos et al., 2019; McElroy et al., 2017; Pala et al., 2008; Ren et al., 2022) and only a very few on invertebrates (Dai et al., 2023). Due to the shortage of studies investigating HEB in invertebrate taxa, we do not yet know how widespread this phenomenon is in the most diverse and abundant animal groups, or whether HEB patterns are similar to those found in plants. HEB may allow a parthenogenetic lineage to modify its phenotype in response to selective pressures and potentially supports the longevity of these lineages. There are a vast number of parthenogenetic invertebrate species of hybrid origin (Neiman et al., 2014), making them ideal candidates for investigating the mechanisms and evolution of HEB.
Examining whether similar sets of genes show the same direction and magnitude of HEB in independent hybrid lineages can reveal whether these patterns are the result of pre‐existing constraints from the parental genomes (Bird et al., 2021). This question has been addressed only in a few plant and vertebrate taxa but not in invertebrates. Artificially generated Brassica napus allopolyploid lines had a high proportion of HEB genes showing the same pattern across independent lines (Bird et al., 2021). Naturally occurring polyploid lineages of goatsbeard (Tragopogon spp.) plants (Boatwright et al., 2021) also showed repeated patterns of HEB. Such studies are even rarer in animals, with two exceptions being diploid and triploid hybrids between Cobitis taenia and C. elongatoides fish (Bartoš et al., 2019) and the complex of hybrid diploid and triploid lineages in the fish Squalius alburnoides (Matos et al., 2019). Both studies showed a degree of repeated evolution of HEB patterns.
The few studies on vertebrates have confirmed HEB across multiple genes (Garcia et al., 2014; McElroy et al., 2017) and frequently in genes associated with mitochondrial function (Matos et al., 2019). Most genes in the mitochondrial proteome are encoded in the nuclear genome (Calvo & Mootha, 2010), and many nuclear DNA gene products must co‐function with mitochondrial DNA (mtDNA) products for the proper functioning of the mitochondria. However, because hybridization merges homoeologues that may be under different selection pressures, there can be incompatibility between the mitochondrially encoded proteins and nuclear encoded proteins, resulting in mitochondrial dysfunction (Gonzalez, 2021; Kwon et al., 2022; Moran et al., 2024). Therefore, mitonuclear incompatibility (Du et al., 2017; Hill, 2019) may be an important driver of HEB in hybrid animal genomes.
To further examine the evolution of HEB in invertebrates, we need lineages of hybrid species that have repeatedly arisen from the same or closely related parental species. In the absence of controlled laboratory crosses, we must be confident we have correctly reconstructed the history of reticulation to ensure only independent hybrid lineages are compared.
Stick insects (Phasmatodea) frequently hybridize forming parthenogenetic lineages that can be polyploid (Bullini, 1994; Ghiselli et al., 2007; Lavanchy et al., 2024; Marescalchi et al., 2002; Miller et al., 2023), and so are a good model to examine HEB. The New Zealand stick insects comprise 10 genera and 20 species (Buckley et al., 2014; Buckley & Bradler, 2010). The genus Acanthoxyla has diploid and triploid lineages, some of which arose through hybridization (Buckley et al., 2008; Morgan‐Richards & Trewick, 2005). We recognize three species in Acanthoxyla, including two parthenogenetic species A. inermis and A. prasina. The genus was long assumed to be obligately parthenogenetic (Salmon, 1955), notwithstanding the single A. inermis male collected from an introduced population in the United Kingdom (Brock et al., 2018). However, Acanthoxyla nov. sp. 1 was recently discovered and consists of a single sexual population (T. Buckley, pers. obs.). Cytogenetics (Myers et al., 2013) and sequencing of single‐copy nuclear genes (Buckley et al., 2008) showed diploid and triploid lineages within Acanthoxyla. Studies of mitochondrial and nuclear genes show a history of hybridization between Acanthoxyla and sexual populations of the geographical parthenogen Clitarchus hookeri (Buckley et al., 2008; Morgan‐Richards et al., 2016; Morgan‐Richards & Trewick, 2005; Myers et al., 2013). Gene trees from single‐copy nuclear genes also suggest multiple hybridization events (Buckley et al., 2008), but genomic data are required to confidently resolve independent hybrid lineages.
We sequenced and assembled a high‐quality reference genome for C. hookeri and coupled this with resequencing, diploid and triploid allele phasing and RNA sequencing to reconstruct the history of lineage reticulation and estimate the direction and magnitude of HEB in hybrid genomes. We used these approaches to address the following questions: (1) how many independent hybridization events have there been between Acanthoxyla and Clitarchus?; (2) do hybrid Acanthoxyla genomes demonstrate HEB?; (3) do independent hybrid lineages demonstrate repeated evolution (sensu Cerca, 2023) of HEB patterns, consistent with constraints from parental genomes?; (4) what genomic functions demonstrate the highest levels of HEB?; (5) is there evidence that mitonuclear incompatibility is driving HEB in mitochondrial proteins?
2. MATERIALS AND METHODS
2.1. Species and population sampling
Stick insects were collected from host plants through visual inspection (Table 1). All individuals sequenced were female. They were transported to the laboratory live and specimens used for DNA sequencing were snap frozen at −80°C. Specimens used for RNA sequencing were acclimated to common laboratory conditions for 2 weeks before freezing at −80°C. For whole genome sequencing and assembly, we sampled individuals of diploid C. hookeri from a single sexual population. For resequencing to reconstruct the history of reticulation, we sampled multiple lineages and populations of Acanthoxyla and all other genera and species from the monophyletic tribe Acanthoxylini. This included Argosarchus horridus, sister group to all other Acanthoxylini species, as well Tepakiphasma and Pseudoclitarchus (Dunning et al., 2013) (Table 1). Sampling of Acanthoxyla included three mtDNA lineages from A. prasina, which we label ‘AXX’, ‘AXP’ and ‘AXG’. We also include the undescribed sexual Acanthoxyla species, which we refer to as Acanthoxyla nov. sp. 1 (AXW2). For RNA sequencing, we sampled the three A. prasina lineages (AXG, AXP, AXX), two populations of A. inermis (PG, WB) and one population of C. hookeri (Table 1).
TABLE 1.
Species sampling localities, ploidy levels and reproductive modes of specimens sampled in this study for genome sequencing and/or RNA sequencing.
| Species | Locality | Specimen code | Ploidy/reproductive mode |
|---|---|---|---|
| Acanthoxyla nov. sp. 1 | Te Haumihi (34°28′26.90″ S, 172°45′47.10″ E) | AXW2 | Diploid/sexual |
| Acanthoxyla prasina (AXP) | Ōtari‐Wilton's Bush (41°16′02.46″ S, 174°45′26.88″ E) | AXP‐WB6 + (AXP_WB_2021_2, AXP_WB_2021_4, AXP_WB_2021_8, AXP_WB_2021_9, AXP_WB_6) | Triploid/parthenogenetic |
| A. prasina (AXX) | Ōtari‐Wilton's Bush (41°16′02.46″ S, 174°45′26.88″ E) | AXX‐WB4 + (AXX_WB_10, AXX_WB_11, AXX_WB_13, AXX_WB_14, AXX_WB_9) | Triploid/parthenogenetic |
| A. prasina (AXG) | Auckland city (36°43′23.00″ S, 174°41′32.00″ E) | AXG‐F‐AB12 + (AXX_AB_11, AXX_AB_13, AXX_AB_14, AXX_AB_15, AXX_AB_16) | Triploid/parthenogenetic |
| Acanthoxyla inermis | Invercargill (46°24′15.00″ S, 168°21′26.00″ E) | AXX500 | Diploid/parthenogenetic |
| A. inermis (WB) | Ōtari‐Wilton's Bush (41°16′02.46″ S, 174°45′26.88″ E) | (AXP_WB_1, AXX_WB_1, AXX_WB_3, AXX_WB_7) | Diploid/parthenogenetic |
| A. inermis (PG) | Paengaroa (39°38′45.24″ S, 175°42′37.20″ E) | (AXG_PG_11, AXG_PG_12, AXI_PG_1, AXI_PG_2, AXI_PG_3) | Diploid/parthenogenetic |
| Clitarchus hookeri | Auckland city (36°43′23.00″ S, 174°41′32.00″ E) | CLI753, CLI525 (CLH_TP_51, CLH_TP_52, CLH_TP_53, CLH_TP_54, CLH_TP_55) | Diploid/sexual |
| Clitarchus tepaki | Te Haumihi (34°28′26.90″ S, 172°45′47.10″ E) | CLI948 | Diploid/sexual |
| Clitarchus rakauwhakanekeneke | Tawhiti Rahi, Poor Knights Islands (35°27′27.24″ S, 174°44′19.20″ E) | PKI14 | Diploid/sexual |
| Pseudoclitarchus sentus | Manawatāwhi/Great Island (34°09′46.68″ S, 172°08′32.64″ E) | PSS | Diploid/sexual |
| Tepakiphasma ngatikuri | Te Haumihi (34°28′26.90″ S, 172°45′47.10″ E) | TP | Diploid/sexual |
| Argosarchus horridus | Banks Peninsula (43°37′55.62″ S, 172°37′32.70″ E) | ARG100 | Diploid/parthenogenetic |
Note: Specimen sample codes outside parentheses in the specimen code column were used for whole genome sequencing/resequencing, and specimens inside parentheses were used for RNA sequencing. Two or three letter lineage or population codes are given after some species names in the species column.
2.2. DNA and RNA sequencing
We used two DNA extraction methods to obtain ultra‐high molecular weight (UHMW) and high molecular weight (HMW) DNA. The UHMW approach was performed by powdering 25 mg of head and leg with liquid nitrogen and isolating DNA using the QIAGEN Genomic‐tip 100/G procedure for tissue samples (Qiagen, USA) following the manufacturer's instructions with the following minor alterations: centrifugation at 20,000 g for 30 min at the isopropanol precipitation step, and for 15 min at the ethanol wash step. DNA was eluted in 200 μL of EB buffer (Qiagen, USA) and sheared five times using a 26G blunt end needle. High molecular weight (HMW) genomic DNA extraction was performed on 50–60 mg of tissue using the MagAttract HMW kit (Qiagen, USA) and DNA was eluted twice in 100 μL of AE buffer (Qiagen). Size selection was performed twice for DNA extracts that showed some degradation with AMPure XP beads (Beckman Coulter, USA) at a ratio of 0.45, and size selection for those with minimal degradation was performed using the Short Read Eliminator XL kit (Circulomics, USA). Extracts with particularly poor or low concentration DNA were further processed using the Genomic DNA Clean & Concentrator‐10 (Zymo Research, USA) kit.
Approximately 1.5–3.0 μg of HMW DNA was used to prepare Oxford Nanopore Technologies (ONT) libraries using one of three kits (SQK‐LSK108, SQL‐LSK109, SQK‐LSK110). For ultra‐long ONT sequencing, 40 μg of UHMW DNA was used to prepare libraries using the SQK‐ULK001 kit with the Circulomics Nanobind UL Library Prep Kit (Circulomics, USA, Part no. NB‐900‐601‐01). Libraries were sequenced on an ONT MinION device with R9.4.1 flow cells; with up to three library loads per flow cell, with intervening nuclease washes to maximize sequencing output.
A Hi‐C library was prepared from C. hookeri using the Phase Genomics Proximo Genome Scaffolding Platform, version 2, following the manufacturer's recommendations (Phase Genomics, USA). The library was then sequenced on two lanes of an Illumina HiSeq X Ten System. Chromium 10x libraries were prepared following manufacturers' recommendations and each library sequenced on two lanes of an Illumina HiSeq X Ten System. Paired end 150 base pair libraries were prepared for individuals from all species and sequenced at 10–40 × coverage on an Illumina HiSeq X Ten or NovaSeq.
RNA was extracted by powdering 20 mg of leg tissue in liquid nitrogen and then using the Direct‐zol RNA Miniprep Kit (Zymo Research, USA) following the manufacturer's instructions. RNA sequencing (RNASeq) libraries were prepared using the TruSeq RNA Library Prep Kit v2 (Illumina, USA) and sequenced on an Illumina Novaseq.
2.3. Genome assembly and annotation
ONT reads with 35× coverage were preprocessed using FastQC v. 0.11.9 (Andrews, 2010) then assembled using Flye v. 2.9 (Kolmogorov et al., 2019), before removing duplicated regions using Purge_dup v 1.2.5 (Guan et al., 2020). Duplicates were also identified and removed based on coverage plots. Error correction with Illumina reads was performed with one iteration of RACON v. 1.4.21 (Vaser et al., 2017) and then Medaka v. 1.5.0 (Nicholls et al., 2019). Assembly quality was assessed at each step in our assembly pipeline using BWA v. 0.7.17 (Heng Li & Durbin, 2009), insecta odb10 BUSCO database v. 5.4.7 (Simao et al., 2015), Merqury v. 1.3 (Rhie et al., 2020) and QUAST v. 5.2 (Gurevich et al., 2013).
Hi‐C reads were mapped to the assembly with BWA using the mem ‐5SPM parameter and filtered using Matlock (Sieber et al., 2019). Filtered reads were used to anchor the assembly using ALLHIC (Zhang et al., 2019) or SALSA2 (Ghurye et al., 2019) alone, running SALSA2 first followed by ALLHIC and vice versa. Clitarchus hookeri has 18 pairs of chromosomes, with the females having an XX sex chromosome set (Morgan‐Richards & Trewick, 2005; Parfitt, 1980) and this was assumed in ALLHIC. Hi‐C signals were calculated using 3D‐DNA (Dudchenko et al., 2017) and plotted using Juicebox v. 2.13.07 (Durand et al., 2016). Mis‐assemblies and incorrect orientation of regions within scaffolds were identified and manually curated using the Hi‐C contact map, followed by another round of assembly and visualization. This process was repeated until the Hi‐C contact map showed no mis‐assemblies within the scaffolds representing 18 chromosomal length, super‐scaffolds. Gaps were filled via three iterations of LR_gapcloser (Xu, Xu, Liu, et al., 2019) using the set of longest ONT reads that comprised 20× coverage. Repeats were identified using RepeatModeler v. 2.0.2 (Flynn et al., 2020) and soft masked with RepeatMasker v. 4.1.0 (Tarailo‐Graovac & Chen, 2009).
To annotate the assembly, de novo assembly of transcripts was performed using the RNAseq reads generated here, as well as those previously published (Wu et al., 2016, 2017), from female reproductive tract, testis, midgut, male terminalia, combined head, thorax and legs and ovariolar tips (SRX3055380, SRX3055387, SRX1512970, SRX1512972, SRX1178845, SRX3562650, SRX3562664). RNAseq libraries were subsampled to the same number of reads per library. The quality of all RNAseq reads was checked with fastQC v. 0.11.9, adaptors trimmed using Trim Galore v. 0.6.4 (www.bioinformatics.babraham.ac.uk/projects/trim_galore/) and erroneous Kmers were filtered out using Rcorrector v. 1.0.4 (Song & Florea, 2015). Transcripts were assembled with rnaSPAdes v. 3.15.3 (Bushmanova et al., 2019). The filtered RNAseq reads, transcript assembly and final draft assembly were passed to Funannotate v. 1.8.9 (Palmer & Stajich, 2019), which was used to train gene models and annotate gene regions and functions.
For functional annotation of the assemblies, protein amino acid sequences of the gene regions were compared with the protein sequences of Drosophila melanogaster from Uniprot Berkeley proteomes UP000000803 (Misra et al., 2002) using BLAST v. 2.12.0 (Altschul et al., 1990). Each gene was assigned to the best BLAST hit from the blastp report using e‐value thresholds <10−5 and bit scores higher than 40.
We assembled the diploid Acanthoxyla nov. sp. 1 and A. horridus genomes using a reference‐based assembly approach from Illumina short‐read data. An initial assembly was constructed using SPAdes v. 3.13.1 (Prjibelski et al., 2020) and quality metrics were obtained through read mapping rates using BWA and statistics generated using Picard v2.21 (broadinstitute.github.io/picard). Redundans v. 1.01 (Pryszcz & Gabaldon, 2016) was run to remove redundant contigs, close gaps and generate more contiguous de novo assemblies. Repeats were identified as above and soft‐masked with RepeatMasker v. 4.1.0 (Tarailo‐Graovac & Chen, 2009). The soft‐masked assemblies were reference assembled to the C. hookeri super‐scaffolds using RaGOO (Alonge et al., 2019). QUAST was used to obtain assembly metrics, and BUSCO (insecta_odb9) to assess gene content at various stages of the assembly pipeline.
MitoZ v. 2.3 (Meng et al., 2019) was used to assemble whole mitochondrial genomes from the Illumina short reads. The resulting whole mitochondrial genomes were aligned using MUSCLE v. 3.8.31 (Edgar, 2004) and a phylogeny constructed using RAxML v. 8.2.12 (Stamatakis, 2014) with the GTR+Γ model and 2000 bootstrap pseudoreplicates.
2.4. Estimating genome size and ploidy
We used flow cytometry to estimate genome size with female migratory locust (Locusta migratoria) (Biosuppliers, New Zealand) as a size standard, assuming a genome size of 6.3 Gbp (Wang et al., 2014). Stick insect samples were used as standards if the L. migratoria peak was too close to the sample peak. We analysed four individuals of A. prasina from the AXP, AXG and AXX lineages (AXX‐WB4, AXG‐F‐AB12, AXP1, AXT1), one A. inermis individual (AXX500), one Acanthoxyla nov. sp. 1 individual (AXW2) and two C. hookeri individuals (CLH‐F‐TP‐10, CLH‐TP‐1). The upper halves of female femurs were chopped with a razor blade in approximately 1 ++mL of ice‐cold Otto I buffer (Dolezel et al., 2007) and incubated for several minutes. The homogenate was filtered through a 20‐μm nylon mesh to remove large particles. The samples were then centrifuged (800 g for 5 min), and the supernatant discarded; then additional Otto I was added, followed by propidium iodide stain, and each sample was mixed, and left on ice in the dark for several minutes. Each sample was combined with the standard and run on a Partec CyFlow Space flow cytometer (Sysmex, Kobe, Japan) using a 488‐nm blue laser and FloMax software (Sysmex, Kobe, Japan). Histogram peaks were gated, with the coefficient of variation noted, and this was generally between 5% and 10%. DNA content calculations were made following Dolezel et al. (2007). We also bioinformatically estimated ploidy levels in A. inermis, A. prasina and C. hookeri. Illumina reads were mapped using BWA and ploidy levels estimated with nQuire (Weiß et al., 2018).
2.5. Analysis of SNPs, allele phasing and phylogenetics
Genomic reads from Acanthoxyla and related taxa were aligned to the 18 super‐scaffolds of the C. hookeri assembly. Chromium 10× reads were subsampled to 30× coverage and aligned using Longranger v. 2.2.2 (Marks et al., 2019). Illumina reads were preprocessed using fastqQC v. 0.11.9 (Andrews, 2010) and filtered with Trimmomatic v. 0.3 (Bolger et al., 2014). Both ONT and Illumina reads were mapped using BWA‐mem, but only Illumina reads were used to call SNPs. All PCR duplicates were filtered using SAMtools v. 1.9 (Li et al., 2009) and diploid and triploid SNPs called using GATK v. 4.2.5.0 (McKenna et al., 2010) separately and subsequently merged into a single VCF file. Using C. hookeri as a reference, population genomic analyses were performed on the called SNPs, including D‐statistics calculated using Dsuite (Malinsky et al., 2021). Because Dsuite is compatible only with diploid SNPs, triploid samples were reformatted in the cohort VCF file by filtering out tri‐allelic sites and representing unique alleles in bi‐allelic sites using the custom perl script ‘trip_dip.pl’. We used the topologies estimated from the whole mitochondrial genomes and the network as the input phylogenies for analysing correlated f b‐ratios.
Only complete single copy BUSCO genes were phased to ensure alignments were composed of only single copy regions. Diploids and triploids were phased using the phase (Patterson et al., 2015) and polyphase (Schrinner et al., 2020) algorithms in WhatsHap v. 1.7 (Martin et al., 2016), respectively. Phase block overlaps were identified using the custom perl script ‘whatshap_overlap_new.pl’. The triploid samples were phased using ONT reads. The diploid species A. inermis, C. hookeri and Acanthoxyla nov. sp. 1 were phased using Chromium 10× reads and all other diploid samples were phased with Illumina short reads. Acanthoxyla inermis, A. prasina and Acanthoxyla nov. sp. 1 were used as the core samples to find the overlapping phase blocks with at least 100 variants to identify the overlapping regions. These overlapping regions were used as references to obtain the corresponding regions from other sample phase blocks. Because there can be many phase blocks overlapping with each other in each sample, phase ID was used to identify the different blocks within regions that were not phased, and these were converted into ambiguity codes during conversion to sequences. Individuals that mapped to <50% of a given phase block were filtered out of that phase block alignment. After sequences were phased for a given overlapping gene block, they were aligned using MUSCLE v. 3.8.31 (Edgar, 2004) and gene trees constructed using RAxML v. 8.2.12 (Stamatakis, 2014) with the GTR+Γ model.
Two phylogenetic networks were inferred from the gene trees using the InferNetwork_MP algorithm from Phylonet v. 3.8.2 (Wen et al., 2018). We split the analysis for computational reasons. To identify hybridization events between Acanthoxyla and Clitarchus, we first set the maximum number of reticulations to 3 following the Dsuite results, the number of runs to 30 and specified A. inermis, A. prasina (AXG) and A. prasina (AXP) as hybrids. To infer the hybrid ancestors of A. prasina (AXX), we specified A. prasina (AXX) as hybrid, set the maximum number of reticulations to 1 and the number of runs to 30. We took the most frequently estimated networks as optimal and visualized them in Dendroscope v. 3.8.8 (Huson & Scornavacca, 2012).
2.6. Estimating the direction and magnitude of homoeologue expression bias
We used the approach of Matos et al. (2019) to obtain SNPs diagnostic of each parental subgenome, or set of homoeologues, to identify the direction of HEB. The SNPs from C. hookeri and A. prasina (AXX) were assumed to represent the parental SNPs for measuring the direction of HEB. The A. prasina (AXX) lineage was inferred to have no detectable history of hybridization with C. hookeri, so these SNPs were assumed to represent the Acanthoxyla ancestor. For the diploid A. inermis, the expected homoeologue ratio was 1:1 while for the triploid A. prasina, the expected ratio was 2:1 for Acanthoxyla to Clitarchus.
First, we used RNAseq reads from C. hookeri, and A. prasina (AXX) to identify SNPs diagnostic for the two parental lineages for each hybrid genome. We considered an SNP to be diagnostic (dSNP) if the given locus had non‐overlapping SNPs between the parental subgenome of C. hookeri and A. prasina (AXX). We then used RNAseq reads from hybrids to estimate the direction and magnitude of HEB at these loci. RNAseq reads from the C. hookeri, A. prasina and A. inermis samples were mapped to C. hookeri super‐scaffolds, and the Acanthoxyla nov. sp. 1 and A. horridus reference‐assembled scaffolds using STAR v. 2.7.10b (Dobin et al., 2013), generating three alignments. We used GATK for SNP calling and only the exonic SNPs were used for estimating HEB. The alignments mapped with two reference assemblies wentthrough another mapping step using WASP (van de Geijn et al., 2015) to filter out reference‐biased RNAseq reads using previously called SNPs. SNPs were recalled after the alignment that went through the same filtering steps as described above. No WASP filtering was done to the A. horridus alignment because it was an outgroup to both Clitarchus and Acanthoxyla (Dunning et al., 2013).
Loci with read depths of <9 were excluded. The allelic expression level for each dSNP in the hybrid genomes was identified using the allele depth (AD) and assigned a proportion of HEB signal to each subgenome, rather than using the raw AD. Those proportions were used to assign the HEB direction, either towards Acanthoxyla or Clitarchus, by calculating the mean proportion per orthologue. If the mean proportion of HEB towards one subgenome was >70%, that orthologue was considered to show HEB towards that subgenome. This was repeated for each alignment of RNAseq reads, using the three reference assemblies. Orthologues that showed the same HEB direction in two of the three assemblies were considered to reflect the biological pattern of HEB and used in downstream analyses. This proportion was selected as a compromise because we considered that requiring significant HEB from all three references genomes would be too conservative, and inferences from only one reference genome to be susceptible to reference bias. Furthermore, there were differences in assembly quality and number of gene annotations between the three references. Wilcoxon rank sum tests were used to assess the significance of differences in the pattern of HEB between lineage pairs. PCA plots were generated from the HEB signal and SNPs called from the RNA read alignments using factoextra v. 1.0.7 (Kassambara & Mundt, 2020). All SNPs were converted to numerical values using vcfR (Knaus & Grunwald, 2017).
Gene Ontology (GO) enrichment analyses were performed on gene sets that showed HEB towards both subgenomes using ShinyGO v. 0.77 (Ge et al., 2020) using background genes that are found in all three reference alignments (Timmons et al., 2015). Enrichment analysis was used to determine the degree to which lineages shared enriched GO terms, expected if repeated evolution has occurred. The sharing of enriched GO terms between lineages was visualized using UpSetR v. 1.4.0 (Conway et al., 2017). Only GO terms that showed significant false discovery rates (FDR <0.05) were included. In order to investigate HEB in genes that are involved in the oxidative phosphorylation, proteasome and ribosome KEGG pathways, the numbers of reads mapped to each gene were counted using Subread v. 2.0.0 (Liao et al., 2013) and differential expression was estimated by calculating the FPKM for each gene per lineage using limma v. 3.17 (Ritchie et al., 2015) and edgeR v. 3.14.0 (Robinson et al., 2010). Heat maps of HEB signal from KEGG pathway genes were generated, calculated by multiplying the FPKM values with the proportion of HEB assigned to a given subgenome using ComplexHeatmap v. 2.14.0 (Gu et al., 2016). Final expression levels were calculated by averaging the expression level from the set of alignments from each Acanthoxyla lineage if they showed the same HEB signal.
3. RESULTS
3.1. De novo assembly and ploidy levels
We generated a high‐quality genome assembly of 2.82 Gbp for C. hookeri using a combination of ONT long‐reads, Illumina short‐reads and Hi‐C sequencing (Table S1). This corresponded to the genome size estimate of 2.59–3.01 Gbp we obtained from flow cytometry (Table 2, Table S2). The genome assembly has high completeness, comprising 18 super‐scaffolds and covering 97.8% complete single copy BUSCO genes (Figure 1). The assembly annotation identified 61,379 protein‐coding genes, 93% of which were located on the 18 super‐scaffolds but had a lower complete single copy BUSCO score of 88.8%. As expected, the genome was highly repetitive, with an estimated 59.26% total repeats (Table 3). Flow cytometry confirmed that all three Acanthoxyla prasina lineages are triploid while C. hookeri and A. inermis are diploid (Table 2, Figure 2c).
TABLE 2.
Estimates of genome size from flow cytometry and ploidy levels from nQuire (Weiß et al., 2018).
| Flow cytometry genome size estimate (Gb) | Diploid ∆logL2n | Triploid ∆logL3n | Tetraploid ∆logL4n | |
|---|---|---|---|---|
| Clitarchus hookeri (CLI525) | 2.59–3.01 | 2,072,593.833 | 14,308,318.42 | 10,871,757 |
| Acanthoxyla inermis (AXX500) | 2.92 | 9,707,004.627 | 12,558,845.88 | 17,896,553 |
| Acanthoxyla prasina (AXG) | 5.11 | 36,052,453.41 | 7,552,616.216 | 48,012,529 |
| A. prasina (AXP) | 6.24–7.02 | 33,995,099.35 | 8,382,648.314 | 48,236,939 |
| A. prasina (AXX) | 5.01 | 26,847,038.44 | 2,256,404.85 | 13,980,131 |
Note: The lowest levels are in bold showing the optimal ploidy level for that sample.
FIGURE 1.

Hi‐C contact map for all scaffolds. The red squares represent the 18 super‐scaffolds.
TABLE 3.
Repetitive element content of the Clitarchus hookeri genome assembly.
| Repeat | Length (base pairs) | Proportion of genome (%) |
|---|---|---|
| DNA transposons | 349,132,509 | 12.38 |
| LINE | 59,340,733 | 2.1 |
| LTR | 174,136,959 | 6.18 |
| SINE | 13,287,707 | 0.47 |
| Simple Repeats | 17,010,636 | 0.6 |
| Others | 52,085,076 | 3.12 |
| Unclassified | 1,005,727,138 | 35.67 |
| Total | 1,670,720,758 | 59.26 |
FIGURE 2.

Gene trees reconstructed from: (a) phase block 13.0 from the serine/threonine‐protein kinase SMG1 gene; (b) phase block 352.0 from the serine proteinase stubble gene. (c) Gene tree estimated from whole mitochondrial genomes. The tips in the mitochondrial gene tree show reproductive mode, inferred ploidy and hybrid origins. Branch lengths for gene trees are drawn proportional to the expected number of substitutions per site following the scale bars. Numbers above branches are maximum likelihood bootstrap percentages where values <50% were omitted. Individual alleles sampled from Acanthoxyla individuals are coloured orange and those sampled from Clitarchus are coloured blue. Codes in parentheses at tip labels refer to individual phased alleles.
3.2. Reconstructing the history of reticulation
Overall, our results suggest multiple hybridization events between Acanthoxyla and Clitarchus and this was supported by the gene trees from phased single copy nuclear genes (Figure 2), D‐statistics (Figure 3) and phylogenetic networks (Figure 4). For the parthenogenetic A. prasina and A. inermis, levels of heterozygosity at variant sites ranged from 13.4% to 30.9%, in comparison to the sexual lineages that ranged from 1.3% to 6.5% (Table S3). We phased 1339 BUSCO genes and 151 phase blocks passed filtering with phase block lengths varying from 594 to 5289 bp (Figure 5). Two representative gene trees are shown in Figure 2a,b, and they show several patterns. First, a clade containing only alleles sampled from Acanthoxyla specimens; second, a clade containing alleles from Acanthoxyla and Clitarchus, and in most cases C. hookeri. Over most gene trees, A. prasina (AXG) and A. prasina (AXP) had two alleles in the Acanthoxyla clade and one allele in the Clitarchus clade. Acanthoxyla inermis almost always had one allele in the Acanthoxyla clade and one allele in the Clitarchus clade. Acanthoxyla prasina (AXX) and Acanthoxyla nov. sp. 1 almost always had all alleles within only the Acanthoxyla clade (Figure 2a,b). The third notable pattern was an absence of allele sharing between Acanthoxyla and all the other sampled species. The mitochondrial genome gene tree shows all Acanthoxyla individuals in a monophyletic group (Figure 2c).
FIGURE 3.
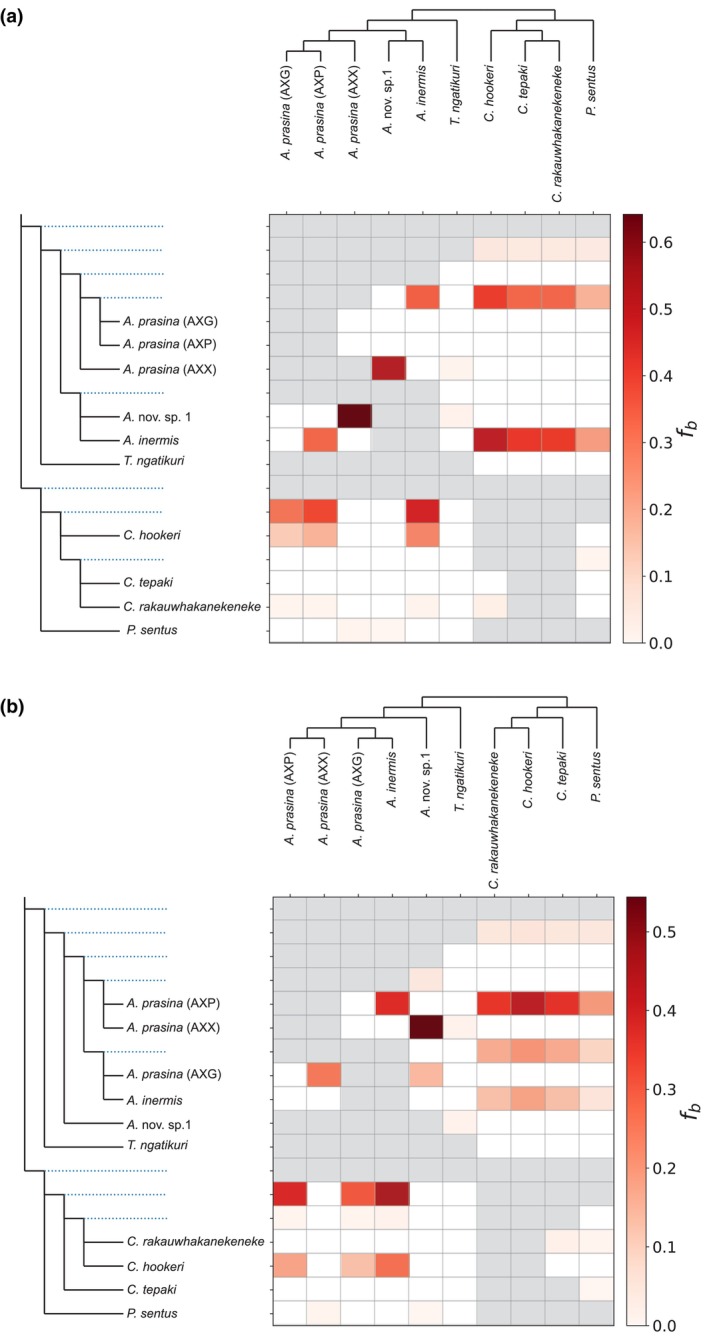
Dsuite plots showing the f b‐ratios calculated using 238,791,482 genome‐wide SNPs. The f b‐ratios are summarized using the topologies from: (a) whole mitochondrial genomes; (b) a network inferred from phased BUSCO gene regions.
FIGURE 4.

Networks reconstructed from gene trees using the InferNetwork_MP method in PhyloNet: (a) constructed assuming Acanthoxyla prasina (AXP), A. prasina (AXG) and A. inermis are hybrid lineages with a maximum of three reticulations; (b) constructed assuming A. prasina (AXX) is a hybrid lineage with a maximum of one reticulation. Acanthoxyla lineages are coloured orange, Clitarchus species are coloured pale blue and hybridization events are in dark blue.
FIGURE 5.

The distribution of phase block lengths (bp) from the 151 regions passing filtering.
To identify the exact number of hybridization events, we used D‐statistics and phylogenetic networks. The D‐statistics calculated from 238,791,482 genome‐wide SNPs showed a strong signal for gene flow between Acanthoxyla and Clitarchus (Figure 3). However, the number of inferred gene flow events depended upon the input topology for summarizing correlated f b‐ratios. Both topologies showed an independent hybridization event involving A. inermis. There is more variation with respect to A. prasina (AXP) and A. prasina (AXG), with support for either a single or two hybridization events involving these two lineages. There was no signal for hybridization between Clitarchus and A. prasina (AXX) or between Clitarchus and Acanthoxyla nov. sp. 1 (Figure 3), allowing us to constrain the network optimization.
The phylogenetic network from three reticulations assuming A. prasina (AXG), A. prasina (AXP) and A. inermis are hybrids, revealed that A. inermis descended from a hybridization event between the C. hookeri and Acanthoxyla nov. sp. 1 branches while both A. prasina (AXP) and A. prasina (AXG) descended from independent hybridization events between the C. hookeri and A. prasina (AXX) branches (Figure 5a). The network estimated with a single reticulation, assuming A. prasina (AXX) is hybrid, showed the Acanthoxyla nov. sp. 1 and A. prasina (AXP) branches as parents of A. prasina (AXX) (Figure 5b).
3.3. Quantifying the direction of homoeologue expression bias
We measured HEB in the four sampled populations of Acanthoxyla, comprising A. inermis (WB), A. inermis (PG), A. prasina (AXG) and A. prasina, (AXP). Phylogenetic analysis reveals the two A. prasina populations (AXG and AXP), and A. inermis are three independent hybrid lineages. However, the two A. inermis populations are from the same hybrid lineage and we were not able to differentiate them using PCA analysis of SNPs (Figure 6a). We refer to all four Acanthoxyla populations as lineages for convenience.
FIGURE 6.

PCA plots: (a) SNP variation from RNAseq data; (b) HEB signal towards the Clitarchus hookeri subgenome. Both analyses were performed using the C. hookeri reference assembly. The HEB PCA plot contains only those lineages for which HEB analysis was performed.
RNAseq reads from the reference species had higher mapping rates to the reference genomes than reads from the non‐reference species (Table S4). Most reads were filtered out by WASP (van de Geijn et al., 2015) indicating strong reference bias. However, when an outgroup, A. horridus, was used as the reference without WASP filtering, the alignments from both Clitarchus and Acanthoxyla showed relatively similar unique mapping rates, consistent with no reference bias. Quantifying the degree of HEB per locus using the allele depth distribution of diagnostic SNPs (dSNPs) revealed different patterns in Acanthoxyla hybrids depending on the reference genome used for aligning RNAseq reads (Figure 7). This pattern was observed in spite of applying WASP (van de Geijn et al., 2015). For example, when the C. hookeri reference was used, A. prasina (AXP) showed a skew in HEB towards the C. hookeri subgenome (Figure 7a), yet when the Acanthoxyla reference was used, HEB was skewed towards the Acanthoxyla subgenome (Figure 7b). Similar patterns were seen in the other Acanthoxyla lineages (Figure S1).
FIGURE 7.

Plots showing the frequency distribution of Clitarchus hookeri alleles in the Acanthoxyla prasina (AXP) transcriptome, which has a history of hybridization with C. hookeri. The allele frequencies are measured using three reference genomes: (a) C. hookeri; (b) Acanthoxyla nov. sp. 1; (c) Argosarchus horridus (c). The red dotted lines represent the threshold for alleles to be inferred showing balanced expression (between the lines) or HEB towards the C. hookeri (right of the right‐hand line) or Acanthoxyla (left of the left‐hand line) subgenomes.
These patterns were consistent when quantifying the number of genes showing HEB towards a subgenome, given a particular reference genome. When the C. hookeri reference was used, Acanthoxyla hybrids exhibited a higher number of HEB genes that favoured C. hookeri; while aligning reads to the Acanthoxyla nov. sp. 1 (Table 4) reference resulted in a higher number of HEB genes that favoured the Acanthoxyla subgenome. However, the A. horridus reference had a higher number of HEB genes inferred as favouring the Acanthoxyla subgenome in all hybrid lineages except in A. inermis (WB) (Table 4).
TABLE 4.
The number of genes inferred to have homoeologous expression bias (HEB) for each hybrid Acanthoxyla lineage and their direction with respect to the Clitarchus and Acanthoxyla subgenomes.
| Reference genome | HEB direction | A. inermis (WB) | A. inermis (PG) | A. prasina (AXP) | A. prasina (AXG) |
|---|---|---|---|---|---|
| C. hookeri | C. hookeri subgenome | 588 | 463 | 447 | 432 |
| Acanthoxyla subgenome | 130 | 233 | 200 | 266 | |
| Balanced | 300 | 335 | 365 | 319 | |
| Acanthoxyla nov. sp. 1 | C. hookeri subgenome | 636 | 455 | 394 | 336 |
| Acanthoxyla subgenome | 728 | 915 | 872 | 993 | |
| Balanced | 567 | 589 | 664 | 547 | |
| A. horridus | C. hookeri subgenome | 1356 | 963 | 578 | 803 |
| Acanthoxyla subgenome | 714 | 1072 | 793 | 1313 | |
| Balanced | 812 | 897 | 517 | 864 | |
| 2/3 reference | C. hookeri subgenome | 577 | 341 | 245 | 273 |
| Acanthoxyla subgenome | 252 | 420 | 381 | 524 |
Note: The number of genes showing HEB and no HEB (balanced) is shown for each reference genome (Clitarchus hookeri, Acanthoxyla nov. sp. 1 and Argosarchus horridus) as well as the number of genes showing HEB for at least two of the three reference genomes. Numbers in bold show the greater number of HEB genes towards a particular subgenome, for a particular reference genome.
Paired Wilcoxon tests revealed that the patterns of HEB gene expression are significantly different (p < .05) among all four lineages (Table S5). However, we observed strong similarity in the number of genes showing significant HEB among the four lineages with 23.1%, 20.8%, 21.8% and 21.6% of genes showing HEB from the A. inermis (WB), A. inermis (PG), A. prasina (AXP) and A. prasina (AXG) lineages, respectively. Overall, there were more genes with HEB towards the Acanthoxyla subgenome for three of the four lineages (Table 4). PCA clustering of HEB signal based on each of the three reference genomes showed a close relationship between the two A. inermis lineages (Figure 7b), with A. prasina (AXG) and A. prasina (AXP) being more distinct. In contrast, a heat map of all HEB genes shows the two A. inermis lineages do not cluster together (Figure 8d). Finally, we assessed the impact of our threshold on designating a gene as showing significant HEB by plotting a frequency distribution of the proportion dSNPs showing HEB in a given direction, across HEB genes. This shows that most genes have highly skewed distributions and are therefore not sensitive to the exact placement of our threshold (Figure S1).
FIGURE 8.

Heatmaps showing the direction and magnitude of HEB in genes from three KEGG pathways: (a) oxidative phosphorylation; (b) ribosome; (c) proteasome; (d) all genes showing a significant HEB signal. A positive value (blue) represents HEB towards the Clitarchus hookeri subgenome while a negative value (red) represents the HEB towards the Acanthoxyla subgenome.
3.4. Enriched functions in genes with homoeologue expression bias
Functional enrichment revealed many significant GO categories (Table S6) and several KEGG pathways (Table 5) overrepresented in the HEB genes and many of these were shared among the four lineages (Figure 9; Figure S3). A total of 80 GO terms were enriched across at least two of the lineages (Figure S3). Many of the significantly enriched GO terms related to mitochondrial and ribosomal functions. The proteasome KEGG pathway was also significantly enriched in three lineages, and proteasome‐related GO categories were also enriched (Figure 8; Figure S3). The fold enrichments showed more GO categories with higher fold enrichment towards Clitarchus than Acanthoxyla subgenomes for the four Acanthoxyla lineages (Figure 9; Figure S3). Acanthoxyla inermis (WB) had the most enriched GO terms among the genes showing HEB towards C. hookeri, followed by A. prasina (AXG), A. prasina (AXP) and A. inermis (PG) (Figure S3). On the other hand, for GO terms enriched in the genes showing HEB towards Acanthoxyla, A. prasina (AXG) showed the most followed by A. inermis (PG), A. prasina (AXP) and A. inermis (WB). A major difference between the two sets of enriched GO terms was that most of the GO terms enriched towards Clitarchus were shared among three or four lineages (Figure 9; Figure S3). However, only a minority of enriched GO terms from the genes showing HEB towards Acanthoxyla were shared among three or four lineages (Figure 9; Figure S3).
TABLE 5.
KEGG pathways enriched for genes showing homoeologous expression bias (HEB) for each hybrid Acanthoxyla lineage.
| Population | Direction of HEB | Enrichment FDR | Number of HEB genes | Number of genes in pathway | Fold enrichment | Pathway |
|---|---|---|---|---|---|---|
| A. inermis (WB) | C. hookeri | 7.55E‐05 | 17 | 145 | 3.9 | Oxidative phosphorylation |
| C. hookeri | 0.003221 | 8 | 52 | 5.2 | Proteasome | |
| A. inermis (PG) | C. hookeri | 0.019525 | 10 | 145 | 3.7 | Oxidative phosphorylation |
| C. hookeri | 0.019525 | 44 | 1153 | 1.6 | Metabolic pathways | |
| C. hookeri | 0.019525 | 9 | 118 | 3.6 | Lysosome | |
| Acanthoxyla | 0.004936 | 56 | 1153 | 1.7 | Metabolic pathways | |
| Acanthoxyla | 0.03287 | 6 | 52 | 5.2 | Proteasome | |
| Acanthoxyla | 0.039539 | 10 | 121 | 3.1 | Carbon metabolism | |
| A. prasina (AXP) | C. hookeri | 0.006399 | 9 | 133 | 4.8 | Ribosome |
| C. hookeri | 0.015659 | 9 | 133 | 3.9 | Protein processing in endoplasmic reticulum | |
| C. hookeri | 0.02021 | 5 | 50 | 6.5 | Pentose and glucuronate interconversions | |
| C. hookeri | 0.024977 | 5 | 42 | 5.9 | Glycerolipid metabolism | |
| Acanthoxyla | 0.00364 | 7 | 52 | 6.8 | Proteasome | |
| Acanthoxyla | 0.017214 | 10 | 145 | 3.4 | Oxidative phosphorylation | |
| Acanthoxyla | 0.017214 | 48 | 1153 | 1.6 | Metabolic pathways | |
| A. prasina (AXG) | C. hookeri | 5.45E‐05 | 12 | 145 | 5.8 | Oxidative phosphorylation |
| C. hookeri | 0.004742 | 38 | 1153 | 1.8 | Metabolic pathways | |
| C. hookeri | 0.004742 | 9 | 133 | 4.3 | Ribosome | |
| Acanthoxyla | 0.017697 | 7 | 33 | 5.3 | Fatty acid degradation |
Note: HEB was quantified using three reference genomes: Clitarchus hookeri, Acanthoxyla nov. sp. 1 and Argosarchus horridus. Pathways with fewer than five HEB genes are excluded.
FIGURE 9.

UpSet plots showing the sharing of enriched GO categories among Acanthoxyla lineages: (a) GO categories enriched towards the Clitarchus hookeri subgenome; (b) towards the Acanthoxyla subgenome. The set size refers to number of enriched GO categories for each lineage and the intersection size is the number of enriched GO categories shared among lineages.
The mitochondrial GO term (GO:0005739) was frequently enriched and 40.0%, 56.7%, 57.0% and 63.7% of mitochondrial HEB genes were biased towards the maternal, Acanthoxyla subgenome for A. inermis (WB), A. inermis (PG), A. prasina (AXP) and A. prasina (AXG) lineages, respectively. The oxidative phosphorylation term had more genes showing HEB towards Clitarchus for A. inermis (WB) and A. inermis (WB) 62.0% and 53.0%, respectively. However, A. prasina (AXP) and A. prasina (AXG) had more genes with HEB towards Acanthoxyla, at 58.5% and 63.2%, respectively. There were three KEGG pathways enriched in more than one lineage, with oxidative phosphorylation being enriched in all lineages, albeit not always towards the same subgenome (Table 5).
We used heat maps and hierarchical clustering to examine the similarity of HEB direction and magnitude among lineages for proteasome (KEGG: dme03050), oxidative phosphorylation (KEGG: dme00190) and ribosome (KEGG: dme03008), and all genes showing HEB (Figure 8). For these KEGG pathways and the mitochondrion GO term, there were different clustering patterns among the four lineages (Figure 8). Notably, the lineages did not cluster as expected by phylogeny with the two A. inermis populations grouping together for only the Ribosome KEGG pathway.
4. DISCUSSION
We inferred multiple, independent hybridization events between Acanthoxyla and C. hookeri using a combination of SNP‐based and phylogenetic methods. Identifying these independent hybrid lineages allowed us to confirm that HEB is a significant feature of gene expression in hybrid Acanthoxyla genomes and that these lineages are showing repeated evolution of HEB patterns. The overall direction of HEB was towards the Acanthoxyla subgenome in three of the four lineages; however, many genes showed HEB towards the C. hookeri subgenome across lineages. Functions associated with the mitochondrion, ribosome and proteostasis were enriched in the HEB genes. Contrary to our expectations, we inferred only weak support for mitonuclear incompatibility driving HEB in genes involved in mitochondrial function. Reference bias was a pervasive issue that was not well corrected for by an existing bioinformatic tool.
4.1. High quality genome assembly from C. hookeri
Using a combination of ONT long reads, Illumina short reads and Hi‐C scaffolding, we were able to assemble the C. hookeri genome with a high degree of contiguity, completeness and accuracy (Thrash et al., 2020). Our long read assembly is a significant advance over a previous short‐read assembly of C. hookeri (Wu et al., 2017) and is of comparable quality to that of the stick insects Dryococelus australis (Stuart et al., 2023), and Bacillus rossius redtenbacheri (Lavanchy et al., 2024), both assembled from PacBio long reads and Hi‐C, as well as Timema crisinae (Nosil et al., 2018). While our assembly contained a very high proportion of single copy and complete BUSCO genes, this value was lower in the set of annotated proteins, suggesting the need for further improvement of the annotation.
4.2. Repeated hybridization events between Acanthoxyla and C. hookeri
Both the phylogenetic network inferred from phased alleles and D‐statistics calculated from SNPs revealed independent hybridization events between C. hookeri and Acanthoxyla lineages that gave rise to the A. prasina and A. inermis lineages we sampled. All individuals of Acanthoxyla possess mitochondrial genomes that form a monophyletic group, supporting previous findings that the inter‐generic hybridization events were between Clitarchus males and Acanthoxyla females (Buckley et al., 2008; Morgan‐Richards & Trewick, 2005). The network analysis demonstrated that A. inermis arose from hybridization between C. hookeri and the lineage leading to Acanthoxyla nov. sp. 1. The network analysis showed that A. prasina (AXP) and A. prasina (AXG) both arose from hybridization between C. hookeri and the A. prasina (AXX) lineage. However, these two A. prasina lineages clearly resulted from independent hybridization events, because A. prasina (AXP) and A. prasina (AXG) have highly distinctive mitochondrial DNA genomes, demonstrating different maternal parents. Interestingly, the lineage leading to the sexually reproducing to Acanthoxyla nov. sp. 1 appears to be only involved in the hybrid origins of A. inermis and A. prasina (AXX) and not any of the other sampled parthenogenetic Acanthoxyla lineages.
The D‐statistics and phylogenetic networks were not consistent with one another in terms of the number of hybridization events involving A. prasina. The D‐statistics indicated a substantial number of gene flow events between Clitarchus species and Acanthoxyla lineages. The number of gene flow events and the branches involved differed depending on the input topology used to summarize the correlated f b‐ratios. There is a potential bias resulting from using a single input tree to summarize correlated f b‐ratios. As noted by the Dsuite authors, summarizing these ratios on a topology is best considered as a way of formulating hypotheses for testing using more rigorous methods (Malinsky et al., 2021). Here, we used Dsuite to restrict the parameter space in the phylogenetic network reconstruction, a computationally demanding procedure (Wen et al., 2018). For example, the D‐statistics indicated no support for gene flow between Acanthoxyla nov. sp. 1 and Clitarchus nor between A. prasina (AXX) and Clitarchus. We therefore excluded these two Acanthoxyla lineages as having had a history of hybridization with Clitarchus when estimating the topological position of network connections.
The phylogenetic network supported C. hookeri as the only Clitarchus species involved in hybridization with Acanthoxyla. In contrast, Dsuite indicated that all Clitarchus species and some ancestral Clitarchus branches have a history of hybridization, but importantly the f b proportions are highest for C. hookeri. Furthermore, the network also supported three independent hybridization events between C. hookeri and three lineages of Acanthoxyla we studied. While this pattern is also shown in the f b matrix, the matrix also shows gene flow between the two obligate parthenogens A. inermis and A. prasina (AXP), which was not observed in the phylogenetic network. This likely misleading signal from the f b values might be because this method infers gene flow from f b‐ratios. The f b‐ratio only detects the presence of alleles in each lineage compared to another two lineages (the trio). If A. inermis and A. prasina hybridized with the same population of C. hookeri or with genetically very similar populations, similar C. hookeri alleles would be present in both these Acanthoxyla lineages. This sharing of alleles could lead to erroneous support for gene flow. However, with phasing information, the phased alleles are treated independently. This allows more precise and accurate inference of the history of hybridization using a phylogenetic network.
We only included bi‐allelic SNPs in the calculation of D‐statistics because the current implementation is only for diploids. This filtering is not likely to have had a significant impact on the inferences because only 0.374% of the SNPs were tri‐allelic. However, obtaining phased allelic sequences is demanding in terms of data. We required two runs on an ONT MinION device for each Acanthoxyla individual, in addition to the moderate coverage Illumina data (30×–50×) used to call SNPs. With these relatively low coverage ONT data (5×–10×), we were able to obtain phased alignments of several kbp across multiple triploid individuals. This allowed us to reconstruct relatively well‐supported gene trees, which in turn allowed us to reconstruct the phylogenetic network.
4.3. Repeated evolution of homoeologue expression bias patterns in hybrid Acanthoxyla stick insects
We inferred homoeologue expression bias for a similar proportion of genes (20%–23%) across all four Acanthoxyla lineages, demonstrating repeated evolution in the proportion of the genome using HEB as a response to the challenge of hybridization. Furthermore, these proportions are comparable to those observed in studies of several hybrid parthenogenetic vertebrates, for example, 27.5% in allopolyploid Ambystoma salamanders (McElroy et al., 2017), 18% in the triploid fish Oryzias latipes (Garcia et al., 2014), up to 43% in the allotetraploid common carp (Cyprinus carpio) depending on the tissue (Xu, Xu, Zhu, et al., 2019) and 32% in diploid and triploid Squalias alburnoides hybrid fish (Matos et al., 2019). However, such comparisons are lacking for hybrid parthenogenetic invertebrates. Our study therefore contributes to the emerging picture that HEB is a significant feature of hybrid, polyploid, parthenogenetic animal genomes, much like in plants (Bird et al., 2018).
The enrichment analyses showed a high degree of repeated evolution in the functions that were overrepresented in the HEB genes. We consider this pattern to be repeated evolution rather than parallel or convergent evolution because we lack information on the ancestral phenotypes (Cerca, 2023). Many of the same GO terms and several KEGG pathways were enriched in the HEB genes from all Acanthoxyla lineages. While there was variation in enriched GO terms and KEGG pathways from different lineages in the HEB genes, mitochondrial and ribosome functions dominated these lists. Interestingly, most of the enriched GO terms showing HEB towards the Clitarchus subgenome were shared among most hybrid Acanthoxyla lineages. However, for genes showing HEB towards the maternal Acanthoxyla subgenome, there was less sharing of enriched GO categories among lineages. This suggests there might be different evolutionary constraints acting on the two subgenomes. We note that these hybridization events have involved a single paternal ancestor, C. hookeri, hybridizing with different, yet related, Acanthoxyla maternal lineages. This variation among maternal lineages might be responsible for this pattern. Testing these hypotheses will require knowledge of the mechanisms underpinning HEB in these genomes (Bird et al., 2018; Runemark et al., 2024). Collectively, these results support the hypothesis that there are significant constraints on the hybrid Acanthoxyla genomes inherited from the parental genomes and there is a strong degree of predictability in the direction and magnitude of HEB and the genomic functions involved (Bird et al., 2021).
4.4. Pathways involved in homoeologue expression bias and their possible function in hybrid genomes
Many functions and pathways related to the mitochondrion and ribosome function were enriched in the genes showing HEB. Mitochondria and ribosomes are both associated with protein complexes with numerous co‐evolutionary interactions, and they have been found to exhibit HEB in other hybrid, parthenogenetic animals (Edger et al., 2017; Matos et al., 2019; Nomaguchi et al., 2018). This pattern is likely driven by co‐adaptive constraints imposed on these interacting protein complexes (Matos et al., 2019; Sloan et al., 2023). Proteasome‐related functions were also frequently enriched in Acanthoxyla. The proteasome is a large protein complex and the occurrence of HEB in this function is consistent with the proteasome containing many interacting, co‐adapted proteins (Tanaka, 2009). The proteasome plays a key role in maintaining proteostasis by degrading unwanted, damaged or misfolded proteins (Tanaka, 2009). The efficient removal of misfolded proteins is a critical function, as their accumulation can cause cell death (Bence et al., 2001; Bucciantini et al., 2002). Hybrid genomes merge alleles from different genetic backgrounds, in some cases forming mis‐adapted proteins (Bamberger et al., 2018; Dandage et al., 2021; Swamy et al., 2022). Misregulation of transcription in hybrids can also disrupt the balance of protein complex subunits (Swamy et al., 2022). The repeated occurrence of the proteasome enrichment suggests there may be strong selection on the proteasome to maintain proteostasis and prevent hybrid breakdown in Acanthoxyla. Proteasomal proteins have also been found at high levels in Drosophila hybrids and attributed to increased cellular stress due to chimeric proteins (Bamberger et al., 2018). Furthermore, proteasome upregulation was shown to function in maintaining proteostasis in Saccharomyces hybrids (Swamy et al., 2022). We also noted the presence of other functions enriched in the HEB genes that ensure proteostasis, including translation, degradation and endoplasmic reticulum pathways.
4.5. The role of mitonuclear incompatibility in homoeologue expression bias
All sampled Acanthoxyla individuals express mitochondrial genes inherited from Acanthoxyla ancestors, rather than C. hookeri (Buckley et al., 2008; Morgan‐Richards & Trewick, 2005; Myers et al., 2013). We therefore predicted that the overall direction of HEB in these hybrid lineages would be towards the maternal, Acanthoxyla, subgenome in genes involved in mitochondrial function. This was indeed the case for three of the four Acanthoxyla lineages, where more genes related to mitochondrial function showed HEB towards the Acanthoxya subgenome than for the C. hookeri subgenome. However, this effect was weak and not consistent across all mitochondrial pathways, and many genes did show HEB towards the C. hookeri subgenome. The oxidative phosphorylation pathway has numerous proteins that are encoded in both the nucleus and mitochondrion and that interact with one another. This pathway has been implicated in mitonuclear incompatibilities in other taxa (Blier et al., 2001; Ellison & Burton, 2006). Here, we see more genes exhibiting HEB towards the Acanthoxya subgenome in the two A. prasina lineages, but slightly more genes with HEB towards the C. hookeri subgenome in the two A. inermis populations. Given that not all oxidative phosphorylation genes exhibit HEB in the same direction and since HEB genes are dispersed throughout several mitochondrial pathways, it is likely that a wide variety of selective factors regulate HEB in mitochondrial proteins. Nevertheless, the overall majority of HEB genes towards the maternal Acanthoxyla lineage indicates mitonuclear incompatibility is likely a significant selective force and a similar observation was made in allopolyploid S. alburnoides fish (Matos et al., 2019).
4.6. Reference bias and homoeologue expression bias
It is well known that the use of reference genomes for mapping transcriptomic reads with different degrees of relatedness to the reference genome can lead to reference bias (Degner et al., 2009; Matos et al., 2019; Salavati et al., 2019). Despite using WASP (van de Geijn et al., 2015), our results show that reference bias remained in the gene expression results with the direction of HEB inferred towards the reference genome. Given that a commonly used bioinformatic approach did not remove this bias, we took two further steps for assessing the magnitude and direction of HEB. First, we used a reference genome from an outgroup species. However, using a reference genome from a distantly related species has its own drawbacks, as reads may not map well due to mismatches with the reference and this can also introduce additional and different biases (Bohling, 2020; Deng et al., 2022; Thorburn et al., 2023; Valiente‐Mullor et al., 2021). Second, we adopted a conservative approach, considering a gene to exhibit HEB only if it was significant when analysed with at least two of the three reference genomes. One feature of our study is that we were studying intergeneric hybridization events and the heterozygosity levels are consequently high in the hybrid genomes. We might therefore expect reference bias in our study to be more pronounced than studies investigating hybridization between more closely related lineages. In these cases, bioinformatic corrections (van de Geijn et al., 2015) may well be more effective. However, we recommend caution when interpreting HEB results when a reference genome from only one of the parental species is at hand. Ideally, results should be validated either on reference genomes from both parents, or with an outgroup as we have done here.
5. CONCLUSION
Our study demonstrates that HEB is a significant factor in the function of an allopolyploid invertebrate genome, as has long been known in plants and several vertebrates. Our study also demonstrates repeated evolution in the direction and magnitude of HEB—and the genomic functions most strongly affected. This finding supports the hypothesis that characteristics of parental genomes play a major role in constraining the evolution of HEB.
AUTHOR CONTRIBUTIONS
Seung‐Sub Choi and Thomas Buckley designed the study. Thomas Buckley collected some of the specimens. Laboratory work was performed by Duckchul Park, Talia Brav‐Cubitt, Hester Roberts and Caroline Mitchell. Analyses were performed by Seung‐Sub Choi, Ann McCartney, Duckchul Park and Thomas Buckley. Seung‐Sub Choi and Thomas Buckley wrote the manuscript with input and approval from all other authors.
CONFLICT OF INTEREST STATEMENT
The authors declare no conflict of interest.
BENEFIT SHARING STATEMENT
All specimens were collected and analysed with consent from local Māori communities. The research findings presented here have been reported back to those communities before submission for publication.
Supporting information
Appendix S1.
ACKNOWLEDGEMENTS
We acknowledge the following Māori iwi for granting consent to sample stick insects: Ngāti Kuri, Ngātiwai, Ngāti Whatua o Kaipara, Ngāti Rangi, Te Rūnanga o Toa Rangatira Inc. and Waihōpai Rūnanga. Collecting permits were issued by the Department of Conservation (NO‐23262‐FAU, 48002‐FAU, NO‐21112013‐LND, DOCDM‐49526, CA‐31615‐OTH), Wellington City Council and Auckland Council (BC4760, LOA17718). RNA extractions were performed by Kate Augustine. We thank Dave Seldon, Richard Leschen, Shelley Langton‐Myers, Tony Jewell, Kate Augustine and Claudio Cubillos for collection assistance. We acknowledge the support of Dinindu Senanayake and NeSI for high‐performance computing. Comments on this manuscript and the preceding thesis were received from Alexander Mikheyev, Murray Cox, Austen Ganley, Gemma Collins, Tithi Gandhi, Natalie Forsdick, Helen OʼLeary and Darren Parker. Samridhi Chaturvedi and two anonymous reviewers provided comments that improved the manuscript. Thanks to Cissy Pan for help with graphics. This research was funded by the Royal Society of New Zealand Marsden Fund (LCR1701 and 21‐LCR‐001) and Genomics Aotearoa. Open access publishing facilitated by Landcare Research New Zealand, as part of the Wiley ‐ Landcare Research New Zealand agreement via the Council of Australian University Librarians.
Choi, S.‐S. , Mc Cartney, A. , Park, D. , Roberts, H. , Brav‐Cubitt, T. , Mitchell, C. , & Buckley, T. R. (2025). Multiple hybridization events and repeated evolution of homoeologue expression bias in parthenogenetic, polyploid New Zealand stick insects. Molecular Ecology, 34, e17422. 10.1111/mec.17422
Handling Editor: Samridhi Chaturvedi
DATA AVAILABILITY STATEMENT
All DNA and RNA sequence data, including raw reads, assembled contigs and scaffolds, annotations, SNPs and phased alignments have been deposited in, the Manaaki Whenua – Landcare Research Datastore (https://doi.org/10.7931/f0aw‐tn35) and/or NCBI Nucleotide Database (Bioproject: PRJNA1092727, accession numbers: SRX24386631–SRX24386635, SRX24388240, SRX24388283–SRX24388285, SRX24404082, SRX24404084–SRX24404089, SRX24404108–SRX24404116, SRX24404349, SRX24410872–SRX24410886, SRX24411562–SRX24411564, SRX24416839, SRX24417128, SRX24422658, JBDJKJ000000000). Following requests from some Māori iwi to exercise Indigenous data sovereignty rights, some data are available following request via the Manaaki Whenua—Landcare Research Datastore. All custom scripts can be accessed on GitHub (https://github.com/sstwins21/2023).
REFERENCES
- Adams, K. L. , Cronn, R. , Percifield, R. , & Wendel, J. F. (2003). Genes duplicated by polyploidy show unequal contributions to the transcriptome and organ‐specific reciprocal silencing. Proceedings of the National Academy of Sciences of the United States of America, 100(8), 4649–4654. 10.1073/pnas.0630618100 [DOI] [PMC free article] [PubMed] [Google Scholar]
- Alonge, M. , Soyk, S. , Ramakrishnan, S. , Wang, X. , Goodwin, S. , Sedlazeck, F. J. , Lippman, Z. B. , & Schatz, M. C. (2019). RaGOO: Fast and accurate reference‐guided scaffolding of draft genomes. Genome Biology, 20, 224. 10.1186/s13059-019-1829-6 [DOI] [PMC free article] [PubMed] [Google Scholar]
- Altschul, S. F. , Gish, W. , Miller, W. , Myers, E. W. , & Lipman, D. J. (1990). Basic local alignment search tool. Journal of Molecular Biology, 215(3), 403–410. 10.1016/s0022-2836(05)80360-2 [DOI] [PubMed] [Google Scholar]
- Andrews, S. (2010). FastQC: A quality control tool for high throughput sequence data . http://www.bioinformatics.babraham.ac.uk/projects/fastqc/
- Bamberger, C. , Martinez‐Bartolome, S. , Montgomery, M. , Lavallee‐Adam, M. , & Yates, J. R. (2018). Increased proteomic complexity in drosophila hybrids during development. Science . Advances, 4(2), eaao3424. 10.1126/sciadv.aao3424 [DOI] [PMC free article] [PubMed] [Google Scholar]
- Bartoš, O. , Röslein, J. , Kotusz, J. , Paces, J. , Pekárik, L. , Petrtýl, M. , Halačka, K. , Štefková Kašparová, E. , Mendel, J. , Boroń, A. , Juchno, D. , Leska, A. , Jablonska, O. , Benes, V. , Šídová, M. , & Janko, K. (2019). The legacy of sexual ancestors in phenotypic variability, gene expression, and homoeolog regulation of asexual hybrids and polyploids. Molecular Biology and Evolution, 36(9), 1902–1920. 10.1093/molbev/msz114 [DOI] [PMC free article] [PubMed] [Google Scholar]
- Bence, N. F. , Sampat, R. M. , & Kopito, R. R. (2001). Impairment of the ubiquitin‐proteasome system by protein aggregation. Science, 292(5521), 1552–1555. 10.1126/science.292.5521.1552 [DOI] [PubMed] [Google Scholar]
- Bird, K. A. , Niederhuth, C. E. , Ou, S. , Gehan, M. , Pires, J. C. , Xiong, Z. , VanBuren, R. , & Edger, P. P. (2021). Replaying the evolutionary tape to investigate subgenome dominance in allopolyploid Brassica napus . New Phytologist, 230(1), 354–371. 10.1111/nph.17137 [DOI] [PMC free article] [PubMed] [Google Scholar]
- Bird, K. A. , VanBuren, R. , Puzey, J. R. , & Edger, P. P. (2018). The causes and consequences of subgenome dominance in hybrids and recent polyploids. New Phytologist, 220(1), 87–93. 10.1111/nph.15256 [DOI] [PubMed] [Google Scholar]
- Birky, C. W. (1996). Heterozygosity, heteromorphy, and phylogenetic trees in asexual eukaryotes. Genetics, 144(1), 427–437. [DOI] [PMC free article] [PubMed] [Google Scholar]
- Blier, P. U. , Dufresne, F. , & Burton, R. S. (2001). Natural selection and the evolution of mtDNA‐encoded peptides: Evidence for intergenomic co‐adaptation. Trends in Genetics, 17(7), 400–406. 10.1016/S0168-9525(01)02338-1 [DOI] [PubMed] [Google Scholar]
- Boatwright, J. L. , Yeh, C. T. , Hu, H. C. , Susanna, A. , Soltis, D. E. , Soltis, P. S. , Schnable, P. S. , & Barbazuk, W. B. (2021). Trajectories of Homoeolog‐specific expression in Allotetraploid Tragopogon castellanus populations of independent origins. Frontiers in Plant Science, 12, 679047. 10.3389/fpls.2021.679047 [DOI] [PMC free article] [PubMed] [Google Scholar]
- Bohling, J. (2020). Evaluating the effect of reference genome divergence on the analysis of empirical RADseq datasets. Ecology and Evolution, 10(14), 7585–7601. 10.1002/ece3.6483 [DOI] [PMC free article] [PubMed] [Google Scholar]
- Bolger, A. M. , Lohse, M. , & Usadel, B. (2014). Trimmomatic: A flexible trimmer for Illumina sequence data. Bioinformatics, 30(15), 2114–2120. 10.1093/bioinformatics/btu170 [DOI] [PMC free article] [PubMed] [Google Scholar]
- Brock, P. D. , Lee, M. , Morgan‐Richards, M. , & Trewick, S. A. (2018). Missing stickman found: The first male of the parthenogenetic phasmid genus Acanthoxyla Uvarov, 1944 discovered in the United Kingdom. Atropos, 60, 16–23. [Google Scholar]
- Bucciantini, M. , Giannoni, E. , Chiti, F. , Baroni, F. , Formigli, L. , Zurdo, J. , Taddei, N. , Ramponi, G. , Dobson, C. M. , & Stefani, M. (2002). Inherent toxicity of aggregates implies a common mechanism for protein misfolding diseases. Nature, 416(6880), 507–511. 10.1038/416507a [DOI] [PubMed] [Google Scholar]
- Buckley, T. R. , Attanayake, D. , Park, D. , Ravindran, S. , Jewell, T. R. , & Normark, B. B. (2008). Investigating hybridization in the parthenogenetic New Zealand stick insect Acanthoxyla (Phasmatodea) using single‐copy nuclear loci. Molecular Phylogenetics and Evolution, 48(1), 335–349. 10.1016/j.ympev.2008.02.016 [DOI] [PubMed] [Google Scholar]
- Buckley, T. R. , & Bradler, S. (2010). Tepakiphasma ngatikuri, a new genus and species of stick insect (Phasmatodea) from the far north of New Zealand. New Zealand Entomologist, 33, 118–126. 10.1080/00779962.2010.9722200 [DOI] [Google Scholar]
- Buckley, T. R. , Myers, S. S. , & Bradler, S. (2014). Revision of the stick insect genus Clitarchus Stal (Phasmatodea: Phasmatidae): New synonymies and two new species from northern New Zealand. Zootaxa, 3900(4), 451–482. 10.11646/zootaxa.3900.4.1 [DOI] [PubMed] [Google Scholar]
- Bullini, L. (1994). Origin and evolution of animal hybrid species. Trends in Ecology & Evolution, 9(11), 422–426. 10.1016/0169-5347(94)90124-4 [DOI] [PubMed] [Google Scholar]
- Bushmanova, E. , Antipov, D. , Lapidus, A. , & Prjibelski, A. D. (2019). rnaSPAdes: A de novo transcriptome assembler and its application to RNA‐Seq data. GigaScience, 8(9), giz100. 10.1093/gigascience/giz100 [DOI] [PMC free article] [PubMed] [Google Scholar]
- Calvo, S. E. , & Mootha, V. K. (2010). The mitochondrial proteome and human disease. Annual Review of Genomics and Human Genetics, 11, 25–44. 10.1146/annurev-genom-082509-141720 [DOI] [PMC free article] [PubMed] [Google Scholar]
- Cerca, J. (2023). Understanding natural selection and similarity: Convergent, parallel and repeated evolution. Molecular Ecology, 32, 5451–5462. 10.1111/mec.17132 [DOI] [PubMed] [Google Scholar]
- Conway, J. R. , Lex, A. , & Gehlenborg, N. (2017). UpSetR: An R package for the visualization of intersecting sets and their properties. Bioinformatics, 33(18), 2938–2940. 10.1093/bioinformatics/btx364 [DOI] [PMC free article] [PubMed] [Google Scholar]
- Dai, D. , Xie, C. , Zhou, Y. , Bo, D. , Zhang, S. , Mao, S. , Liao, Y. , Cui, S. , Zhu, Z. , Wang, X. , Li, F. , Peng, D. , Zheng, J. , & Sun, M. (2023). Unzipped chromosome‐level genomes reveal allopolyploid nematode origin pattern as unreduced gamete hybridization. Nature Communications, 14, 7156. 10.1038/s41467-023-42700-w [DOI] [PMC free article] [PubMed] [Google Scholar]
- Dandage, R. , Berger, C. M. , Gagnon‐Arsenault, I. , Moon, K. M. , Stacey, R. G. , Foster, L. J. , & Landry, C. R. (2021). Frequent assembly of chimeric complexes in the protein interaction network of an interspecies yeast hybrid. Molecular Biology and Evolution, 38(4), 1384–1401. 10.1093/molbev/msaa298 [DOI] [PMC free article] [PubMed] [Google Scholar]
- Degner, J. F. , Marioni, J. C. , Pai, A. A. , Pickrell, J. K. , Nkadori, E. , Gilad, Y. , & Pritchard, J. K. (2009). Effect of read‐mapping biases on detecting allele‐specific expression from RNA‐sequencing data. Bioinformatics, 25(24), 3207–3212. 10.1093/bioinformatics/btp579 [DOI] [PMC free article] [PubMed] [Google Scholar]
- Deng, X. L. , Frandsen, P. B. , Dikow, R. B. , Favre, A. , Shah, D. N. , Shah, R. D. T. , Schneider, J. V. , Heckenhauer, J. , & Pauls, S. U. (2022). The impact of sequencing depth and relatedness of the reference genome in population genomic studies: A case study with two caddisfly species (Trichoptera, Rhyacophilidae, Himalopsyche). Ecology and Evolution, 12, e9583. 10.1002/ece3.9583 [DOI] [PMC free article] [PubMed] [Google Scholar]
- Dobin, A. , Davis, C. A. , Schlesinger, F. , Drenkow, J. , Zaleski, C. , Jha, S. , Batut, P. , Chaisson, M. , & Gingeras, T. R. (2013). STAR: Ultrafast universal RNA‐seq aligner. Bioinformatics, 29(1), 15–21. 10.1093/bioinformatics/bts635 [DOI] [PMC free article] [PubMed] [Google Scholar]
- Dolezel, J. , Greilhuber, J. , & Suda, J. (2007). Estimation of nuclear DNA content in plants using flow cytometry. Nature Protocols, 2(9), 2233–2244. 10.1038/nprot.2007.310 [DOI] [PubMed] [Google Scholar]
- Du, S. N. N. , Khajali, F. , Dawson, N. J. , & Scott, G. R. (2017). Hybridization increases mitochondrial production of reactive oxygen species in sunfish. Evolution, 71(6), 1643–1652. [DOI] [PubMed] [Google Scholar]
- Dudchenko, O. , Batra, S. S. , Omer, A. D. , Nyquist, S. K. , Hoeger, M. , Durand, N. C. , Shamim, M. S. , Machol, I. , Lander, E. S. , Aiden, A. P. , & Aiden, E. L. (2017). De novo assembly of the Aedes aegypti genome using Hi‐C yields chromosome‐length scaffolds. Science, 356(6333), 92–95. 10.1126/science.aal3327 [DOI] [PMC free article] [PubMed] [Google Scholar]
- Dunning, L. T. , Dennis, A. B. , Thomson, G. , Sinclair, B. J. , Newcomb, R. D. , & Buckley, T. R. (2013). Positive selection in glycolysis among Australasian stick insects. BMC Evolutionary Biology, 13, 215. 10.1186/1471-2148-13-215 [DOI] [PMC free article] [PubMed] [Google Scholar]
- Durand, N. C. , Robinson, J. T. , Shamim, M. S. , Machol, I. , Mesirov, J. P. , Lander, E. S. , & Aiden, E. L. (2016). Juicebox provides a visualization system for Hi‐C contact maps with unlimited zoom. Cell Systems, 3(1), 99–101. 10.1016/j.cels.2015.07.012 [DOI] [PMC free article] [PubMed] [Google Scholar]
- Edgar, R. C. (2004). MUSCLE: A multiple sequence alignment method with reduced time and space complexity. BMC Bioinformatics, 5(1), 113. 10.1186/1471-2105-5-113 [DOI] [PMC free article] [PubMed] [Google Scholar]
- Edger, P. P. , Smith, R. , McKain, M. R. , Cooley, A. M. , Vallejo‐Marin, M. , Yuan, Y. , Bewick, A. J. , Ji, L. , Platts, A. E. , Bowman, M. J. , Childs, K. L. , Washburn, J. D. , Schmitz, R. J. , Smith, G. D. , Pires, J. C. , & Puzey, J. R. (2017). Subgenome dominance in an interspecific hybrid, synthetic allopolyploid, and a 140‐year‐old naturally established neo‐allopolyploid monkeyflower. The Plant Cell, 29(9), 2150–2167. 10.1105/tpc.17.00010 [DOI] [PMC free article] [PubMed] [Google Scholar]
- Ellison, C. K. , & Burton, R. S. (2006). Disruption of mitochondrial function in interpopulation hybrids of Tigriopus californicus . Evolution, 60(7), 1382–1391. 10.1554/06-210.1 [DOI] [PubMed] [Google Scholar]
- Flynn, J. M. , Hubley, R. , Goubert, C. , Rosen, J. , Clark, A. G. , Feschotte, C. , & Smit, A. F. (2020). RepeatModeler2 for automated genomic discovery of transposable element families. Proceedings of the National Academy of Sciences of the United States of America, 117(17), 9451–9457. 10.1073/pnas.1921046117 [DOI] [PMC free article] [PubMed] [Google Scholar]
- Garcia, T. I. , Matos, I. , Shen, Y. , Pabuwal, V. , Coelho, M. M. , Wakamatsu, Y. , Schartl, M. , & Walter, R. B. (2014). Novel method for analysis of allele specific expression in triploid Oryzias latipes reveals consistent pattern of allele exclusion. PLoS One, 9(6), e100250. 10.1371/journal.pone.0100250 [DOI] [PMC free article] [PubMed] [Google Scholar]
- Ge, S. X. , Jung, D. M. , & Yao, R. A. (2020). ShinyGO: A graphical gene‐set enrichment tool for animals and plants. Bioinformatics, 36(8), 2628–2629. 10.1093/bioinformatics/btz931 [DOI] [PMC free article] [PubMed] [Google Scholar]
- Ghiselli, F. , Milani, L. , Scali, V. , & Passamonti, M. (2007). The Leptynia hispanica species complex (Insecta Phasmida): Polyploidy, parthenogenesis, hybridization and more. Molecular Ecology, 16(20), 4256–4268. 10.1111/j.1365-294X.2007.03471.x [DOI] [PubMed] [Google Scholar]
- Ghurye, J. , Rhie, A. , Walenz, B. P. , Schmitt, A. , Selvaraj, S. , Pop, M. , Phillippy, A. M. , & Koren, S. (2019). Integrating Hi‐C links with assembly graphs for chromosome‐scale assembly. PLoS computational biology, 15(8), e1007273. 10.1371/journal.pcbi.1007273 [DOI] [PMC free article] [PubMed] [Google Scholar]
- Glover, N. M. , Redestig, H. , & Dessimoz, C. (2016). Homoeologs: What are they and how do we infer them? Trends in Plant Science, 21(7), 609–621. 10.1016/j.tplants.2016.02.005 [DOI] [PMC free article] [PubMed] [Google Scholar]
- Gonzalez, S. (2021). The role of mitonuclear incompatibility in bipolar disorder susceptibility and resilience against environmental stressors. Frontiers in Genetics, 12, 636294. 10.3389/fgene.2021.636294 [DOI] [PMC free article] [PubMed] [Google Scholar]
- Grover, C. E. , Gallagher, J. P. , Szadkowski, E. P. , Yoo, M. J. , Flagel, L. E. , & Wendel, J. F. (2012). Homoeolog expression bias and expression level dominance in allopolyploids. New Phytologist, 196(4), 966–971. 10.1111/j.1469-8137.2012.04365.x [DOI] [PubMed] [Google Scholar]
- Gu, Z. G. , Eils, R. , & Schlesner, M. (2016). Complex heatmaps reveal patterns and correlations in multidimensional genomic data. Bioinformatics, 32(18), 2847–2849. 10.1093/bioinformatics/btw313 [DOI] [PubMed] [Google Scholar]
- Guan, D. , McCarthy, S. A. , Wood, J. , Howe, K. , Wang, Y. , & Durbin, R. (2020). Identifying and removing haplotypic duplication in primary genome assemblies. Bioinformatics, 36(9), 2896–2898. 10.1093/bioinformatics/btaa025 [DOI] [PMC free article] [PubMed] [Google Scholar]
- Gurevich, A. , Saveliev, V. , Vyahhi, N. , & Tesler, G. (2013). QUAST: Quality assessment tool for genome assemblies. Bioinformatics, 29(8), 1072–1075. 10.1093/bioinformatics/btt086 [DOI] [PMC free article] [PubMed] [Google Scholar]
- Hill, G. E. (2019). Reconciling the mitonuclear compatibility species concept with rampant mitochondrial introgression. Integrative and Comparative Biology, 59(4), 912–924. 10.1093/icb/icz019 [DOI] [PubMed] [Google Scholar]
- Huson, D. H. , & Scornavacca, C. (2012). Dendroscope 3: An interactive tool for rooted phylogenetic trees and networks. Systematic Biology, 61(6), 1061–1067. 10.1093/sysbio/sys062 [DOI] [PubMed] [Google Scholar]
- Kassambara, A. , & Mundt, F. (2020). Factoextra: Extract and visualize the results of multivariate data analyses (version R package version 1.0.7) . https://CRAN.R‐project.org/package=factoextra
- Knaus, B. J. , & Grunwald, N. J. (2017). Vcfr: A package to manipulate and visualize variant call format data in R. Molecular Ecology Resources, 17(1), 44–53. 10.1111/1755-0998.12549 [DOI] [PubMed] [Google Scholar]
- Kolmogorov, M. , Yuan, J. , Lin, Y. , & Pevzner, P. A. (2019). Assembly of long, error‐prone reads using repeat graphs. Nature Biotechnology, 37(5), 540–546. 10.1038/s41587-019-0072-8 [DOI] [PubMed] [Google Scholar]
- Kwon, T. , Kim, K. , Caetano‐Anolles, K. , Sung, S. , Cho, S. , Jeong, C. , Hanotte, O. , & Kim, H. (2022). Mitonuclear incompatibility as a hidden driver behind the genome ancestry of African admixed cattle. BMC Biology, 20(1), 20. 10.1186/s12915-021-01206-x [DOI] [PMC free article] [PubMed] [Google Scholar]
- Lavanchy, G. , Brandt, A. , Bastardot, M. , Dumas, Z. , Labedan, M. , Massy, M. , Toubiana, W. , Tran Van, P. , Luchetti, A. , Scali, V. , & Mantovani, B. (2024). Evolution of alternative reproductive systems in Bacillus stick insects. Evolution, 78(6), 1109–1120. 10.1093/evolut/qpae045 [DOI] [PubMed] [Google Scholar]
- Li, H. , & Durbin, R. (2009). Fast and accurate short read alignment with Burrows–Wheeler transform. Bioinformatics, 25(14), 1754–1760. 10.1093/bioinformatics/btp324 [DOI] [PMC free article] [PubMed] [Google Scholar]
- Li, H. , Handsaker, B. , Wysoker, A. , Fennell, T. , Ruan, J. , Homer, N. , Marth, G. , Abecasis, G. , Durbin, R. , & 1000 Genome Project Data Processing Subgroup . (2009). The sequence alignment/map format and SAMtools. Bioinformatics, 25(16), 2078–2079. 10.1093/bioinformatics/btp352 [DOI] [PMC free article] [PubMed] [Google Scholar]
- Liao, Y. , Smyth, G. K. , & Shi, W. (2013). The subread aligner: Fast, accurate and scalable read mapping by seed‐and‐vote. Nucleic Acids Research, 41(10), e108. 10.1093/nar/gkt214 [DOI] [PMC free article] [PubMed] [Google Scholar]
- Malinsky, M. , Matschiner, M. , & Svardal, H. (2021). Dsuite – Fast D‐statistics and related admixture evidence from VCF files. Molecular Ecology Resources, 21(2), 584–595. 10.1111/1755-0998.13265 [DOI] [PMC free article] [PubMed] [Google Scholar]
- Mallet, J. (2007). Hybrid speciation. Nature, 446(7133), 279–283. 10.1038/nature05706 [DOI] [PubMed] [Google Scholar]
- Marescalchi, O. , Zauli, C. , & Scali, V. (2002). Centrosome dynamics and inheritance in related sexual and parthenogenetic Bacillus (Insecta Phasmatodea). Molecular Reproduction and Development, 63(1), 89–95. 10.1002/mrd.10177 [DOI] [PubMed] [Google Scholar]
- Marks, P. , Garcia, S. , Barrio, A. M. , Belhocine, K. , Bernate, J. , Bharadwaj, R. , Bjornson, K. , Catalanotti, C. , Delaney, J. , Fehr, A. , Fiddes, I. T. , Galvin, B. , Heaton, H. , Herschleb, J. , Hindson, C. , Holt, E. , Jabara, C. B. , Jett, S. , Keivanfar, N. , … Church, D. M. (2019). Resolving the full spectrum of human genome variation using linked‐reads. Genome Research, 29(4), 635–645. 10.1101/gr.234443.118 [DOI] [PMC free article] [PubMed] [Google Scholar]
- Martin, M. , Patterson, M. , Garg, S. , O Fischer, S. , Pisanti, N. , Klau, G. W. , Schöenhuth, A. , & Marschall, T. (2016). WhatsHap: Fast and accurate read‐based phasing. bioRxiv, 085050. 10.1101/085050 [DOI] [Google Scholar]
- Matos, I. , Machado, M. P. , Schartl, M. , & Coelho, M. M. (2019). Allele‐specific expression variation at different ploidy levels in Squalius alburnoides . Scientific Reports, 9(1), 3688. 10.1038/s41598-019-40210-8 [DOI] [PMC free article] [PubMed] [Google Scholar]
- McElroy, K. E. , Denton, R. D. , Sharbrough, J. , Bankers, L. , Neiman, M. , & Gibbs, H. L. (2017). Genome expression balance in a triploid trihybrid vertebrate. Genome Biology and Evolution, 9(4), 968–980. 10.1093/gbe/evx059 [DOI] [PMC free article] [PubMed] [Google Scholar]
- McKenna, A. , Hanna, M. , Banks, E. , Sivachenko, A. , Cibulskis, K. , Kernytsky, A. , Garimella, K. , Altshuler, D. , Gabriel, S. , Daly, M. , & DePristo, M. A. (2010). The genome analysis toolkit: A MapReduce framework for analyzing next‐generation DNA sequencing data. Genome Research, 20(9), 1297–1303. 10.1101/gr.107524.110 [DOI] [PMC free article] [PubMed] [Google Scholar]
- Meng, G. , Li, Y. , Yang, C. , & Liu, S. (2019). MitoZ: A toolkit for animal mitochondrial genome assembly, annotation and visualization. Nucleic Acids Research, 47(11), e63. 10.1093/nar/gkz173 [DOI] [PMC free article] [PubMed] [Google Scholar]
- Miller, M. M. , Stuart, K. C. , Burke, N. W. , Rollins, L. A. , & Bonduriansky, R. (2023). Genetic and phenotypic consequences of local transitions between sexual and parthenogenetic reproduction in the wild. American Naturalist, 203, 73–91. 10.1086/727511 [DOI] [PubMed] [Google Scholar]
- Misra, S. , Crosby, M. A. , Mungall, C. J. , Matthews, B. B. , Campbell, K. S. , Hradecky, P. , Huang, Y. , Kaminker, J. S. , Millburn, G. H. , Prochnik, S. E. , Smith, C. D. , Tupy, J. L. , Whitfield, E. J. , Bayraktaroglu, L. , Berman, B. P. , Bettencourt, B. R. , Celniker, S. E. , de Grey, A. D. N. J. , Drysdale, R. A. , … Lewis, S. E. (2002). Annotation of the Drosophila melanogaster euchromatic genome: A systematic review. Genome Biology, 3(12), RESEARCH0083. 10.1186/gb-2002-3-12-research0083 [DOI] [PMC free article] [PubMed] [Google Scholar]
- Moran, B. M. , Payne, C. Y. , Powell, D. L. , Iverson, E. N. K. , Donny, A. E. , Banerjee, S. M. , Langdon, Q. K. , Gunn, T. R. , Rodriguez‐Soto, R. A. , Madero, A. , Baczenas, J. J. , Kleczko, K. M. , Liu, F. , Matney, R. , Singhal, K. , Leib, R. D. , Hernandez‐Perez, O. , Corbett‐Detig, R. , Frydman, J. , … Schumer, M. (2024). A lethal mitonuclear incompatibility in complex I of natural hybrids. Nature, 626(7997), 119–127. 10.1038/s41586-023-06895-8 [DOI] [PMC free article] [PubMed] [Google Scholar]
- Morgan‐Richards, M. , Hills, S. F. K. , Biggs, P. J. , & Trewick, S. A. (2016). Sticky genomes: Using NGS evidence to test hybrid speciation hypotheses. PLoS One, 11(5), e0154911. 10.1371/journal.pone.0154911 [DOI] [PMC free article] [PubMed] [Google Scholar]
- Morgan‐Richards, M. , & Trewick, S. A. (2005). Hybrid origin of a parthenogenetic genus? Molecular Ecology, 14(7), 2133–2142. 10.1111/j.1365-294X.2005.02575.x [DOI] [PubMed] [Google Scholar]
- Mu, W. , Li, K. , Yang, Y. , Breiman, A. , Yang, J. , Wu, Y. , Zhu, M. , Wang, S. , Catalan, P. , Nevo, E. , & Liu, J. (2023). Subgenomic stability of progenitor genomes during repeated Allotetraploid origins of the same grass Brachypodium hybridum . Molecular Biology and Evolution, 40(12), msad259. 10.1093/molbev/msad259 [DOI] [PMC free article] [PubMed] [Google Scholar]
- Myers, S. S. , Trewick, S. A. , & Morgan‐Richards, M. (2013). Multiple lines of evidence suggest mosaic polyploidy in the hybrid parthenogenetic stick insect lineage Acanthoxyla . Insect Conservation and Diversity, 6(4), 537–548. 10.1111/icad.12008 [DOI] [Google Scholar]
- Neiman, M. , Sharbel, T. F. , & Schwander, T. (2014). Genetic causes of transitions from sexual reproduction to asexuality in plants and animals. Journal of Evolutionary Biology, 27(7), 1346–1359. 10.1111/jeb.12357 [DOI] [PubMed] [Google Scholar]
- Nicholls, S. M. , Quick, J. C. , Tang, S. , & Loman, N. J. (2019). Ultra‐deep, long‐read nanopore sequencing of mock microbial community standards. GigaScience, 8(5), giz043. 10.1093/gigascience/giz043 [DOI] [PMC free article] [PubMed] [Google Scholar]
- Nomaguchi, T. , Maeda, Y. , Yoshino, T. , Asahi, T. , Tirichine, L. , Bowler, C. , & Tanaka, T. (2018). Homoeolog expression bias in allopolyploid oleaginous marine diatom Fistulifera solaris . BMC Genomics, 19(1), 330. 10.1186/s12864-018-4691-0 [DOI] [PMC free article] [PubMed] [Google Scholar]
- Nosil, P. , Villoutreix, R. , de Carvalho, C. F. , Farkas, T. E. , Soria‐Carrasco, V. , Feder, J. L. , Crespi, B. J. , & Gompert, Z. (2018). Natural selection and the predictability of evolution in Timema stick insects. Science, 359(6377), 765–770. 10.1126/science.aap9125 [DOI] [PubMed] [Google Scholar]
- Orr, H. A. , & Turelli, M. (2001). The evolution of postzygotic isolation: Accumulating Dobzhansky‐Muller incompatibilities. Evolution, 55(6), 1085–1094. 10.1111/j.0014-3820.2001.tb00628.x [DOI] [PubMed] [Google Scholar]
- Pala, I. , Coelho, M. M. , & Schartl, M. (2008). Dosage compensation by gene‐copy silencing in a triploid hybrid fish. Current Biology, 18(17), 1344–1348. 10.1016/j.cub.2008.07.096 [DOI] [PubMed] [Google Scholar]
- Palmer, J. , & Stajich, J. (2019). Funanntoate: Automated eukaryotic genome annotation pipeline (version 1.7.1). Zenodo 10.5281/zenodo.3548120 [DOI]
- Parfitt, R. G. (1980). The cytology and Feulgen‐DNA microdensitometry of some New Zealand stick insect species (Phasmatodea: Phasmatidae) (Ph.D.). Victoria University of Wellington, Wellington, New Zealand.
- Patterson, M. , Marschall, T. , Pisanti, N. , van Iersel, L. , Stougie, L. , Klau, G. W. , & Schönhuth, A. (2015). WhatsHap: Weighted haplotype assembly for future‐generation sequencing reads. Journal of Computational Biology, 22(6), 498–509. 10.1089/cmb.2014.0157 [DOI] [PubMed] [Google Scholar]
- Prjibelski, A. , Antipov, D. , Meleshko, D. , Lapidus, A. , & Korobeynikov, A. (2020). Using SPAdes de novo assembler. Current Protocols in Bioinformatics, 70(1), 102. 10.1002/cpbi.102 [DOI] [PubMed] [Google Scholar]
- Pryszcz, L. P. , & Gabaldon, T. (2016). Redundans: An assembly pipeline for highly heterozygous genomes. Nucleic Acids Research, 44(12), e113. 10.1093/nar/gkw294 [DOI] [PMC free article] [PubMed] [Google Scholar]
- Ren, L. , Gao, X. , Cui, J. , Zhang, C. , Dai, H. , Luo, M. , He, S. , Qin, Q. , Luo, K. , Tao, M. , Xiao, J. , Wang, J. , Zhang, H. , Zhang, X. , Zhou, Y. , Wang, J. , Zhao, X. , Liu, G. , Wang, G. , … Liu, S. (2022). Symmetric subgenomes and balanced homoeolog expression stabilize the establishment of allopolyploidy in cyprinid fish. BMC Biology, 20(1), 200. 10.1186/s12915-022-01401-4 [DOI] [PMC free article] [PubMed] [Google Scholar]
- Renny‐Byfield, S. , & Wendel, J. F. (2014). Doubling down on genomes: Polyploidy and crop plants. American Journal of Botany, 101(10), 1711–1725. 10.3732/ajb.1400119 [DOI] [PubMed] [Google Scholar]
- Rhie, A. , Walenz, B. P. , Koren, S. , & Phillippy, A. M. (2020). Merqury: Reference‐free quality, completeness, and phasing assessment for genome assemblies. Genome Biology, 21(1), 245. 10.1186/s13059-020-02134-9 [DOI] [PMC free article] [PubMed] [Google Scholar]
- Ritchie, M. E. , Phipson, B. , Wu, D. , Hu, Y. F. , Law, C. W. , Shi, W. , & Smyth, G. K. (2015). Limma powers differential expression analyses for RNA‐sequencing and microarray studies. Nucleic Acids Research, 43(7), e47. 10.1093/nar/gkv007 [DOI] [PMC free article] [PubMed] [Google Scholar]
- Robinson, M. D. , McCarthy, D. J. , & Smyth, G. K. (2010). edgeR: A Bioconductor package for differential expression analysis of digital gene expression data. Bioinformatics, 26(1), 139–140. 10.1093/bioinformatics/btp616 [DOI] [PMC free article] [PubMed] [Google Scholar]
- Runemark, A. , Moore, E. C. , & Larson, E. L. (2024). Hybridization and gene expression: Beyond differentially expressed genes. Molecular Ecology, e17303. 10.1111/mec.17303 [DOI] [PMC free article] [PubMed] [Google Scholar]
- Salavati, M. , Bush, S. J. , Palma‐Vera, S. , McCulloch, M. E. B. , Hume, D. A. , & Clark, E. L. (2019). Elimination of reference mapping bias reveals robust immune related allele‐specific expression in crossbred sheep. Frontiers in Genetics, 10, 467947. 10.3389/fgene.2019.00863 [DOI] [PMC free article] [PubMed] [Google Scholar]
- Salmon, J. T. (1955). The genus Acanthoxyla (Phasmidae). Transactions of the Royal Society of New Zealand, 82, 1149–1156. [Google Scholar]
- Schrinner, S. D. , Mari, R. S. , Ebler, J. , Rautiainen, M. , Seillier, L. , Reimer, J. J. , Usadel, B. , Marschall, T. , & Klau, G. W. (2020). Haplotype threading: Accurate polyploid phasing from long reads. Genome Biology, 21(1), 252. 10.1186/s13059-020-02158-1 [DOI] [PMC free article] [PubMed] [Google Scholar]
- Sieber, K. B. , Batorsky, A. , Siebenthall, K. , Hudkins, K. L. , Vierstra, J. D. , Sullivan, S. , Sur, A. , McNulty, M. , Sandstrom, R. , Reynolds, A. , Bates, D. , Diegel, M. , Dunn, D. , Nelson, J. , Buckley, M. , Kaul, R. , Sampson, M. G. , Himmelfarb, J. , Alpers, C. E. , … Akilesh, S. (2019). Integrated functional genomic analysis enables annotation of kidney genome‐wide association study loci. Journal of the American Society of Nephrology, 30(3), 421–441. 10.1681/ASN.2018030309 [DOI] [PMC free article] [PubMed] [Google Scholar]
- Simao, F. A. , Waterhouse, R. M. , Ioannidis, P. , Kriventseva, E. V. , & Zdobnov, E. M. (2015). BUSCO: Assessing genome assembly and annotation completeness with single‐copy orthologs. Bioinformatics, 31(19), 3210–3212. 10.1093/bioinformatics/btv351 [DOI] [PubMed] [Google Scholar]
- Sloan, D. B. , Warren, J. M. , Williams, A. M. , Kuster, S. A. , & Forsythe, E. S. (2023). Incompatibility and interchangeability in molecular evolution. Genome Biology and Evolution, 15(1), 184. 10.1093/gbe/evac184 [DOI] [PMC free article] [PubMed] [Google Scholar]
- Song, L. , & Florea, L. (2015). Rcorrector: Efficient and accurate error correction for Illumina RNA‐seq reads. GigaScience, 4(1), 48. 10.1186/s13742-015-0089-y [DOI] [PMC free article] [PubMed] [Google Scholar]
- Stamatakis, A. (2014). RAxML version 8: A tool for phylogenetic analysis and post‐analysis of large phylogenies. Bioinformatics, 30(9), 1312–1313. 10.1093/bioinformatics/btu033 [DOI] [PMC free article] [PubMed] [Google Scholar]
- Stuart, O. P. , Cleave, R. , Magrath, M. J. L. , & Mikheyev, A. S. (2023). Genome of the Lord Howe Island stick insect reveals a highly conserved Phasmid X chromosome. Genome Biology and Evolution, 15(6), evad104. 10.1093/gbe/evad104 [DOI] [PMC free article] [PubMed] [Google Scholar]
- Swamy, K. B. S. , Lee, H. Y. , Ladra, C. , Liu, C. F. J. , Chao, J. C. , Chen, Y. Y. , & Leu, J. Y. (2022). Proteotoxicity caused by perturbed protein complexes underlies hybrid incompatibility in yeast. Nature Communications, 13(1), 4394. 10.1038/s41467-022-32107-4 [DOI] [PMC free article] [PubMed] [Google Scholar]
- Tanaka, K. (2009). The proteasome: Overview of structure and functions. Proceedings of the Japan Academy. Series B, Physical and Biological Sciences, 85(1), 12–36. 10.2183/pjab.85.12 [DOI] [PMC free article] [PubMed] [Google Scholar]
- Tarailo‐Graovac, M. , & Chen, N. (2009). Using RepeatMasker to identify repetitive elements in genomic sequences. Current Protocols in Bioinformatics, Chapter 4, Unit 4.10, 25, 4.10.1–4.10.14. 10.1002/0471250953.bi0410s25 [DOI] [PubMed] [Google Scholar]
- Thorburn, D. M. J. , Sagonas, K. , Binzer‐Panchal, M. , Chain, F. J. J. , Feulner, P. G. D. , Bornberg‐Bauer, E. , Reusch, T. B. H. , Samonte‐Padilla, I. E. , Milinski, M. , Lenz, T. L. , & Eizaguirre, C. (2023). Origin matters: Using a local reference genome improves measures in population genomics. Molecular Ecology Resources, 23, 1706–1723. 10.1111/1755-0998.13838 [DOI] [PubMed] [Google Scholar]
- Thrash, A. , Hoffmann, F. , & Perkins, A. (2020). Toward a more holistic method of genome assembly assessment. BMC Bioinformatics, 21, 249. 10.1186/s12859-020-3382-4 [DOI] [PMC free article] [PubMed] [Google Scholar]
- Timmons, J. A. , Szkop, K. J. , & Gallagher, I. J. (2015). Multiple sources of bias confound functional enrichment analysis of global‐omics data. Genome Biology, 16, 186. 10.1186/s13059-015-0761-7 [DOI] [PMC free article] [PubMed] [Google Scholar]
- Valiente‐Mullor, C. , Beamud, B. , Ansari, I. , Francés‐Cuesta, C. , García‐González, N. , Mejía, L. , Ruiz‐Hueso, P. , & González‐Candelas, F. (2021). One is not enough: On the effects of reference genome for the mapping and subsequent analyses of short‐reads. PLoS Computational Biology, 17, e1008678. 10.1371/journal.pcbi.1008678 [DOI] [PMC free article] [PubMed] [Google Scholar]
- van de Geijn, B. , McVicker, G. , Gilad, Y. , & Pritchard, J. K. (2015). WASP: Allele‐specific software for robust molecular quantitative trait locus discovery. Nature Methods, 12(11), 1061–1063. 10.1038/nmeth.3582 [DOI] [PMC free article] [PubMed] [Google Scholar]
- Vaser, R. , Sović, I. , Nagarajan, N. , & Šikić, M. (2017). Fast and accurate de novo genome assembly from long uncorrected reads. Genome Research, 27(5), 737–746. 10.1101/gr.214270.116 [DOI] [PMC free article] [PubMed] [Google Scholar]
- Wang, X. , Fang, X. , Yang, P. , Jiang, X. , Jiang, F. , Zhao, D. , Li, B. , Cui, F. , Wei, J. , Ma, C. , Wang, Y. , He, J. , Luo, Y. , Wang, Z. , Guo, X. , Guo, W. , Wang, X. , Zhang, Y. , Yang, M. , … Kang, L. (2014). The locust genome provides insight into swarm formation and long‐distance flight. Nature Communications, 5, 1–9. 10.1038/ncomms3957 [DOI] [PMC free article] [PubMed] [Google Scholar]
- Weiß, C. L. , Pais, M. , Cano, L. M. , Kamoun, S. , & Burbano, H. A. (2018). nQuire: A statistical framework for ploidy estimation using next generation sequencing. BMC Bioinformatics, 19(1), 122. 10.1186/s12859-018-2128-z [DOI] [PMC free article] [PubMed] [Google Scholar]
- Wen, D. , Yu, Y. , Zhu, J. , & Nakhleh, L. (2018). Inferring phylogenetic networks using PhyloNet. Systematic Biology, 67(4), 735–740. 10.1093/sysbio/syy015 [DOI] [PMC free article] [PubMed] [Google Scholar]
- Wu, C. , Crowhurst, R. N. , Dennis, A. B. , Twort, V. G. , Liu, S. , Newcomb, R. D. , Ross, H. A. , & Buckley, T. R. (2016). De novo transcriptome analysis of the common New Zealand stick insect Clitarchus hookeri (Phasmatodea) reveals genes involved in olfaction, digestion and sexual reproduction. PLoS One, 11(6), e0157783. 10.1371/journal.pone.0157783 [DOI] [PMC free article] [PubMed] [Google Scholar]
- Wu, C. , Twort, V. G. , Crowhurst, R. N. , Newcomb, R. D. , & Buckley, T. R. (2017). Assembling large genomes: Analysis of the stick insect (Clitarchus hookeri) genome reveals a high repeat content and sex‐biased genes associated with reproduction. BMC Genomics, 18(1), 884. 10.1186/s12864-017-4245-x [DOI] [PMC free article] [PubMed] [Google Scholar]
- Xu, G.‐C. , Xu, T.‐J. , Zhu, R. , Zhang, Y. , Li, S.‐Q. , Wang, H.‐W. , & Li, J.‐T. (2019). LR_Gapcloser: A tiling path‐based gap closer that uses long reads to complete genome assembly. GigaScience, 8(1), giy157. 10.1093/gigascience/giy157 [DOI] [PMC free article] [PubMed] [Google Scholar]
- Xu, P. , Xu, J. , Liu, G. , Chen, L. , Zhou, Z. , Peng, W. , Jiang, Y. , Zhao, Z. , Jia, Z. , Sun, Y. , Wu, Y. , Chen, B. , Pu, F. , Feng, J. , Luo, J. , Chai, J. , Zhang, H. , Wang, H. , Dong, C. , … Sun, X. (2019). The allotetraploid origin and asymmetrical genome evolution of the common carp Cyprinus carpio . Nature Communications, 10, 4625. 10.1038/s41467-019-12644-1 [DOI] [PMC free article] [PubMed] [Google Scholar]
- Zhang, X. , Zhang, S. , Zhao, Q. , Ming, R. , & Tang, H. (2019). Assembly of allele‐aware, chromosomal‐scale autopolyploid genomes based on Hi‐C data. Nature Plants, 5(8), 833–845. 10.1038/s41477-019-0487-8 [DOI] [PubMed] [Google Scholar]
Associated Data
This section collects any data citations, data availability statements, or supplementary materials included in this article.
Supplementary Materials
Appendix S1.
Data Availability Statement
All DNA and RNA sequence data, including raw reads, assembled contigs and scaffolds, annotations, SNPs and phased alignments have been deposited in, the Manaaki Whenua – Landcare Research Datastore (https://doi.org/10.7931/f0aw‐tn35) and/or NCBI Nucleotide Database (Bioproject: PRJNA1092727, accession numbers: SRX24386631–SRX24386635, SRX24388240, SRX24388283–SRX24388285, SRX24404082, SRX24404084–SRX24404089, SRX24404108–SRX24404116, SRX24404349, SRX24410872–SRX24410886, SRX24411562–SRX24411564, SRX24416839, SRX24417128, SRX24422658, JBDJKJ000000000). Following requests from some Māori iwi to exercise Indigenous data sovereignty rights, some data are available following request via the Manaaki Whenua—Landcare Research Datastore. All custom scripts can be accessed on GitHub (https://github.com/sstwins21/2023).