

Light-sheet fluorescence microscopy (LSFM) enables fast, gentle, and large volume imaging, making it an increasingly important tool for cell biological discovery. In both live cells and fixed tissues, many important cellular interactions and microenvironmental niches are exceedingly rare. Automatic identification of such events is computationally expensive, especially if such analyses are performed for many biological replicates or through time. In living specimens, such as developing embryos, cellular dynamics often require an experimenter to not only detect the initial event, but manually update the microscope’s configuration to track movement or risk losing the sample. To address such challenges, researchers have started to apply smart microscopy techniques to LSFM1-3. Despite smart imaging approaches existing for over a decade4, most LSFMs operate in a stubbornly classical operation paradigm. In part, this is because each LSFM is optimized for specific biological contexts with distinct hardware and control requirements, which may not be supported by existing smart routines. Compounding the problem, most LSFM control software has been built in a piece-meal fashion by combining closed-source LabView or Java code with separate Java or Python routines that must be installed and/or compiled separately (Table S1), making it difficult for users without advanced programming capabilities to adapt and reuse available smart routines. To address these challenges and democratize smart LSFM, we developed navigate, an open-source, Python-based LSFM control software with easily reconfigured hardware controls and graphical user interface (GUI)-reconfigurable smart acquisition routines (Fig. 1a & b).
Figure 1:
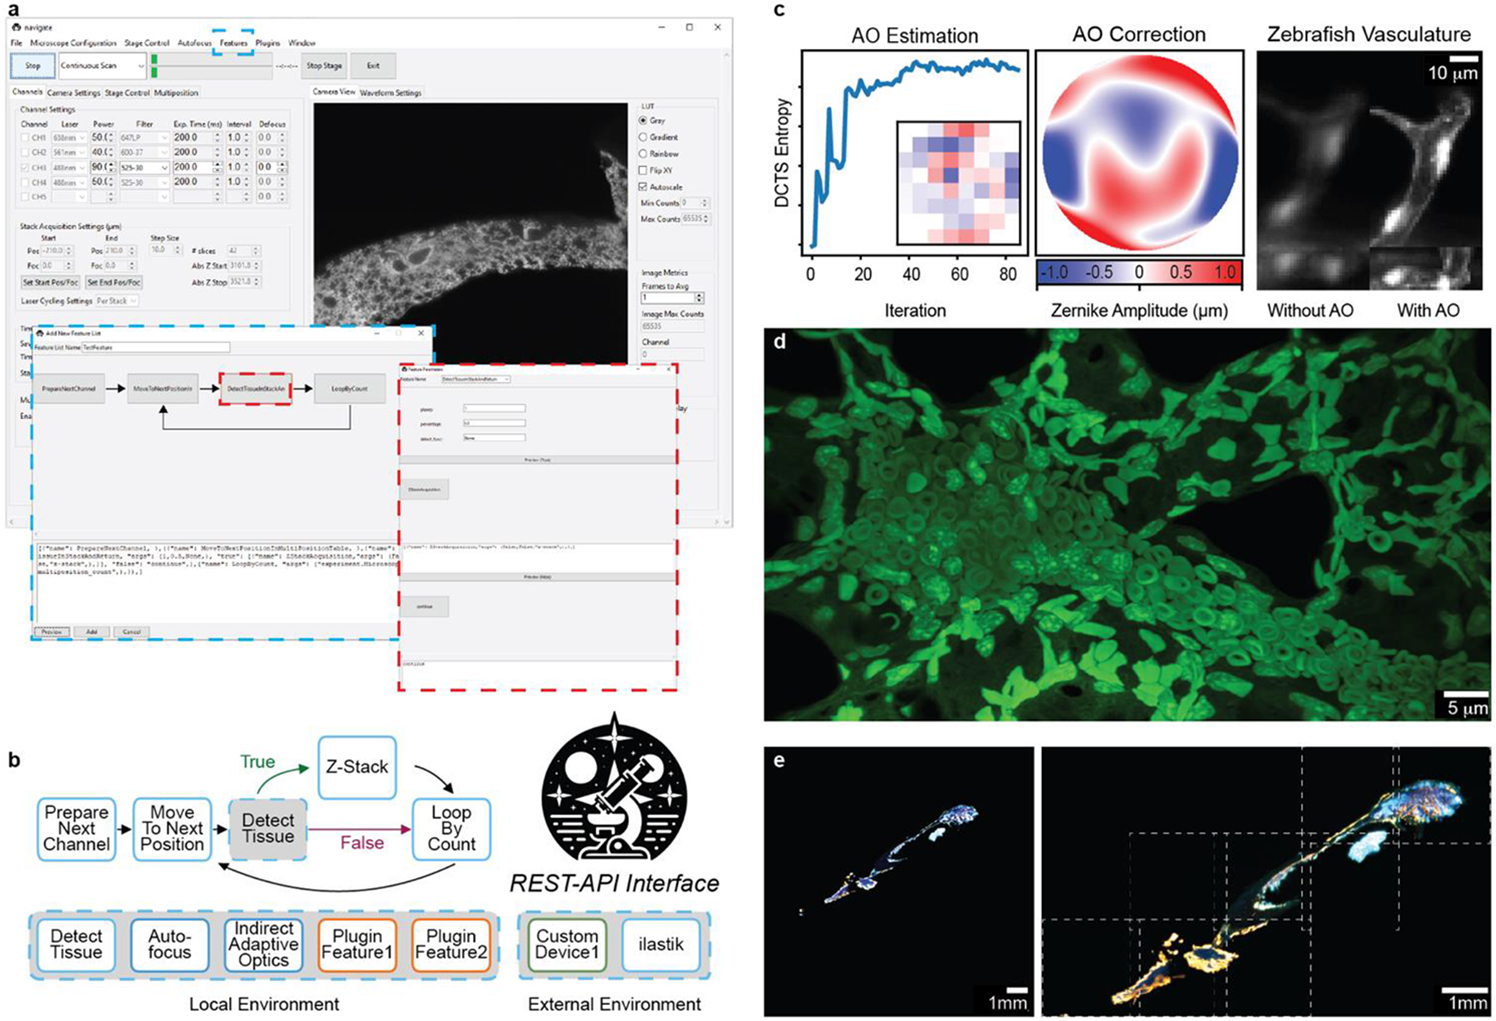
navigate provides a GUI with access to reconfigurable smart acquisition pipelines and runs on multiple types of light-sheet configurations. a, Screenshot of the navigate GUI running a mesoSPIM10 with GUI controls for the smart acquisition routine diagrammed in b. The blue dashed boxes show the Feature menu, where the controls are accessed, and the corresponding editor for the smart routine. The red dashed boxes show a decision node and the corresponding editor for this decision node. b, An example of a reconfigurable, decision-based pipeline that acquires a Z-Stack if tissue is present at a particular stage position. The user guide in the Supplementary Documentation features a tutorial on how to build this pipeline. Individual features can be swapped for other features that ship with the software or with custom-built plugin features. c, navigate can integrate advanced optical techniques, such as adaptive optics. (Left) An iterative sensorless adaptive optics scheme uses the Discrete Cosine Transform Shannon (DCTS) Entropy to estimate aberrations. Inset shows the final actuator positions of the deformable mirror. (Middle) Final estimated adaptive optics wavefront. (Right) 3D stack of a ventricle within the vasculature of a zebrafish embryo (labelled with kdrl:eGFP), before and after adaptive optics. d, Example image of an expanded mouse lung, captured with an upright ctASLM using navigate. e, Results of smart imaging workflow from a and b, captured on a mesoSPIM. Bone tissue imaged at 1x magnification (left) was automatically segmented and tiled at 6x magnification (right). Imaged regions, indicated by dashed white boxes, were saved to BDV and displayed in a tiled format.
navigate enables biologists and technology developers alike to establish and re-use smart microscopy pipelines on diverse sets of hardware from within a single framework. While generalizable, Python-based frameworks for smart microscopy have been built, they were designed for stimulated emission depletion5 or single-molecule localization microscopy6 and do not yet address LSFM’s specific acquisition challenges, including decoupled illumination and detection optomechanics and a lack of an optical substrate for focus maintenance. While GUI-based frameworks for image post-processing exist6, to the authors’ knowledge navigate is the only software that enables decision-based acquisition routines to be generated in a code-free format (Table S1).
A schematic of navigate’s software architecture is presented in Fig. S1. The plugin architecture of navigate facilitates the addition of new hardware, enabling users to integrate otherwise unsupported devices. For image-based feedback, custom analysis routines can also be loaded within navigate’s environment to evaluate images stored as NumPy arrays in memory. navigate supports the addition of REST-API interfaces for two-way communication with image analysis programs running outside of Python, or in different Python environments, such as Ilastik7, enabling developers to make calls to state-of-the-art software while avoiding dependency conflicts. Image-based feedback can be leveraged to perform diverse tasks, such as sensorless adaptive optics in optically complex specimens (Fig. 1c). We believe this flexibility is necessary for the software to accommodate the diverse modalities of LSFM and to integrate feedback mechanisms.
navigate can readily be installed and operated without knowledge of software development or an expertise in light-sheet microscopy. Out of the box, it is equipped with an intuitive and rigorously tested GUI (Fig. S2) and can capture rich biological data in both classical (Fig. 1d) and smart formats (Fig. 1e) from axially swept, digitally scanned, oblique plane, field synthesis, projection light-sheet imaging modalities in both laser- and sample-scanning formats. navigate virtualizes microscope control, allowing multiple microscopes to be operated on the fly using a single set of hardware. navigate writes to next-generation, pyramidal BigDataViewer H5/N5, and OME-Zarr data formats (Note S1, Table S2)8 9, enabling easy movement from acquisition into established image registration and analysis pipelines and fast visual feedback in ImageJ. Data generated adheres to Open Microscopy Environment standards and imports readily into OMERO image data repositories. To ensure academic reproducibility, consistency, and reliability, navigate is well documented, and each release of navigate is versioned, archived, and given a citable digital object identifier. Because navigate is open-source, organized in a Model-View-Controller architecture, and includes a plugin interface, it readily integrates third-party packages such as pymmcore, acquire, and more (Note S2). We believe navigate’s extensibility, user-friendliness even for non-experts, and reproducibility positions navigate as the turn-key solution for bespoke, smart LSFM systems. While initially designed for LSFM, navigate’s versatile framework makes it suitable for a broad range of camera-based imaging modalities. Thus, we hope navigate empowers users from all scientific backgrounds to construct and implement novel intelligent imaging workflows, greatly improving their ability to unravel the cellular complexities of life.
Supplementary Material
Figure S1. Software architecture. navigate is constructed in an industry-standard Model-View-Controller architecture. The model operates in its own sub-process, and communication between the model and the controller is executed with event queues. Each graphical user interface window (e.g., camera display, autofocusing module, etc.) is managed with a dedicated sub-controller, which relays information to the parent controller. To facilitate communication with external libraries which may have conflicting dependencies, a REST-API level is included. Alternatively, a plugin layer enables the addition of non-supported devices. Each acquisition routine is run from within the feature container, which provides reconfigurable data acquisition workflows with custom integrated computer vision feedback mechanisms.
Figure S2. Overview of the main graphical user interface elements in navigate. A) The main navigate user interface is presented, featuring the menu and acquisition bars at the top, along with the settings and display notebooks. The settings notebook, shown here with the Channels tab active, allows for adjustments of imaging parameters including channel selection, laser power, filter wheel, exposure times, and z-stack configurations. The display notebook presents the image to the user and provides control over image display, such as the minimum and maximum intensity, lookup table, etc. Basic image metrics, such as the maximum intensity counts, are also displayed, which provides useful feedback for alignment and optimization of microscope performance. B) The camera settings window, the automated sample tiling and multi-position imaging tab, and the stage control tab are displayed from top-to-bottom, each providing specialized control over different aspects of the imaging process. C) The Waveform Settings tab enables detailed examination of the waveforms supplied by the data acquisition card. Each tab can be popped out and resized according to the user’s preferences. Additional graphical user interface elements are implemented as popout windows. See navigate’s online documentation for additional detail.
- Turnkey support for standard hardware and multiple types of light sheet microscopes.
- A GUI-editable smart acquisition pipeline.
- A plugin architecture that lets developers easily enable new hardware controls and image-based feedback routines.
- Support for large-volume, next-generation file formats.
- An open-source license.
- Active development.
Table S2: Median Write Speed in Megavoxels per Second. The median duration of time to write to disk for TIFF, OME-TIFF, H5, N5, and OME-Zarr were evaluated for image sizes of 512x512, 1024x1024, and 2048x2048 for two different scenarios: (Top) The acquisition of 1000 single plane images and (Bottom) the acquisition of a single z-stack with 1000 image planes. All reported write speeds are in megavoxels per second. All benchmarking was done on a Windows machine with an Intel(R) Xeon(R) Silver 4112 CPU @ 2.60GHz, 88GB of RAM, and a Micron 5200 ECO 7680GB solid state hard-drive disk. For chunked file formats (e.g., H5, N5, OME-Zarr), data was saved to disk without down-sampling. Chunk sizes were set to the full image size of the frame. N5 and OME-Zarr data sets were saved with blosc compression using the Zarr library default settings. Significant overhead is associated with setting up the first write operation for H5, N5, and OME-Zarr files, and to a lesser degree for TIFF and OME-TIFF files. These initial setups reduce the mean write speed, but the median write speed remains stable for most of an acquisition. Under Z-stack imaging conditions, TIFF and OME-TIFF images could be written to disk at rates of up ~300 Hz for a 2048x2048 camera size, which is faster than most modern sCMOS cameras operate.
Acknowledgments:
This work was funded by the NIH National Institute of General Medical Science (RM1GM145399 to K.M.D., R35GM133522 to R.F.), the NIH National Cancer Institute (U54CA268072 to K.M.D. & R.F., and R01CA238519 to S.D.C.), and the Cancer Prevention Research Institute of Texas (RR1900371 to S.D.C.). The authors wish to thank G. Danuser and F. Zhou for helpful discussions about software design, A. York and N. Thayer for their open-source concurrency toolkit, and E. Wylie, S. Rapuri, R. Gupta, and S. Mamtani for their contributions to the graphical user interface.
Footnotes
Data and Code Availability Statement:
The source code for navigate is available on GitHub (https://github.com/TheDeanLab/navigate) andPyPI (https://pypi.org/project/navigate-micro/). Queries and feedback can be provided by creating an issue on GitHub. Documentation on how to extend navigate is provided in the Supplementary Documentation (and is kept up to date at https://thedeanlab.github.io/navigate/). A plugin template is available at https://github.com/TheDeanLab/navigate-plugin-template. Imaging data presented in figures is available upon request.is available upon request.
Ethics Declaration:
K.M.D. and R.F. have a patent covering ASLM (US10989661) and consultancy agreements with 3i, Inc (Denver, CO, USA). K.M.D has an ownership interest in Discovery Imaging Systems, LLC. The remaining authors declare no competing interests.
References:
- 1.McDole K. et al. In Toto Imaging and Reconstruction of Post-Implantation Mouse Development at the Single-Cell Level. Cell 175, 859–876 e833 (2018). 10.1016/j.cell.2018.09.031 [DOI] [PubMed] [Google Scholar]
- 2.Mahecic D. et al. Event-driven acquisition for content-enriched microscopy. Nat Methods 19, 1262–1267 (2022). 10.1038/s41592-022-01589-x [DOI] [PMC free article] [PubMed] [Google Scholar]
- 3.Shi Y. et al. Smart lattice light-sheet microscopy for imaging rare and complex cellular events. Nat Methods (2024). 10.1038/s41592-023-02126-0 [DOI] [PMC free article] [PubMed] [Google Scholar]
- 4.Conrad C. et al. Micropilot: automation of fluorescence microscopy-based imaging for systems biology. Nat Methods 8, 246–249 (2011). 10.1038/nmeth.1558 [DOI] [PMC free article] [PubMed] [Google Scholar]
- 5.Alvelid J, Damenti M, Sgattoni C & Testa I Event-triggered STED imaging. Nat Methods 19, 1268–1275 (2022). 10.1038/s41592-022-01588-y [DOI] [PMC free article] [PubMed] [Google Scholar]
- 6.Barentine AES et al. An integrated platform for high-throughput nanoscopy. Nat Biotechnol 41, 1549–1556 (2023). 10.1038/s41587-023-01702-1 [DOI] [PMC free article] [PubMed] [Google Scholar]
- 7.Berg S. et al. ilastik: interactive machine learning for (bio)image analysis. Nature Methods 16, 1226–1232 (2019). 10.1038/s41592-019-0582-9 [DOI] [PubMed] [Google Scholar]
- 8.Pietzsch T, Saalfeld S, Preibisch S & Tomancak P BigDataViewer: visualization and processing for large image data sets. Nat Methods 12, 481–483 (2015). 10.1038/nmeth.3392 [DOI] [PubMed] [Google Scholar]
- 9.Moore J. et al. OME-NGFF: a next-generation file format for expanding bioimaging data-access strategies. Nature Methods 18, 1496–1498 (2021). 10.1038/s41592-021-01326-w [DOI] [PMC free article] [PubMed] [Google Scholar]
- 10.Voigt FF et al. The mesoSPIM initiative: open-source light-sheet microscopes for imaging cleared tissue. Nature Methods 16, 1105–1108 (2019). 10.1038/s41592-019-0554-0 [DOI] [PMC free article] [PubMed] [Google Scholar]
Associated Data
This section collects any data citations, data availability statements, or supplementary materials included in this article.
Supplementary Materials
Figure S1. Software architecture. navigate is constructed in an industry-standard Model-View-Controller architecture. The model operates in its own sub-process, and communication between the model and the controller is executed with event queues. Each graphical user interface window (e.g., camera display, autofocusing module, etc.) is managed with a dedicated sub-controller, which relays information to the parent controller. To facilitate communication with external libraries which may have conflicting dependencies, a REST-API level is included. Alternatively, a plugin layer enables the addition of non-supported devices. Each acquisition routine is run from within the feature container, which provides reconfigurable data acquisition workflows with custom integrated computer vision feedback mechanisms.
Figure S2. Overview of the main graphical user interface elements in navigate. A) The main navigate user interface is presented, featuring the menu and acquisition bars at the top, along with the settings and display notebooks. The settings notebook, shown here with the Channels tab active, allows for adjustments of imaging parameters including channel selection, laser power, filter wheel, exposure times, and z-stack configurations. The display notebook presents the image to the user and provides control over image display, such as the minimum and maximum intensity, lookup table, etc. Basic image metrics, such as the maximum intensity counts, are also displayed, which provides useful feedback for alignment and optimization of microscope performance. B) The camera settings window, the automated sample tiling and multi-position imaging tab, and the stage control tab are displayed from top-to-bottom, each providing specialized control over different aspects of the imaging process. C) The Waveform Settings tab enables detailed examination of the waveforms supplied by the data acquisition card. Each tab can be popped out and resized according to the user’s preferences. Additional graphical user interface elements are implemented as popout windows. See navigate’s online documentation for additional detail.
- Turnkey support for standard hardware and multiple types of light sheet microscopes.
- A GUI-editable smart acquisition pipeline.
- A plugin architecture that lets developers easily enable new hardware controls and image-based feedback routines.
- Support for large-volume, next-generation file formats.
- An open-source license.
- Active development.
Table S2: Median Write Speed in Megavoxels per Second. The median duration of time to write to disk for TIFF, OME-TIFF, H5, N5, and OME-Zarr were evaluated for image sizes of 512x512, 1024x1024, and 2048x2048 for two different scenarios: (Top) The acquisition of 1000 single plane images and (Bottom) the acquisition of a single z-stack with 1000 image planes. All reported write speeds are in megavoxels per second. All benchmarking was done on a Windows machine with an Intel(R) Xeon(R) Silver 4112 CPU @ 2.60GHz, 88GB of RAM, and a Micron 5200 ECO 7680GB solid state hard-drive disk. For chunked file formats (e.g., H5, N5, OME-Zarr), data was saved to disk without down-sampling. Chunk sizes were set to the full image size of the frame. N5 and OME-Zarr data sets were saved with blosc compression using the Zarr library default settings. Significant overhead is associated with setting up the first write operation for H5, N5, and OME-Zarr files, and to a lesser degree for TIFF and OME-TIFF files. These initial setups reduce the mean write speed, but the median write speed remains stable for most of an acquisition. Under Z-stack imaging conditions, TIFF and OME-TIFF images could be written to disk at rates of up ~300 Hz for a 2048x2048 camera size, which is faster than most modern sCMOS cameras operate.