

ABSTRACT
Dose‐dependent hematological toxicity of lenalidomide has been reported previously, and thus, there is a clinical need for dose individualization to manage toxicities. The objectives of this study were to explore optimal individualized dosing regimens for Chinese B‐cell malignancies patients with varying degrees of renal function, and to push forward clinical management of hematological toxicity due to lenalidomide overexposure. A total of 164 plasma concentrations of lenalidomide were obtained from 97 Chinese patients with multiple myeloma (MM) and B‐cell non‐Hodgkin lymphoma (NHL) from a multicenter prospective study. A population pharmacokinetic (PopPK) model for lenalidomide was developed by nonlinear mixed effect modeling. A Monte Carlo simulation was conducted to recommend model‐informed precision dosing (MIPD) for patients with varying degrees of renal function. A one‐compartment model with first‐order elimination best described the pharmacokinetics of lenalidomide. The population typical values of lenalidomide were as follows: absorption rate constant (Ka) of 8.34 h−1, apparent volume of distribution (V/F) of 37.4 L, and apparent clearance (CL/F) of 7.4 L/h. Creatinine clearance (CCr) was identified as a major covariate for CL/F, whereas other demographics or clinical characteristics had no significant effect on the model. When given the identical dose, Chinese patients exhibited a higher exposure than the predominantly non‐Asian population at all dosage regimens, especially in patients with severe renal damage (CCr < 30 mL/min). For Chinese patients with CCr of 15–30 mL/min who do not require dialysis usually, compared to the dosing regimen of 15 mg every other day recommended by drug instructions, there exists a relatively lower risk of hematotoxicity when administered with 5 or 10 mg/day. For Chinese patients with CCr < 15 mL/min requiring dialysis, there was still a certain level of hematotoxicity risk associated with the dosing regimen of 5 mg/day recommended by drug instructions. The PopPK Model‐based simulation suggests that Chinese patients may exhibit a higher exposure than the predominantly non‐Asian population. For patients with severely impaired renal function, compared to dose adjustment in accordance with drug instructions, an individualized dosage strategy based on therapeutic drug monitoring (TDM) and MIPD would be preferable from a safety perspective.
Keywords: B‐cell malignancies, lenalidomide, model‐informed precision dosing, population pharmacokinetics, therapeutic drug monitoring

Summary.
- What is the current knowledge on the topic?
-
○Lenalidomide, an immunomodulatory drug, is widely used to treat B‐cell malignancies like multiple myeloma and non‐Hodgkin lymphoma. Clinical studies have identified dose‐dependent hematological toxicity linked to lenalidomide therapy. Despite dose adjustments based on renal function being performed according to the drug instructions, unacceptable hematological toxicity is still the most common factor preventing continuous therapy with lenalidomide in Chinese patients.
-
○
- What question did this study address?
-
○This study addressed the effect of varying degrees of renal function on lenalidomide exposure and the potential for hematological toxicity, aiming to guide clinical dose. This study also conducted exploratory analysis to explore the differences in drug exposure between Chinese and non‐Asian populations.
-
○
- What does this study add to our knowledge?
-
○This analysis presents the first population pharmacokinetic modeling and simulation performed for hematological toxicity linked to lenalidomide overexposure in the Chinese population. The results show that Chinese patients with varying degrees of renal function may experience higher lenalidomide exposure compared to non‐Asian populations.
-
○
- How might this change drug discovery, development, and/or therapeutics?
-
○The study recommends a relatively lower initial dose coupled with individualized dosing strategies guided by therapeutic drug monitoring for Chinese patients with severe renal impairment. This patient‐tailored approach supersedes the conventional practice of mechanically implementing dosage adjustments from drug instructions, given that existing prescribing data predominantly originate from clinical trials involving Western populations. This study highlights the importance of assessing racial differences in drug exposure and providing ethnic‐specific dosing strategies for special populations if necessary.
-
○
1. Introduction
Lenalidomide is an immunomodulatory drug derived from thalidomide, which possesses immunomodulatory, antiangiogenic, and antineoplastic properties. Since lenalidomide's approval in 2005 for the treatment of transfusion‐dependent anemia in patients with myelodysplastic syndromes (MDS), it has demonstrated clinical efficacy in the treatment of various hematological malignancies [1, 2]. As a result, it is widely recommended as a first‐ or second‐line treatment for multiple B‐cell malignancies, such as multiple myeloma (MM), diffuse large B‐cell lymphoma (DLBCL), follicular lymphoma (FL), mantle cell lymphoma (MCL), marginal zone lymphoma (MZL), and other B‐cell non‐Hodgkin lymphoma (NHL) [3, 4, 5].
From a pharmacokinetics perspective, lenalidomide is rapidly absorbed after oral administration but easily affected by food intake, with a distribution volume of approximately 50–200 L. Moreover, lenalidomide is not metabolized by liver enzymes in the body but is primarily excreted by the kidneys, making dose reduction necessary for patients with renal insufficiency to lower drug exposure [6]. The appropriate dosage of lenalidomide varies depending on the specific disease, with a recommended starting dose of 20 mg/day for FL and MZL and 25 mg/day for MM and MCL [7]. Regardless of the indication, the patient's renal function should be considered when determining the starting dose. It is worth noting that adverse events following the starting dose are common, which often require a dose adjustment from the standard initial dose of 20 or 25 mg/day to 15, 10, or even 5 mg/day regimens or delayed doses [8, 9].
During real clinical practice, despite dose adjustments according to baseline kidney function, unacceptable hematological toxicity is still the most common factor preventing continuous therapy with lenalidomide. Hematological toxicity of any grade was experienced by almost half of the patients, and the incidence of high‐grade hematologic toxicity may be 30% or higher [8, 10]. In addition to possibly causing treatment interruption, lenalidomide‐related hematological toxicity can affect patient adherence to treatment, increase the relapse risk, and increase healthcare costs [11]. Thus, there is a clinical need for proper dose modifications to manage hematological toxicities. Additionally, previous studies have shown considerable interindividual pharmacokinetic variability in lenalidomide, with a relationship between trough plasma concentration (Cmin) and hematological toxicity observed [11]. Based on the above considerations, dose individualization based on therapeutic drug monitoring (TDM) is a reasonable strategy to prevent potential severe complications and achieve the highest therapeutic benefits of lenalidomide [12, 13].
A combination of TDM and model‐informed precision dosing (MIPD) has been proposed as a valid strategy for precision therapy, and population pharmacokinetic (PopPK) models provide an effective tool for the successful implementation of MIPD [14]. Currently, the PopPK of lenalidomide has been explored in published literature. The first published model utilized data from a small number of MM patients (n = 15) and found that creatinine clearance (CCr) and body surface area (BSA) were covariates that impact lenalidomide pharmacokinetics [15]. Additionally, two studies used data from clinical trials to develop PopPK models in patients with B‐cell malignancies [acute lymphoblastic leukemia (ALL), acute myeloid leukemia (AML), chronic lymphocytic leukemia (CLL), MM] and patients with MM or MDS, respectively [16, 17]. However, none of the studies have proposed dosing regimens for the Asian population based on lenalidomide PopPK models, whereas the Asian population may experience a higher exposure and a worse tolerance than the non‐Asian population [18].
Herein, the objective of the present study is to establish a PopPK model describing the pharmacokinetics of lenalidomide in Chinese patients with B‐cell malignancies, to optimize lenalidomide dosage regimens for the Chinese population with renal impairment, and to ultimately push forward clinical management of hematological toxicity due to lenalidomide overexposure. Additionally, we aim to explore potential ethnic differences between Chinese and non‐Asian populations in lenalidomide pharmacokinetics.
2. Methods
2.1. Study Population
This study included adult patients who were diagnosed with MM and B‐cell NHL (including DLBCL, FL, MCL, MZL, etc.) and treated with lenalidomide from October 2021 to February 2022 at Peking University Third Hospital, Beijing Jishuitan Hospital, Beijing Chaoyang Hospital of Capital Medical University, and Peking Union Medical College Hospital. This study was in compliance with the Declaration of Helsinki and approved by the Peking University Third Hospital Medical Science Research Ethics Committee (No. M2021573). Patients provided written informed consent prior to enrollment.
The exclusion criteria were as follows: the clinical diagnosis was unclear or the information was incomplete; they had impaired liver function with alanine aminotransferase (ALT) or aspartate aminotransferase (AST) greater than 5 times the upper limits of normal (ULN); they failed to take medicine as prescribed; they did not undergo blood sample collection according to the prescribed time; and the plasma concentration of lenalidomide was below the lower limit of quantitation (LLOQ) of 1 ng/mL.
2.2. Dose Regimen, Sampling and Assay of Plasma Lenalidomide
Lenalidomide was given in doses of 10–25 mg/day depending on the patient's tolerance and renal function. Lenalidomide was administered orally as a monotherapy or in combination for 21 days in a 28‐day cycle. Given that the half‐life of lenalidomide is approximately 3–5 h, it was considered to have achieved a steady‐state plasma concentration after 3 days. Patients taking lenalidomide capsules for at least 3 days (steady state) were enrolled in this study. Blood samples were collected at 0.5 h (trough concentration, Cmin) before oral administration and 1 h (C1h) thereafter on the day.
The plasma samples were prepared by centrifugation at 3000 rpm for 5 min and were subjected to protein precipitation. The plasma concentration of lenalidomide was determined by a validated high‐performance liquid chromatography tandem mass spectrometry (LC–MS/MS) method with a lower limit of quantitation (LLOQ) of 1 ng/mL, as reported previously [11].
2.3. PopPK Model Building
2.3.1. Base Structural Model
PopPK models were developed in Phoenix 8.3 (Certara USA Inc., Princeton, NJ, USA) using a nonlinear mixed effects model (NLME), and descriptive statistical analysis of the data was implemented using SPSS 26 (IBM Ltd., USA). R software (version 4.3.2, R Foundation for Statistical Computing, Vienna, Austria) was used for data manipulation and visualization. The modeling process was performed as follows: (1) development of a base structural and residual model that best describes the data; (2) screening and inclusion of covariates; and (3) evaluation and validation of the model.
One‐ or two‐compartment distributions with first‐order elimination kinetic models were evaluated as base structural models. A first‐order conditional estimation method with the extended least squares method (FOCE ELS) was used to estimate population typical parameter values and their interindividual variability. The interindividual variability was described by the following multiplicative exponential structure equation and was assumed to be normally distributed (Equation 1):
| (1) |
where θi represents the individual parameter value in the ith patient, θtv is the population typical parameter value, and ηi describes the variability of the parameter between the individual and population with a mean of 0 and a variance of ω 2.
In addition, intraindividual variation was described by additive, proportional, and combined additive and proportional residual models, where the equations are as follows (Equations (2), (3), (4)):
| (2) |
| (3) |
| (4) |
Where CObsij and CPredij represent the observed and predicted jth concentration in the ith patient, respectively.εij1 is the additive residual and εij2 is the proportional residual, both of which are distributed with a mean of 0 and a variance of σ 2. Meanwhile, the base model on account of classical allometric scaling based on body weight with fixed power exponents of 0.75 for apparent clearances (CL/F) and 1.0 for apparent distribution volumes (V/F) was also tested. The base structural model was selected according to the objective function value (OFV, equal to −2 log‐likelihood), Akaike information criteria (AIC), standard error, and coefficients of variation of parameter values and graphical analyses of the goodness‐of‐fit (GOF) [19, 20].
2.3.2. Covariate Model Development
Potential covariates were screened for physiological and clinical significance, including sex, age, serum creatinine (SCr), CCr (Cockcroft‐Gault formula), ALT, AST, alkaline phosphatase (ALP), total protein (TP), and albumin (ALB) levels. Subsequently, the covariates identified as potential influencers of PK parameters were incorporated into the next modeling step.
The covariate model was built using a stepwise modeling method. The stepwise procedure was divided into three steps, including one‐by‐one filtering, forward inclusion, and backward elimination. Covariates were tested one by one, and only those that significantly improved the performance of the model could be included in the multivariate analysis. Screened covariates were then assessed by forward addition and backward exclusion. In the forward inclusion process, a covariate was included if the −2LL value decreased by more than 6.64 (p < 0.01). In the backward exclusion process, a covariate was retained if the −2LL value increased by more than 10.83 (p < 0.001) after the covariate was removed from the model. Continuous covariates were centered on their median values and tested by the exponential function (Equation 5):
| (5) |
Where covi and covmedian represent the ith individual and median value of the covariate, respectively, and θ stands for the estimated values of the covariate effect.
Categorical covariates, such as disease and sex, were coded numerically and tested by scale models (Equation 6):
| (6) |
Where θ represents the change in the typical value of MM compared to NHL or female to male.
2.4. Model Evaluation
To investigate the degree of model fitting, GOF plots were employed for model evaluation. GOF plots included plots of observed concentrations (CObs) versus individual and population predicted concentrations (IPRED and PRED), plots of conditional weighted residuals (CWRES) over population predicted concentrations, and CWRES versus time after dose (TAD).
Prediction‐corrected visual prediction checks (pcVPC) and bootstrap methods were used to simultaneously assess the predictive performance and stability of the model. Bootstrapping was used to generate a new set of samples by random sampling with replacement of the original dataset. This was repeated 1000 times to generate 1000 simulative datasets from the same population and fit them with the final model, with each set yielding a set of parameter estimates. Following resampling of the datasets, the 2.5th and 97.5th percentiles, along with the medians of the estimated parameters, were compared with the final model estimates. We also used pcVPC to fit the observed values 1000 times to generate simulated values, calculating the 5th, 50th and 95th percentiles of the observed and simulated values. The congruence of trends between the simulated and observed data was evaluated visually.
2.5. Model‐Informed Precision Dosing
Based on the established final PopPK model of lenalidomide, we simulated the plasma concentrations of B‐cell malignancy patients under different dosing regimens using the Monte Carlo simulation method. Based on the knowledge that lenalidomide has linear pharmacokinetics, and plasma concentrations scale linearly with the quantity of absorbed drug [21, 22, 23], a wide range of doses (5 to 25 mg/day and 15 mg every other day) was used for simulations for patients with varying renal function.
Our previous studies have shown that a lenalidomide C min threshold below 10.95 ng/mL is associated with a lower risk of hematological toxicity [11]. The elimination half‐life of lenalidomide is approximately 3–5 h but can be extended to 10 h in patients with renal insufficiency. Therefore, patients with B‐cell malignancies taking lenalidomide are considered to reach steady‐state plasma concentrations after at least 3 days. To investigate the maximum dose that could be safely administered without causing hematotoxicity in patients with varying renal function, we conducted 1000 simulations for each dosing regimen in combination with CCr.
Similarly, based on a published PopPK model and reports from the predominantly non‐Asian population [16], Monte Carlo simulations were also conducted to compare pharmacokinetic (PK) exposure and C min among ethnic groups. The area under the concentration‐time curve within the initial 24 h (AUC0‐24 h) was also estimated for Chinese and predominantly non‐Asian patients administered different dosages (5–25 mg/day).
3. Results
3.1. Study Population
A total of 164 plasma concentrations of lenalidomide from 97 patients with MM and B‐cell NHL were available for the construction of the PopPK model. Of these 97 patients, 45.4% were males, and 54.6% were females. The age range of the patients was 33–87 years, with a mean age of 61.7 ± 10.9 (SD) years. Of the enrolled patients, 43.3% were diagnosed with B‐cell NHL, including DLBCL, FL, MCL, and high‐grade B‐cell lymphoma (HGBL), while 56.7% of patients had MM. The main demographics and clinical characteristics of the enrolled patients are summarized in Table 1. We also compared the characteristics of each covariate between the two disease types, and the results are summarized in Table 2. Most covariates showed no significant differences between the two disease types.
TABLE 1.
Main demographics and clinical characteristics of enrolled patients.
| Variable | Mean | SD | Median | Range |
|---|---|---|---|---|
| Age (years) | 61.7 | 10.9 | 62.0 | 33–87 |
| Weight (kg) | 64.5 | 11.7 | 63.0 | 37–101 |
| BMI (kg/m2) | 23.6 | 3.5 | 23.4 | 13.1–31.2 |
| BSA (m2) | 1.7 | 0.2 | 1.7 | 1.4–2.3 |
| CCr (mL/min) | 93.0 | 31.6 | 94.2 | 34.8–227.7 |
| TP (g/L) | 66.0 | 10.9 | 65.8 | 40.8–116.6 |
| ALB (g/L) | 38.5 | 4.7 | 38.0 | 25.3–49.3 |
| ALT (U/L) | 24.8 | 21.2 | 20.0 | 2–148 |
| AST (U/L) | 22.2 | 12.7 | 20.2 | 1.1–89 |
| ALP (U/L) | 82.1 | 28.6 | 77.0 | 32–204 |
| No. | Percentage (%) | |
|---|---|---|
| Dose (mg) | ||
| 10.0 | 23 | 23.7 |
| 12.5 | 6 | 6.2 |
| 20.0 | 1 | 1.0 |
| 25.0 | 67 | 69.1 |
| Type of disease | ||
| NHL | 42 | 43.3 |
| MM | 55 | 56.7 |
| Gender (n) | ||
| Male | 44 | 45.4 |
| Female | 53 | 54.6 |
Abbbreviations: ALB, serum albumin; ALP, alkaline phosphatase; ALT, alanine transaminase; AST, aspartate aminotransferase; BSA, body surface area; CCr, creatinine clearance rate; MM, multiple myeloma; NHL, non‐Hodgkin's lymphoma; SD, standard deviation; TP, total protein.
TABLE 2.
Comparison of covariate characteristics between the two disease types.
| Variable | NHL mean ± SD | MM mean ± SD | p |
|---|---|---|---|
| Age (years) | 60.0 ± 12.3 | 63.1 ± 9.5 | 0.1645 |
| Weight (kg) | 67.8 ± 13.1 | 62.0 ± 9.9 | 0.0192 |
| BMI (kg/m2) | 24.3 ± 3.6 | 23.1 ± 3.3 | 0.0913 |
| BSA (m2) | 1.8 ± 0.2 | 1.7 ± 0.2 | 0.0165 |
| CCr (ml/min) | 99.6 ± 35.2 | 87.9 ± 27.9 | 0.0709 |
| TP (g/L) | 61.9 ± 7.4 | 69.1 ± 12.2 | 0.0011 |
| ALB (g/L) | 39.3 ± 5.1 | 37.8 ± 4.4 | 0.1239 |
| ALT (U/L) | 27.8 ± 25.5 | 22.6 ± 17.1 | 0.2329 |
| AST (U/L) | 22.5 ± 12.0 | 22.1 ± 13.3 | 0.8787 |
| ALP (U/L) | 84.4 ± 30.3 | 80.2 ± 27.4 | 0.4767 |
3.2. PopPK Modeling
It was determined that a one‐compartment model with first‐order absorption and elimination provides the best fit for the PK data of lenalidomide, according to the AIC and GOF plots. The model was parametrized by the absorption rate constant (Ka), apparent distribution volume (V/F) and apparent clearance (CL/F). Due to the limited data, with only one observed point in the absorption phase and one in the elimination phase obtained from two plasma concentration points, the estimates for Ka and V/F were not considered reliable. As a result, the previously reported Ka of 8.34 h−1 was applied in this study, while only interindividual variability in CL/F was taken into account. The additive residual model had the highest OFV (1725.2) among the tested residual models, while the combined and proportional residual models had a similarly lower OFV (1562.66 and 1562.46, respectively), but the additive error component in the combined residual model could not be precisely determined [coefficients of variation (%CV) > 7000%]. Therefore, the proportional residual model was applied to lenalidomide. The allometric scaling factor was included in the base model, which resulted in a marked reduction in the OFV from 1562.46 to 1546.79 (ΔOFV = 15.67). Furthermore, as shown in Figure S1, the inclusion of allometric scaling based on weight in the base model resulted in a better goodness of fit for the observation points, particularly in terms of the peak concentration, which now exhibits a closer alignment with the identity line.
In the forward inclusion step, CCr and disease type showed a significant influence on CL. In the backward elimination step, the effect of disease type was removed because of an increase in OFV < 10.83 (Table S1). The OFV of the final population PK model was 1530.89, which was 15.9 less than that of the base model. Notably, the inclusion of CCr as a covariate of CL/F resulted in a decrease in BSV from 17.9% to 15.8%, suggesting that 11.7% of BSV in CL/F is explained by CCr. The final expression is as follows:
Where CCr is the creatinine clearance for an individual, θCCr represents the effects of CCr on CL/F, ηCL/F is an independent variable with a mean of 0 and a variance of 0.025. The population pharmacokinetic parameter estimates for the base and final models and their relative standard errors, covariate effects, and bootstrap results are all summarized in Table 3. The parameter variances and covariate effects of the final model were satisfactory, which suggested that the model estimated the parameters well.
TABLE 3.
Population pharmacokinetic parameter estimates for base, final model, and bootstrap results.
| Parameter | Base model (RSE%) | Final model (RSE%) | Bootstrap (95% CI) | |
|---|---|---|---|---|
| Fixed effects | ||||
| tvKa (h−1) [17] | 8.34 (fixed) | 8.34 (fixed) | 8.34 | |
|
| ||||
| tvCL/F | 7.4 (5.84) | 7.4 (5.66) | 7.4 (6.74–8.24) | |
| θCCr | 0.25 (30.88) | 0.25 (0.14–0.34) | ||
|
| ||||
| tvV/F | 37.6 (6.71) | 37.4 (6.37) | 37.4 (33.40–42.13) | |
| Random effects | ||||
| ηCL/F, %CV | 17.9 (22.4) | 15.8 (22.2) | 15.7 (18.8–11.7) | |
| RV, %CV | 50.4 (13.4) | 49.5 (13.0) | 48.9 (41.7–56.1) | |
Abbreviations: RSE%, percentage relative standard error; RV, residual variability; tv, the population typical value of the parameter; ηCL, interindividual variability of CL/F; θCCr, effect of CCr on CL/F.
3.3. Model Evaluation
The GOF plots are shown in Figure 1 and suggest good agreement between the observed and predicted concentrations of the final model. CObs vs. IPRED (Figure 1A) and PRED (Figure 1B) are evenly distributed on both sides of the identity line. In addition, the vast majority of CWRES in the final model are distributed within the desired range (y = ±2), and the fitted overall trend line is close to the axis where the residuals are zero (y = 0), indicating that the bias in the model of predicted values is minimal (Figure 1C,D).
FIGURE 1.
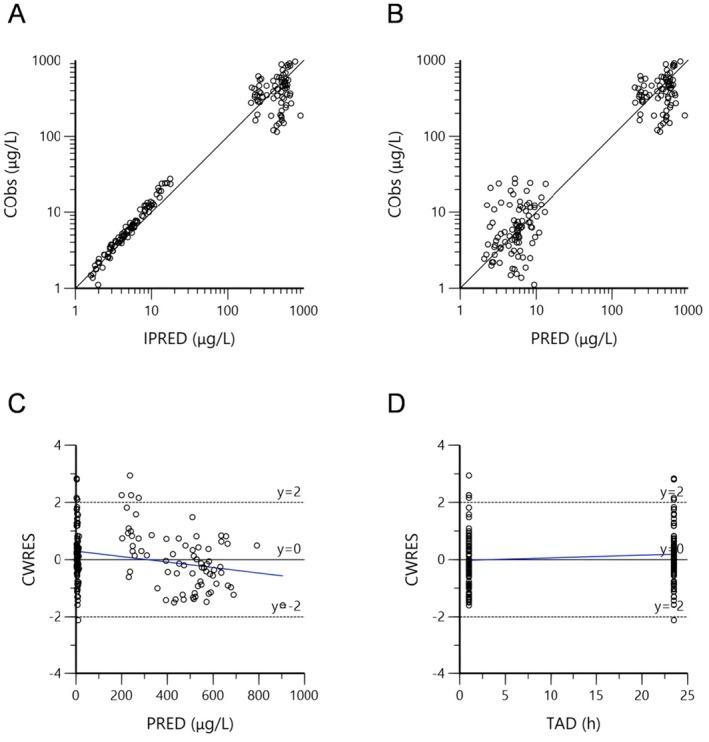
Diagnostic goodness‐of‐fit plots of the final model. (A) Concentration observations versus individual predictions (IPRED); (B) concentration observations versus population predictions (PRED); (C) conditional weighted residuals (CWRES) versus PRED; (D) CWRES versus time after dose (TAD). The solid lines in (A) and (B) represent the line of agreement and in (C) and (D) the axis with residuals of 0. The dashed lines in (C) and (D) represent the ideal range of CWRES (y = ±2). The blue lines are the linear regression lines.
As shown in Table 3, the median, along with the 2.5th and 97.5th quantiles of each parameter in the bootstrap result, remains consistent with the parameter estimates of the final model, which means that the final model is sufficiently stable. It is clear from the pcVPC result of the final model (Figure 2) that the observed and fitted values of lenalidomide concentrations follow the same trend, which indicates a receivable overlap between the observed and predicted values.
FIGURE 2.
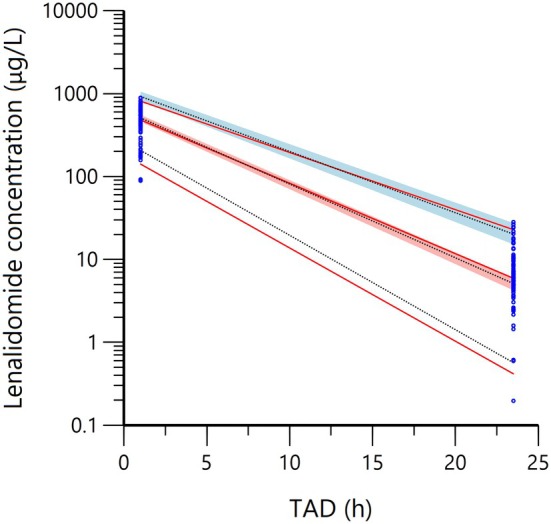
Prediction‐corrected visual prediction check of the final model. Blue dots represent observed concentrations, red lines represent the 5th, 50th and 95th quartiles of observed concentrations, black lines represent the 5th, 50th and 95th quartiles of simulated values, and shaded areas represent 90% confidence intervals for the 5th, 50th and 95th quartiles of simulated values.
3.4. Model‐Informed Precision Dosing
To determine the maximal dose without hematotoxicity in patients with various renal functions, the concentration of lenalidomide 30 min prior to the fourth dose (Cmin) following three consecutive doses (steady state) was simulated. As shown in Figure 3A, patients with normal renal function (CCr = 90 mL/min) can tolerate all therapeutic doses. Patients with CCr greater than 60 mL/min often do not require dosage modification in most cases. For patients with CCr of 30–60 mL/min the ideal dose range is 10–15 mg/day. However, those with CCr of 15–30 mL/min can only tolerate a dose of less than 10 mg/day.
FIGURE 3.
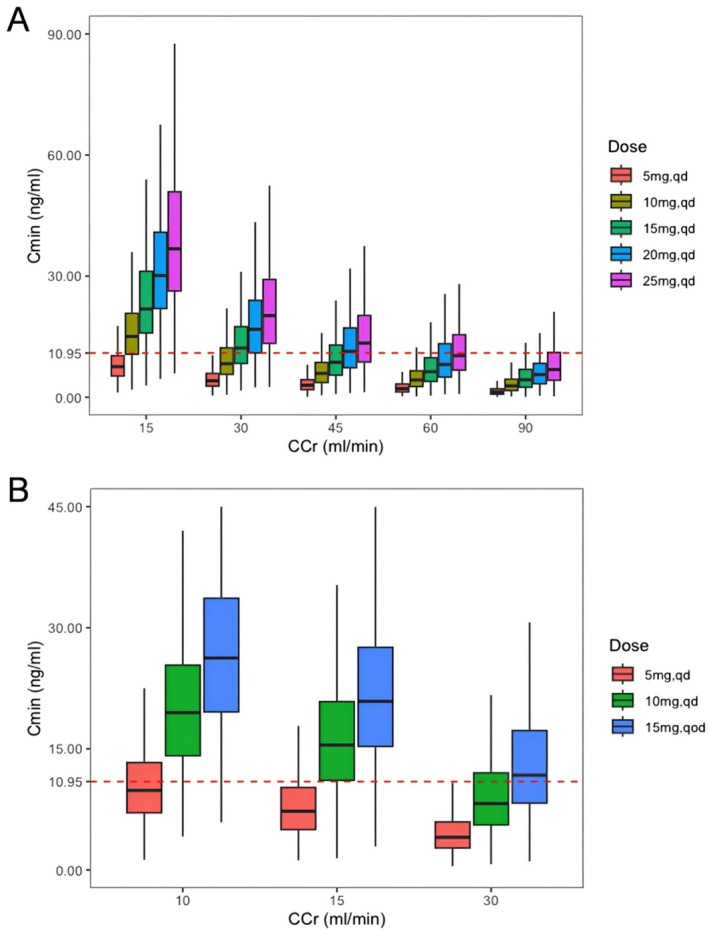
Comparison of Cmin estimates in Chinese patients taking different dosage regimens of lenalidomide. (A) Patients with varying CCr (15–90 mL/min); (B) Patients with severely impaired renal function. The 25th and 75th quartiles (box), median (black line in the box) and upper and lower limits of normal (error bar) are displayed. The red dashed line running parallel to the X‐axis denotes a Cmin level of 10.95 ng/mL. Qd, Once a day; Qod, Once every other day.
After further analyzing the simulation results for patients with severe kidney injury (Figure 3B), for patients with CCr of 10 mL/min, for instance, the median Cmin is 9.9 ng/mL, the 25th quantile is 7.1 ng/mL, and the 75th quantile is 13.3 ng/mL when taking a dose of 5 mg/day. This indicates that almost half of the patients exceed 10.95 ng/mL, suggesting that there is still a certain level of hematotoxicity risk associated with the dosing regimen of 5 mg/day. Additionally, for patients with CCr of 30 mL/min who take a dose of 15 mg every other day, the median Cmin was 11.8 ng/mL. For patients with CCr of 15 mL/min who take a dose of 15 mg every other day, the 25th quantile Cmin is 15.5 ng/mL. When given the dose of 10 mg/day, the median Cmin is 8.2 ng/mL in patients with CCr of 30 mL/min, and 11.1 ng/mL in patients with CCr of 15 mL/min. Therefore, for patients with CCr of 15–30 mL/min who do not usually require dialysis compared to the dosing regimen of 15 mg every other day, there exists a relatively lower risk of hematotoxicity when administered with 5 or 10 mg/day.
By employing the established model and a previously reported PopPK model [16], the current investigation portrays the Cmin and PK exposures (AUC0‐24h) between the Chinese and non‐Asian populations, as exemplified in Figures 4 and 5, respectively. Regarding patients with severe renal injury (CCr < 30 mL/min), the Chinese population demonstrated higher Cmin levels than the non‐Asian population across all dosage regimens, and the difference is more noticeable at a higher dose (Figure 4A). The median Cmin increases from 4.2 ng/mL to 21.4 ng/mL in the Chinese population and from 3.4 ng/mL to 16.0 ng/mL in the predominantly non‐Asian population when the dose is increased from 5 mg/day to 25 mg/day (Figure 4A). Additionally, this trend was also observed in patients with moderate renal injury (CCr of 30–60 mL/min, Figure 4B). Besides, there was no significant difference in Cmin levels between Chinese and non‐Asian patients with CCr in the 60–90 mL/min range (Figure 4C). However, it is worth mentioning that, even in patients with normal renal function (CCr = 90 mL/min), Chinese patients exhibited a significantly larger AUC0‐24 h than the predominantly non‐Asian population at the same dosage (Figure 5). For instance, the median [interquartile range (IQR)] AUC0‐24 h at the dose of 25 mg was 3376.7 [3028.0–3729.6] mg/L/h in the Chinese population and 2046.9 [1402.6–2873.9] mg/L/h in the predominantly non‐Asian population, respectively.
FIGURE 4.
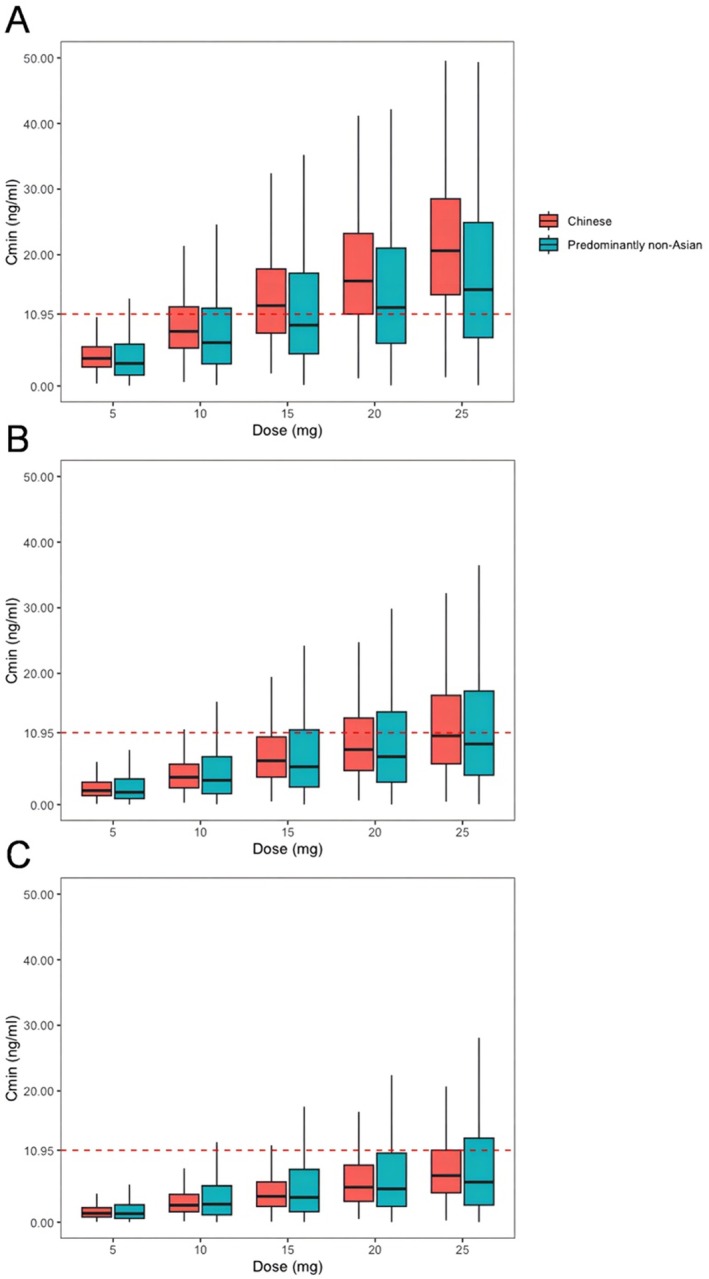
Comparison of Cmin estimates among ethnic groups with different levels of renal function. (A) Severe renal injury, CCr < 30 mL/min; (B) moderate renal injury, CCr of 30–60 mL/min range; (C) mild renal injury or normal renal function, CCr of 60‐90 mL/min range. The 25th and 75th quartiles (box), median (black line in the box) and upper and lower limits of normal (error bar) are displayed. The red dashed line running parallel to the X‐axis denotes a Cmin level of 10.95 ng/mL. The red box is the Chinese population, and the blue box is the predominantly non‐Asian population.
FIGURE 5.
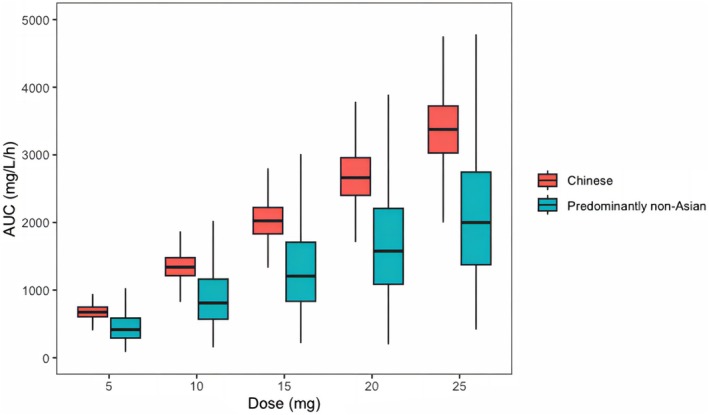
Comparison of PK exposure estimates by racial groups with normal renal function. The bold horizontal bars represent the median value of the estimated AUC024 h.
4. Discussion
Lenalidomide is currently widely used in B‐cell malignancies, including MM and multiple B‐cell NHL [24, 25]. Our previous research has elucidated the correlation between the plasma concentration and hematological toxicity [11], whereas the PopPK model supporting MIPD implementation of lenalidomide for the Chinese population is still lacking. Therefore, we paid more attention to Chinese patients with MM and B‐cell NHL in the present study. We aimed to provide a model‐informed dosing recommendation for patients with altered renal function.
The population pharmacokinetics of lenalidomide in Chinese patients with B‐cell malignancies were well described by a one‐compartment model with first‐order absorption and elimination. Weight was incorporated into the base model with an allometric exponent of 0.75 for CL/F and 1 for V/F, which resulted in a significant reduction in OFV. The addition of allometric scaling improves the stability of the underlying model. All the covariates were introduced into the base model to undergo a stepwise process. After forward inclusion and backward elimination, only CCr was identified as the key covariate for CL/F. Renal function was identified to be a considerable covariate of lenalidomide PK in the Chinese population. This is consistent with previous PopPK studies of lenalidomide [15, 16, 17]. Meanwhile, it is well known that lenalidomide is mainly excreted in its prototype through the kidneys, which supports our results that the patient's CCr has a significant impact on drug clearance [26, 27]. In our PopPK model, the estimated impact factor of CCr on drug clearance is an exponent of 0.25, which means that lower CCr leads to slower drug elimination, but the relationship between CCr and CL/F is nonlinear. When the CCr is reduced by half, drug clearance decreases by approximately 15.9%. This change is significantly larger than that in previous PopPK models [15, 16], indicating that CCr changes may have a more significant impact on lenalidomide clearance in the Chinese population. However, our study found that CCr only explains 11.7% of the inter‐individual variability in CL/F, while the remaining 88.3% may be attributed to other factors such as genetic polymorphisms of renal drug transporters and drug–drug interactions. Therefore, the specific conditions of individual patients should also be taken into consideration when setting a rational dosing regimen in clinical practice.
Regarding previous PopPK studies of lenalidomide, most of them primarily focused on the predominantly non‐Asian groups [15, 16, 17]. The final model, like other models in the literature [15, 16, 17], uses a one‐compartment model to describe the pharmacokinetic characteristics of lenalidomide. However, Hughes used a seven transit compartments model [16], Guglieri‐López employed a three transit compartments model [15], and Connarn introduced the absorption lag time parameter to describe drug absorption [17]. Due to the limited number of absorption sampling points in our study, the parameters and model structure used to describe drug absorption characteristics are less comprehensive than those in their models [15, 16, 17]. Regarding the covariates included in the final model, similar to other studies, we selected CCr as a significant covariate for CL/F. Additionally, other factors such as weight, BSA, and fat free mass were identified as significant covariates for V/F, which is similar to our inclusion of the allometric scaling model based on weight in the base model.
Our investigation showed that renal function is a crucial determinant of dosage regime modification for Chinese patients in daily clinical practice. For patients with mild kidney injury (CCr of 60–90 mL/min), it is feasible to adjust the dosage according to the instructions in most cases. In patients with severe renal insufficiency (CCr < 30 mL/min), the drug instructions recommend 15 mg every other day for patients who do not require dialysis and 5 mg/day for those who require dialysis. However, whether dialysis is required or not, the MIPD data indicate that there is a high risk of lenalidomide overexposure (Cmin > 10.95 ng/mL) and hematotoxicity when administered simply in accordance with the aforementioned regimens from drug instructions. Therefore, the findings support that lower lenalidomide doses may be a better fit for Chinese patients from a safety perspective, especially in patients with severe renal damage. To maximize medication safety, practitioners should fully utilize the PopPK model in conjunction with TDM to select an individualized optimal dosage regimen.
By comparing the Cmin and AUC0‐24 h between Chinese and predominantly non‐Asian populations, we have observed that Chinese patients tend to experience higher levels, especially in patients with severe renal damage. Specifically, the typical value of CL/F was 7.4 L/h, which is lower than that of predominantly non‐Asian patients who take the same lenalidomide dosage (ranging from 12 to 18 L/h), resulting in a higher exposure. When given the recommended dose by drug instructions, it has also been seen in clinical practice that the Chinese population has a poor tolerance and is susceptible to adverse effects, which is also consistent with our findings in this present study. Therefore, under the same circumstances, a relatively lower therapeutic dose may be more appropriate for the Chinese population. The exposure differences observed between these two groups may be attributed to inherent racial covariates (such as muscle mass, dietary habits) and the calculation of serum creatinine clearance. Notably, when including a mixture of races (including Asian, Black, White and others) in the PopPK modeling, the clinical characteristic of race was not shown to be a significant covariate for CL/F or V/F in Connarn's study [17]. In other words, we proposed that data from Chinese patients tend to show a higher exposure than data from a mixture of races (predominantly non‐Asians), whereas the pairwise differences between two ethnic groups were not reported in Connarn's study [17]. These two findings are not entirely in conflict. Additionally, the subjects of Connarn's study [17] comprised both healthy volunteers and patients with hematological malignancies; differences in the diagnosis of included populations may also help explain the discrepancy between our findings.
Given that the hematological toxicity of lenalidomide has become a wide clinical concern, we try to propose some suggestions for pushing forward clinical management of hematological toxicity due to lenalidomide overexposure. First, the patient's baseline renal function should be fully considered when determining the starting dose. For Chinese patients with severe renal injury, a lower starting dose than the recommended dose by drug instructions may be more appropriate. Second, other concomitant drugs causing myelosuppression (e.g., cytotoxic drugs) should also be assessed prior to the initiation of lenalidomide treatment, and the adjustment of concomitant drugs should be performed if necessary. Third, we would encourage practitioners to conduct TDM of lenalidomide Cmin on at least day 3 after starting LEN therapy. For patients with Cmin of 10.95 ng/mL at a high risk of developing hematological toxicity [11], further individual dose adjustments can be made based on the established PopPK model and MIPD in this current study. Last but not least, patients should be well educated to have complete blood count (CBC) assessment regularly to monitor for hematological toxicity, especially for patients with renal insufficiency.
Several limitations should be considered when interpreting our findings. First, despite being a multicenter study, there is still room for further improvement in the sample size. Second, there were relatively fewer timing points of blood collection because our samples were taken from real‐world data rather than clinical trials. Due to the limited data in the absorption phase, accurate estimation of Ka is not credible. As an alternative, we applied values reported previously. Using a fixed Ka would lead to inaccurate estimation of drug exposure for this population when simulating drug exposure under the condition of CCr < 15 mL/min in MIPD. Because gastrointestinal dysfunction may occur in people with renal failure, which relates to electrolyte imbalance and accumulation of metabolic toxins. Furthermore, given that the samples collected during the elimination phase are all trough concentrations, we could not estimate the BSV of V/F and determine the covariates that may influence V/F. Nevertheless, CL/F is a critical index for patients undergoing long‐term pharmacotherapy, and CL/F and its covariate influences could be properly assessed [28]. Third, the GOF plots suggest that the model predicts peak concentration (Cmax) less accurately than Cmin. Nevertheless, for the sake of patient safety, it is imperative to ensure an accurate estimation of Cmin. Finally, we were unable to construct a PopPK model using the original data of other races from published literature, and thus we were unable to evaluate race as a covariate to reach a more definitive conclusion. However, based on the MIPD results and real clinical practice, it can be proposed that the tolerable dose in the Chinese population may be lower. Considering the above limitations, the findings need to be further confirmed in a larger population, and more data of concentrations at more timing points might be helpful in optimizing the PopPK model in future research.
5. Conclusion
A PopPK model was developed using data from Chinese patients in real clinical settings, and CCr was identified to affect the PK characteristics of lenalidomide. Model‐based simulation suggests that Chinese patients exhibited a higher exposure than predominantly non‐Asian patients at all dosage regimens, especially in patients with severe renal damage (CCr < 30 mL/min). Additionally, a model‐informed dosage regimen suggests that a lower dose rather than the regimens from drug instructions is recommended for Chinese patients with severe renal impairment to avoid hematological toxicity due to lenalidomide overexposure. In conclusion, an individualized dosage strategy based on TDM and MIPD would be preferable from a safety perspective compared to dose adjustment in accordance with drug instructions.
Author Contributions
Y.M., Z.S., H.B., and R.Z. wrote the manuscript. R.Z., Y.M., and Z.S. designed the research. Y.M., Z.S., and H.B. performed the research. Y.M., Z.S., H.B., H.H., and L.Z. analyzed the data.
Ethics Statement
This study was in compliance with the Declaration of Helsinki and was approved by the Peking University Third Hospital Medical Science Research Ethics Committee (No. M2021573).
Consent
Informed consent was obtained from all subjects involved in the study.
Conflicts of Interest
The authors declare no conflicts of interest.
Supporting information
Data S1.
Funding: This work was supported by the Beijing Natural Science Foundation (7244474) and the National Natural Science Foundation of China (NSFC) (72304007, 72474013, 72074005).
Yi Ma, Zaiwei Song and Hao Bing contributed equally to this work.
Data Availability Statement
The data presented in this study are available on request from the corresponding author. The data are not publicly available due to ethical reasons as per local guidelines.
References
- 1. Gonzalez‐Lugo J. D., Kambhampati S., Yacoub A., et al., “Lenalidomide and Eltrombopag for Treatment of Low‐Or Intermediate‐Risk Myelodysplastic Syndrome: Result of a Phase II Clinical Trial,” Clinical Cancer Research 29 (2023): 60–66. [DOI] [PubMed] [Google Scholar]
- 2. Duong V. H., Komrokji R. S., and List A. F., “Efficacy and Safety of Lenalidomide in Patients With Myelodysplastic Syndrome With Chromosome 5q Deletion,” Therapeutic Advances in Hematology 3 (2012): 105–116. [DOI] [PMC free article] [PubMed] [Google Scholar]
- 3. Kulig P., Milczarek S., Bakinowska E., Szalewska L., Baumert B., and Machaliński B., “Lenalidomide in Multiple Myeloma: Review of Resistance Mechanisms, Current Treatment Strategies and Future Perspectives,” Cancers (Basel) 15 (2023): 963. [DOI] [PMC free article] [PubMed] [Google Scholar]
- 4. Wang X., Yu L., Jiang X., and Ding K., “Real‐World Data for Lenalidomide Maintenance in Responding Patients of Diffuse Large B‐Cell Lymphoma,” Cancer Medicine 12 (2023): 10553–10562. [DOI] [PMC free article] [PubMed] [Google Scholar]
- 5. Blair H. A., “Lenalidomide: A Review in Previously Treated Follicular Lymphoma,” Drugs 80 (2020): 1337–1344. [DOI] [PubMed] [Google Scholar]
- 6. Chen N., Lau H., Kong L., et al., “Pharmacokinetics of Lenalidomide in Subjects With Various Degrees of Renal Impairment and in Subjects on Hemodialysis,” Journal of Clinical Pharmacology 47 (2007): 1466–1475. [DOI] [PubMed] [Google Scholar]
- 7. Chen N., Zhou S., and Palmisano M., “Clinical Pharmacokinetics and Pharmacodynamics of Lenalidomide,” Clinical Pharmacokinetics 56 (2017): 139–152. [DOI] [PMC free article] [PubMed] [Google Scholar]
- 8. Bridoux F., Chen N., Moreau S., et al., “Pharmacokinetics, Safety, and Efficacy of Lenalidomide Plus Dexamethasone in Patients With Multiple Myeloma and Renal Impairment,” Cancer Chemotherapy and Pharmacology 78 (2016): 173–182. [DOI] [PubMed] [Google Scholar]
- 9. Komrokji R. S. and List A. F., “Short‐ and Long‐Term Benefits of Lenalidomide Treatment in Patients With Lower‐Risk Del(5q) Myelodysplastic Syndromes,” Annals of Oncology 27 (2016): 62–68. [DOI] [PMC free article] [PubMed] [Google Scholar]
- 10. Cheson B. D., Morschhauser F., and Martin P., “Management of Adverse Events From the Combination of Rituximab and Lenalidomide in the Treatment of Patients With Follicular and Low‐Grade Non‐Hodgkin Lymphoma,” Clinical Lymphoma, Myeloma & Leukemia 20 (2020): 563–571. [DOI] [PubMed] [Google Scholar]
- 11. Song Z., Ma L., Bao L., et al., “Toward Therapeutic Drug Monitoring of Lenalidomide in Hematological Malignancy? Results of an Observational Study of the Exposure‐Safety Relationship,” Frontiers in Pharmacology 13 (2022): 931495. [DOI] [PMC free article] [PubMed] [Google Scholar]
- 12. Kang J. S. and Lee M. H., “Overview of Therapeutic Drug Monitoring,” Korean Journal of Internal Medicine 24 (2009): 1–10. [DOI] [PMC free article] [PubMed] [Google Scholar]
- 13. Kobayashi T., Miura M., Niioka T., et al., “Phase II Clinical Trial of Lenalidomide and Dexamethasone Therapy in Japanese Elderly Patients With Newly Diagnosed Multiple Myeloma to Determine Optimal Plasma Concentration of Lenalidomide,” Therapeutic Drug Monitoring 40 (2018): 301–309. [DOI] [PubMed] [Google Scholar]
- 14. Darwich A. S., Polasek T. M., Aronson J. K., et al., “Model‐Informed Precision Dosing: Background, Requirements, Validation, Implementation, and Forward Trajectory of Individualizing Drug Therapy,” Annual Review of Pharmacology and Toxicology 61 (2021): 225–245. [DOI] [PubMed] [Google Scholar]
- 15. Guglieri‐López B., Pérez‐Pitarch A., Moes D. J. A. R., et al., “Population Pharmacokinetics of Lenalidomide in Multiple Myeloma Patients,” Cancer Chemotherapy and Pharmacology 79 (2017): 189–200. [DOI] [PubMed] [Google Scholar]
- 16. Hughes J. H., Phelps M. A., Upton R. N., et al., “Population Pharmacokinetics of Lenalidomide in Patients With B‐Cell Malignancies,” British Journal of Clinical Pharmacology 85 (2019): 924–934. [DOI] [PMC free article] [PubMed] [Google Scholar]
- 17. Connarn J. N., Hwang R., Gao Y., Palmisano M., and Chen N., “Population Pharmacokinetics of Lenalidomide in Healthy Volunteers and Patients With Hematologic Malignancies,” Clinical Pharmacology in Drug Development 7 (2018): 465–473. [DOI] [PubMed] [Google Scholar]
- 18. Hou J., Du X., Jin J., et al., “A Multicenter, Open‐Label, Phase 2 Study of Lenalidomide Plus Low‐Dose Dexamethasone in Chinese Patients With Relapsed/Refractory Multiple Myeloma: The MM‐021 Trial,” Journal of Hematology & Oncology 6 (2013): 41. [DOI] [PMC free article] [PubMed] [Google Scholar]
- 19. Anderson B. J., Allegaert K., and Holford N. H., “Population Clinical Pharmacology of Children: Modelling Covariate Effects,” European Journal of Pediatrics 165 (2006): 819–829. [DOI] [PubMed] [Google Scholar]
- 20. Holford N. H., “A Size Standard for Pharmacokinetics,” Clinical Pharmacokinetics 30 (1996): 329–332. [DOI] [PubMed] [Google Scholar]
- 21. Chen N., Kasserra C., Reyes J., Liu L., and Lau H., “Single‐Dose Pharmacokinetics of Lenalidomide in Healthy Volunteers: Dose Proportionality, Food Effect, and Racial Sensitivity,” Cancer Chemotherapy and Pharmacology 70 (2012): 717–725. [DOI] [PubMed] [Google Scholar]
- 22. Chen N., Wen L., Lau H., Surapaneni S., and Kumar G., “Pharmacokinetics, Metabolism and Excretion of [(14)C]‐Lenalidomide Following Oral Administration in Healthy Male Subjects,” Cancer Chemotherapy and Pharmacology 69 (2012): 789–797. [DOI] [PMC free article] [PubMed] [Google Scholar]
- 23. Revlimid [Lenalidomide] (Celgene Corporation, 2022). [Google Scholar]
- 24. Liu J., Mi R., Chen L., Guo X., Liang T., and Yin Q., “Efficacy and Safety of Lenalidomide in Diffuse Large B‐Cell Lymphoma: A Meta‐Analysis of Randomized Controlled Trials,” Clinical and Experimental Medicine 23 (2023): 1161–1169. [DOI] [PMC free article] [PubMed] [Google Scholar]
- 25. Xu T., Yang Y., Li J., et al., “Real World Outcomes of Lenalidomide or Bortezomib Maintenance in Patients With Multiple Myeloma Not Undergoing Stem Cell Transplantation,” Annals of Hematology 102 (2023): 1171–1184. [DOI] [PubMed] [Google Scholar]
- 26. Hofmeister C. C., Yang X., Pichiorri F., et al., “Phase I Trial of Lenalidomide and CCI‐779 in Patients With Relapsed Multiple Myeloma: Evidence for Lenalidomide‐CCI‐779 Interaction via P‐Glycoprotein,” Journal of Clinical Oncology 29 (2011): 3427–3434. [DOI] [PMC free article] [PubMed] [Google Scholar]
- 27. Salama E., Lam S., Gonsalves W. I., Tzachanis D., Momper J. D., and M. Saunders I., “Estimation of Kidney Function in Patients With Multiple Myeloma: Implications for Lenalidomide Dosing,” Annals of Pharmacotherapy 57 (2023): 29–35. [DOI] [PMC free article] [PubMed] [Google Scholar]
- 28. Holford N. H. and Buclin T., “Safe and Effective Variability—A Criterion for Dose Individualization,” Therapeutic Drug Monitoring 34 (2012): 565–568. [DOI] [PubMed] [Google Scholar]
Associated Data
This section collects any data citations, data availability statements, or supplementary materials included in this article.
Supplementary Materials
Data S1.
Data Availability Statement
The data presented in this study are available on request from the corresponding author. The data are not publicly available due to ethical reasons as per local guidelines.