

ABSTRACT
This systematic review investigated differences in daily energy intake among genotypes of circadian clock genes, potentially supporting personalized nutritional strategies for health. This topic can help develop personalized nutritional strategies for metabolic health by evaluating SNPs in circadian clock genes that may influence dietary intake. We searched the PubMed, EMBASE, and Cochrane Library databases following PRISMA guidelines and assessed the risk of bias using the Joanna Briggs Institute (JBI) tool (PROSPERO: CRD42024601530). Ten studies were included, involving 12,115 adult and elderly participants (mean age 40.8 ± 8.6 years; 60.6% women). Six studies investigated the SNP CLOCK rs1801260, while four analyzed the SNPs CLOCK rs4580704, CLOCK rs3749474, CRY1 rs2287161, and CRY2 rs11605924, with one study for each. Only one study found an association between the minor allele of CLOCK rs1801260 and increased energy, carbohydrate, and lipid intake, as well as later meal timing. Individuals with at least one risk allele (C) had higher intake and later mealtimes than those with the wild‐type allele (TT). The inconsistent associations across studies may be attributed to methodological limitations, including dietary assessment, sample size, genetic model classification, population characteristics, and environmental factors, such as including dietary patterns, chronotype, night shift work, sleep, and meal timing. Future research should adopt more comprehensive approaches to better clarify the impact of circadian gene variants on eating behavior.
Keywords: circadian clocks, energy intake, genotype, mealtimes, single nucleotide polymorphism
The study used PubMed, Embase, and Cochrane databases, screening with Rayyan QCRY. Ten studies were included, totaling 12 115 adults (40.8 ± 8.6 years, mostly women). SNPs analyzed were CLOCK (rs1801260, rs4580704, rs3749474) and Cry1/Cry2 (rs2287161, rs11605924). No studies examined Bmal, PER, Rev‐erb, or ROR SNPs. Only Rahati et al. found a significant link between CLOCK rs1801260 and the primary and secondary aims. Methodological and environmental limitations may explain inconsistent associations.

1. Introduction
The circadian clock regulates behavioral and mood rhythms, as well as cellular processes and physiological functions, throughout the light–dark cycle [1, 2]. The circadian rhythm, which follows a 24‐h cycle, is the most extensively studied and influences a wide range of biological functions [1, 2]. This rhythm synchronizes the organism with its environment to maintain physiological processes regulated over time [1, 3, 4]. The circadian clock is understood as central, located in the hypothalamus and regulated by the light–dark cycle in the suprachiasmatic nuclei (SCN), and peripheral, present in other tissues such as the liver, muscles, adipose tissue, and intestine [1, 4, 5].
The transcription of clock genes regulates the circadian rhythm at the cellular level, including clock circadian regulator (CLOCK), basic helix–loop–helix ARNT like 1 (Bmal1), basic helix–loop–helix ARNT like 2 (Bmal2), period circadian regulator 1 (PER1), period circadian regulator 2 (PER2), period circadian regulator 3 (PER3), cryptochrome circadian regulator 1 (CRY1) and cryptochrome circadian regulator 2 (CRY2). At the molecular level, there is a central cycle in which positive transcriptional activators such as CLOCK and BMAL1 form a heterodimer (CLOCK:BMAL1), which induces the expression of the PER1/2/3 and CRY1/2 genes by binding to specific DNA sequences known as E‐boxes. The PER and CRY proteins accumulate in the cytoplasm and inhibit CLOCK:BMAL activity through negative feedback, without affecting transcription. Once PER and CRY are degraded, the cycle resumes, maintaining a 24‐h rhythm [5, 6]. The CLOCK:BMAL1 heterodimer is also involved in an accessory loop that is interconnected with the core cycle, inducing the expression of nuclear receptors, such as nuclear receptor subfamily 1 group D member 1 (NR1D1), also know as Rev‐erbα and RAR related orphan receptor A (RORA), also known Rorα [5, 6, 7, 8]. These receptors regulate the transcription of Bmal1, with REV‐ERBα acting as a repressor and RORα as an activator [5, 7, 8]. Together, they form a secondary feedback loop that reinforces and stabilizes the core E‐box‐mediated cycle [9].
The circadian misalignment, induced by factors such as inadequate exposure to sunlight, irregular sleep patterns, or unhealthy food intake, negatively affects factors involved in energy balance and weight control. At the same time, disruptions in light–dark and feeding/fasting cycles appear to promote metabolic patterns related to obesity [10]. Furthermore, circadian rhythm disturbances have been associated with an increased risk of cardiometabolic diseases, including impaired glycemic control, type 2 diabetes, and obesity [4, 11]. In this context, the deletion of the Bmal2 gene (a paralog of Bmal1) can lead to metabolic alterations, such as mild obesity, changes in energy and food metabolism patterns, and circadian changes, including the loss of rhythmicity of metabolic genes in brain clocks [12]. Additionally, studies with adipose tissue‐specific Bmal1 knockout mice and PER and CRY mutants showed inhibition of BMAL1 production, which was correlated with suppressed leptin expression in adipose tissue [13]. Similarly, a systematic review compiled evidence from animal studies indicating that multi‐tissue Clock mutant mice exhibit reduced gene expression and disrupted circadian regulation [14] [15]). These alterations result in a phenotype characterized by increased food intake and obesity, with these effects being modulated by genetic background [15]. Moreover, genetic disruptions in the clock network, such as mutations, can affect glucose homeostasis, partly due to impaired insulin secretion and defects in pancreatic islet proliferation, as well as hypertriglyceridemia, possibly resulting from increased intestinal lipid absorption and hepatic overproduction [15].
In turn, Single Nucleotide Polymorphism (SNP) refers to variations in single base pairs of genomic DNA that naturally occur in normal individuals [16]. These polymorphisms can occur in coding regions or regulatory functions, but are most often found in intergenic regions with no determined function. Therefore, not all SNPs have a phenotypic impact [17]. Polymorphisms in the CLOCK gene, specifically the C allele of SNP rs1801260, have been associated with shorter sleep duration and delayed sleep onset in patients with depression and bipolar disorder [18]. SNPs in genes such as PER2, CRY1, REV‐ERBα, and CLOCK have also been linked to metabolic disorders [19]. The PER2 SNP rs2304672C>G has been associated with abdominal obesity, with its minor allele linked to a higher likelihood of excessive snacking, diet‐related stress, skipping breakfast, and abandoning dietary treatment for obesity compared to non‐carriers [20]. The SNP rs3749474 of the CLOCK gene is associated with a higher BMI compared to non‐carriers. Additionally, carriers of the minor allele exhibit higher fat intake and a significantly increased risk of overweight or obesity [21, 22].
The development of a systematic review with this focus is justified by the need to compile scientific literature data on the influence of key SNPs in circadian CLOCK genes on food consumption. Considering the increasing prevalence of obesity and the changes in sleep patterns, studying the relationship between two factors influencing these conditions—SNPs in circadian CLOCK genes and food consumption—may provide opportunities for personalized nutritional strategies aimed at metabolic health by integrating principles of precision nutrition [10, 23, 24, 25].
This review aims to investigate the effect of SNPs in CLOCK, 1/2, PER, CRY, Rev‐erb, and ROR genes on daily energy intake in adults. As secondary objectives, the review analyzes whether these SNPs influence macronutrient intake or meal timing. The findings may contribute to the development of personalized dietary approaches, considering each patient's circadian individuality and how their food consumption responds to these factors.
2. Materials and Methods
This systematic review was conducted following the Preferred Reporting Items for Systematic Reviews and Meta‐Analyses (PRISMA) guidelines [26]. The review protocol was registered in the International Prospective Register of Systematic Reviews (PROSPERO: CRD42024601530). The research was based on the components of the PECO acronym (P = Population; E = Exposure; C = Comparison; O = Outcome), guided by the question: “Is food consumption different between individuals with the risk allele or the wild‐type allele of circadian clock genes SNPs?” (Table S1). As secondary outcomes, we looked for differences in macronutrient intake and meal timing between the genotypes. Due to the type of study, ethical approval was not required under local legislation.
2.1. Search Strategy
Three electronic databases were used for the bibliographic search: PubMed, Embase, and Cochrane Library. The search was conducted in October 2024 in duplicate, without applying filters or language restrictions. Controlled descriptors were selected based on Medical Subject Headings (MeSH), Descriptors in Health Sciences (DeCS), and Emtree terms in English. Additionally, free terms related to the topic were included. Boolean operators OR and AND were used to connect terms during the search.
The search strategy included the terms “Single Nucleotide Polymorphisms” AND (Clock OR Bmal OR Per OR Rev‐erba OR Ror OR “Circadian Rhythm”) AND (“energy intake” OR carbohydrate OR protein OR lipid), along with their synonyms, abbreviations, and plurals according to each database (Table S2).
2.2. Inclusion and Exclusion Criteria
The inclusion criteria were original articles that evaluated humans and at least one SNP of circadian clock genes and energy intake. Participants included adults (≥ 18 years) and/or the elderly (≥ 60 years) of both sexes and any health condition, except cancer and gastrointestinal diseases. No restrictions were placed on article publication dates.
The exclusion criteria included reviews, book chapters, conference abstracts or proceedings, letters to the editor, publications without full‐text availability, animal studies, and manuscripts that did not meet the inclusion criteria.
2.3. Screening and Selection of Articles
The references identified were imported into the Rayyan QCRY software [27]. Using this tool, duplicates were removed, and two independent reviewers (P.F.F. and L.T.C.) manually screened titles and abstracts in parallel based on the inclusion and exclusion criteria. In cases of disagreement during the title and abstract screening process, the article was included in the full‐text review phase. Discrepancies identified during the full‐text evaluation, including challenges in retrieving necessary data and related uncertainties, were resolved through consensus between the two reviewers (P.F.F. and L.T.C.). Full‐text articles were accessed through institutional access via CAPES (https://www‐periodicos‐capes‐gov‐br.ez35.periodicos.capes.gov.br/).
2.4. Risk of Bias Assessment
All studies included in the systematic review were individually assessed for risk of bias by two researchers (P.F.F. and L.T.C.), independently and in parallel. Any discrepancies in the assessments, such as divergences in blinding domains, were resolved by consensus. The assessment was conducted using the Joanna Briggs Institute (JBI) critical appraisal tools for each type of study [28, 29]. Studies were classified as low (> 70%), moderate (50%–70%), or high risk of bias (< 50%) based on the percentage of affirmative responses [30].
2.5. Data Extraction
After selecting the studies, the aspects considered for the synthesis table were determined by consensus among the authors. Data extracted from each study were the authors and year of publication, study design, country of origin, sample characteristics (sample size, sex, and age), SNPs and their alleles, dietary intake (daily energy intake, carbohydrates, proteins, and lipids) and time of meal. Two authors (P.F.F and L.T.C) extracted the data and reviewed the information to ensure accuracy.
3. Results
3.1. Selection and Characteristics of the Studies
A total of 2112 references were retrieved from the PubMed, Embase, and Cochrane Library databases. After duplicate removal, 1994 titles remained. During the screening of titles and abstracts, 1980 records were excluded based on the initial exclusion criteria. Of the 14 titles accepted for full‐text reading, four were excluded because they did not compare daily energy intake between the SNP alleles. At the end of the process, 10 articles were included in this systematic review (Figure 1).
FIGURE 1.
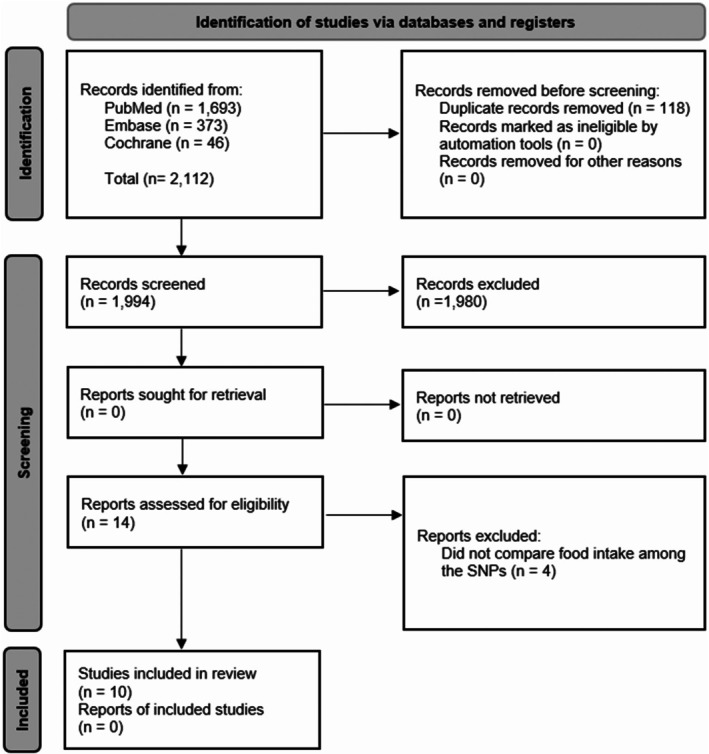
PRISMA flowchart of bibliographic search procedures and study selection [26].
This systematic review included six cross‐sectional studies, one case–control study, two randomized controlled trials (RCTs), and one quasi‐experimental study. Six of the articles were conducted in Spain, two in Iran, one in the United States, and one in Japan. The initial total sample consisted of 12 115 adults and elderly individuals, with an average age of 40.8 ± 8.6, predominantly women (60.6%; n = 7346). The SNPs of the CLOCK gene were studied, including rs1801260 [31, 32, 33, 34, 35, 36], rs4580704 [37], rs3749474 [38], as well as the CRY1 and CRY2 genes, respectively, rs2287161 [39] and rs11605924 [40]. No studies were found that evaluated daily energy for SNPs of the Bmal1/2, PER, Rev‐erb, and ROR genes (Table 1).
TABLE 1.
Methodological characteristics of the studies.
| References | Country | Study type | Number of participants | Years (mean ± SD) | Characteristics of participants | Method of collecting food consumption | ||
|---|---|---|---|---|---|---|---|---|
| Total | Men | Women | ||||||
| Garaulet et al. [34] | Spain | Quasi‐experimental | 1495 | 262 | 1233 | 39.4 ± 12.3 | Overweight or Obesity (BMI 25 a 40 kg/m2) | 24‐h dietary recall |
| Bandín et al. [32] | Spain | Cross‐Sectional | 85 | — | 85 | 43.0 ± 12.0 | Overweight (BMI 25 a 29.9 kg/m2) | 24‐h dietary recall |
| Galbete et al. [33] | Spain | Cross‐Sectional | 903 | 657 | 246 | 69.0 ± 6.0 | Elderly population in general | FFQ |
| Yamaguchi et al. [35] | Japan | Cross‐Sectional | 95 | — | 95 | 19.6 ± 0.2 | Without comorbidities | 2‐day dietary records |
| Mirzaei et al. [40] | USA | RCT | 721 | 280 | 441 | 51.0 ± 9.2 | Overweight or Obesity (BMI 25 a 40 kg/m2) | 5‐day dietary records |
| Corella et al. [37] | Spain | RCT | 7098 | 3028 | 4070 | 67.0 ± 6.2 | DM2 or 3 or more cardiovascular risk factors | FFQ |
| Murube et al. [38] | Spain | Cross‐Sectional | 898 | 329 | 569 | 41.0 ± 12.0 | General population without severe illness | 3‐day dietary records |
| Mirzababaei et al. [39] | Iran | Cross‐Sectional | 377 | — | 377 | 36.7 ± 9.1 | Overweight or Obesity (BMI 25 a 45 kg/m2) | FFQ |
| Yang et al. [36] | Spain | Case–control | 40 | — | 40 | 44.2 ± 10.5 | Overweight or Obesity (BMI > 25 kg/m2) | 7‐day dietary records |
| Rahati et al. [31] | Iran | Cross‐Sectional | 403 | 213 | 190 | 36.5 ± 8.7 | Overweight or Obesity (BMI 25 a 40 kg/m2) | 7‐day dietary records |
Abbreviations: BMI, Body Mass Index; DM2, Type 2 diabetes mellitus; FFQ, Semi‐quantitative food frequency questionnaire; RCT, Randomized Controlled Trials; SD, Standard Deviation; USA, United States of America.
3.2. Clock SNPs
Six studies investigated daily energy intake in relation to the CLOCK SNP rs1801260, and only one of them observed differences between the genotypes. Rahati et al. [31] identified higher daily energy intake in participants with at least one risk allele (TC), while those with a homozygous genotype (CC) showed the highest values. For the CLOCK rs4580704, CLOCK rs3749474, CRY1 rs2287161, and CRY2 rs11605924, only one study was found for each, and none indicated differences in daily energy intake between the genotypes (Table 2).
TABLE 2.
Food intake and meal times according to clock gene polymorphisms.
| References | Gene | SNP | Genotype | Food consumption | Meal times | |||||
|---|---|---|---|---|---|---|---|---|---|---|
| Energy intake (kcal/d) | Carbohydrates (g/d) | Protein (g/d) | Lipids (g/d) | Breakfast (h ± min) | Lunch (h ± min) | Dinner (h ± min) | ||||
| Garaulet et al. [34] | CLOCK | rs1801260 | TT | 2070 ± 35 | 151 ± 3 | 85 ± 2 | 87 ± 2 | — | — | — |
| CC + CT | 2087 ± 38 | 146 ± 3 | 87 ± 2 | 96 ± 2 | — | — | — | |||
| p | 0.741 | 0.149 | 0.257 | 0.894 | — | — | — | |||
| Bandín et al. [32] | CLOCK | rs1801260 | TT | 1818 ± 578 | — | — | — | 8:48 ± 98 | 14:50 ± 33 | 21:26 ± 51 |
| TC + CC | 2078 ± 771 | — | — | — | 9:24 ± 60 | 14:47 ± 30 | 21:27 ± 49 | |||
| p | 0.486 | — | — | — | 0.130 | 0.670 | 0.580 | |||
| Galbete et al. [33] | CLOCK | rs1801260 | TT | 2256 ± 660 | 254 ± 100 | 103 ± 38 | 85 ± 29 | — | — | — |
| TC + CC | 2232 ± 637 | 245 ± 89 | 102 ± 28 | 86 ± 31 | — | — | — | |||
| p | 0.581 | 0.180 | 0.811 | 0.414 | — | — | — | |||
| Yamaguchi et al. [35] | CLOCK | rs1801260 | TT | 1582 ± 55 | — | — | — | — | — | — |
| TC + CC | 1653 ± 55 | — | — | — | — | — | — | |||
| p | 0.399 | — | — | — | — | — | — | |||
| Yang et al. [36] | CLOCK | rs1801260 | TT | 1893 ± 601 | — | — | — | 8:35 ± 48 | 14:20 ± 23 | 21:25 ± 24 |
| TC + CC | 1980 ± 767 | — | — | — | 9:30 ± 64 | 14:51 ± 29 | 21:32 ± 32 | |||
| p | NS | — | — | — | NS | NS | NS | |||
| Rahati et al. [31] | CLOCK | rs1801260 | TT | 2096 ± 437 ab | 310 ± 80 a | 83 ± 25 | 62 ± 18 ab | 7:48 ± 54 ab | 13:42 ± 42 ab | 20:12 ± 48 ab |
| TC | 2232 ± 416 a | 323 ± 66 b | 82 ± 20 | 77 ± 24 a | 8:36 ± 60 a | 14:30 ± 54 a | 21:00 ± 48 a | |||
| CC | 2434 ± 526 b | 355 ± 92 ab | 88 ± 25 | 84 ± 22 b | 9:18 ± 60 b | 15.06 ± 54 b | 21:30 ± 48b | |||
| p | < 0.001* | 0.001* | 0.180 | < 0.001* | < 0.001* | < 0.001* | < 0.001* | |||
| Corella et al. [37] | CLOCK | rs4580704 | CC | 2275 ± 603 | 240 ± 81 | 92 ± 23 | 99 ± 30 | — | — | — |
| CG | 2281 ± 605 | 239 ± 81 | 93 ± 23 | 99 ± 31 | — | — | — | |||
| GG | 2272 ± 605 | 240 ± 81 | 93 ± 23 | 98 ± 30 | — | — | — | |||
| p | 0.887 | 0.987 | 0.558 | 0.510 | — | — | — | |||
| Murube et al. [38] | CLOCK | rs3749474 | TT | 2325 ± 508 | 214 ± 39 | 99 ± 17 | 106 ± 16 | — | — | — |
| TC | 2202 ± 484 | 212 ± 33 | 97 ± 15 | 97 ± 14 | — | — | — | |||
| CC | 2258 ± 466 | 224 ± 38 | 99 ± 16 | 101 ± 15 | — | — | — | |||
| p | 0.159 | 0.305 | 0.717 | 0.250 | — | — | — | |||
| Mirzaei et al. [40] | Cry 2 | rs11605924 | AA | 1900 ± 509 | — | — | — | — | — | — |
| AC | 2006 ± 586 | — | — | — | — | — | — | |||
| CC | 1948 ± 548 | — | — | — | — | — | — | |||
| p | 0.280 | — | — | — | — | — | — | |||
| Mirzababaei et al. [39] | Cry 1 | rs2287161 | GG | 2740 ± 828 | 392 ± 131 | 94 ± 32 | 95 ± 31 | — | — | — |
| GC + CC | 2635 ± 798 | 372 ± 12 | 92 ± 31 | 98 ± 34 | — | — | — | |||
| p | 0.270 | 0.170 | 0.610 | 0.540 | — | — | — | |||
Note: Values are presented as mean ± standard deviation. a, b: statistical difference between genotypes.
Abbreviations: NS, not significant; SNP, single nucleotide polymorphism.
p‐value statistically significant.
Six studies evaluated carbohydrate, protein, and lipid intake according to clock SNPs. Three articles examined the CLOCK SNP rs1801260, while SNPs CLOCK rs4580704, CLOCK rs3749474, and CRY2 rs2287161 were each analyzed in a single study. Rahati et al. [31] found that the presence of the risk allele of CLOCK SNP rs1801260 was associated with higher consumption of carbohydrates and lipids (Table 2).
Three studies investigated the relationship between meal timing and the CLOCK SNP rs1801260. Only the study by Rahati et al. [31] found that participants with at least one risk allele tended to have later meals (Table 2).
A meta‐analysis was deemed infeasible in this systematic review due to the significant heterogeneity among the included studies. There was variation in methodological design, study populations, and the tools used for dietary data collection. Moreover, not all SNPs were assessed across all studies, making it unfeasible to perform pooled effect estimates. Finally, the findings were inconsistent primarily and not replicable, with only one study reporting a statistically significant association with the outcomes of interest [26].
3.3. Risk of Bias
Most studies provided sufficient information and had a low risk of bias (80%; n = 8). Only 10% (n = 1) of the studies showed a high risk of bias, and 10% showed a moderate risk of bias (n = 1). The risk of bias for each type of study is present in Figures 2 and 3.
FIGURE 2.
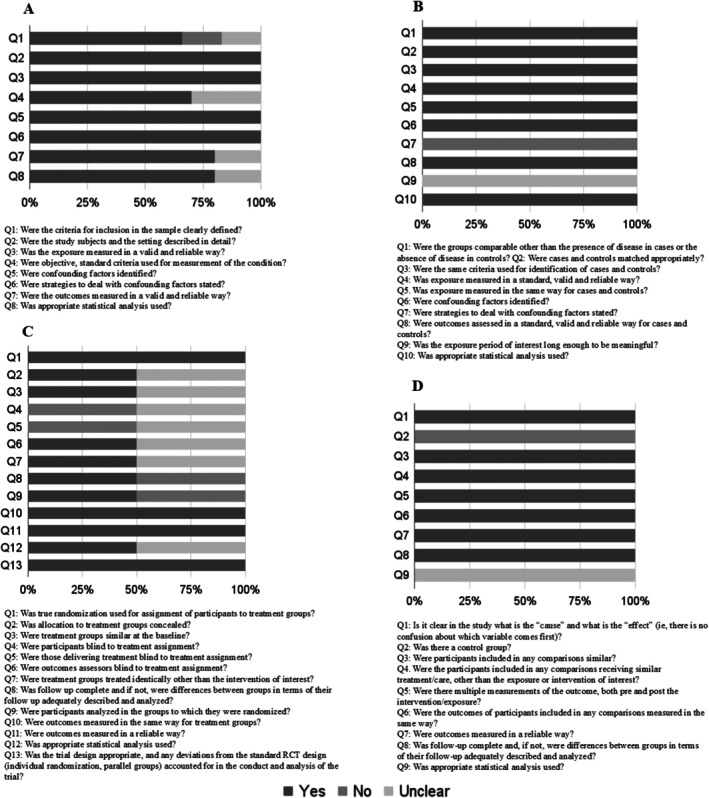
Risk of bias assessment for cross‐sectional (A), case–control (B), randomized controlled trials (C) and quasi‐experimental studies (D).
FIGURE 3.
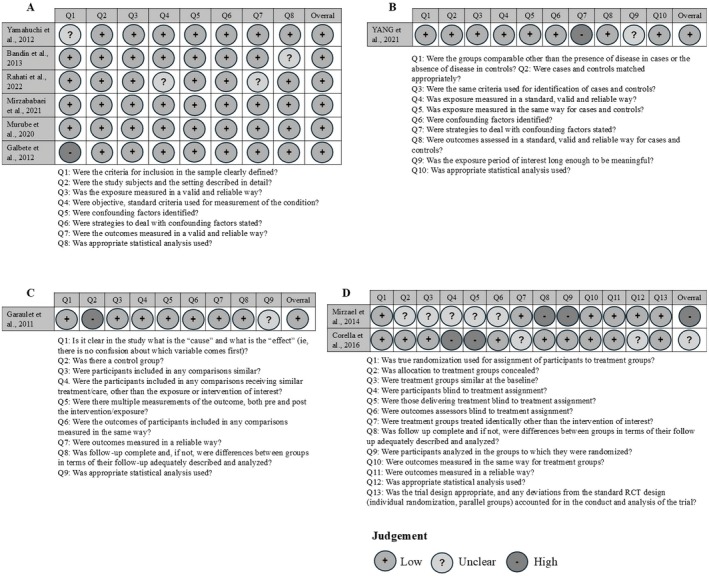
Risk of bias assessment of each study according to design: Cross‐sectional (A), case–control (B), quasi‐experimental studies (C) and randomized controlled trials (D).
Regarding cross‐sectional studies (n = 6), all domains exceeded a 60% acceptance rate. However, domain 1 had an article that did not present adequacy of the inclusion criteria and also had an article that was unclear on this subject. The domains on criteria and standardization to measure the study condition (domain 4), reliability and validity of the measurement of results (domain 7) and appropriate statistical analysis (domain 8) had articles that were unclear on this information.
As for the case–control study (n = 1), the identification of confounding factors (domain 7) was not presented, and it was unclear whether the exposure period of interest was sufficient to be significant (domain 9).
In the RCT studies (n = 2) 50% did not report on the blinding of participants or administrators of the treatments (domains 4 and 5, respectively), and 50% were unclear about these aspects. Concealed allocation of groups, similarity between treatment groups, blinding of evaluators, identical treatment (except for the intervention) in both groups, and appropriate statistical analysis (domains 2, 3, 6, 7 and 12 in that order) were unclear in 50% of the RCT studies. Complete group follow‐up and analysis according to randomization were not presented in 50% of the studies (domains 7 and 8). Domains 1, 10, 11, and 13 were fully reported in all articles.
The quasi‐experimental study (n = 1) did not meet the criterion regarding the existence of a control group (domain 2), and it was unclear whether the statistical analysis used was appropriate (domain 9).
4. Discussion
This systematic review explored differences in daily energy, macronutrient intake, and meal timings according to clock gene SNPs. Among the 10 studies included, six focused on the CLOCK SNP rs1801260, while the CLOCK SNPs rs4580704, CLOCK rs3749474, CRY1 rs2287161, and CRY2 rs11605924 were each analyzed in a single study each Only one study reported significant findings, linking the risk allele (C) of CLOCK SNP rs1801260 to higher energy, carbohydrates, and lipids intake, as well as later meal timing compared to the wild‐type allele (TT). No studies evaluated daily energy intake in relation to SNPs of the BMAL1/2, PER, Rev‐erb, and ROR genes.
The association between dietary intake and CLOCK gene variants was identified in only one study, with the findings likely influenced by unassessed confounding factors. Circadian disruptors, such as shift work, chronotype, insufficient sleep, and irregular meal timings, affect biological processes and disrupt the synchronization between central, peripheral, and molecular clocks [41]. The central clock regulates peripheral clocks located in various organs of the body. This system relies on transcription‐translation feedback loops, known as molecular clocks, to maintain cellular function [5]. Based on this framework, we hypothesize that the influence of SNPs may be amplified in conditions of pronounced circadian disruption.
The study by Rahati et al. [31] identified that individuals with the minor allele of the SNP rs1801260 in the CLOCK gene exhibited higher energy and macronutrient intake. Franzago et al. [10] demonstrated that this SNP is associated with various changes, including reduced sleep, altered ghrelin levels, nighttime food preferences, increased susceptibility to obesity, and difficulty with weight restriction. Garaulet et al. [21] have observed that carriers of the minor allele are more resistant to weight loss and metabolic changes induced by restrictive diets, as well as having higher BMI. These findings reinforce how the SNP rs1801260 is linked to metabolic alterations, eating behavior, and weight gain—factors that can directly influence dietary intake.
Animal model studies also provide important insights into how the CLOCK gene influences food intake. CLOCK gene mutant animals have shown alterations in the normal pattern of daytime feeding and developed hyperphagia and, consequently, obesity [42]. Mutations in the CLOCK gene can also affect macronutrient absorption. Pan and Hussain [43] observed that CLOCK mutant mice exhibited increased intestinal absorption of lipids and monosaccharides and decreased peptide absorption when compared to wild‐type mice. These findings suggest that the CLOCK gene plays a role not only in regulating feeding behavior, but also in intestinal absorption mechanisms. However, further studies are needed to understand how these effects manifest in humans.
Shift work is defined as employment outside conventional working hours and involves exposure to light at biologically inappropriate times [41, 44, 45]. This constitutes a pronounced form of circadian disruption and is particularly relevant in studies on biological rhythms [41, 45]. Nighttime light exposure can misalign cortisol, body temperature, and melatonin rhythms [45]. Regarding diet, night shift workers often alter meal timings, redistribute energy intake over the 24‐h period, increase snacking, and choose less healthy foods compared to daytime workers [41, 44, 46]. For example, in one study, nurses working night shifts showed higher intake of fats, sweets, and cereals, and lower consumption of fiber‐rich foods [47]. These dietary changes affect the hormonal regulation of appetite, increase meal skipping, and elevate the risk of cardiometabolic diseases [41]. Therefore, in addition to shift work itself, these variables should be carefully considered in research on circadian clocks and their health implications. Given its influence on eating patterns and metabolic regulation, shift work represents an important variable in studies focused on dietary intake. The relationship between shift work and phase delays in circadian clock genes, which may influence food intake, remains inconclusive. While some studies demonstrate this association, others do not, with discrepancies attributed to differences in study duration, length of night shift exposure, and measurement methodologies [45].
Chronotype is a marker of circadian phase that classifies individuals based on their preferences for activity and rest timing [48], and is categorized as morning, intermediate, or evening type [49]. In evening chronotypes, exposure to light at inappropriate times—especially in the early evening—can cause circadian disruptions due to phase delays [41, 46]. Furthermore, individuals with this chronotype tend to have poorer dietary quality, with higher energy density, lower physical activity levels, and greater cardiovascular risk compared to morning and intermediate types [41]. For instance, individuals with an evening chronotype often eat later, which may interfere with peripheral clocks in the liver and pancreas, negatively impacting optimal metabolism [41, 46]. In this context, a genome‐wide association study on chronotypes suggested that allelic variants in or near the PER1, PER2, PER3, and CRY1 genes affecting the modification and regulation of the circadian clock contribute to population‐level variation in chronotype [50]. Moreover, other studies have shown that carriers of the 3111C allele or CC genotype of the CLOCK gene, as well as mutations in the PER3 gene, exhibit evening preferences [51, 52]. Conversely, polymorphisms in the PER1 and PER2 genes have been associated with morning habits [53]. Therefore, chronotype and meal timing are essential factors to be considered in studies of food intake, particularly those investigating SNPs in circadian clock genes, since these elements also influence sleep and circadian phase.
The presence of polymorphisms in circadian clock genes can also impact sleep duration and sleep‐related characteristics. In an animal model study, the deletion of Bmal1 in SCN VIP neurons resulted in reduced NREM sleep during the subjective light phase, leading to a redistribution of sleep–wake activity [54]. In a Japanese cohort study, the rs11113179 variant in CRY1 was associated with an increased likelihood of sleep onset difficulties. Additionally, the rs1026071 and rs1562438 variants in Bmal1 were also significantly associated with sleep initiation problems [55]. Furthermore, a Korean longitudinal study found that individuals carrying the C allele of SNP rs10002541, located in the CLOCK gene, exhibited a more pronounced reduction in sleep duration compared to individuals homozygous for the T allele. SNPs rs4580704 and rs6850524, also located in the same gene, were likewise associated with a greater decrease in sleep duration [56]. Haplotype analysis of the CLOCK gene showed that individuals carrying less common SNP combinations (GCCTC or CGTTC) had a significantly shorter sleep duration compared to those with the most common haplotype (CGTCT), suggesting a potential combined functional effect of these variants on sleep patterns [56]. Studies have shown that these alterations in sleep patterns can negatively affect diet quality by increasing the consumption of snacks and fats [57], as well as carbohydrates, sugars, and foods with a high glycemic index and load [58]. Yang et al. [59] observed that moderate sleep restriction increased hunger and food cravings, contributing to excessive energy intake. Therefore, understanding how specific polymorphisms in circadian clock genes influence sleep duration and quality is essential, as such alterations may trigger behavioral and metabolic changes that compromise dietary patterns.
An important circadian clock disruptor is meal timing, which was assessed in only three studies. Research indicates a secular trend toward later eating patterns [41, 60]. Late eating habits have been associated with adverse health outcomes, such as an increased risk of overweight/obesity, glucose intolerance, and reduced insulin secretion [61, 62]. A significant aspect related to meal timing is breakfast skipping, which was not evaluated in any of the studies reviewed. Skipping breakfast has been linked to poorer diet quality, such as lower intake of whole grains and fiber [63], and a higher risk of overweight and obesity [64]. Conversely, in the study by Gwin and Leidy [65], eating breakfast was associated with reduced appetite and food reward, increased satiety, and a decrease in unhealthy snack consumption compared to skipping breakfast.
In studies that found no association between SNPs and dietary intake, it is essential to consider factors that may have influenced these results. A well‐defined methodology is crucial to ensure reliable and validated findings [66]. Dietary assessment tools such as the 24‐h Dietary Recall (24HR), Dietary Record (DR), and Food Frequency Questionnaire (FFQ) are widely used but can present methodological variations [67]. The 24hHR is popular for providing detailed data but may lack precision due to reliance on the respondent's memory [67, 68]. The DR is collected over one or more days, preferably at the time of consumption, which can reduce memory bias but may introduce reactivity bias, altering food choices [67]. The FFQ, being simple and cost‐effective, quantifies intake based on frequency and portion size, offering a rough estimate of daily intake [67, 68]. However, its accuracy in energy quantification is generally inferior to that of the 24hHR and DR, making it recommended only when other methods are unavailable [67].
Moreover, achieving reliable results depends on a well‐trained interviewer and the use of strategies that facilitate the process, such as software and application methodologies like the Automated Multiple‐Pass Method (AMPM) for the 24hHR [67, 69]. The choice of method should also take into account the research objective, the relevance of dietary intake data, the time required for data collection, financial constraints, interview duration, and the characteristics of both the interviewer and the respondent [67, 70]. In this review, the FFQ was utilized in two studies: one randomized controlled trial (RCT) and one cross‐sectional study. In both cases, no statistically significant associations were found between the variables of interest and the outcomes reviewed.
Sample size is a critical factor for the validity and reliability of studies, particularly in epidemiological and genomic association research [71, 72]. Sample size calculations must account for alpha and beta errors, which represent the likelihood of false‐positive or false‐negative results, directly influencing the study's statistical power. Lower alpha and beta error rates enhance the robustness of conclusions [71, 73]. The prevalence of the disease and effect size are inversely related to sample size: lower values for these parameters necessitate a larger number of participants to achieve statistically significant results. Furthermore, higher allele frequencies, particularly for minor alleles, and stronger linkage disequilibrium reduce the sample size requirements [71, 73].
Genetic models (dominant, recessive, and additive) must be accurately specified to avoid reducing the study's statistical power. Classification errors, such as the misclassification of genotypes and phenotypes, can compromise the results but are challenging to quantify during the study design phase [71, 73]. Variants in circadian clock genes likely exert a modest effect on dietary intake, which may be influenced by polymorphism prevalence. This effect can be obscured if the sample size is insufficient or if the analyses lack robustness [71, 73, 74]. Therefore, sample size must be carefully planned and integrated with hypothesis development, study design, sampling techniques, and data analysis to ensure reliable outcomes [75].
Furthermore, the characteristics of the study population should be considered. Only three articles included populations without comorbidities, while the majority included individuals with comorbidities, especially overweight and obesity. Leptin resistance, commonly observed in individuals with obesity [76], is a relevant condition characterized by decreased responsiveness to leptin, even at high concentrations, leading to hyperleptinemia [77]. Leptin resistance can affect the regulation of food intake, nutrient absorption, metabolism, and insulin resistance, disrupting energy balance [77]. Other SNPs in genes related to food consumption and excess weight may also be present in the studied population, necessitating larger studies that account for these confounding factors [78]. Therefore, when evaluating food intake, it is essential to consider pathological and intrinsic factors in the participants that may influence the results.
One of the strengths of this review is the compilation of articles from the literature investigating CLOCK genes and their relationship with dietary intake. Additionally, it discusses the key aspects that should be considered in genomic association studies involving SNPs of circadian clock genes and food consumption.
On the other hand, it also has limitations. No studies were found evaluating the relationship between food consumption and the SNPs of the Bmal1/2, PER, Rev‐erb, and ROR genes, which limits the scope of the conclusions of this review, as these genes play essential roles in regulating the circadian clock and may also influence eating behavior and metabolism. Finally, the review is based on a population that already has significant metabolic conditions related to food consumption. Therefore, it may not capture the full complexity of the genetic interactions that regulate eating patterns, leaving out potentially relevant variants.
This review identified only one study associating SNPs of circadian CLOCK genes to daily energy, macronutrient intake, and meal timing, while SNPs of the Bmal1/2, PER, Rev‐erb, and ROR genes and their relation to food intake have not been explored yet. The findings suggest that the absence of consistent associations between circadian CLOCK gene SNPs and dietary behaviors may be attributed to methodological and environmental limitations. Future research should adopt more comprehensive approaches incorporating both qualitative and quantitative analyses of eating patterns, as well as factors like night shift work, chronotype, sleep quality, and meal timing. Such methodologies are essential to better understand the role of circadian gene variants in eating behavior.
Author Contributions
L. T. C. and P. F. F. conceived and developed the research and contributed to writing the manuscript. D. M. U. P. R. assisted in study methodology and designing the search strategy. A. C. P. K., H. H. M. H., and J. B. contributed throughout the manuscript development process with input on methodology, result presentation, and discussion development. All authors were involved in reviewing the manuscript.
Conflicts of Interest
The authors declare no conflicts of interest.
Supporting information
Table S1: fsb270913‐sup‐0001‐TableS1.docx.
Table S2: fsb270913‐sup‐0001‐TableS1.docx.
Acknowledgments
We would like to thank everyone who contributed to the elaboration of this systematic review, whether through suggestions, discussions, or technical support. The Article Processing Charge for the publication of this research was funded by the Coordenação de Aperfeiçoamento de Pessoal de Nível Superior ‐ Brasil (CAPES) (ROR identifier: 00x0ma614).
Campos L. T., Fonseca P. F., Rocha D. M. U. P., Bressan J., Kravchychyn A. C. P., and Hermsdorff H. H. M., “Food Intake According to Clock Gene Polymorphisms: A Systematic Review,” The FASEB Journal 39, no. 15 (2025): e70913, 10.1096/fj.202500951R.
Funding: This work was supported by the CAPES Foundation (Ministry of Education, code 001), FAPEMIG (Research Support Foundation of the State of Minas Gerais), the Ministry of Health (MoH, Brazil), and the National Council for Scientific and Technological Development—CNPq, through the Brazilian Program for Genomics and Precision Health—Genomas Brasil (grant number CNPq/MS 444037/2023‐3). HHM Hermsdorff and J Bressan are CNPq research productivity fellows.
Data Availability Statement
Data sharing is not applicable to this article as no datasets were generated or analyzed during the current study.
References
- 1. Crnko S., Du Pré B. C., Sluijter J. P. G., and Van Laake L. W., “Circadian Rhythms and the Molecular Clock in Cardiovascular Biology and Disease,” Nature Reviews. Cardiology 16, no. 7 (2019): 437–447, 10.1038/s41569-019-0167-4. [DOI] [PubMed] [Google Scholar]
- 2. Montaruli A., Castelli L., Mulè A., et al., “Biological Rhythm and Chronotype: New Perspectives in Health,” Biomolecules 11, no. 4 (2021): 487, 10.3390/biom11040487. [DOI] [PMC free article] [PubMed] [Google Scholar]
- 3. Hood S. and Amir S., “The Aging Clock: Circadian Rhythms and Later Life,” Journal of Clinical Investigation 127, no. 2 (2017): 437–446, 10.1172/jci90328. [DOI] [PMC free article] [PubMed] [Google Scholar]
- 4. Mentzelou M., Papadopoulou S. K., Papandreou D., et al., “Evaluating the Relationship Between Circadian Rhythms and Sleep, Metabolic and Cardiovascular Disorders: Current Clinical Evidence in Human Studies,” Metabolites 13, no. 3 (2023): 370, 10.3390/metabo13030370. [DOI] [PMC free article] [PubMed] [Google Scholar]
- 5. Schrader L. A., Ronnekleiv‐Kelly S. M., Hogenesch J. B., Bradfield C. A., and Malecki K. M. C., “Circadian Disruption, Clock Genes, and Metabolic Health,” Journal of Clinical Investigation 134, no. 14 (2024): e170998, 10.1172/JCI170998. [DOI] [PMC free article] [PubMed] [Google Scholar]
- 6. Jagannath A., Taylor L., Wakaf Z., Vasudevan S. R., and Foster R. G., “The Genetics of Circadian Rhythms, Sleep and Health,” Human Molecular Genetics 26, no. R2 (2017): R128–R138, 10.1093/hmg/ddx240. [DOI] [PMC free article] [PubMed] [Google Scholar]
- 7. Bonaconsa M., Malpeli G., Montaruli A., Carandente F., Grassi‐Zucconi G., and Bentivoglio M., “Differential Modulation of Clock Gene Expression in the Suprachiasmatic Nucleus, Liver and Heart of Aged Mice,” Experimental Gerontology 55 (2014): 70–79, 10.1016/j.exger.2014.03.011. [DOI] [PubMed] [Google Scholar]
- 8. Hastings M. H., Reddy A. B., and Maywood E. S., “A Clockwork Web: Circadian Timing in Brain and Periphery, in Health and Disease,” Nature Reviews Neuroscience 4, no. 8 (2003): 649–661, 10.1038/nrn1177. [DOI] [PubMed] [Google Scholar]
- 9. Mao W., Ge X., Chen Q., and Li J.‐D., “Epigenetic Mechanisms in the Transcriptional Regulation of Circadian Rhythm in Mammals,” Biology 14, no. 1 (2025): 42, 10.3390/biology14010042. [DOI] [PMC free article] [PubMed] [Google Scholar]
- 10. Franzago M., Alessandrelli E., Notarangelo S., Stuppia L., and Vitacolonna E., “Chrono‐Nutrition: Circadian Rhythm and Personalized Nutrition,” International Journal of Molecular Sciences 24, no. 3 (2023): 2571, 10.3390/ijms24032571. [DOI] [PMC free article] [PubMed] [Google Scholar]
- 11. Poggiogalle E., Jamshed H., and Peterson C. M., “Circadian Regulation of Glucose, Lipid, and Energy Metabolism in Humans,” Metabolism 84 (2018): 11–27, 10.1016/j.metabol.2017.11.017. [DOI] [PMC free article] [PubMed] [Google Scholar]
- 12. Dantas‐Ferreira R., Ciocca D., Vuillez P., et al., “Deletion of the Clock Gene Bmal2 Leads to Alterations in Hypothalamic Clocks, Circadian Regulation of Feeding, and Energy Balance,” Journal of Neuroscience 44, no. 19 (2024): e1886232024, 10.1523/JNEUROSCI.1886-23.2024. [DOI] [PMC free article] [PubMed] [Google Scholar]
- 13. Kettner N. M., Mayo S. A., Hua J., Lee C., Moore D. D., and Fu L., “Circadian Dysfunction Induces Leptin Resistance in Mice,” Cell Metabolism 22, no. 3 (2015): 448–459, 10.1016/j.cmet.2015.06.005. [DOI] [PMC free article] [PubMed] [Google Scholar]
- 14. Lowrey P. L. and Takahashi J. S., “Genetics of the Mammalian Circadian System: Photic Entrainment, Circadian Pacemaker Mechanisms, and Posttranslational Regulation,” Annual Review of Genetics 34, no. 1 (2000): 533–562, 10.1146/annurev.genet.34.1.533. [DOI] [PubMed] [Google Scholar]
- 15. Huang W., Ramsey K. M., Marcheva B., and Bass J., “Circadian Rhythms, Sleep, and Metabolism,” Journal of Clinical Investigation 121, no. 6 (2011): 2133–2141, 10.1172/jci46043. [DOI] [PMC free article] [PubMed] [Google Scholar]
- 16. Brookes A. J., “The Essence of SNPs,” Gene 234, no. 2 (1999): 177–186, 10.1016/s0378-1119(99)00219-x. [DOI] [PubMed] [Google Scholar]
- 17. Caetano A. R., “SNP Markers: Basic Concepts, Applications in Animal Breeding and Management and Perspectives for the Future,” Revista Brasileira de Zootecnia 38 (2009): 64–71, 10.1590/S1516-35982009001300008. [DOI] [Google Scholar]
- 18. Barclay N. L., Eley T. C., Mill J., et al., “Sleep Quality and Diurnal Preference in a Sample of Young Adults: Associations With 5HTTLPR, PER3, and CLOCK 3111,” American Journal of Medical Genetics. Part B, Neuropsychiatric Genetics 156, no. 6 (2011): 681–690, 10.1002/ajmg.b.31210. [DOI] [PubMed] [Google Scholar]
- 19. Ribas‐Latre A. and Eckel‐Mahan K., “Interdependence of Nutrient Metabolism and the Circadian Clock System: Importance for Metabolic Health,” Molecular Metabolism 5, no. 3 (2016): 133–152, 10.1016/j.molmet.2015.12.006. [DOI] [PMC free article] [PubMed] [Google Scholar]
- 20. Garaulet M., Corbalán M. D., Madrid J. A., et al., “CLOCK Gene Is Implicated in Weight Reduction in Obese Patients Participating in a Dietary Programme Based on the Mediterranean Diet,” International Journal of Obesity 34, no. 3 (2010): 516–523, 10.1038/ijo.2009.255. [DOI] [PMC free article] [PubMed] [Google Scholar]
- 21. Garaulet M., Corbalán‐Tutau M. D., Madrid J. A., et al., “PERIOD2 Variants Are Associated With Abdominal Obesity, Psycho‐Behavioral Factors, and Attrition in the Dietary Treatment of Obesity,” Journal of the American Dietetic Association 110, no. 6 (2010): 917–921, 10.1016/j.jada.2010.03.017. [DOI] [PMC free article] [PubMed] [Google Scholar]
- 22. Özata Uyar G., Yıldıran H., Teker‐Düztaş D., et al., “Association Between CLOCK Gene Polymorphisms With Circadian Rhythm, Chrononutrition, Dietary Intake, and Metabolic Parameters in Adolescents,” Frontiers in Public Health 12 (2024): 1435460, 10.3389/fpubh.2024.1435460. [DOI] [PMC free article] [PubMed] [Google Scholar]
- 23. Chaput J.‐P., McHill A. W., Cox R. C., et al., “The Role of Insufficient Sleep and Circadian Misalignment in Obesity,” Nature Reviews. Endocrinology 19, no. 2 (2022): 82–97, 10.1038/s41574-022-00747-7. [DOI] [PMC free article] [PubMed] [Google Scholar]
- 24. Ramos‐Lopez O., Assmann T. S., Muñoz E. Y. A., et al., “Guidance and Position of RINN22 Regarding Precision Nutrition and Nutriomics,” Lifestyle Genomics 18, no. 1 (2025): 1–19, 10.1159/000542789. [DOI] [PMC free article] [PubMed] [Google Scholar]
- 25. World Health Organization , “Obesity and Overweight,” 2024, https://www.who.int/news‐room/fact‐sheets/detail/obesity‐and‐overweight.
- 26. Page M. J., McKenzie J. E., Bossuyt P. M., et al., “The PRISMA 2020 Statement: An Updated Guideline for Reporting Systematic Reviews,” BMJ 372 (2021): n71, 10.1136/bmj.n71. [DOI] [PMC free article] [PubMed] [Google Scholar]
- 27. Ouzzani M., Hammady H., Fedorowicz Z., and Elmagarmid A., “Rayyan–A Web and Mobile App for Systematic Reviews,” Systematic Reviews 5, no. 1 (2016): 210, 10.1186/s13643-016-0384-4. [DOI] [PMC free article] [PubMed] [Google Scholar]
- 28. Aromataris E., Lockwood C., Porritt K., Pilla B., and Jordan Z., JBI Manual for Evidence Synthesis (JBI, 2024), 10.46658/jbimes-24-01. [DOI] [Google Scholar]
- 29. Moola S., Munn Z., Tufanaru C., et al., “Systematic Reviews of Etiology and Risk,” in JBI Manual for Evidence Synthesis, ed. Aromataris E., Lockwood C., Porritt K., Pilla B., and Jordan Z. (JBI, 2020), 10.46658/JBIMES-24-06. [DOI] [Google Scholar]
- 30. Costa A. B., Zoltowski A. P. C., Koller S. H., and Teixeira M. A. P., “Construction of a Scale to Assess the Methodological Quality of Systematic Reviews,” Ciência & Saúde Coletiva 20, no. 8 (2015): 2441–2452, 10.1590/1413-81232015208.10762014. [DOI] [PubMed] [Google Scholar]
- 31. Rahati S., Qorbani M., Naghavi A., Nia M. H., and Pishva H., “Association Between CLOCK 3111 T/C Polymorphism With Ghrelin, GLP‐1, Food Timing, Sleep and Chronotype in Overweight and Obese Iranian Adults,” BMC Endocrine Disorders 22, no. 1 (2022): 147, 10.1186/s12902-022-01063-x. [DOI] [PMC free article] [PubMed] [Google Scholar]
- 32. Bandín C., Martinez‐Nicolas A., Ordovás J. M., et al., “Differences in Circadian Rhythmicity in CLOCK 3111T/C Genetic Variants in Moderate Obese Women as Assessed by Thermometry, Actimetry and Body Position,” International Journal of Obesity 37, no. 8 (2013): 1044–1050, 10.1038/ijo.2012.180. [DOI] [PMC free article] [PubMed] [Google Scholar]
- 33. Galbete C., Contreras R., Martínez J. A., Martínez‐González M. Á., Guillén‐Grima F., and Marti A., “Physical Activity and Sex Modulate Obesity Risk Linked to 3111T/C Gene Variant of the CLOCK Gene in an Elderly Population: The SUN Project,” Chronobiology International 29, no. 10 (2012): 1397–1404, 10.3109/07420528.2012.728657. [DOI] [PubMed] [Google Scholar]
- 34. Garaulet M., Sánchez‐Moreno C., Smith C. E., Lee Y.‐C., Nicolás F., and Ordovás J. M., “Ghrelin, Sleep Reduction and Evening Preference: Relationships to CLOCK 3111 T/C SNP and Weight Loss,” PLoS One 6, no. 2 (2011): e17435, 10.1371/journal.pone.0017435. [DOI] [PMC free article] [PubMed] [Google Scholar]
- 35. Yamaguchi M., Kotani K., Sakane N., et al., “The CLOCK 3111T/C SNP Is Associated With Morning Gastric Motility in Healthy Young Women,” Physiology & Behavior 107, no. 1 (2012): 87–91, 10.1016/j.physbeh.2012.06.006. [DOI] [PubMed] [Google Scholar]
- 36. Yang H.‐W., Garaulet M., Li P., et al., “Daily Rhythm of Fractal Cardiac Dynamics Links to Weight Loss Resistance: Interaction With CLOCK 3111T/C Genetic Variant,” Nutrients 13, no. 7 (2021): 2463, 10.3390/nu13072463. [DOI] [PMC free article] [PubMed] [Google Scholar]
- 37. Corella D., Asensio E. M., Coltell O., et al., “CLOCK Gene Variation Is Associated With Incidence of Type‐2 Diabetes and Cardiovascular Diseases in Type‐2 Diabetic Subjects: Dietary Modulation in the PREDIMED Randomized Trial,” Cardiovascular Diabetology 15 (2016): 4, 10.1186/s12933-015-0327-8. [DOI] [PMC free article] [PubMed] [Google Scholar]
- 38. Murube M. C., Borregon‐Rivilla E., Colmenarejo G., et al., “Polymorphism of CLOCK Gene rs3749474 as a Modulator of the Circadian Evening Carbohydrate Intake Impact on Nutritional Status in an Adult Sample,” Nutrients 12, no. 4 (2020): 1142, 10.3390/nu12041142. [DOI] [PMC free article] [PubMed] [Google Scholar]
- 39. Mirzababaei A., Daneshzad E., Shiraseb F., et al., “Variants of the Cry 1 Gene May Influence the Effect of Fat Intake on Resting Metabolic Rate in Women With Overweight of Obesity: A Cross‐Sectional Study,” BMC Endocrine Disorders 21, no. 1 (2021): 196, 10.1186/s12902-021-00860-0. [DOI] [PMC free article] [PubMed] [Google Scholar]
- 40. Mirzaei K., Xu M., Qi Q., et al., “Variants in Glucose‐ and Circadian Rhythm–Related Genes Affect the Response of Energy Expenditure to Weight‐Loss Diets: The POUNDS LOST Trial,” American Journal of Clinical Nutrition 99, no. 2 (2014): 392–399, 10.3945/ajcn.113.072066. [DOI] [PMC free article] [PubMed] [Google Scholar]
- 41. Baidoo V. A. and Knutson K. L., “Associations Between Circadian Disruption and Cardiometabolic Disease Risk: A Review,” Obesity 31, no. 3 (2023): 615–624, 10.1002/oby.23666. [DOI] [PMC free article] [PubMed] [Google Scholar]
- 42. Turek F. W., “Obesity and Metabolic Syndrome in Circadian Clock Mutant Mice,” Science 308, no. 5724 (2005): 1043–1045, 10.1126/science.1108750. [DOI] [PMC free article] [PubMed] [Google Scholar]
- 43. Pan X. and Hussain M. M., “Clock Is Important for Food and Circadian Regulation of Macronutrient Absorption in Mice,” Journal of Lipid Research 50, no. 9 (2009): 1800–1813, 10.1194/jlr.m900085-jlr200. [DOI] [PMC free article] [PubMed] [Google Scholar]
- 44. Bonham M. P., Bonnell E. K., and Huggins C. E., “Energy Intake of Shift Workers Compared to Fixed Day Workers: A Systematic Review and Meta‐Analysis,” Chronobiology International 33, no. 8 (2016): 1086–1100, 10.1080/07420528.2016.1192188. [DOI] [PubMed] [Google Scholar]
- 45. Vasey C., McBride J., and Penta K., “Circadian Rhythm Dysregulation and Restoration: The Role of Melatonin,” Nutrients 13, no. 10 (2021): 3480, 10.3390/nu13103480. [DOI] [PMC free article] [PubMed] [Google Scholar]
- 46. Meléndez‐Fernández O. H., Liu J. A., and Nelson R. J., “Circadian Rhythms Disrupted by Light at Night and Mistimed Food Intake Alter Hormonal Rhythms and Metabolism,” International Journal of Molecular Sciences 24, no. 4 (2023): 3392, 10.3390/ijms24043392. [DOI] [PMC free article] [PubMed] [Google Scholar]
- 47. Ulusoy H. G., Sanlier N., and Rakıcıoğlu N., “Do Rotating Night Shifts Change Nurses' Nutritional Status? A Cross‐Sectional Study,” Journal of the American Nutrition Association 41, no. 6 (2021): 608–616, 10.1080/07315724.2021.1947413. [DOI] [PubMed] [Google Scholar]
- 48. Mazri F. H., Manaf Z. A., Shahar S., and Mat Ludin A. F., “The Association Between Chronotype and Dietary Pattern Among Adults: A Scoping Review,” International Journal of Environmental Research and Public Health 17, no. 1 (2019): 68, 10.3390/ijerph17010068. [DOI] [PMC free article] [PubMed] [Google Scholar]
- 49. Adan A., Archer S. N., Hidalgo M. P., Di Milia L., Natale V., and Randler C., “Circadian Typology: A Comprehensive Review,” Chronobiology International 29, no. 9 (2012): 1153–1175, 10.3109/07420528.2012.719971. [DOI] [PubMed] [Google Scholar]
- 50. Jones S. E., Lane J. M., Wood A. R., et al., “Genome‐Wide Association Analyses of Chronotype in 697,828 Individuals Provides Insights Into Circadian Rhythms,” Nature Communications 10, no. 1 (2019): 343, 10.1038/s41467-018-08259-7. [DOI] [PMC free article] [PubMed] [Google Scholar]
- 51. Majewska K., Seremak M., Podhorodecka K., et al., “New Insights Into Health Conditions Related to Malfunctions in Clock Genes,” Biomolecules 14, no. 10 (2024): 1282, 10.3390/biom14101282. [DOI] [PMC free article] [PubMed] [Google Scholar]
- 52. Özata Uyar G. and Yildiran H., “The Association Among Circadian Rhythm, Circadian Genes and Chrononutrition, Its Effect on Obesity: A Review of Current Evidence,” Biological Rhythm Research 53, no. 12 (2022): 1–27, 10.1080/09291016.2022.2044631. [DOI] [Google Scholar]
- 53. Kalmbach D. A., Schneider L. D., Cheung J., et al., “Genetic Basis of Chronotype in Humans: Insights From Three Landmark GWAS,” Sleep 40, no. 2 (2016): zsw048. [DOI] [PMC free article] [PubMed] [Google Scholar]
- 54. Todd W. D., Venner A., Anaclet C., et al., “Suprachiasmatic VIP Neurons Are Required for Normal Circadian Rhythmicity and Comprised of Molecularly Distinct Subpopulations,” Nature Communications 11, no. 1 (2020): 4410, 10.1038/s41467-020-17197-2. [DOI] [PMC free article] [PubMed] [Google Scholar]
- 55. Sakurada K., Konta T., Takahashi S., et al., “Circadian Clock Gene Polymorphisms and Sleep‐Onset Problems in a Population‐Based Cohort Study: The Yamagata Study,” Tohoku Journal of Experimental Medicine 255, no. 4 (2021): 325–331, 10.1620/tjem.255.325. [DOI] [PubMed] [Google Scholar]
- 56. Kim S. E., Kim S., Kim H. J., et al., “CLOCK Genetic Variations Are Associated With Age‐Related Changes in Sleep Duration and Brain Volume,” Journals of Gerontology. Series A, Biological Sciences and Medical Sciences 77, no. 9 (2021): 1907–1914, 10.1093/gerona/glab365. [DOI] [PubMed] [Google Scholar]
- 57. Papatriantafyllou E., Efthymiou D., Zoumbaneas E., Popescu C. A., and Vassilopoulou E., “Sleep Deprivation: Effects on Weight Loss and Weight Loss Maintenance,” Nutrients 14, no. 8 (2022): 1549, 10.3390/nu14081549. [DOI] [PMC free article] [PubMed] [Google Scholar]
- 58. Duraccio K. M., Whitacre C., Krietsch K. N., et al., “Losing Sleep by Staying Up Late Leads Adolescents to Consume More Carbohydrates and a Higher Glycemic Load,” Sleep 45, no. 3 (2021): zsab269, 10.1093/sleep/zsab269. [DOI] [PMC free article] [PubMed] [Google Scholar]
- 59. Yang C.‐L., Schnepp J., and Tucker R. M., “Increased Hunger, Food Cravings, Food Reward, and Portion Size Selection After Sleep Curtailment in Women Without Obesity,” Nutrients 11, no. 3 (2019): 663, 10.3390/nu11030663. [DOI] [PMC free article] [PubMed] [Google Scholar]
- 60. Lopez‐Minguez J., Dashti H. S., Madrid‐Valero J. J., et al., “Heritability of the Timing of Food Intake,” Clinical Nutrition 38, no. 2 (2019): 767–773, 10.1016/j.clnu.2018.03.002. [DOI] [PMC free article] [PubMed] [Google Scholar]
- 61. Lopez‐Minguez J., Gómez‐Abellán P., and Garaulet M., “Timing of Breakfast, Lunch, and Dinner. Effects on Obesity and Metabolic Risk,” Nutrients 11, no. 11 (2019): 2624, 10.3390/nu11112624. [DOI] [PMC free article] [PubMed] [Google Scholar]
- 62. Peters B., Vahlhaus J., and Pivovarova‐Ramich O., “Meal Timing and Its Role in Obesity and Associated Diseases,” Frontiers in Endocrinology 15 (2024): 1359772, 10.3389/fendo.2024.1359772. [DOI] [PMC free article] [PubMed] [Google Scholar]
- 63. Kelly O., Fanelli S., Thomas S., Krok‐Schoen J., Jonnalagadda S., and Taylor C., “Skipping Breakfast Is Associated With Diet Quality and the Distribution of Food Intake Throughout the Day: NHANES 2005–20016,” Current Developments in Nutrition 4, no. 2 (2020): 534, 10.1093/cdn/nzaa046_034. [DOI] [Google Scholar]
- 64. Ricotti R., Caputo M., Monzani A., et al., “Breakfast Skipping, Weight, Cardiometabolic Risk, and Nutrition Quality in Children and Adolescents: A Systematic Review of Randomized Controlled and Intervention Longitudinal Trials,” Nutrients 13, no. 10 (2021): 3331, 10.3390/nu13103331. [DOI] [PMC free article] [PubMed] [Google Scholar]
- 65. Gwin J. A. and Leidy H. J., “Breakfast Consumption Augments Appetite, Eating Behavior, and Exploratory Markers of Sleep Quality Compared With Skipping Breakfast in Healthy Young Adults,” Current Developments in Nutrition 2, no. 11 (2018): nzy074, 10.1093/cdn/nzy074. [DOI] [PMC free article] [PubMed] [Google Scholar]
- 66. Garg R., “Methodology for Research I,” Indian Journal of Anaesthesia 60, no. 9 (2016): 640–645, 10.4103/0019-5049.190619. [DOI] [PMC free article] [PubMed] [Google Scholar]
- 67. Thompson F. E. and Subar A. F., “Dietary Assessment Methodology,” in Nutrition in the Prevention and Treatment of Disease, 4th ed., (Academic Press, 2017), 5–48, 10.1016/b978-0-12-802928-2.00001-1. [DOI] [Google Scholar]
- 68. Shim J.‐S., Oh K., and Kim H. C., “Dietary Assessment Methods in Epidemiologic Studies,” Epidemiology and Health 22, no. 36 (2014): e2014009, 10.4178/epih/e2014009. [DOI] [PMC free article] [PubMed] [Google Scholar]
- 69. Moshfegh A. J., Rhodes D. G., Baer D. J., et al., “The US Department of Agriculture Automated Multiple‐Pass Method Reduces Bias in the Collection of Energy Intakes,” American Journal of Clinical Nutrition 88, no. 2 (2008): 324–332, 10.1093/ajcn/88.2.324. [DOI] [PubMed] [Google Scholar]
- 70. Kirkpatrick S. I., Baranowski T., Subar A. F., Tooze J. A., and Frongillo E. A., “Best Practices for Conducting and Interpreting Studies to Validate Self‐Report Dietary Assessment Methods,” Journal of the Academy of Nutrition and Dietetics 119, no. 11 (2019): 1801–1816, 10.1016/j.jand.2019.06.010. [DOI] [PubMed] [Google Scholar]
- 71. Hong E. P. and Park J. W., “Sample Size and Statistical Power Calculation in Genetic Association Studies,” Genomics & Informatics 10, no. 2 (2012): 117–122, 10.5808/gi.2012.10.2.117. [DOI] [PMC free article] [PubMed] [Google Scholar]
- 72. Weyne G. R. d. S., “Determining Sample Size in Experimental Research in the Health Field,” ABC Medical Archives 29, no. 2 (2004): 87–90. [Google Scholar]
- 73. Politi C., Roumeliotis S., Tripepi G., and Spoto B., “Sample Size Calculation in Genetic Association Studies: A Practical Approach,” Life (Basel) 13, no. 1 (2023): 235, 10.3390/life13010235. [DOI] [PMC free article] [PubMed] [Google Scholar]
- 74. Salanti G., Sanderson S., and Higgins J. P. T., “Obstacles and Opportunities in Meta‐Analysis of Genetic Association Studies,” Genetics in Medicine 7, no. 1 (2005): 13–20, 10.1097/01.gim.0000151839.12032.1a. [DOI] [PubMed] [Google Scholar]
- 75. Miot H. A., “Sample Size in Clinical and Experimental Studies,” Jornal Vascular Brasileiro 10, no. 4 (2011): 275–278, 10.1590/s1677-54492011000400001. [DOI] [PMC free article] [PubMed] [Google Scholar]
- 76. Crujeiras A. B., Carreira M. C., Cabia B., Andrade S., Amil M., and Casanueva F. F., “Leptin Resistance in Obesity: An Epigenetic Landscape,” Life Sciences 140 (2015): 57–63, 10.1016/j.lfs.2015.05.003. [DOI] [PubMed] [Google Scholar]
- 77. Sáinz N., Barrenetxe J., Moreno‐Aliaga M. J., and Martínez J. A., “Leptin Resistance and Diet‐Induced Obesity: Central and Peripheral Actions of Leptin,” Metabolism 64, no. 1 (2015): 35–46, 10.1016/j.metabol.2014.10.015. [DOI] [PubMed] [Google Scholar]
- 78. Pereira Filho B., Massambani E. D. M., Corrêa N. A. B., Abrão R. M., Diegues M. E. M., and Gasques L. S., “The Action of Single Nucleotide Polymorphisms (Snps) on the Fto Gene, Its Relevance and Influence on Obesity: Scientometric Survey,” Arquivos de Ciências da Saúde da UNIPAR 25, no. 1 (2021): 61–77, 10.25110/arqsaude.v25i1.2021.7906. [DOI] [Google Scholar]
Associated Data
This section collects any data citations, data availability statements, or supplementary materials included in this article.
Supplementary Materials
Table S1: fsb270913‐sup‐0001‐TableS1.docx.
Table S2: fsb270913‐sup‐0001‐TableS1.docx.
Data Availability Statement
Data sharing is not applicable to this article as no datasets were generated or analyzed during the current study.