

Abstract
Proteomics-based approaches allow us to investigate the biology of cancer beyond genomic initiatives. We used histology-based matrix-assisted laser desorption/ionization (MALDI) imaging mass spectrometry to identify proteins that predict disease outcome in gastric cancer after surgical resection. A total of 181 intestinal-type primary resected gastric cancer tissues from two independent patient cohorts were analyzed. Protein profiles of the discovery cohort (n = 63) were directly obtained from tumor tissue sections by MALDI imaging. A seven-protein signature was associated with an unfavorable overall survival independent of major clinical covariates. The prognostic significance of three individual proteins identified (CRIP1, HNP-1, and S100-A6) was validated immunohistochemically on tissue microarrays of an independent validation cohort (n = 118). Whereas HNP-1 and S100-A6 were found to further subdivide early-stage (Union Internationale Contre le Cancer [UICC]–I) and late-stage (UICC II and III) cancer patients into different prognostic groups, CRIP1, a protein previously unknown in gastric cancer, was confirmed as a novel and independent prognostic factor for all patients in the validation cohort. The protein pattern described here serves as a new independent indicator of patient survival complementing the previously known clinical parameters in terms of prognostic relevance. These results show that this tissue-based proteomic approach may provide clinically relevant information that might be beneficial in improving risk stratification for gastric cancer patients.
Although the incidence of gastric cancer has declined worldwide over the past 30 years, especially in Western countries, it remains the second leading cause of cancer-related death and accounts for 9.7% of cancer deaths globally.1, 2 Despite complex treatment regimens and further understanding of its biology and possible causes, surgery is the only potentially curative treatment for gastric cancer.3 Patients with stage I disease have a good prognosis, whereas those with stage IV disease show a poor prognosis. Interestingly, the prognosis varies widely in patients with stage II or III disease for as-yet undetermined biological reasons.4
The clinical and biological behavior of individual gastric cancer patients cannot be understood through the analysis of individual or small numbers of genes, so cDNA microarray analysis has been used with some success to simultaneously investigate thousands of RNA expression levels and attempt to identify patterns associated with biological characteristics.5, 6, 7 However, mRNA expression is often poorly correlated with levels of protein expression, and such analyses cannot detect important posttranslational modifications of proteins such as proteolytic processing, phosphorylation, or glycosylation, all of which are important processes in determining protein function.8 Accordingly, comprehensive analysis of protein expression patterns might improve our ability to understand the molecular complexities of tumor tissues.
Matrix-assisted laser desorption/ionization (MALDI) imaging mass spectrometry, or MALDI imaging, is a powerful tool for investigating protein patterns through the direct (in situ) analysis of tissue sections.9 Similarly to immunohistochemistry, MALDI imaging has advantages over other assay methods (ie, those requiring homogenization) because it is morphology driven.10 This characteristic allows to directly evaluate tumor cells, to determine correlations with other morphological features, and to assay smaller patient tumor tissue specimens, such as surgical or endoscopic biopsy specimens.11 These features make it an interesting tool for tissue analysis and molecular histology.12 In addition, MALDI imaging can determine the distribution of hundreds of compounds in a single measurement without any need for labeling.13 The great potential of a highly sensitive and molecularly specific technology such as MALDI imaging to the field of oncology is currently being realized. Until now, this technique has been successfully applied to various types of cancer tissues, including human non–small-cell lung cancer, gliomas, and ovarian, prostate, and breast cancer.14, 15, 16, 17, 18, 19 Analysis of the resulting complex mass spectrometry data sets using modern biocomputational tools has resulted in the identification of both disease state, response prediction, and patient prognosis-specific protein patterns.18, 19, 20
To explore the possibility of using tissue-based proteomic analysis as a predictor of outcome in resected gastric cancer, we used MALDI imaging for direct tissue analysis of protein expression to identify proteins that predict disease outcome in patients with intestinal gastric cancer.
Materials and Methods
Study Population and Tissues
All tissues investigated in this study were obtained from patients (n = 181) who underwent gastrectomy between 1991 and 2005 at the Surgery Department at the Technische Universität München. Histological classification was performed according to the World Health Organization and the TNM classification systems designed by the Union Internationale Contre le Cancer (UICC).21, 22 All tumors analyzed in this study were intestinal-type tumors according to the Lauren classification system.23 Follow-up data were available for all patients, and the overall survival was calculated from the date of surgical resection to the date of death or last follow-up. This study was approved by the Institutional Review Board and the Ethics Committee of the Faculty of Medicine of the Technische Universität München with informed consent from all subjects and patients. The clinicopathological data of all patients are listed in Table 1.
Table 1.
Correlation of Spectral Features and Their Respective Identified Proteins with Clinicopathological Parameters for Patients
| Discovery cohort (n = 63) |
Validation cohort (n = 118) |
|||||||||||
|---|---|---|---|---|---|---|---|---|---|---|---|---|
| No. of patients | MALDI imaging m/z signals |
No. of patients | Immunohistochemistry antigens |
|||||||||
| 3445 (HNP-1) | 6278 | 8406 (CRIP1) | 8453 | 10098 (S100-A6) | 11353 | 11613 | HNP-1 (m/z 3445) | CRIP1 (m/z 8406) | S100-A6 (m/z 10098) | |||
| Sex⁎ | 0.257 | 0.348 | 0.953 | 0.383 | 0.002 | 0.579 | 0.951 | 0.448 | 0.092 | 0.259 | ||
| Male | 46 | 89 | ||||||||||
| Female | 17 | 29 | ||||||||||
| Age† | 0.114 | 0.220 | 0.159 | 0.564 | 0.039 | 0.290 | 0.947 | 0.009 | 0.152 | 0.678 | ||
| Primary tumor† | — | — | — | — | — | — | — | 0.248 | 0.375 | 0.224 | ||
| pT1 | 0 | 15 | ||||||||||
| pT2 | 63 | 54 | ||||||||||
| pT3 | 0 | 44 | ||||||||||
| pT4 | 0 | 5 | ||||||||||
| Regional lymph nodes† | 0.730 | 0.572 | 0.059 | 0.396 | 0.081 | 0.400 | 0.305 | 0.016 | 0.964 | 0.023 | ||
| pN0 | 18 | 36 | ||||||||||
| pN1 | 24 | 35 | ||||||||||
| pN2 | 16 | 35 | ||||||||||
| pN3 | 5 | 9 | ||||||||||
| pNx | 0 | 3 | ||||||||||
| Distant metastasis‡ | 0.976 | 0.321 | 0.089 | 0.687 | 0.005 | 0.036 | 0.616 | 0.517 | 0.779 | 0.038 | ||
| M0 | 54 | 87 | ||||||||||
| M1 | 9 | 31 | ||||||||||
| Resection status‡ | 0.675 | 0.238 | 0.055 | 0.129 | 0.011 | 0.448 | 0.150 | 0.196 | 0.624 | 0.361 | ||
| R0 | 53 | 81 | ||||||||||
| R1 | 9 | 26 | ||||||||||
| Rx | 1 | 11 | ||||||||||
| Grading† | 0.389 | 0.685 | 0.720 | 0.389 | 0.227 | 0.033 | 0.104 | 0.168 | 0.388 | 0.018 | ||
| G1 | 0 | 1 | ||||||||||
| G2 | 16 | 36 | ||||||||||
| G3 | 47 | 81 | ||||||||||
| Overall survival§ | 0.075 | 0.009 | 0.018 | 0.022 | 0.013 | 0.012 | 0.026 | 0.0862¶ | 0.016 | 0.0766∥ | ||
Bold print values indicate that the P value is <0.05.
P value calculated by t-test.
P value calculated by Spearman's rank correlation.
P value calculated by Mann-Whitney U test.
P value calculated by univariate Cox proportional hazard regression.
Union Internationale Contre le Cancer (UICC) stage I.
UICC stages II and III.
Discovery Cohort
Fresh-frozen tissue samples were obtained from 63 primary resected gastric carcinoma patients that were matched to UICC-T status (T = 2). Patients were on average 66.5 years of age (range, 33–85 years), and their median overall survival time was 33.1 months (range, 0–53.4 months). The tissues were snap-frozen and stored in liquid nitrogen. This discovery cohort was used for tissue-based proteomic analysis by MALDI imaging.
Validation Cohort
The patient cohort of the validation set comprised 118 tumor samples and was provided in triplicate in formalin-fixed paraffin-embedded tissue microarrays from the Institute of Pathology of the Technische Universität München. The clinicopathological data of this independent sample set are also included in Table 1. The patients' median overall survival time was 54.7 months (range, 0–135.5 months), and their mean age was 66.4 years (range, 41–80 years). The validation of the proteins was performed in this independent patient cohort by immunohistochemical analyses.
MALDI Imaging for Discovery of Survival-Related Proteins
Frozen tissue sections from the discovery cohort were cut on a cryostat (CM1950, Leica Microsystems, Wetzlar, Germany) at a 12-μm thickness onto indium-tin-oxide–coated glass slides (Bruker Daltonics, Bremen, Germany). After brief washing in both 70% and 100% ethanol pro analysis solutions, slides were coated with sinapinic acid matrix solution (Sigma-Aldrich, Taufkirchen, Germany) at 10 mg/mL in water/acetonitrile 40:60 (v/v) with 0.2% trifluoroacetic acid pro analysis (TFA) by an automated spraying device (ImagePrep, Bruker Daltonics).
For mass spectrometric measurements, tumor areas were defined using the FlexControl 3.0 and FlexImaging 2.1 software packages (both Bruker Daltonics). Spectra were acquired using the Ultraflex III MALDI-TOF/TOF (Bruker Daltonics) in positive linear mode, whereas ions were detected in a mass range of m/z 2500 to 25,000 with a lateral resolution of 70 μm. A ready-made protein standard was used for spectra calibration (Bruker Daltonics).
After the MALDI experiments, the glass slides were incubated in 70% ethanol to elute the matrix and were then stained with hematoxylin and eosin. Finally, the stained slides were scanned with a digital slide scanning system (Mirax Desk, Carl Zeiss MicroImaging, Göttingen, Germany) and co-registered to the MALDI imaging results to align mass spectrometric data with the histological features of the very same sections.
Tumor-specific spectra were selected using the FlexImaging software (Bruker Daltonics). A total of 80 spectra per case were picked randomly and were imported into the ClinProTools 2.2 software (Bruker Daltonics), on which the data underwent normalization, recalibration (both to enable comparability of measurements), and peak picking. After processing, the data were exported for further statistical analyses.
Protein Identification
Ten cryosectioned slices (25 μm each) of three different tissue specimens underwent protein extraction with aqueous 0.1% TFA and ultrasonication. The extracted proteins were separated on an mRP-C18 column (Agilent Technologies, Santa Clara, CA), and the fractionated aliquots were collected in a 96-well-plate. The HPLC fractions were manually spotted onto a PAC target (Bruker Daltonics) and analyzed by MALDI-MS (Ultraflex I, Bruker Daltonics) to locate fractions containing the m/z species of interest. Fractions of interest underwent tryptic digestion, and the resulting peptides were separated on a nano-RP-HPLC column (PepMap, LC Packings, Sunnyvale, CA), which was connected to a linear quadrupole ion trap mass spectrometer (LTQ Orbitrap XL, Thermo Scientific, Waltham, MA) equipped with a nano-ESI ion source. All obtained MS/MS spectra were searched in the NCBInr human sequence database using Mascot (v2.2.06, Matrix Science, London, UK). The final evaluation of the protein/peptide identification results was done using the Scaffold 3 software framework (Proteome Software, Portland, OR).
Validation of Proteins by Immunohistochemistry
Immunohistochemical staining of the 3-μm tissue microarray sections was performed using an automated stainer (Discovery XT) and a DAB Map kit (both, Ventana Medical Systems, Tucson, AZ). The dilutions used for primary antibodies against HNP-1 (BMA Biomedicals, Augst, Switzerland), CRIP1 (AbD Serotec, Oxford, UK), and S100-A6 (Thermo Scientific) were 1:400, 1:100, and 1:100, respectively.
The analysis of the immunohistochemical staining was conducted with an image analysis platform (Definiens Enterprise Image Intelligence Suite, Definiens AG, Munich, Germany). For this purpose, all stained slides were scanned at ×20 objective magnification by a digital slide scanner (Mirax Desk, Carl Zeiss MicroImaging), and the images were imported into the image analysis software. Specific rule sets were then defined to detect and quantify the immunohistochemical staining intensities of semantic classes. Whereas the quantified parameter for CRIP1 and S100-A6 staining was the brown intensity of the tumor cells, the area of the peptide expressing granulocytes was the quantified parameter for HNP-1.
Statistical Analysis
Correlations between the investigated parameters and clinicopathological features were determined as outlined in Table 1.
The m/z species associated with overall survival, obtained by MALDI imaging, were identified by corrected multiple testing using the Significance Analysis of Microarrays (SAM) package with a maximum false discovery rate of 0.1.24 To investigate the predictive power of the combined MALDI imaging signals, all patients were clustered into two groups by hierarchical clustering. The dendrogram was calculated using the Ward linkage method based on a weighted Euclidean distance. Each weight corresponded to the reciprocal of the respective m/z species' univariate P value. The correct classification rate of this protein pattern to one of the groups was tested by establishing a classification model based on a support vector machine, running with standard parameters (kernel = radial, cost = 1) and a 10-fold cross-validation.
Multivariate analyses for the assessment of clinical parameter influences were done by Cox regression with P values calculated by the Wald test. Kaplan-Meier curves were calculated by defining favorable and unfavorable prognostic groups using an intensity-based threshold score, which maximized overall survival differences between both respective groups while minimizing imbalances in group sizes. Differences between the curves were assessed using the log-rank test.
All statistical analyses were performed within the R statistical environment (R Foundation for Statistical Computing, Vienna, Austria), in which P values <0.05 were considered statistically significant and values between 0.05 and 0.1 were considered trends.
Results
MALDI Imaging Reveals Seven Survival-Associated Proteins
To detect protein signals associated with overall survival in gastric cancer, we acquired the cancer protein profiles of 63 patients using MALDI imaging mass spectrometry in the discovery cohort. This strategy allowed the histology-directed acquisition of cancer cell-specific protein spectra from the measured tissue samples. On average, we could resolve between 150 and 200 peaks per case within the mass range of m/z 2500 to 25,000 and a mass accuracy of ±3 m/z. For example, a representative tumor peak (m/z species) and the morphological features of an individual patient's tissue sample are shown in Figure 1.
Figure 1.
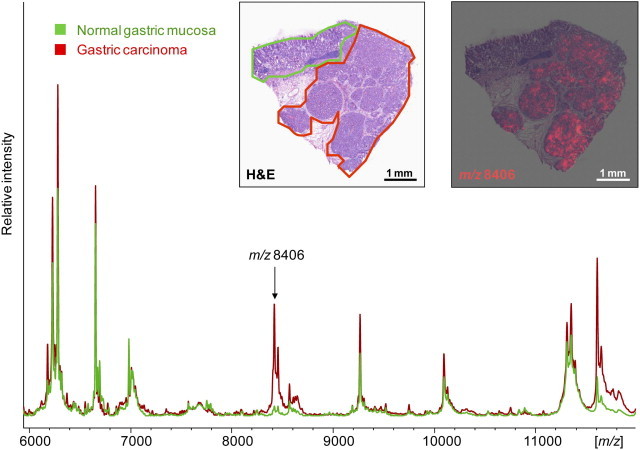
MALDI imaging reveals cell type-specific profiles, as shown in this comparison of gastric carcinoma (red) and normal gastric mucosa (green) from an individual patient's tissue. In this study, one example of differentially expressed masses (m/z 8406), exclusively present in cancer cells (right inset, red visualization), was found to correlate significantly with the patients' overall survival.
After setting the false discovery threshold to 0.1 and excluding correlated features, we found seven m/z species at an average of m/z 3445, m/z 6278, m/z 8406, m/z 8453, m/z 10098, m/z 11353, and m/z 11613, which were associated with patient survival (see Supplemental Figures S1 at http://ajp.amjpathol.org). Correlations to clinicopathological parameters are listed in Table 1.
The influence of each m/z species on survival was then studied in more detail. Univariate Cox regression showed that, with the exception of m/z 3445 (P = 0.075), which indicates a prognostic trend, all signals exhibit a strong nonfavorable effect on survival. The value m/z 6278 (P = 0.009) has the highest prognostic value, followed by m/z 11353 (P = 0.012), m/z 10098 (P = 0.013), m/z 8406 (P = 0.018), m/z 8453 (P = 0.022), and m/z 11613 (P = 0.026) (Table 1). Setting intensity thresholds for each single m/z signal resulted in poor and good prognosis groups which all differed significantly in terms of overall survival (all P < 0.05). A selection of Kaplan-Meier graphs for the long-and short-term survivor groups are depicted in Figure 2, A and B, andFigure 3A (for all Kaplan-Meier graphs, see Supplemental Figure S2 at http://ajp.amjpathol.org).
Figure 2.
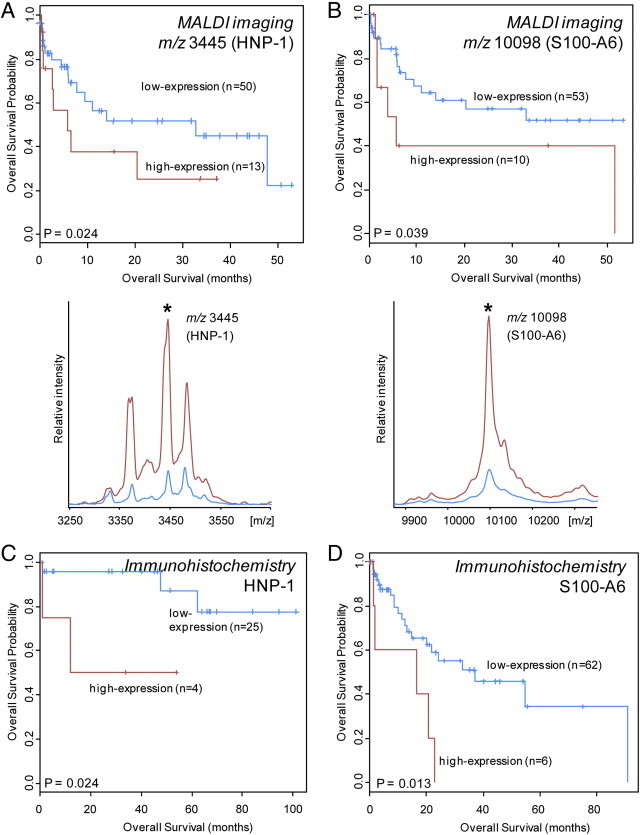
M/z 3445 and 10098, as measured by MALDI imaging and identified as HNP-1 and S100-A6 correlate with the survival of patients (A, B). Kaplan-Meier analyses in the immunohistochemical validation confirmed their prognostic value although this effect was only observed in patients with UICC stage I cancer (C, n = 29) for HNP-1 and in those with UICC stages II and III for S100-A6 (D, n = 68).
Figure 3.
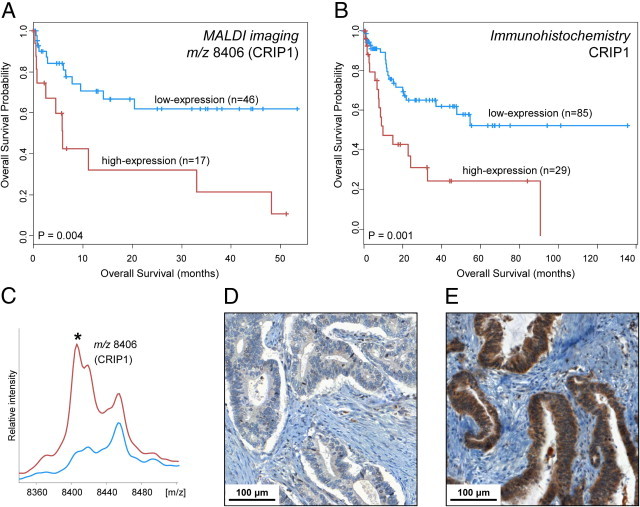
CRIP1, a previously unknown protein in gastric cancer, was found by MALDI imaging as a novel prognostic factor in the discovery cohort (A, C). Immunohistochemical validation confirmed this by showing a strong relationship between the high expression of CRIP1 (E) and poor survival (B) and vice versa (D, B), as calculated by Kaplan-Meier analysis (n = 114).
Multivariate Cox regression models of each respective m/z species, with nodal and resection status as well as distant metastasis status as covariables, showed that m/z 6278, m/z 8453, m/z 10098, and m/z 11613 are independent prognostic factors (all P < 0.05), whereas m/z values of 3445 (P = 0.063) and 8406 (P = 0.07) showed slight dependencies (Table 2). In contrast, m/z 11353 does not exert an independent influence on survival (P = 0.16).
Table 2.
Multivariate Survival Analyses
| Covariable | Hazard ratio | 95% Confidence interval | P value |
|---|---|---|---|
| MALDI imaging | |||
| m/z 3445 (HNP-1) | 1.032 | 0.998–1.070 | 0.063 |
| Nodal status | 2.304 | 1.382–3.840 | 0.001 |
| Distant metastasis | 0.724 | 0.163–3.220 | 0.670 |
| Resection status | 1.398 | 0.273–7.160 | 0.690 |
| m/z 6278 | 1.332 | 1.088–1.630 | 0.006 |
| Nodal status | 2.869 | 1.661–4.960 | 0.000 |
| Distant metastasis | 0.661 | 0.165–2.640 | 0.560 |
| Resection status | 0.531 | 0.092–3.080 | 0.480 |
| m/z 8406 (CRIP1) | 1.458 | 0.970–2.190 | 0.070 |
| Nodal status | 2.477 | 1.459–4.210 | 0.001 |
| Distant metastasis | 0.521 | 0.109–2.490 | 0.410 |
| Resection status | 0.772 | 0.116–5.160 | 0.790 |
| m/z 8453 | 3.626 | 1.275–10.31 | 0.016 |
| Nodal status | 2.579 | 1.527–4.360 | 0.000 |
| Distant metastasis | 0.760 | 0.185–3.130 | 0.700 |
| Resection status | 0.643 | 0.121–3.420 | 0.600 |
| m/z 10098 (S100-A6) | 1.219 | 1.012–1.470 | 0.037 |
| Nodal status | 2.522 | 1.469–4.330 | 0.001 |
| Distant metastasis | 0.407 | 0.078–2.130 | 0.290 |
| Resection status | 1.042 | 0.171–6.350 | 0.960 |
| m/z 11353 | 1.177 | 0.939–1.480 | 0.160 |
| Nodal status | 2.091 | 1.231–3.550 | 0.006 |
| Distant metastasis | 0.585 | 0.138–2.480 | 0.470 |
| Resection status | 1.668 | 0.326–8.530 | 0.540 |
| m/z 11613 | 1.694 | 1.082–2.650 | 0.021 |
| Nodal status | 2.570 | 1.529–4.320 | 0.000 |
| Distant metastasis | 0.584 | 0.121–2.820 | 0.500 |
| Resection status | 0.867 | 0.137–5.470 | 0.880 |
| Seven-protein signature | 4.031 | 1.691–9.610 | 0.002 |
| Nodal status | 2.501 | 1.521–4.110 | 0.000 |
| Distant metastasis | 0.725 | 0.183–2.870 | 0.650 |
| Resection status | 1.165 | 0.260–5.220 | 0.840 |
| Immunohistochemistry | |||
| CRIP1 (m/z 8406) | 1.570 | 1.012–2.440 | 0.044 |
| Primary tumor | 1.660 | 0.939–2.950 | 0.081 |
| Nodal status | 1.670 | 1.045–2.670 | 0.032 |
| Distant metastasis | 1.090 | 0.437–2.720 | 0.860 |
| Resection status | 1.030 | 0.363–2.950 | 0.950 |
| S100-A6 (m/z 10098)⁎ | 3.800 | 1.130–12.81 | 0.031 |
| Primary tumor | 1.720 | 0.611–4.860 | 0.300 |
| Nodal status | 2.190 | 0.865–5.570 | 0.098 |
| Distant metastasis | 1.120 | 0.310–4.050 | 0.860 |
| Resection status | 1.670 | 0.355–7.830 | 0.520 |
Data are calculated by Cox proportional hazard regression. Bold print indicates that the P value is <0.05.
Union Internationale Contre le Cancer (UICC) stages II and III only.
Identification of Three Survival-Related Protein Markers-HNP-1, CRIP1, and S100-A6
Protein identification of m/z 3445 was performed by tissue extraction and fractionation followed by bottom-up tandem mass spectrometry. Human neutrophil peptide-1 (HNP-1) was identified with a Mascot Score of 109. Protein scores above 56 indicate identity or extensive homology (P < 0.05) (see Supplemental Figure S3 at http://ajp.amjpathol.org). In addition, this mass has already been reported as HNP-1 in several other studies.11, 20
Signal m/z 8406 (±3 m/z) has previously been identified by our group as Cysteine-rich intestinal protein 1 (CRIP1).25 Similarly, the signal at m/z 10098 corresponds to the calcium binding protein, S100-A6, as previously shown by Schwartz et al.18
The other four molecular species have remained unidentified and require further elucidation efforts.
Validation on an Independent Patient Cohort by Immunohistochemistry Confirms the Prognostic Relevance of the Identified Protein Markers
Based on the results of the discovery study, we validated the predictive power of the identified proteins CRIP1, S100-A6, and HNP-1 using an independent test cohort comprising 118 patients.
Although univariate analysis indicated a significant correlation of CRIP1 (P = 0.016) on patient survival for all UICC stages, slight associations were found for HNP-1 and S100-A6 for certain subgroups. S100-A6 slightly influenced survival in UICC stages II to III patients (P = 0.077) and HNP-1 slightly influenced survival in UICC stage I patients (P = 0.086). These findings are in line with the Kaplan-Meier analyses, as shown in Figure 2. Next, the global prognostic value of CRIP1 was further investigated in a multivariate analysis. CRIP1 was found to be the strongest variable, besides nodal status (P = 0.032), to indicate the outcome of patients (P = 0.044), therefore confirming its high predictive power (Table 2). This finding is also shown in the Kaplan-Meier analyses together with immunohistochemical examples of low and high expression of CRIP1 in Figure 3. Similarly, S100-A6 has a significant independent effect on survival in stage II and III patients (P = 0.031).
Seven-Protein Signature Predicts Outcome in Patients Independently of Clinical Parameters
To improve prognostic ability further, all seven markers were combined to establish a survival prediction model. Therefore, unsupervised clustering was applied to discriminate patients into two groups according to their seven-protein signature (Figure 4A). The difference in patient outcome between both groups was assessed by univariate Kaplan-Meier analysis (P = 0.002) (Figure 4B) and multivariate Cox regression (P = 0.002) (Table 2). This analysis indicated the strong predictive value of the signature independent of nodal or distant metastasis and resection status.
Figure 4.
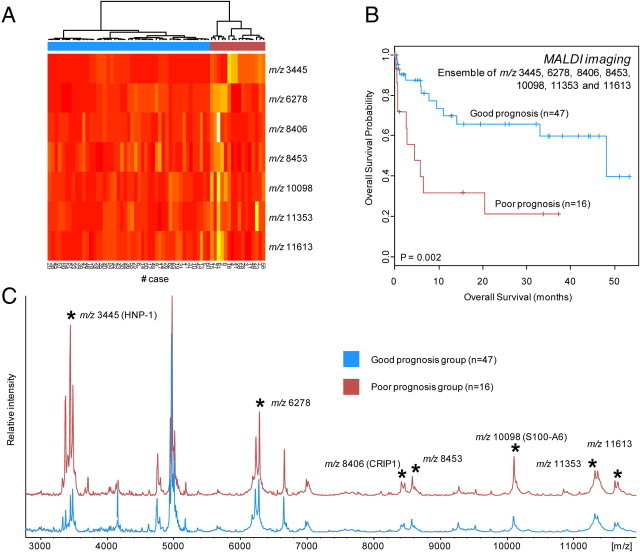
The prognostic power of a combined pattern was investigated by clustering all patients according to the seven protein signals (A, C). The main two branches of the tree were found to represent a good (blue) and a poor prognosis group (red) (B). Moreover, this pattern predicts patient outcome independently of major clinicopathological parameters (Table 2).
The discriminatory power of this pattern (Figure 4C) between the two tumor subgroups was assessed by cross-validation of a classification model (support vector machine), which achieved a classification accuracy of 98% (95% CI, 91% to 100%).
A combination of mass signals representing the three identified proteins was found sufficient to be a significant indicator for patient survival, and even independent from clinical parameters. However, the full signature adds significantly more prognostic information (see Supplemental Figure S4 at http://ajp.amjpathol.org).
Discussion
Previous studies have defined prognostic subsets of gastric cancer based on gene or microRNA expression patterns.5, 6, 7, 26 However, mRNA expression cannot always indicate which proteins are expressed or how their activity might be modulated after translation.27, 28 Accordingly, analysis of the proteome in tumor tissues might better reflect the underlying pathological state of cancers than gene expression patterns. A few tissue-based reports in gastric cancer have shown that proteomic patterns with surface-enhanced laser desorption/ionization-TOF can distinguish cancer patients from non-cancer patients.29, 30 A very recent report in gastric cancer demonstrated that protein profiles obtained from endoscopic biopsy samples via MALDI imaging can distinguish pathological early stage tumors from more advanced tumors.11 However, none of the mentioned studies performed prognostic evaluations of the protein patterns. This study is the first to show that tissue-based proteomic profiling by MALDI imaging is able to identify protein patterns that predict patient survival in intestinal-type gastric cancer. Previously known and, more importantly, previously unknown protein biomarkers were identified, among them HNP-1, CRIP1, and S100-A6. Interestingly, both HNP-1 and CRIP1 have been described in the context of the immune system.31, 32 It is known from clinical and experimental studies that the immune system is a significant determinant of epithelial tumorigenesis and further development.33
Cysteine-rich intestinal protein 1 (CRIP1), a so-far-unknown protein in gastric cancer, was found in this study to be an independent prognostic factor in the validation cohort (Table 2). Human CRIP1 belongs to the LIM family and is a tissue-specific developmentally regulated protein that is involved in protein–protein interactions during transcription.34, 35, 36, 37 CRIP1 has been suggested to play a role in the host defense system also, and differential expression of CRIP1 can change cytokine patterns and the immune response.32 In this context, an elevated level of CRIP1 in tumor cells may be sensible as it has been proposed that immune cells are actively recruited by tumors to exploit their pro-angiogenic and pro-metastatic effects. This is supported by gene expression analyses where mRNA of CRIP1 has been found to be overexpressed in various tumor types, including colorectal, pancreatic, prostate, breast, and cervical cancers.38, 39, 40, 41, 42 However, this is the first study that describes CRIP1 to affect patient survival. No other significant correlations to major clinical parameters were found for CRIP1 in our study. Because the functional characterization of CRIP1 is currently inadequate, the precise role of CRIP1 in cancer cells is unclear and requires further investigation.
HNP-1 is an antimicrobial peptide that is expressed in human neutrophils of the innate immune system and is found to be present in a variety of tumor types, including gastric and colon cancer.30, 31, 43 The link between a chronic active inflammatory process, where neutrophils make up a significant portion of the inflammatory cell infiltrate, and the onset of carcinoma has been convincingly demonstrated at the gastric and intestinal mucosal level.44 It has been shown in cancers that a strong presence of infiltrating innate immune cells, such as neutrophils, correlates with increased angiogenesis and poor prognosis, whereas an abundance of infiltrating lymphocytes correlates with favorable prognosis.33 This is reflected in several serum based studies that investigated the ratio between neutrophils and lymphocytes in different cancer types as in renal cell carcinoma or breast cancer.45, 46 However, this study is the first to show the prognostic significance of HNP-1 in gastric cancer tissues. The results of this study underscore the assumptions that the immune system and associated proteins, represented here by HNP-1 and CRIP1, play key roles in tumor behavior and therefore in clinical outcomes in cancer patients.
In contrast, S100-A6, a calcium-binding protein, has not been reported to be linked to the immune system. Among many versatile functions of S100-A6, it has been mainly described to be involved in cytoskeleton rearrangement, as actin binding proteins, like annexins, have been identified as its target (see Supplemental Figure S5 at http://ajp.amjpathol.org).47 In this context, interactions with tumor associated proteins such as annexin A2 and p53 may indicate a role of S100-A6 in cancer progression and metastasis.48, 49 Indeed, increased levels of S100-A6 have been found to be associated with metastasis or survival in colon and pancreatic cancer, respectively.50, 51 Similarly, our study showed a significant correlation of S100-A6 expression with clinical parameters such as regional lymph node metastasis, distant metastasis, tumor cell differentiation, and prognosis. This is highly concordant with a recent study in gastric cancer demonstrating the association between S100-A6 expression and various clinicopathological features including clinical patient outcome.52 Unfortunately, little is still known about the exact mechanism of S100-A6 with regard to an aggressive tumor phenotype. Nevertheless, our observations support the general findings that S100-A6 plays an important role in the progression and prognosis in gastric cancer patients.
The other four molecular species have remained unidentified so far and require further elucidation efforts. Because there is so far no universal strategy in MALDI imaging proteomics for identifying the molecular nature of a peak, each protein requires an individual identification approach and elaborate protocol adaptations.53, 54
We shifted the emphasis of our study to the combination of these molecular species that are directly related to prognosis, as it has been reported that individual markers may vary for a variety of reasons but that, at a statistically significant level, a signature would remain more robust.55 The seven-protein signature described was found to be a new independent indicator of patient survival and may complement previously known clinical parameters such as lymph node metastasis and stage in terms of prognostic relevance.
Importantly, the amount of tissue required for MALDI imaging is much smaller than any other available method using molecular profiling techniques such as array-based gene expression profiling. Thus, our study shows that protein profiles can be obtained from smallest amounts of unprocessed fresh frozen tissue samples, which are readily collectable in a clinical setting, to accurately predict prognosis. Since such small tissue samples can be used, it would be of great interest to analyze the protein expression patterns of tissue samples from small endoscopic biopsies or to attempt to derive patterns associated with response to specific treatments and correlate these findings with the risk of progression to cancer. If these data are confirmed in larger numbers of patients, tissue-based proteomics profiling by MALDI imaging could have implications for the clinical management of patients with gastric cancer.
Acknowledgments
The authors thank Ulrike Buchholz, Claudia-Mareike Pflüger, Andreas Voss, and Tonia Ludwig for their excellent technical assistance.
Footnotes
Supported by grants from the Deutsche Krebshilfe (No. 108096), the German Federal Ministry of Education and Research (Nos. 01EZ0803 and 0315508A), and the Deutsche Forschungsgemeinschaft (SFB 824 TP B1 and TP Z2).
Supplemental material for this article can be found at http://ajp.amjapthol.org or at doi:10.1016/j.ajpath.2011.08.032.
Supplementary data
A: Significance Analysis of Microarrays (SAM) plot. Circles in plot represent individual m/z species. Dashed lines delimit the area of random effect. Red circles indicate that higher expression correlates with a higher risk. Inset lists the m/z species together with their individual q-values (indirectly related to the false discovery rate, which was set to a maximum of 10%). B: Correlation coefficients between m/z species. Correlation coefficients were calculated by Spearman's rank correlation. Values above 0.8 were considered highly correlated. Thus, the correlated signals with the lower q-values (m/z 6226, m/z 8418, and m/z 11,655) were excluded from further consideration.
Kaplan-Meier graphs for MALDI imaging m/z species 3445, 6278, 8406, 8453, 10098, 11353, and 11613.
Fragment spectra of HNP-1 identification. Neutrophil defensin 1 was identified with a Mascot score of 109 (P < 0.05). Neutrophil defensin 1 is cleaved into the peptides HNP-1 or HNP-2 (see Uniprot entry: P59665). HNP-1 differs from HNP-1 by the absence of one amino acid residue. Theoretical mass calculations from the resulting peptides identified m/z 3445 as HNP-1 and m/z 3373 as HNP-2.
A: Comparison of seven- and three-signal protein signature. Seven-signal (left) and three-signal (right) protein signatures obtained by MALDI imaging were compared with regard to their prognostic information. Therefore, patients were first clustered on basis of the respective signature (upper panels: see Materials and Methods in main manuscript) and the resulting groups were then compared by Kaplan-Meier analyses (lower panels). Multivariate survival analyses by COX regression were performed in the MALDI imaging data set to assess the prognostic value of the three-signal protein signature in comparison with major clinical parameters (top) and with the seven-signal signature (bottom). Both analyses show that the three-protein signature is sufficient to be a significant indicator for patient survival, and even independent from clinical parameters. However, the full signature adds significant prognostic information.
Known and predicted interactions of S100-A6 (S100A6) with other proteins. This functional protein association network was obtained by searching the STRING online database (http://string-db.org) for the entry “S100A6,” Interestingly, S100-A6 binds directly to proteins such as p53 (TP53) and annexin 2 (ANXA2), which have been extensively described in the context of cancer.
References
- 1.Ferlay J., Shin H.R., Bray F., Forman D., Mathers C., Parkin D.M. Estimates of worldwide burden of cancer in 2008: GLOBOCAN 2008. Int J Cancer. 2010;127:2893–2917. doi: 10.1002/ijc.25516. [DOI] [PubMed] [Google Scholar]
- 2.Jemal A., Siegel R., Ward E., Hao Y., Xu J., Murray T., Thun M.J. Cancer statistics, 2008. CA Cancer J Clin. 2008;58:71–96. doi: 10.3322/CA.2007.0010. [DOI] [PubMed] [Google Scholar]
- 3.Shi Y., Zhou Y. The role of surgery in the treatment of gastric cancer. J Surg Oncol. 2010;101:687–692. doi: 10.1002/jso.21455. [DOI] [PubMed] [Google Scholar]
- 4.Allgayer H., Heiss M.M., Schildberg F.W. Prognostic factors in gastric cancer. Br J Surg. 1997;84:1651–1664. [PubMed] [Google Scholar]
- 5.Chen C.N., Lin J.J., Chen J.J., Lee P.H., Yang C.Y., Kuo M.L., Chang K.J., Hsieh F.J. Gene expression profile predicts patient survival of gastric cancer after surgical resection. J Clin Oncol. 2005;23:7286–7295. doi: 10.1200/JCO.2004.00.2253. [DOI] [PubMed] [Google Scholar]
- 6.Leung S.Y., Yuen S.T., Chu K.M., Mathy J.A., Li R., Chan A.S., Law S., Wong J., Chen X., So S. Expression profiling identifies chemokine (C-C motif) ligand 18 as an independent prognostic indicator in gastric cancer. Gastroenterology. 2004;127:457–469. doi: 10.1053/j.gastro.2004.05.031. [DOI] [PubMed] [Google Scholar]
- 7.Xu Z.Y., Chen J.S., Shu Y.Q. Gene expression profile towards the prediction of patient survival of gastric cancer. Biomed Pharmacother. 2010;64:133–139. doi: 10.1016/j.biopha.2009.06.021. [DOI] [PubMed] [Google Scholar]
- 8.Wulfkuhle J.D., Liotta L.A., Petricoin E.F. Proteomic applications for the early detection of cancer. Nat Rev Cancer. 2003;3:267–275. doi: 10.1038/nrc1043. [DOI] [PubMed] [Google Scholar]
- 9.Stoeckli M., Chaurand P., Hallahan D.E., Caprioli R.M. Imaging mass spectrometry: a new technology for the analysis of protein expression in mammalian tissues. Nat Med. 2001;7:493–496. doi: 10.1038/86573. [DOI] [PubMed] [Google Scholar]
- 10.Walch A., Rauser S., Deininger S.O., Hofler H. MALDI imaging mass spectrometry for direct tissue analysis: a new frontier for molecular histology. Histochem Cell Biol. 2008;130:421–434. doi: 10.1007/s00418-008-0469-9. [DOI] [PMC free article] [PubMed] [Google Scholar]
- 11.Kim H.K., Reyzer M.L., Choi I.J., Kim C.G., Kim H.S., Oshima A., Chertov O., Colantonio S., Fisher R.J., Allen J.L., Caprioli R.M., Green J.E. Gastric cancer-specific protein profile identified using endoscopic biopsy samples via MALDI mass spectrometry. J Proteome Res. 2010;9:4123–4130. doi: 10.1021/pr100302b. [DOI] [PMC free article] [PubMed] [Google Scholar]
- 12.Chaurand P., Sanders M.E., Jensen R.A., Caprioli R.M. Proteomics in diagnostic pathology: profiling and imaging proteins directly in tissue sections. Am J Pathol. 2004;165:1057–1068. doi: 10.1016/S0002-9440(10)63367-6. [DOI] [PMC free article] [PubMed] [Google Scholar]
- 13.Chaurand P., Schwartz S.A., Caprioli R.M. Profiling and imaging proteins in tissue sections by MS. Anal Chem. 2004;76:87A–93A. [PubMed] [Google Scholar]
- 14.Cazares L.H., Troyer D., Mendrinos S., Lance R.A., Nyalwidhe J.O., Beydoun H.A., Clements M.A., Drake R.R., Semmes O.J. Imaging mass spectrometry of a specific fragment of mitogen-activated protein kinase/extracellular signal-regulated kinase kinase kinase 2 discriminates cancer from uninvolved prostate tissue. Clin Cancer Res. 2009;15:5541–5551. doi: 10.1158/1078-0432.CCR-08-2892. [DOI] [PubMed] [Google Scholar]
- 15.Cornett D.S., Mobley J.A., Dias E.C., Andersson M., Arteaga C.L., Sanders M.E., Caprioli R.M. A novel histology-directed strategy for MALDI-MS tissue profiling that improves throughput and cellular specificity in human breast cancer. Mol Cell Proteomics. 2006;5:1975–1983. doi: 10.1074/mcp.M600119-MCP200. [DOI] [PubMed] [Google Scholar]
- 16.Lemaire R., Menguellet S.A., Stauber J., Marchaudon V., Lucot J.P., Collinet P., Farine M.O., Vinatier D., Day R., Ducoroy P., Salzet M., Fournier I. Specific MALDI imaging and profiling for biomarker hunting and validation: fragment of the 11S proteasome activator complex: Reg alpha fragment, is a new potential ovary cancer biomarker. J Proteome Res. 2007;6:4127–4134. doi: 10.1021/pr0702722. [DOI] [PubMed] [Google Scholar]
- 17.Schwamborn K., Krieg R.C., Reska M., Jakse G., Knuechel R., Wellmann A. Identifying prostate carcinoma by MALDI-imaging. Int J Mol Med. 2007;20:155–159. [PubMed] [Google Scholar]
- 18.Schwartz S.A., Weil R.J., Thompson R.C., Shyr Y., Moore J.H., Toms S.A., Johnson M.D., Caprioli R.M. Proteomic-based prognosis of brain tumor patients using direct-tissue matrix-assisted laser desorption ionization mass spectrometry. Cancer Res. 2005;65:7674–7681. doi: 10.1158/0008-5472.CAN-04-3016. [DOI] [PubMed] [Google Scholar]
- 19.Yanagisawa K., Shyr Y., Xu B.J., Massion P.P., Larsen P.H., White B.C., Roberts J.R., Edgerton M., Gonzalez A., Nadaf S., Moore J.H., Caprioli R.M., Carbone D.P. Proteomic patterns of tumour subsets in non-small-cell lung cancer. Lancet. 2003;362:433–439. doi: 10.1016/S0140-6736(03)14068-8. [DOI] [PubMed] [Google Scholar]
- 20.Bauer J.A., Chakravarthy A.B., Rosenbluth J.M., Mi D., Seeley E.H., De Matos Granja-Ingram N., Olivares M.G., Kelley M.C., Mayer I.A., Meszoely I.M., Means-Powell J.A., Johnson K.N., Tsai C.J., Ayers G.D., Sanders M.E., Schneider R.J., Formenti S.C., Caprioli R.M., Pietenpol J.A. Identification of markers of taxane sensitivity using proteomic and genomic analyses of breast tumors from patients receiving neoadjuvant paclitaxel and radiation. Clin Cancer Res. 2010;16:681–690. doi: 10.1158/1078-0432.CCR-09-1091. [DOI] [PMC free article] [PubMed] [Google Scholar]
- 21.Aaltonen L.A., Hamilton S.R., World Health Organization . International Agency for Research on Cancer: Pathology and genetics of tumours of the digestive system. IARC Press; Lyon: 2000. pp. 39–52. [Google Scholar]
- 22.Sobin L.H., Wittekind C. International Union against Cancer: TNM classification of malignant tumours. (German edition) Wiley-Liss; New York: 2002. pp. 59–62. [Google Scholar]
- 23.Lauren P. The two histological main types of gastric carcinoma: diffuse and so-called intestinal-type carcinoma: an attempt at a histo-clinical classification. Acta Pathol Microbiol Scand. 1965;64:31–49. doi: 10.1111/apm.1965.64.1.31. [DOI] [PubMed] [Google Scholar]
- 24.Tusher V.G., Tibshirani R., Chu G. Significance analysis of microarrays applied to the ionizing radiation response. Proc Natl Acad Sci USA. 2001;98:5116–5121. doi: 10.1073/pnas.091062498. [DOI] [PMC free article] [PubMed] [Google Scholar]
- 25.Rauser S., Marquardt C., Balluff B., Deininger S.O., Albers C., Belau E., Hartmer R., Suckau D., Specht K., Ebert M.P., Schmitt M., Aubele M., Hofler H., Walch A. Classification of HER2 receptor status in breast cancer tissues by MALDI imaging mass spectrometry. J Proteome Res. 2010;9:1854–1863. doi: 10.1021/pr901008d. [DOI] [PubMed] [Google Scholar]
- 26.Li X., Zhang Y., Zhang Y., Ding J., Wu K., Fan D. Survival prediction of gastric cancer by a seven-microRNA signature. Gut. 2010;59:579–585. doi: 10.1136/gut.2008.175497. [DOI] [PubMed] [Google Scholar]
- 27.Anderson L., Seilhamer J. A comparison of selected mRNA and protein abundances in human liver. Electrophoresis. 1997;18:533–537. doi: 10.1002/elps.1150180333. [DOI] [PubMed] [Google Scholar]
- 28.Wilkins M.R., Sanchez J.C., Williams K.L., Hochstrasser D.F. Current challenges and future applications for protein maps and post-translational vector maps in proteome projects. Electrophoresis. 1996;17:830–838. doi: 10.1002/elps.1150170504. [DOI] [PubMed] [Google Scholar]
- 29.Melle C., Ernst G., Schimmel B., Bleul A., Kaufmann R., Hommann M., Richter K.K., Daffner W., Settmacher U., Claussen U., von Eggeling F. Characterization of pepsinogen C as a potential biomarker for gastric cancer using a histo-proteomic approach. J Proteome Res. 2005;4:1799–1804. doi: 10.1021/pr050123o. [DOI] [PubMed] [Google Scholar]
- 30.Mohri Y., Mohri T., Wei W., Qi Y.J., Martin A., Miki C., Kusunoki M., Ward D.G., Johnson P.J. Identification of macrophage migration inhibitory factor and human neutrophil peptides 1–3 as potential biomarkers for gastric cancer. Br J Cancer. 2009;101:295–302. doi: 10.1038/sj.bjc.6605138. [DOI] [PMC free article] [PubMed] [Google Scholar]
- 31.Albrethsen J., Bogebo R., Gammeltoft S., Olsen J., Winther B., Raskov H. Upregulated expression of human neutrophil peptides 1, 2 and 3 (HNP 1–3) in colon cancer serum and tumours: a biomarker study. BMC Cancer. 2005;5:8. doi: 10.1186/1471-2407-5-8. [DOI] [PMC free article] [PubMed] [Google Scholar]
- 32.Lanningham-Foster L., Green C.L., Langkamp-Henken B., Davis B.A., Nguyen K.T., Bender B.S., Cousins R.J. Overexpression of CRIP in transgenic mice alters cytokine patterns and the immune response. Am J Physiol Endocrinol Metab. 2002;282:E1197–E1203. doi: 10.1152/ajpendo.00508.2001. [DOI] [PubMed] [Google Scholar]
- 33.de Visser K.E., Eichten A., Coussens L.M. Paradoxical roles of the immune system during cancer development. Nat Rev Cancer. 2006;6:24–37. doi: 10.1038/nrc1782. [DOI] [PubMed] [Google Scholar]
- 34.Hao J., Serohijos A.W., Newton G., Tassone G., Wang Z., Sgroi D.C., Dokholyan N.V., Basilion J.P. Identification and rational redesign of peptide ligands to CRIP1, a novel biomarker for cancers. PLoS Comput Biol. 2008;4:e1000138. doi: 10.1371/journal.pcbi.1000138. [DOI] [PMC free article] [PubMed] [Google Scholar]
- 35.Jurata L.W., Kenny D.A., Gill G.N. Nuclear LIM interactor, a rhombotin and LIM homeodomain interacting protein, is expressed early in neuronal development. Proc Natl Acad Sci USA. 1996;93:11693–11698. doi: 10.1073/pnas.93.21.11693. [DOI] [PMC free article] [PubMed] [Google Scholar]
- 36.Khoo C., Blanchard R.K., Sullivan V.K., Cousins R.J. Human cysteine-rich intestinal protein: cDNA cloning and expression of recombinant protein and identification in human peripheral blood mononuclear cells. Protein Expr Purif. 1997;9:379–387. doi: 10.1006/prep.1996.0709. [DOI] [PubMed] [Google Scholar]
- 37.Levenson C.W., Shay N.F., Lee-Ambrose L.M., Cousins R.J. Regulation of cysteine-rich intestinal protein by dexamethasone in the neonatal rat. Proc Natl Acad Sci USA. 1993;90:712–715. doi: 10.1073/pnas.90.2.712. [DOI] [PMC free article] [PubMed] [Google Scholar]
- 38.Chen Y., Miller C., Mosher R., Zhao X., Deeds J., Morrissey M., Bryant B., Yang D., Meyer R., Cronin F., Gostout B.S., Smith-McCune K., Schlegel R. Identification of cervical cancer markers by cDNA and tissue microarrays. Cancer Res. 2003;63:1927–1935. [PubMed] [Google Scholar]
- 39.Groene J., Mansmann U., Meister R., Staub E., Roepcke S., Heinze M., Klaman I., Brummendorf T., Hermann K., Loddenkemper C., Pilarsky C., Mann B., Adams H.P., Buhr H.J., Rosenthal A. Transcriptional census of 36 microdissected colorectal cancers yields a gene signature to distinguish UICC II and III. Int J Cancer. 2006;119:1829–1836. doi: 10.1002/ijc.22027. [DOI] [PubMed] [Google Scholar]
- 40.Ma X.J., Salunga R., Tuggle J.T., Gaudet J., Enright E., McQuary P., Payette T., Pistone M., Stecker K., Zhang B.M., Zhou Y.X., Varnholt H., Smith B., Gadd M., Chatfield E., Kessler J., Baer T.M., Erlander M.G., Sgroi D.C. Gene expression profiles of human breast cancer progression. Proc Natl Acad Sci USA. 2003;100:5974–5979. doi: 10.1073/pnas.0931261100. [DOI] [PMC free article] [PubMed] [Google Scholar]
- 41.Terris B., Blaveri E., Crnogorac-Jurcevic T., Jones M., Missiaglia E., Ruszniewski P., Sauvanet A., Lemoine N.R. Characterization of gene expression profiles in intraductal papillary-mucinous tumors of the pancreas. Am J Pathol. 2002;160:1745–1754. doi: 10.1016/S0002-9440(10)61121-2. [DOI] [PMC free article] [PubMed] [Google Scholar]
- 42.Wang Q., Williamson M., Bott S., Brookman-Amissah N., Freeman A., Nariculam J., Hubank M.J., Ahmed A., Masters J.R. Hypomethylation of WNT5A: CRIP1 and S100P in prostate cancer. Oncogene. 2007;26:6560–6565. doi: 10.1038/sj.onc.1210472. [DOI] [PubMed] [Google Scholar]
- 43.Droin N., Hendra J.B., Ducoroy P., Solary E. Human defensins as cancer biomarkers and antitumour molecules. J Proteomics. 2009;72:918–927. doi: 10.1016/j.jprot.2009.01.002. [DOI] [PubMed] [Google Scholar]
- 44.Hofman P.M. Pathobiology of the neutrophil-intestinal epithelial cell interaction: role in carcinogenesis. World J Gastroenterol. 2010;16:5790–5800. doi: 10.3748/wjg.v16.i46.5790. [DOI] [PMC free article] [PubMed] [Google Scholar]
- 45.Azab B., Bhatt V.R., Phookan J., Murukutla S., Kohn N., Terjanian T., Widmann W.D. Usefulness of the neutrophil-to-lymphocyte ratio in predicting short- and long-term mortality in breast cancer patients. Ann Surg Oncol. 2011 doi: 10.1245/s10434-011-1814-0. [DOI] [PubMed] [Google Scholar]
- 46.Jensen H.K., Donskov F., Marcussen N., Nordsmark M., Lundbeck F., von der Maase H. Presence of intratumoral neutrophils is an independent prognostic factor in localized renal cell carcinoma. J Clin Oncol. 2009;27:4709–4717. doi: 10.1200/JCO.2008.18.9498. [DOI] [PubMed] [Google Scholar]
- 47.Lesniak W., Slomnicki L.P., Filipek A. S100A6—new facts and features. Biochem Biophys Res Commun. 2009;390:1087–1092. doi: 10.1016/j.bbrc.2009.10.150. [DOI] [PubMed] [Google Scholar]
- 48.Nedjadi T., Kitteringham N., Campbell F., Jenkins R.E., Park B.K., Navarro P., Ashcroft F., Tepikin A., Neoptolemos J.P., Costello E. S100A6 binds to annexin 2 in pancreatic cancer cells and promotes pancreatic cancer cell motility. Br J Cancer. 2009;101:1145–1154. doi: 10.1038/sj.bjc.6605289. [DOI] [PMC free article] [PubMed] [Google Scholar]
- 49.Slomnicki L.P., Nawrot B., Lesniak W. S100A6 binds p53 and affects its activity. Int J Biochem Cell Biol. 2009;41:784–790. doi: 10.1016/j.biocel.2008.08.007. [DOI] [PubMed] [Google Scholar]
- 50.Komatsu K., Murata K., Kameyama M., Ayaki M., Mukai M., Ishiguro S., Miyoshi J., Tatsuta M., Inoue M., Nakamura H. Expression of S100A6 and S100A4 in matched samples of human colorectal mucosa, primary colorectal adenocarcinomas and liver metastases. Oncology. 2002;63:192–200. doi: 10.1159/000063812. [DOI] [PubMed] [Google Scholar]
- 51.Vimalachandran D., Greenhalf W., Thompson C., Luttges J., Prime W., Campbell F., Dodson A., Watson R., Crnogorac-Jurcevic T., Lemoine N., Neoptolemos J., Costello E. High nuclear S100A6 (Calcyclin) is significantly associated with poor survival in pancreatic cancer patients. Cancer Res. 2005;65:3218–3225. doi: 10.1158/0008-5472.CAN-04-4311. [DOI] [PubMed] [Google Scholar]
- 52.Wang X.H., Zhang L.H., Zhong X.Y., Xing X.F., Liu Y.Q., Niu Z.J., Peng Y., Du H., Zhang G.G., Hu Y., Liu N., Zhu Y.B., Ge S.H., Zhao W., Lu A.P., Li J.Y., Ji J.F. S100A6 overexpression associates with poor prognosis and is epigenetically up-regulated in gastric cancer. Am J Pathol. 2010;177:586–597. doi: 10.2353/ajpath.2010.091217. [DOI] [PMC free article] [PubMed] [Google Scholar]
- 53.Mallick P., Kuster B. Proteomics: a pragmatic perspective. Nature Biotechnol. 2010;28:695–709. doi: 10.1038/nbt.1658. [DOI] [PubMed] [Google Scholar]
- 54.Rauser S., Deininger S.O., Suckau D., Hofler H., Walch A. Approaching MALDI molecular imaging for clinical proteomic research: current state and fields of application. Expert Rev Proteomics. 2010;7:927–941. doi: 10.1586/epr.10.83. [DOI] [PubMed] [Google Scholar]
- 55.Caprioli R.M. Deciphering protein molecular signatures in cancer tissues to aid in diagnosis, prognosis, and therapy. Cancer Res. 2005;65:10642–10645. doi: 10.1158/0008-5472.CAN-04-3581. [DOI] [PubMed] [Google Scholar]
Associated Data
This section collects any data citations, data availability statements, or supplementary materials included in this article.
Supplementary Materials
A: Significance Analysis of Microarrays (SAM) plot. Circles in plot represent individual m/z species. Dashed lines delimit the area of random effect. Red circles indicate that higher expression correlates with a higher risk. Inset lists the m/z species together with their individual q-values (indirectly related to the false discovery rate, which was set to a maximum of 10%). B: Correlation coefficients between m/z species. Correlation coefficients were calculated by Spearman's rank correlation. Values above 0.8 were considered highly correlated. Thus, the correlated signals with the lower q-values (m/z 6226, m/z 8418, and m/z 11,655) were excluded from further consideration.
Kaplan-Meier graphs for MALDI imaging m/z species 3445, 6278, 8406, 8453, 10098, 11353, and 11613.
Fragment spectra of HNP-1 identification. Neutrophil defensin 1 was identified with a Mascot score of 109 (P < 0.05). Neutrophil defensin 1 is cleaved into the peptides HNP-1 or HNP-2 (see Uniprot entry: P59665). HNP-1 differs from HNP-1 by the absence of one amino acid residue. Theoretical mass calculations from the resulting peptides identified m/z 3445 as HNP-1 and m/z 3373 as HNP-2.
A: Comparison of seven- and three-signal protein signature. Seven-signal (left) and three-signal (right) protein signatures obtained by MALDI imaging were compared with regard to their prognostic information. Therefore, patients were first clustered on basis of the respective signature (upper panels: see Materials and Methods in main manuscript) and the resulting groups were then compared by Kaplan-Meier analyses (lower panels). Multivariate survival analyses by COX regression were performed in the MALDI imaging data set to assess the prognostic value of the three-signal protein signature in comparison with major clinical parameters (top) and with the seven-signal signature (bottom). Both analyses show that the three-protein signature is sufficient to be a significant indicator for patient survival, and even independent from clinical parameters. However, the full signature adds significant prognostic information.
Known and predicted interactions of S100-A6 (S100A6) with other proteins. This functional protein association network was obtained by searching the STRING online database (http://string-db.org) for the entry “S100A6,” Interestingly, S100-A6 binds directly to proteins such as p53 (TP53) and annexin 2 (ANXA2), which have been extensively described in the context of cancer.