

Abstract
Although prematurity is the single largest cause of death in children under 5 years of age, the current definition of prematurity, based on gestational age, lacks the precision needed for guiding care decisions. Here, we propose a longitudinal risk assessment for adverse neonatal outcomes in newborns based on a deep learning model that uses electronic health records (EHRs) to predict a wide range of outcomes over a period starting shortly before conception and ending months after birth. By linking the EHRs of the Lucile Packard Children’s Hospital and the Stanford Healthcare Adult Hospital, we developed a cohort of 22,104 mother-newborn dyads delivered between 2014 and 2018. Maternal and newborn EHRs were extracted and used to train a multi-input multitask deep learning model, featuring a long short-term memory neural network, to predict 24 different neonatal outcomes. An additional cohort of 10,250 mother-newborn dyads delivered at the same Stanford Hospitals from 2019 to September 2020 was used to validate the model. Areas under the receiver operating characteristic curve at delivery exceeded 0.9 for 10 of the 24 neonatal outcomes considered and were between 0.8 and 0.9 for 7 additional outcomes. Moreover, comprehensive association analysis identified multiple known associations between various maternal and neonatal features and specific neonatal outcomes. This study used linked EHRs from more than 30,000 mother-newborn dyads and would serve as a resource for the investigation and prediction of neonatal outcomes. An interactive website is available for independent investigators to leverage this unique dataset: https://maternal-child-health-associations.shinyapps.io/shiny_app/.
INTRODUCTION
Prematurity is the leading cause of death in children under 5 years of age and is associated with increased risk of short- and long-term morbidity (1). Although gestational age and birth weight along with other measures give clinicians an approximation of risk for neonatal morbidities and mortality, these data are increasingly recognized as poor predictors of outcome (2–4). Understanding which premature neonates are more likely to develop an acquired complication of prematurity on the basis of their underlying personal risk is a critical quest aligned with the precision medicine mandate of the 21st century (5).
Accurate risk prediction is crucial in perinatal and neonatal medicine. Validated clinical prediction calculators have estimated risk trajectories for common outcomes related to prematurity, including death, neurodevelopmental impairment, bronchopulmonary dysplasia (BPD), and others (6–8). Risk estimates using prediction calculators help clinicians and families choose interventions to pursue in hopes of securing the outcome(s) they value or most desire. To date, most clinical prediction calculators have limited predictive power and clinical utility owing to the small number of parameters considered and the single time point used. A small subset has robust modeling incorporating multiple time points to predict mortality, sepsis, and other diseases of the newborn (8–12). Here, we explore a deep learning approach to improve risk prediction by integrating serial and comprehensive neonatal and maternal information contained in electronic health records (EHRs) collected before and after birth.
Over the past decade, hospital systems have increasingly implemented EHR systems to capture and store clinical data. Longitudinal data capture along with the serialization of clinical information for patients with both acute and chronic health conditions, inpatient hospital stays, and outpatient care have revolutionized clinical medicine. EHRs have allowed formalized communication of large amounts of data among providers and have streamlined billing and, to some extent, research workflows (13). However, EHR clinical data are complex and difficult to interrogate. They are also heterogeneous and lack standardization (14). Recent computational advances help mitigate such limitations by data linkage and the availability of vast amounts of demographic, diagnostic, medication, and clinical data (14, 15). Moreover, these data can often be retrieved at a fraction of the time and cost spent on prospective cohort studies or clinical trials and include thousands or tens of thousands of additional patients (15).
Using the entire available maternal and newborn EHR medical history, we have used long short-term memory (LSTM) neural networks (16) and leveraged multitask learning (17), which optimizes multiple loss functions, to simultaneously predict the risk of the most important adverse postnatal outcomes (Fig. 1). This can be done at any time during the pregnancy and postnatal course from before birth to many months postnatally. The data examined serve as a valuable reference tool for both individuals and institutions interested in comprehensive neonatal risk prediction.
Fig. 1. Overview of the machine learning pipeline for prediction of neonatal outcomes.
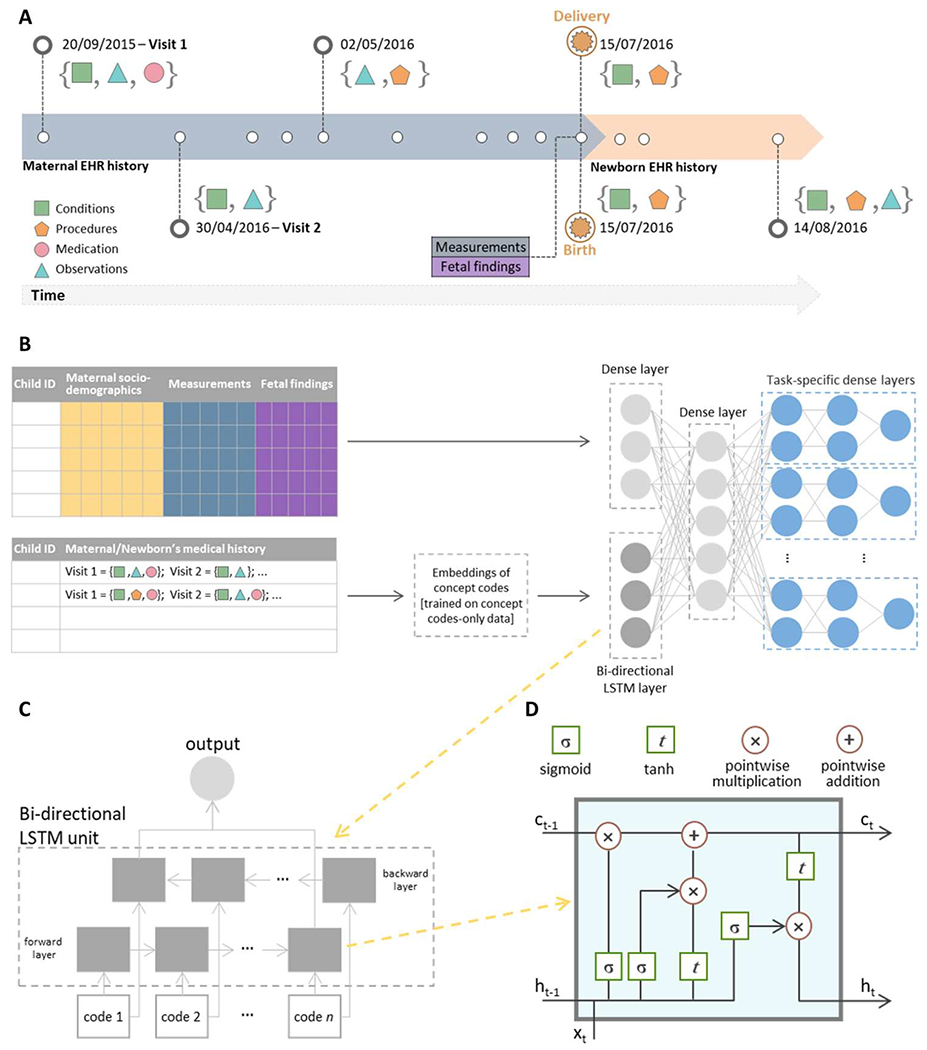
(A) An example of a hypothetical patient timeline with multiple visits before and after delivery/birth; at each visit, any combination of conditions, observations, medications, and procedures can be recorded. (B) Architecture of the multi-input multitask deep learning model: The sequence of codes from the maternal/newborn medical history, after code embeddings, is fed into a bidirectional LSTM layer with 128 units, whereas maternal/newborn sociodemographic information, maternal measurements, and, when specified, gestational age and birth weight are fed into a four-unit dense layer. The outputs of these two networks are then concatenated and fed into a dense one-layer neural network with 64 units, followed by a set of dense layers, one set for each outcome, consisting of two dense layers and a single-unit output. (C) A bidirectional LSTM layer learns bidirectional long-term dependencies between concept codes within a sequence: Embeddings of each code in the sequence are fed into a forward and a backward LSTM layer, and the outputs of the two layers are further concatenated. While processing, the hidden state from the layer of embeddings of the previous code in the sequence is passed to the layer of the embeddings of the following code of the sequence; the hidden state acts as the memory of the neural network, holding information on previous data the network has seen before. (D) Structure of a single LSTM layer for the tth code in the sequence: Ct is the cell state that carries relevant information throughout the processing of the sequence, ht is the hidden state of the tth code in the sequence that is passed to the layer of the next code in the sequence, and xt is the input to the layer processing the tth code in the sequence, that is, the vector corresponding to the embeddings of the tth code in the sequence. Each line carries an entire vector, circles represent pointwise operations, and boxes represent learned neural network layers with the indicated activation function. Lines merging denote concatenation, and line forking denotes that the content is copied and that the copies go to different locations. Conceptually, the LSTM layer learns what information must be discarded from the cell state and what new information has to be stored in the cell state; last, the output is calculated on the basis of the cell state and the processed input.
RESULTS
Maternal/newborn characteristics and neonatal outcomes
Two delivery cohorts were obtained by linking maternal and newborn EHRs from the Lucile Packard Children’s Hospital and the Stanford Healthcare Adult Hospital. Cohort 1 included 22,104 live births occurring from January 2014 to December 2018; cohort 2 included 10,250 live births occurring from January 2019 to September 2020. Maternal and newborn sociodemographic characteristics of live births in the two cohorts are reported in Table 1 along with the prevalence of each of the 24 neonatal outcomes. Concept codes in the EHR from five categories (conditions, medications, measurements, observations, and procedures) were extracted from both cohorts, with conditions and procedures each composing more than 40% of the overall feature set (fig. S1).
Table 1. Summary statistics of maternal/newborn characteristics and neonatal outcomes in Stanford cohorts 1 and 2.
Gestational age at delivery and newborn birth weight were missing for 713 and 463 newborns, respectively. RDS, respiratory distress syndrome; IVH, intraventricular hemorrhage; NEC, necrotizing enterocolitis; ROP, retinopathy of prematurity; BPD, bronchopulmonary dysplasia; PDA, patent ductus arteriosus; PVL, periventricular leukomalacia; CP, cerebral palsy; HTN, hypertension; MAS, meconium aspiration syndrome; CNS, central nervous system.
| n (%) or mean (±SD) | Cohorts 1 and 2 (n = 32,354) | Cohort 1 (n = 22,104) | Cohort 2 (n = 10,250) |
|---|---|---|---|
| Maternal characteristics | |||
| Maternal age at delivery | 32.8 (±5.6) | 32.2 (±5.7) | 32.7 (±5.4) |
| Maternal race/ethnicity | |||
| Asian | 8192 (25.3%) | 5229 (23.7%) | 2963 (28.9%) |
| Black or African American | 695 (2.1%) | 492 (2.2%) | 203 (2.0%) |
| Native Hawaiian | 642 (2.0%) | 426 (1.9%) | 216 (2.1%) |
| White | 10,707 (33.1%) | 7408 (33.5%) | 3299 (32.2%) |
| Hispanic/other | 10,025 (31.0%) | 7025 (31.8%) | 3000 (29.3%) |
| Decline to state | 641 (2.0%) | 501 (2.3%) | 140 (1.4%) |
| Unknown | 1452 (4.5%) | 1023 (4.6%) | 429 (4.2%) |
| Pre-eclampsia during pregnancy | 3201 (9.9%) | 2259 (10.2%) | 942 (9.2%) |
| Gestational diabetes | 4572 (14.1%) | 2848 (12.9%) | 1724 (16.8%) |
| Premature rupture of membranes | 2453 (7.6%) | 1653 (7.5%) | 800 (7.8%) |
| Chorioamnionitis | 1988 (6.1%) | 1237 (5.6%) | 751 (7.3%) |
| Group B Streptococcus carrier | 6280 (19.4%) | 4513 (20.4%) | 1767 (17.2%) |
| Number of codes in medical history up to delivery/birth | 217 (±236) | 202 (±216) | 250 (±272) |
| Newborn characteristics | |||
| Newborn sex | |||
| Male | 16,710 (51.6%) | 11,426 (51.7%) | 5284 (51.5%) |
| Female | 15,400 (47.6%) | 10,513 (47.6%) | 4887 (47.7%) |
| Unknown | 244 (0.8%) | 165 (0.7%) | 79 (0.8%) |
| Newborn birth weight (g) | 3128 (±525) | 3121 (±521) | 3145 (±535) |
| Newborn birth weight | |||
| ≥2500 g | 28,554 (89.5%) | 19,406 (89.2%) | 9148 (90.3%) |
| 1500–2499 g | 3100 (9.7%) | 2203 (10.1%) | 897 (8.9%) |
| 1000–1499 g | 125 (0.4%) | 89 (0.4%) | 39 (0.4%) |
| <1000 g | 109 (0.3%) | 64 (0.3%) | 45 (0.4%) |
| Missing | 466 | 345 | 121 |
| Gestational age at delivery (weeks) | 38.7 (±2.1) | 38.7 (±2.2) | 38.7 (±2.1) |
| Gestational age at delivery | |||
| ≥37 weeks | 27,999 (88.5%) | 19,025 (88.3%) | 8974 (88.6%) |
| 34 weeks and 0 days to 36 weeks and 6 days | 2499 (7.9%) | 1688 (7.6%) | 811 (8.0%) |
| 32 weeks and 0 days to 33 weeks and 6 days | 477 (1.5%) | 356 (1.7%) | 121 (1.2%) |
| <32 weeks | 389 (1.2%) | 275 (1.3%) | 114 (1.1%) |
| <28 weeks | 274 (0.9%) | 194 (0.9%) | 80 (0.8%) |
| Missing | 716 | 566 | 150 |
| Number of codes in medical history up to 2 months after birth | 49 (±73) | 51 (±80) | 44 (±56) |
| Neonatal outcomes | |||
| RDS | 2248 (6.9%) | 1590 (7.2%) | 658 (6.4%) |
| IVH | 249 (0.8%) | 177 (0.8%) | 72 (0.7%) |
| NEC | 78 (0.2%) | 44 (0.2%) | 34 (0.3%) |
| ROP | 554 (1.7%) | 412 (1.9%) | 142 (1.4%) |
| BPD | 270 (0.8%) | 201 (0.9%) | 69 (0.7%) |
| PDA | 965 (3.0%) | 717 (3.2%) | 248 (2.4%) |
| PVL | 24 (0.07%) | 15 (0.07%) | 9 (0.09%) |
| Sepsis | 579 (1.8%) | 472 (2.1%) | 107 (1.0%) |
| Pulmonary hemorrhage | 46 (0.1%) | 32 (0.1%) | 14 (0.1%) |
| CP | 66 (0.2%) | 60 (0.3%) | 6 (0.1%) |
| Pulmonary HTN | 154 (0.5%) | 117 (0.5%) | 37 (0.4%) |
| Hyperbilirubinemia | 15,015 (46.4%) | 10,922 (49.4%) | 4,093 (39.9%) |
| Death | 230 (0.7%) | 169 (0.8%) | 61 (0.6%) |
| MAS and other aspiration | 357 (1.1%) | 259 (1.2%) | 98 (1.0%) |
| Atelectasis | 314 (1.0%) | 270 (1.2%) | 44 (0.4%) |
| Candidiasis | 201 (0.6%) | 135 (0.6%) | 66 (0.6%) |
| Cardiac failure | 42 (0.1%) | 30 (0.1%) | 12 (0.1%) |
| Cardiovascular instability | 1761 (5.4%) | 1239 (5.6%) | 522 (5.1%) |
| Other CNS disorder | 52 (0.2%) | 40 (0.2%) | 12 (0.1%) |
| Neonatal gastroesophageal reflux | 206 (0.6%) | 120 (0.5%) | 86 (0.8%) |
| Respiratory failure | 873 (2.7%) | 610 (2.8%) | 263 (2.6%) |
| Polycythemia | 136 (0.4%) | 117 (0.5%) | 19 (0.2%) |
| Seizures | 116 (0.4%) | 84 (0.4%) | 32 (0.3%) |
| Anemia of prematurity | 750 (2.3%) | 554 (2.5%) | 196 (1.9%) |
To investigate the relationship between the 24 neonatal outcomes, we constructed a correlation network showing tetrachoric correlations greater than 0.5 between pairs of outcomes (Fig. 2A) and based on the maternal factors extracted from the EHR (Fig. 2B). Several correlations were observed between various neonatal comorbidities justifying the use of multitask learning. Sepsis, pulmonary hemorrhage, and atelectasis each showed correlations greater than 0.5 with 14 other outcomes. Conversely, the correlations of candidiasis, polycythemia, and meconium aspiration syndrome (MAS) with any of the other outcomes did not exceed 0.5. A hypothetical prediction model for BPD was generated incorporating known risk factors extracted from the maternal data (Fig. 2C).
Fig. 2. Overview of data components.
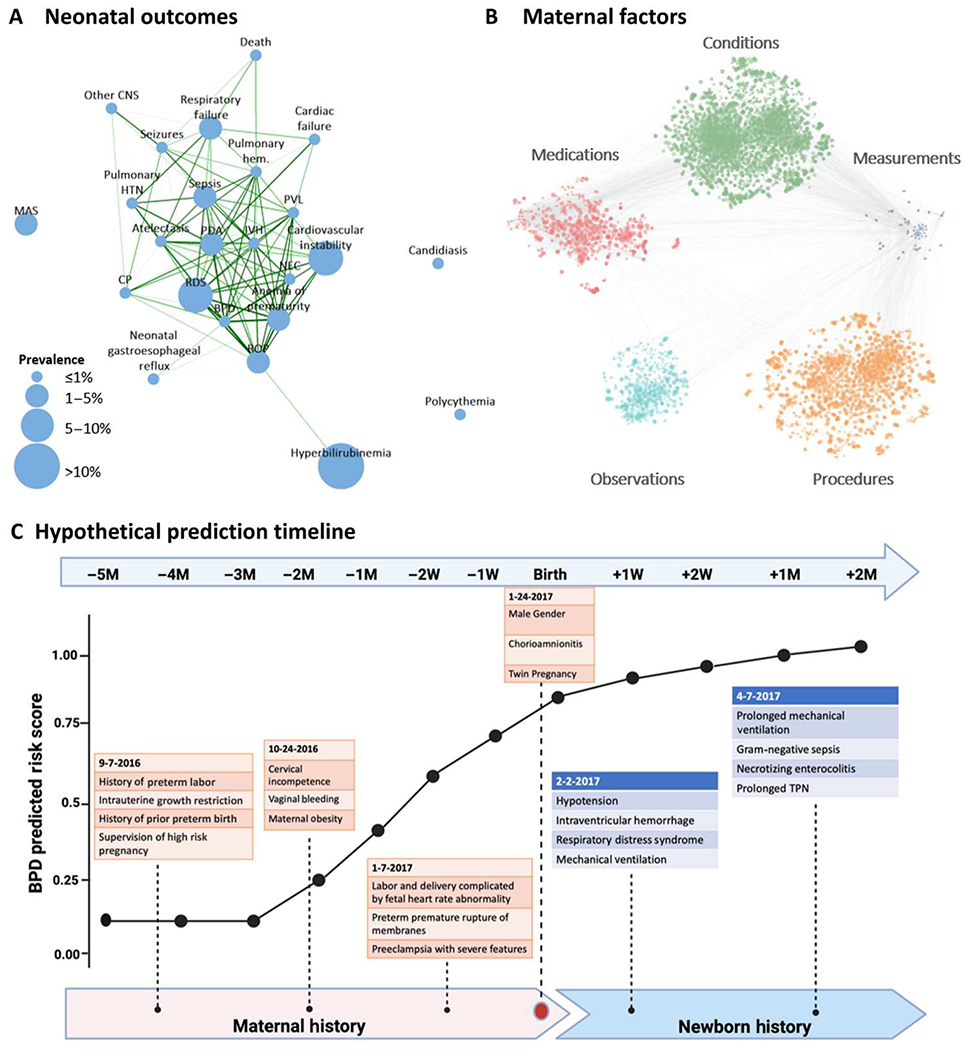
(A) Tetrachoric correlation plot of the 24 neonatal outcomes considered. The size of each node is proportional to its prevalence in the study dataset; nodes are connected if the correlation is greater than 0.5, and edge thickness and color are proportional to the strength of the correlation, with the darker green color and thicker lines showing stronger correlations. (B) Correlation plot of EHR codes in maternal medical histories and measurements: Each node represents a code or measurement. The size of the node is proportional to the metric (described in Materials and Methods) for feature importance, averaged across all outcomes; edges connect nodes whose correlation is among the top 1% of all correlations. (C) Hypothetical prediction timeline for a newborn with BPD; the predicted score from the deep learning model at different time points is based on various risk factors obtained from EHR records in the maternal and newborn history. Throughout pregnancy, at birth, and in the postnatal period, additional data are incorporated into the model, and the prediction model iteratively improves. BPD prediction scores should not be interpreted as individual probabilities for the later development of BPD. RDS, respiratory distress syndrome; IVH, intraventricular hemorrhage; NEC, necrotizing enterocolitis; ROP, retinopathy of prematurity; BPD, bronchopulmonary dysplasia; PDA, patent ductus arteriosus; PVL, periventricular leukomalacia; CP, cerebral palsy; HTN, hypertension; MAS, meconium aspiration syndrome; CNS, central nervous system; M, month.
Validation of the deep learning model to predict neonatal outcomes at delivery
A multi-input multitask deep learning model was trained using maternal and newborn’s information extracted from the EHRs of newborns in cohort 1 to predict the 24 neonatal outcomes at delivery/birth. This model was then tested in newborns in cohort 2, and the area under the receiver operating characteristic curve (AUC) and the area under the precision-recall curve (AUPRC) were compared to those in cohort 1. The performance of the deep learning model was similar across the two cohorts (figs. S2 and S3). AUCs, AUPRCs, and AUPRCs compared with a random classifier are reported in table S1. AUPRC compared to a random classifier to predict necrotizing enterocolitis (NEC) was 38.3 in cohort 1 and 39.5 in cohort 2. For intraventricular hemorrhage (IVH), AUPRC was 16.3 in cohort 1 and 28.9 in cohort 2. Given that the model showed satisfactory generalizability to independent datasets, we combined cohort 1 and cohort 2 and retrained the model at different time points (from 5 months before delivery up to 2 months after delivery) using fivefold cross-validation. Hereafter, we present the results in the combined cohorts.
The deep learning model predicts neonatal comorbidities before, at, and after birth
The multi-input multitask deep learning model provides longitudinal risk prediction for neonatal morbidities. AUCs and AUPRCs as compared with the AUPRC of a random classifier at different prediction time points from 5 months before delivery up to 2 months after delivery are reported in Fig. 3 (A and B). Predictions at delivery achieved AUCs ranging from 0.64 (MAS) to 0.99 (BPD and anemia of prematurity), with AUCs exceeding 0.9 for 10 of the 24 neonatal outcomes considered [IVH, NEC, retinopathy of prematurity (ROP), BPD, periventricular leukomalacia (PVL), pulmonary hemorrhage, death, atelectasis, cardiac failure, and anemia of prematurity] and between 0.8 and 0.9 for 7 additional outcomes [respiratory distress syndrome (RDS), patent ductus arteriosus (PDA), sepsis, cerebral palsy (CP), pulmonary hypertension, cardiac instability, and seizures]. The AUPRC was up to 62.7 times higher than that of a random classifier for PVL, 57.9 times higher for BPD, 41.4 times higher for death, and 39.4 for NEC (figs. S4 and S5). The calculators developed include detailed longitudinal outcome data such that a clinician can quantify risk for the fetus or infant.
Fig. 3. Multitask analysis of EHR data results in a longitudinal and comprehensive predictive model of neonatal morbidity before and after birth.
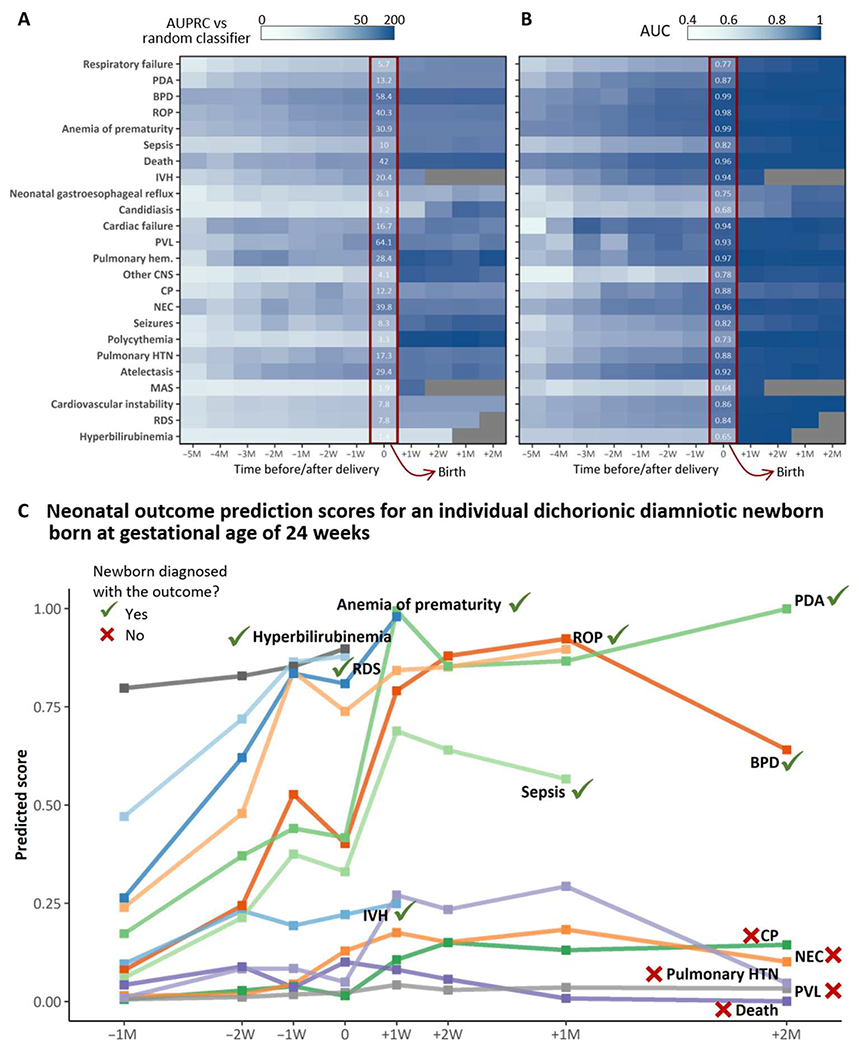
(A and B) The heatmaps are shaded according to the multitask modeling output that results in a fold increase/decrease in AUPRC (A) compared with a random classifier or AUC (B) of the deep learning model. The x axis represents time from 5 months before delivery/birth (−5M) up to 2 months after delivery/birth (+2M); 0 indicates delivery/birth. Numbers in white are the fold increase/decrease in AUPRC compared with a random classifier or AUC of the deep learning model at delivery/birth. All outcomes before birth incorporate maternal codes at either 5M,4M, 3M, 2M, 1M, 2W (2 weeks), or 1W before birth. All outcomes at birth incorporate all maternal inputs up to and including delivery. All outcomes after birth incorporate maternal and neonatal inputs up to a specific postnatal time point (1 week, 2 weeks, 1 month, or 2 months). (C) An example of neonatal outcome prediction scores for an individual dichorionic patient born at Lucile Packard Children’s Hospital at the gestational age of 24 weeks and 2 days after PPROM, chorioamnionitis, and spontaneous PTL. Risk prediction was calculated on the basis of maternal and neonatal codes that chronologically lead up to and include a specific diagnosis but do not extend beyond the date of an individual diagnosis (when this occurs). The patient ultimately had EHR diagnoses of RDS, IVH (grade I bilateral), BPD, sepsis, PDA, anemia of prematurity, ROP, and hyperbilirubinemia. The individual prediction score at birth was highest for ROP, anemia of prematurity, RDS, and hyperbilirubinemia, all diagnoses that the patient ultimately had. The prediction score at birth was lowest for NEC, pulmonary hypertension, CP, PVL, and death. Despite this infant’s high risk for these diagnoses, the patient is alive and never developed any of these outcomes, with the exception of transient pulmonary hypertension. We acknowledge and thank the parents of this patient who gave us permission to create and publish this individual’s risk prediction score.
The deep learning model showed good predictive performance before birth: 1 week before delivery, the AUC was higher than 0.9 for death and ROP and between 0.8 and 0.9 for IVH, NEC, BPD, PDA, PVL, pulmonary hemorrhage, CP, pulmonary hypertension (HTN), atelectasis, cardiac failure, and anemia of prematurity. Similarly, AUPRC at 1 week before delivery/birth was at least 10 times higher than that of a random classifier for 12 outcomes, in particular, 30.6 times higher for BPD, 25.1 times higher for atelectasis, and 24.8 and 24.4 times higher for ROP and PVL, respectively.
Frequency of visits and the amount of information contained in EHRs during pregnancy can reflect a newborn’s risk of developing adverse outcomes, with more frequent visits and a greater number of records stored in the EHR system potentially being associated with higher risk. A model that solely relies on the amount of EHR data would lack generalizability and applicability to other settings. Analyses aimed at evaluating the influence of amount of input information on the performance of the model showed that the deep learning model was robust to the amount of input information, leveraging the qualitative content of the EHR medical history rather than simply looking at the number of records available (tables S2 and S3).
Figure 3C demonstrates the predicted scores for an individual patient born at 24 weeks and 2 days gestational age, incorporating this patient’s unique maternal, neonatal, and infantile time series data to formulate predictions on various outcomes related to prematurity. This patient was chosen to provide an example of the model’s ability to predict neonatal outcomes. This patient had EHR diagnoses of RDS, IVH (grade I bilateral), BPD, sepsis, PDA, anemia of prematurity, ROP, and hyperbilirubinemia. The individual prediction score at birth was highest for ROP, anemia of prematurity, RDS, hyperbilirubinemia, and sepsis, all diagnoses that the patient ultimately had. The prediction score at birth was lowest for IVH, NEC, pulmonary hypertension, CP, PVL, and death. In summary, these data suggest that our model can predict individual outcomes on both a population and an individual level.
Validation of simplified logistic regression models in an external cohort
The generalizability of the approach used was assessed using simplified logistic regression models, which enabled careful mapping of concept codes between Stanford and University of California San Francisco (UCSF) data. Simplified logistic regression models were trained to predict IVH, NEC, anemia of prematurity, RDS, and PDA using cohorts 1 and 2 combined (overall, 32,354 mother-newborn dyads delivered at the Stanford hospitals). These simplified models were validated in an external cohort of 12,258 mother-newborn dyads obtained from UCSF EHRs (table S4). Details of the simplified models trained using Stanford data are outlined in table S5, and the results are visualized in fig. S6. AUCs of the models were similar across the Stanford and UCSF cohorts for all the five outcomes (IVH: 0.903 in Stanford versus 0.925 in UCSF; NEC: 0.942 versus 0.923; anemia of prematurity: 0.988 versus 0.944; RDS: 0.805 versus 0.793; and PDA: 0.849 versus 0.866). AUPRCs were comparable for IVH (0.188 in Stanford versus 0.230 in UCSF), PDA (0.316 versus 0.225), and RDS (0.504 versus 0.388); however, AUPRC dropped in the test data for NEC (0.195 versus 0.032) and anemia of prematurity (0.668 versus 0.275).
Subgroup discovery algorithm identifies subsets of newborns for which the predictive ability of the deep learning model is improved
Subgroup discovery was used to identify subgroups of newborns for whom the deep learning model at delivery/birth showed the highest predictive ability in terms of AUPRC. Using a 128-dimensional latent space of maternal EHR sequences obtained using an LSTM autoencoder (Fig. 4A), subgroup discovery yielded subsets of newborns comprising at least 30% of the whole study population (cohorts 1 and 2 combined) (Fig. 4B) where the model at delivery/birth achieved higher precision and recall (Fig. 4C and table S6). The subgroups identified achieved higher AUPRCs, particularly in comparison to a random classifier, for most neonatal outcomes. Above all, predictive ability of the model improved in subgroups identified for NEC (from 0.096 in the full dataset to 0.516 in the subgroup), ROP (from 0.690 to 0.860), BPD (from 0.487 to 0.641), PDA (from 0.394 to 0.466), hyperbilirubinemia (from 0.627 to 0.753), and anemia of prematurity (from 0.717 to 0.963). For most outcomes, subgroup discovery identified subsets of newborns with a lower prevalence of the outcome of interest compared with the full dataset. Because baseline AUPRC (the AUPRC of a random classifier) is equivalent to the prevalence of the outcome, it is important to compare the improvement with a random classifier. In subgroups identified, AUPRC of the model compared with a random classifier particularly improved for NEC (from 39.8 in the full dataset to 588.8 in the subgroup), anemia of prematurity (from 30.9 to 301.3), candidiasis (from 3.2 to 16.1), cardiac failure (from 16.7 to 64.3), atelectasis (from 29.4 to 103.2), and ROP (from 40.3 to 125.2). The subgroup discovery algorithm ultimately identified subgroups of newborns in which the predictive capability of the models was enhanced compared with the rest of the population, especially for outcomes that occur infrequently such as NEC.
Fig. 4. An LSTM-based autoencoder enables objective identification of subgroups with enhanced performance for the deep learning model.
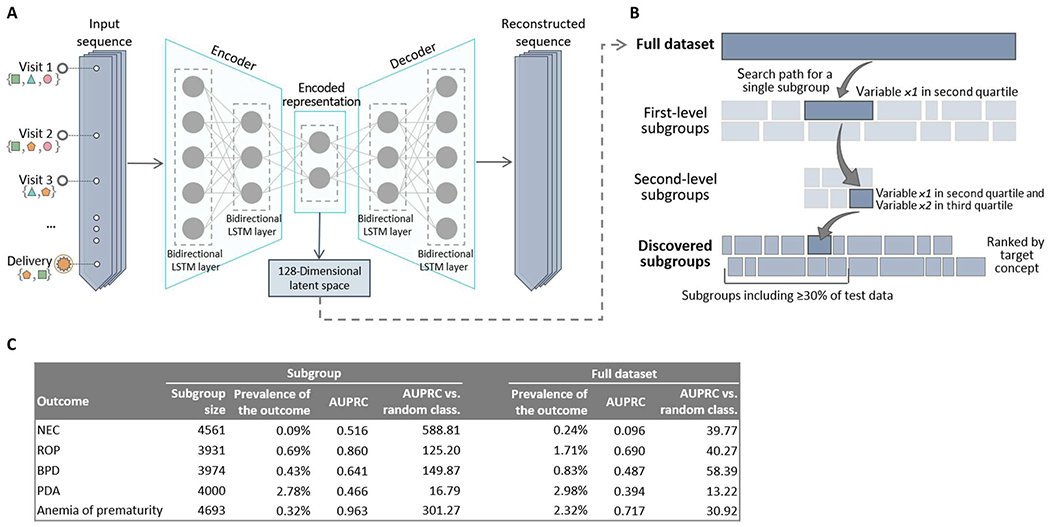
(A) Architecture of the LSTM autoencoder used to extract a lower-dimensional encoded representation of the input sequences containing the maternal EHR history. (B) Subgroup discovery proceeds iteratively at each level by dividing the dataset into many overlapping subgroups defined by variables of the obtained latent space. The search path for a single subgroup proceeds down two levels. At the end of the procedure, subgroups are scored and ranked on the basis of predefined scoring criteria (such as AUPRC) for further analysis. (C) Classification accuracy, in terms of AUC, AUPRC, and AUPRC compared with a random classifier, in subgroups identified through subgroup discovery and in the full dataset (cohorts 1 and 2 combined).
Comparisons with currently used risk scores
Although current risk scores for newborns are limited in scope and predictive power, we did perform comparisons against those that were calculable using variables available in our EHR system. The model at delivery/birth largely outperformed the “Appearance, Pulse, Grimace, Activity, and Respiration” (Apgar) score at 1 and 5 min in terms of both AUC and AUPRC as shown in tables S7 and S8 and figs. S7 and S8. AUPRC and AUC of the model was higher than that of both Apgar scores for most of the 24 outcomes, including RDS, IVH, NEC, ROP, BPD, PDA, sepsis, pulmonary hemorrhage, CP, pulmonary hypertension, hyperbilirubinemia, and death (all P values of <0.001). When evaluated in preterm newborns, the model was notably better in terms of AUPRC and AUC compared with the National Institute of Child Health and Human Development (NICHD) risk score (table S9). The model showed a significant improvement compared with the NICHD score for all the outcomes, with the exception of polycythemia and other central nervous system (CNS) disorders. Of note, the model was designed to measure many additional outcomes beyond those measured by the National Institute of Child Health and Human Development Neonatal Research Network (NICHD-NRN) or the Apgar score models. Hence, accurate comparisons require further studies.
Leveraging EHR data to explore pathological processes underlying neonatal conditions
For each of the five identifiable categories of conditions, medications, observations, procedures, and measurements, heatmaps show the odds ratios between the 50 codes (rows) for which the average odds ratio across all 24 outcomes was the highest and each of the 24 outcomes (columns) (figs. S9 to S13). All associations between concept codes and neonatal outcomes can also be interactively queried, visualized, and downloaded at https://maternal-child-health-associations.shinyapps.io/shiny_app/.
Of note, fig. S13 is a heatmap of odds ratios between maternal laboratory measurements 1 week before delivery and the 24 neonatal outcomes. Notable laboratory measurements that suggest a protective association against neonatal outcomes include serum albumin, serum protein, platelets, basophils, lymphocytes, and eosinophils. These data suggest that there is interplay between the maternal immune system at 1 week before delivery and the relative health of the fetus that carries forward into the neonatal period and beyond.
The correlation network in fig. S14 shows the codes and the interactions between the codes for which the average odds ratio across all 24 outcomes was the highest. Among these codes strongly associated with neonatal outcomes were maternal puerperal sepsis, prelabor rupture of membranes (PROM), preterm premature rupture of membranes (PPROM) with onset of labor unknown, PPROM with onset of labor later than 24 hours after rupture, opioid dependence in remission, fetal-maternal hemorrhage, various congenital heart diseases, and renal failure or dependence on dialysis. In addition, there were codes that appeared to be previously unreported risk factors for outcomes such as methicillin-susceptible Staphylococcus aureus carrier status, renal failure, blood cell indices such as hematocrit, chemotherapy exposure, and certain medications, including phosphodiesterase inhibitors and opiates.
Simultaneous modeling of neonatal morbidities improves predictive power by leveraging connections between morbidities
We compared the predictive performance of our multi-input multitask model at delivery/birth with that of 24 separate multi-input single-task models, each trained to predict one of the 24 outcomes of interest, to assess the benefit of the multitask approach. Results showed an improvement in both AUPRC and AUC of the multitask model in comparison with the single-task models (figs. S15 and S16). The largest improvements in terms of AUC were observed for PVL (0.515 for the single-task model versus 0.934 for the multitask model), NEC (0.629 versus 0.957), cardiac failure (0.618 versus 0.940), and pulmonary hemorrhage (0.687 versus 0.969). Given that there are a few neonatal outcomes that are exceptionally difficult for clinicians to predict, we undertook a detailed exploration of NEC and related outcomes of maternal anemia, neonatal anemia, and anemia of prematurity (Fig. 5, A to E). AUPRC and AUC for NEC using the single-task model were 0.007 and 0.629, respectively, as opposed to 0.095 and 0.957 obtained by the multitask model. The tetrachoric correlation between NEC and polycythemia was 0.13, whereas that between NEC and anemia of prematurity was 0.75. The two-output multitask model simultaneously predicting NEC and polycythemia achieved an AUPRC of 0.010 and an AUC of 0.636 for NEC, whereas the multitask model predicting NEC and anemia of prematurity achieved an AUPRC of 0.056 and an AUC of 0.897 (Fig. 5B).
Fig. 5. Pathological mechanisms underlying NEC that are leveraged by the multitask approach to improve NEC predictions.
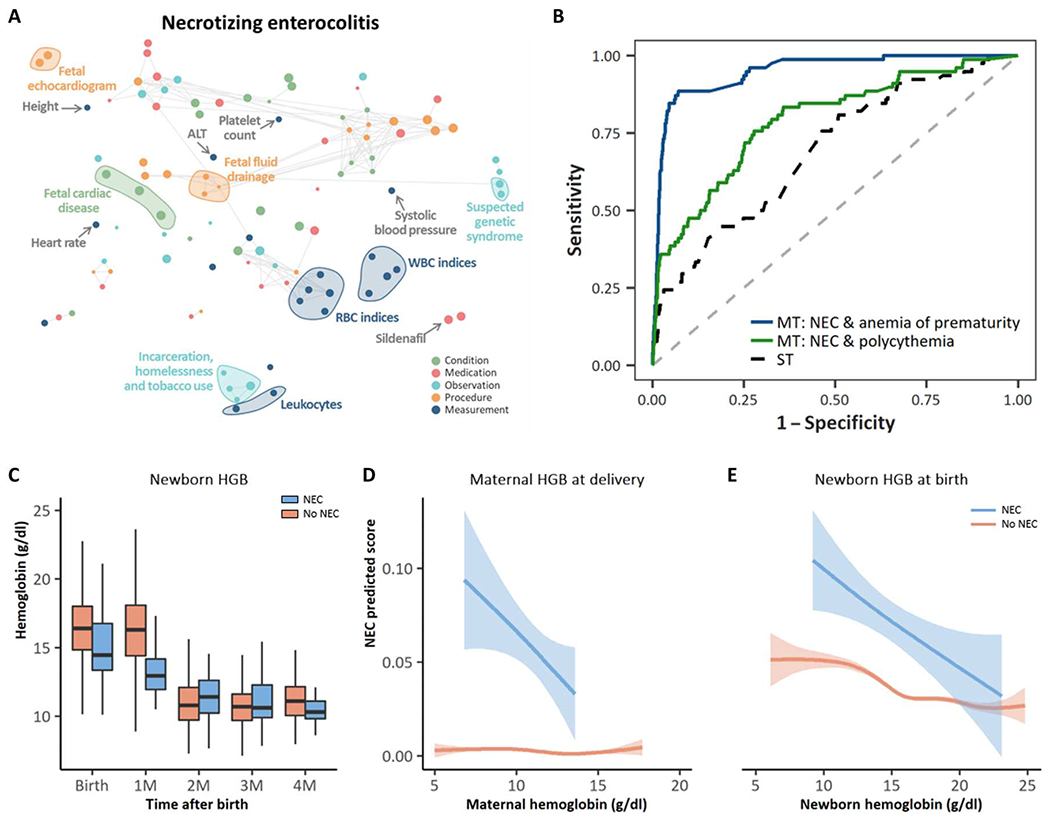
(A) Correlation network of the top 20 conditions, medications, observations, procedures, and measurements with the strongest association across all of the 24 neonatal outcomes, including NEC; the metric obtained from odds ratios as described in Materials and Methods was used to rank conditions, medications, measurements, procedures, and measurements; the top 20 concept codes within each set, i.e., those for which the average of the obtained metrics across all neonatal outcomes was the highest, were selected. A t-distributed stochastic neighbor embedding (tSNE) map of the resulting concept codes was constructed. Nodes represent concept codes (conditions, observations, procedures, medications, and measurements), and edges connect nodes with a correlation exceeding 0.8. Correlations were assessed using tetrachoric, biserial, or Pearson’s correlation coefficient, as appropriate; the size of the nodes is proportional to the odds ratio of NEC. The larger the node, the stronger the association with the outcome, regardless of whether it is a positive or a negative association. (B) AUC for the prediction of NEC of the single-task model (black dashed line), the two-output multitask model simultaneously predicting NEC and polycythemia (green line), and the two-output multitask model simultaneously predicting NEC and anemia of prematurity (blue line). (C) Comparison of neonatal hemoglobin concentrations at birth, 1 month, 2 months, 3 months, and 4 months of age for neonates diagnosed with NEC versus those not diagnosed with NEC. Infants who developed NEC had lower hemoglobin concentrations at birth compared with infants who did not develop NEC. (D) Maternal hemoglobin concentration at the time of delivery versus NEC predicted score for neonates diagnosed with NEC and those never diagnosed with NEC. (E) Newborn hemoglobin at birth versus NEC predicted score for neonates diagnosed with NEC and those never diagnosed with NEC.
The deep learning model independently classifies patients into IVH grades without explicit clinical guidance
Because IVH can also be difficult for clinicians to predict, we analyzed the IVH predicted score outputted by the model at delivery/birth for newborns with IVH. Of note, the model was not aimed at predicting the grade of IVH but rather at predicting IVH versus no IVH. Newborns with IVH were grouped on the basis of the IVH grade using records in newborns’ EHR (the grade was unspecified when there were no records related to the grade of IVH). The model assigned a higher risk score to newborns with more severe IVH grades, without inputs that included the grades themselves. The IVH predicted score was, on average, lower for newborns with lower actual IVH grades compared with ones with higher IVH grades, with statistically significant differences between “unspecified grade” and “grade IV” (P < 0.001) and between “grade I” and “grade IV” (P = 0.02; Fig. 6A). Given that IVH typically occurs within the first 96 hours of life, the IVH predicted score only included maternal and neonatal inputs that occurred at and before birth to avoid backward contamination of the algorithm.
Fig. 6. The deep learning model can discriminate between IVH gradings and provides insight into the pathological mechanisms underlying IVH.
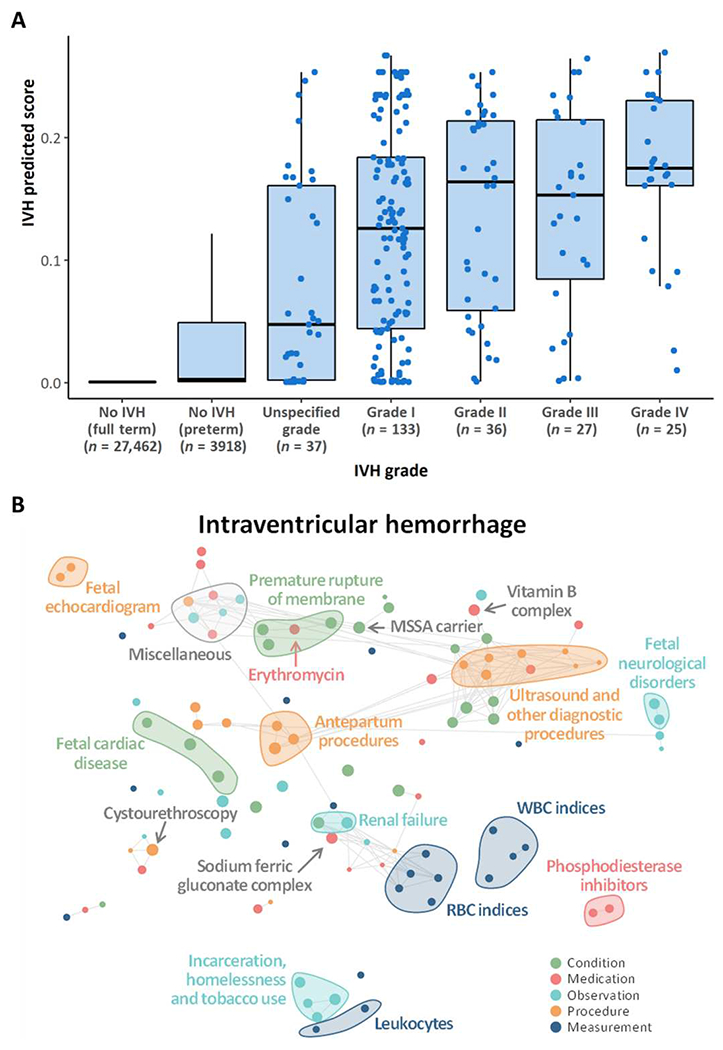
(A) IVH predicted scores from the model at delivery in newborns stratified by IVH grading. Patients with higher IVH prediction scores (≥0.2) are twice as likely to develop IVH compared with those with lower IVH prediction. IVH prediction scores should not be interpreted as individual probabilities for the development of IVH. Neonates in the unspecific grade category had discrepancies in the IVH grade reported in the ultrasound reports and their SNOMED coding such that it was difficult to classify them according to the Papile grading system. (B) Correlation network of the top 20 conditions, medications, observations, procedures, and measurements with the strongest association across all 24 neonatal outcomes. The metric obtained from odds ratios was used to rank conditions, medications, measurements, procedures, and measurements and to select the top 20 within each set with the highest average across neonatal outcomes. A tSNE map of the resulting features was constructed. Nodes represent conditions, observations, procedures, medications, and measurements, and edges connect nodes with a correlation exceeding 0.8; correlation was assessed using tetrachoric, biserial, or Pearson’s correlation coefficient, as appropriate. The size of the nodes is proportional to the odds ratio with IVH; the larger the node, the stronger is the association with the outcome, regardless of whether it is a positive or a negative association.
DISCUSSION
Using two cohorts with a total of 27,000 mothers linked to more than 32,000 neonates and validated externally with more than 12,000 newborns, we demonstrated the ability to serially and comprehensively predict neonatal outcomes from various maternal conditions extracted from EHRs. Using advanced machine learning methodologies, we have found previously unreported associations between maternal conditions (anemia, certain medication exposures, and social determinants of health) and neonatal outcomes such as NEC, BPD, IVH, PDA, and CP that have clinical plausibility. We have built a longitudinal clinical risk calculator incorporating longitudinal clinical data to predict neonatal outcomes beginning before birth and extending chronologically until 2 months of age. This calculator may have the potential to provide individualized care based on a risk assessment tool, understand longitudinal population level risk applied to individuals based on EHR data from two large quaternary medical centers, and assist in targeting individual patients most appropriate for enrollment into translational and clinical trials based on longitudinal risk for a given disease. Through subgroup discovery, we identified subgroups of newborns in which the models reached the best accuracy and precision, providing insight into the phenotypes of newborns for which the model is most reliable and, by exclusion, into those phenotypes in which the model lacks the necessary predictive power. These findings represent the first step toward reducing algorithmic bias and increasing fairness and equity across groups of the deep learning model, in view of a future deployment into practice.
The few clinical risk prediction models that do exist for neonates use algorithms based on a set of known risk factors captured at a singular point in time using data from large cohort studies. Within neonatology, calculators frequently used include the NICHD-NRN calculator, the BPD outcome estimator, the outcome trajectory estimator, the clinical risk index for babies (CRIB), and the Score for Neonatal Acute Physiology (SNAP) (7, 18, 19), among others. All of these predict survivability and other morbidities related to preterm birth or critical illness. However, these calculators only rely on information collected shortly before or after birth, making them difficult to rely on longitudinally. This is problematic given the lengthy hospitalizations of many critically ill neonates and the variable latencies for the most prevalent diseases. For instance, preterm birth often requires a 3- to 6-month neonatal intensive care unit hospitalization (20). Thus, the need for risk prediction calculators that incorporate longitudinal data is crucial, because risk in this population is dynamic, with an ever-increasing set of variables that serially accumulate and interact (20). Our EHR-based longitudinal clinical risk prediction tool has combined many of the advantageous elements of other calculators, including the ability to project risk for multiple morbidities concurrently while incorporating maternal and neonatal data simultaneously.
The comprehensive nature of the clinical data extracted has enabled us to uncover previously unreported maternal factors and conditions associated with neonatal risk. We found that NEC risk in infants was associated with conditions that stem from chronic medical illness in mothers, including maternal anemia, social determinants of health (homelessness and incarceration), and certain prenatal maternal medications, including indomethacin and sildenafil (Fig. 5A). IVH risk was associated with maternal factors including opiate exposure, renal failure, and methicillin-sensitive S. aureus carrier status (Fig. 6B). It is possible that these findings are influenced in part by the confounding of maternal conditions with postnatal sequelae. Hence, further studies are needed to validate these findings.
In addition, our findings lend nuance to the notion of clustering of acquired diseases of prematurity. It is well established that infants born prematurely often experience a co-occurrence of morbidities, including BPD, NEC, ROP, CP, and sepsis (21–23). We observed overlapping patterns of disease as evidenced by the large number of interconnected lines between each of the 24 different neonatal outcomes. RDS, anemia, BPD, sepsis, and NEC all highly correlated with one another as outcomes of prematurity. These outcomes can be predicted in aggregate on the basis of clinical trajectory of a maternal pregnancy but can also be identified individually, as for IVH. Our model demonstrates that IVH grade, based on the Papile grading system, can be predicted at birth. This suggests that the deep learning model is capable of categorizing outcomes in a manner similar to what has been corroborated by clinical epidemiologic research (21).
The current study is also one of the largest investigations of NEC risk that combines maternal and neonatal factors in a unified prediction. We found that in the multitask approach, anemia or anemia of prematurity was highly correlated with NEC. Our observation adds to prior evidence of association from smaller studies (24, 25). Severe anemia (hemoglobin <8) has been postulated as one of the first events in a cascading series of bowel-hypoxia-ischemia (25). Our findings suggest that the hemoglobin level in either mothers or neonates may also be associated with the development of NEC, because lower hemoglobin concentrations in mothers shortly after conception (mean maternal hemoglobin after conception was 13.1 g/dl for newborns who did not develop NEC and 12.0 g/dl for those who later developed NEC, P = 0.02) and at delivery (mean of 11.4 and 10.9 g/dl for those without and with NEC, P < 0.001) were correlated with neonates who later developed NEC. In addition, neonatal hemoglobin concentration at birth, along with greater variance in hemoglobin concentrations over the first 2 months of life, was also associated with the development of NEC. Impaired placental-fetal transfusion, which may occur with partial cord occlusion or early umbilical cord clamping, may be the first sentinel step in a sequence of events that contribute to anemia, transient hypovolemic shock, and ischemic stress that predispose for later NEC. Our findings suggest that maternal anemia may be a risk factor for NEC and that there is a relationship at delivery between the degree of maternal or neonatal anemia and subsequent risk of NEC. Ultimately, further prospective investigations are needed to validate this relationship.
There are several limitations that must be considered when evaluating this investigation. First, we recognize that Systemized Nomenclature of Medicine—Clinical Terms (SNOMED) coding as captured from the EHR does not always completely mimic or replicate clinical findings in patients (26). This is particularly true for categories such as diagnoses where clinical variability and interpretation can result in subjectivity. We also submit that predictive algorithms such as the Apgar score and the NICHD-NRN mortality risk score are not ideal comparative models and that interpretation of these findings must be done with caution.
Neonatal mortality and morbidities more commonly occur in extremely preterm or extremely low–birth weight newborns. Although the proportion of extremely preterm and low–birth weight newborns in our cohort reflects that seen across the United States, absolute numbers are likely to be inadequate to fully investigate morbidity patterns in these groups. Although we used mechanisms to protect against data leakage, such as removing concept codes used to define outcomes in newborns and separating the input of the model from the outcomes based on time so that the input always precedes the time at which outcomes were entered in the EHR system, other potential sources of information leakage may remain. Our goal was to develop models that could deal with real-world EHR data; however, it must be acknowledged that these data could include records of conditions, medications, or procedures that reflect preventive measures or risk assessment prompted by the provider’s intuition. One limitation of the LSTM network used to model the sequence of concept codes in the EHR history of newborn-mother dyads is that it cannot account for the time intervals between elements of the sequence. The time difference between visits or admissions can vary over time for the same patient and also across patients. Such variation could be indicative of complications or slow/quick progression of certain conditions. Future advancements in the field should include the development of models that incorporate the irregularity in time intervals in longitudinal EHR data.
In addition, the possibility of systematic measurement errors in the definition of neonatal diseases cannot be excluded. Although blinded manual chart review indicated high agreement with EHR-based definitions, we urge caution when interpreting outcomes generated by algorithms consisting of a combination of diagnostic codes present in EHR databases. Thorough external validation of our deep learning model was not possible because of data incompatibility across institutions, and further studies are needed to verify the ability of the deep learning model to predict neonatal outcomes independent of institution. Nevertheless, the validation of simplified logistic regression models showed good generalizability across institutions, suggesting that the deep learning model could hold promise to perform with sufficient accuracy in other institutions once data standards are broadly adopted.
Moreover, clinical risk prediction models should recommend specific decisions that a clinician can use, because studies have shown that it is the recommendations that are likely to influence provider behavior (27). We have not made specific recommendations for clinical decisions because this investigation has been designed and intended as a first step in longitudinal risk prediction. Only through additional validation and prospective intervention studies can our predictive models reasonably be used to recommend specific interventions or therapies.
The machine learning methodology used herein has allowed us to build predictive models for neonatal outcomes and will potentially serve as an important resource for clinicians and researchers to examine independently. The first longitudinal clinical risk prediction tool for various neonatal outcomes has been developed. We have also gained greater insight into the role of the fetal environment and its contribution to risk for neonatal disease. Future prospective studies are now needed to evaluate the model’s clinical impact.
MATERIALS AND METHODS
Study design
The aim of this study was to investigate the potential for longitudinal maternal and newborn EHRs to predict the risk over time of several adverse postnatal outcomes through a machine learning approach. This was a cohort study anchored in routinely collected EHRs at Stanford Hospital and Clinics and the Lucile Packard Children’s Hospital (California, USA). The linkage of the EHRs from the two hospitals allowed for a combination of serial maternal and neonatal data. All EHRs from inpatient and outpatient data were mapped to the Observational Medical Outcomes Partnership (OMOP) Common Data Model (CDM) version 5.3.1 (28, 29). Data included patient demographics; provider orders; diagnostic, procedural, medication, and laboratory tests; and clinical information collected during all inpatient and outpatient encounters. The study was approved by the Institutional Review Board of Stanford University (#39225).
An external validation cohort was obtained from EHRs from the UCSF Hospital and Clinics and the Benioff Children’s Hospital. The UCSF Perinatal Database provided the basis for the links between the pregnant patients and babies as well as gestational age at delivery. The UCSFOMOP Database contains demographics, diagnoses, medications, and procedures for pregnant patients and babies. This study was approved by the Institutional Review Board of UCSF (#17-22929). Further methodological details are available in the Supplementary Materials.
Delivery cohorts
We first identified a cohort of 193,546 pregnant patients of female gender aged between 14 and 45 years with at least one pregnancy-related record between January 2014 and September 2020. A pregnancy-related record consisted of any record of the codes identified in (30) to identify pregnancy episodes, broadly encompassing live birth, stillbirth, abortion (spontaneous and induced), delivery, pregnancy test, and ectopic pregnancy. Of the 193,546 pregnant patients identified, 27,521 were linked to 32,356 newborns delivered at one of the two hospitals between April 2014 and October 2020. For the remaining pregnancies, no resulting product of delivery was found because either this was only a record of pregnancy testing with no actual pregnancy, the pregnancy was delivered outside the two hospitals, or the pregnancy was terminated. Of the 32,356 newborns identified, 2 were further excluded because they had less than 30 days of observation time available after birth or because there were no records for the respective mothers before delivery. Among the 32,354 newborns from 27,519 mothers, 3639 were preterm, and 28,715 were term newborns; there were 644 twin pregnancies and 60 triplet pregnancies. Of the 27,519 mothers, 4449 delivered multiple infants at various points in time; 4087 delivered two newborns, 340 delivered three newborns, 20 delivered four newborns, and 2 delivered five newborns in total. The 32,354 newborns were then split into two cohorts: cohort 1 consisting of newborns delivered between January 2014 and December 2018 and cohort 2 consisting of newborns delivered between January 2019 and September 2020.
In addition, an independent external cohort of 12,256 dyads of pregnant patients and babies was derived from the UCSF EHRs. All dyads in the UCSF Perinatal Database with delivery dates between January 2013 and December 2016 and with records in the UCSF OMOP Database were included. Among the 12,256 newborns from 10,696 pregnant patients, 1856 were preterm and 10,400 were full term. There were 408 twin pregnancies and 11 triplet pregnancies. Of the 10,696 pregnant patients, 1466 delivered multiple infants during the 4 years of data collected: 1378 delivered two newborns, 81 delivered three, and 7 delivered four.
Maternal medical history and feature extraction
For each newborn, the entire maternal medical history available in the EHR up to delivery was extracted. This consisted of all conditions, observations, medications, procedures, and measurements recorded under the mother’s patient identification number. Different types of records were as follows: (i) conditions: presence of a disease or medical condition; (ii) observations: observed clinical sequelae obtained as part of the medical history; (iii) medications: utilization of any prescribed and over-the-counter medicines, vaccines, and large-molecule biologic therapies; (iv) procedures: records of activities or processes ordered by or carried out by a health care provider on the patient for a diagnostic or therapeutic purpose; and (v) measurements: structured values obtained through systematic and standardized examination or testing of a patient or patient’s sample such as laboratory tests, vital signs, quantitative findings from pathology reports, and so on. Conditions, observations, medications, and procedures were organized by patient and date and time of the day at which they were entered into the EHR system. EHRs entered on the same day and same time were further ordered as follows: conditions first and then medications, procedures, and observation, respectively. Records corresponding to conditions used to identify newborn’s outcomes were excluded to avoid potential leakage of information about the outcomes into the input data. The resulting entire sequence of time-ordered records, up to the time point of prediction (for example, at delivery, 1 week before delivery, 2 weeks before delivery, and so on), formed one newborn’s personalized input to the model. In addition, the most common measurements, available in ≥10% of mothers, were extracted to form an additional newborn’s personalized input together with maternal demographics (age at delivery and ethnicity) and, when specified, the newborn’s sex, gestational age at delivery, and birth weight. The full list of measurements used is reported in table S10. For each measurement, the result closest to the time point of prediction (for example, delivery), within 15 days before or after the point of prediction, was extracted (Fig. 1).
Newborn’s medical history and outcomes
Similarly, the entire newborn’s medical history of all conditions, observations, medications, and procedures was extracted and organized by time. For each neonate, the resulting sequence of records was combined to the sequence of records of the respective mother (up to delivery/birth) to form the input data for models at points of prediction after delivery.
Moreover, because we were interested in understanding whether machine learning could accurately predict a wide range of neonatal outcomes and to fully interrogate the shared neonatal pathologies via the multitask approach, a list of 24 neonatal outcomes was obtained as the presence or absence of any record related to each of these outcomes at any time in the newborn’s medical history that was available when the data were extracted (for example, from January 2021, allowing a minimum of 3 months of follow-up). Deaths occurring within 2 months after birth were considered. These outcomes were selected among those subsumed by the “Neonatal disorder” code (SNOMED code “22925008”) with enough cases (n ≥ 100) to allow meaningful analysis and excluding transient medical disorders such as tachypnea, vomiting, and electrolyte disturbance. Certain disorders affecting the same organ system were grouped to form a single, nongeneric outcome (for example, other CNS disorders). The codes used to identify the presence/absence of each outcome are reported in table S11. Blinded manual chart review of the 24 outcomes considered for 30 randomly sampled preterm newborns was conducted to assess the sensitivity and specificity of the definitions used. Overall sensitivity and specificity (across all outcomes) were 97.5 and 98.8%, respectively, showing high concordance between manual chart review adjudication and EHR-based definitions.
Data extraction from clinical notes and calculation of neonatal risk scores
Gestational age at delivery and birthweight were extracted from clinical notes in the newborns’ EHRs. Free text in clinical notes was systematically searched using regular expressions for “Gestational Age” and “Birth Weight”. The text after any of these mentions was extracted and converted into days for gestational age and grams for birth weight. When multiple clinical notes were available for the same newborn and values were discordant, the most commonly occurring value was retained or the average across all the different values if two or more values appeared with the same frequency. To check the accuracy of the information extracted from clinical notes compared to manual chart review, we randomly sampled 40 newborns from cohort 1, and their gestational age at delivery and birth weight were extracted by manually reviewing electronic charts. Comparison of these data with those extracted from clinical notes showed good accuracy (fig. S17).
Several neonatal risk scores have been developed to quantify the risk of mortality or severe outcomes in newborns (18). Most of these scoring systems have been derived from preterm newborns and target a single outcome, such as mortality. Our approach was to target a broader range of neonatal outcomes, including mortality, on all newborns, regardless of the gestational age at delivery. We compared the classification performance of our proposed model with that of two neonatal risk calculators: the Apgar score (31) and the NICHD-NRN mortality risk score (19). The Apgar score is routinely used in pediatrics and obstetrics to quickly evaluate the physical condition of all newborns after delivery. Among the calculators commonly used to assess survivability and risk for neurodevelopmental impairment in preterm newborns, the NICHD-NRN mortality risk score is frequently used in clinical practice. The score provides risk estimates for newborns delivered between 22 and 25 completed weeks of gestation, with a birth weight between 401 and 1000 g. Information to calculate the Apgar score and the NICHD-NRN mortality risk score was obtained from the clinical notes and conditions extracted from the maternal EHR history, as described in the Supplementary Materials.
The multi-input multitask deep learning model
We trained several multi-input multitask deep neural networks to simultaneously predict 24 neonatal outcomes at different time points from 5 months before delivery up to 2 months after delivery. For each of these models, the inputs of the model are the sequence of codes from the maternal and newborn’s medical history up to the time point of prediction, as well as maternal/newborn sociodemographic information, maternal measurements closest to the time of prediction, and when specified, gestational age and birth weight. Specifically, input codes included all of the maternal EHR records up to the time point of prediction or delivery, whichever occurred first, plus the newborn’s EHR records up to the time point of prediction (only for models predicting outcomes after delivery/birth). Demographic and clinical measurements were updated selecting the closest results to the time point of prediction or delivery (both within a 30-day time window), whichever occurred first, whereas gestational age and birth weight were added only in models obtained at delivery or onward. For example, for the model trained using data available at delivery/birth, input codes included all maternal EHR records up to delivery (the newborn date of birth) and no records from the newborn’s medical history, and demographic and clinical measurement input included measurements closest to delivery (within a 30-day time window), gestational age at delivery, and birth weight plus maternal/newborn sociodemographic information. On the other hand, the model obtained 1 week after delivery was based on the maternal medical history up to delivery combined with the newborn’s EHR codes up to 1 week after birth, and on the maternal/newborn sociodemographic information, gestational age at delivery, birth weight, and measurements closest to delivery formed input.
Global vector (GloVe) embeddings were trained for all the concept codes found in either the maternal or newborn’s medical histories; embeddings represent each concept code into a 128-dimensional space encoding some form of meaning. The GloVe model was trained on the nonzero entries of a global code-code co-occurrence matrix, which tabulated how frequently codes cooccur with one another in a patient’s EHR medical history.
EHR codes, after code embeddings, were fed into a bidirectional LSTM recurrent neural network with 128 units, whereas demographic data and clinical measurements were processed by a dense one-layer neural network with four units. The outputs of these two networks are then concatenated and fed into a dense one-layer neural network with 64 units, followed by a set of dense layers, one set for each outcome, consisting of two dense layers and a single-unit output. This deep learning approach proved to yield more accurate predictions when compared with a more traditional approach such as logistic regression (table S12). Analyses to evaluate the influence of the sequence length in input codes on the predictions returned by the model are described in detail in Supplementary Materials and Methods.
Model optimization and training was performed in cohort 1 using a nested fivefold cross-validation approach to avoid overfitting to the data. The model was then tested in cohort 2, and after assessing that model metrics were comparable across cohorts 1 and 2, the two cohorts were combined, and the models were retrained at different time points (from 5 months before delivery up to 2 months after delivery) using fivefold cross-validation. Cross-validation AUPRC and AUC were used to assess the classification performance of the model. Whereas AUPRC is based on precision (positive predicted value) and recall (sensitivity or true positive rate), AUC is based on recall and true-positive rate. AUPRC is resistant and not affected by large proportions of true negatives in the population, which characterize rare outcomes, because the truenegative rate is not used in the calculation of either precision or recall. For example, in a scenario where there are only 5% positive cases (and 95% negative cases), the AUPRC will focus on how the model handles the 5% of positive cases and will not be affected by how the model handles the 95% negative cases. Thus, a model that misclassifies all the positive cases will still have a high true-negative rate (95%, because all the negative cases will be correctly classified) and get a relatively high AUC. Hence, providing both AUC and AUPRC results in the most complete picture of the predictive ability of models when outcomes are rare, like some of the targeted neonatal outcomes. The reference value for AUC, or the AUC achieved by a random classifier, is always 0.5, regardless of the prevalence of the outcome; on the other hand, the reference value for AUPRC corresponds to the prevalence of the outcome and, therefore, differs from outcome to outcome. For visualization purposes, we also reported the fold increase/decrease of the AUPRC obtained by the model compared with the AUPRC of a random classifier, which corresponds to the prevalence of the outcome (Table 1).
When measurements, gestational age, and birth weight were missing, they were imputed using the respective mean values in the available data. All the analyses were performed using R v3.6.3, and the multi-input multitask deep neural networks were implemented using Keras through the R package “keras.” Models were trained using a batch size of 512, Adam optimization, and binary cross-entropy loss with early stopping (training was stopped after 10 consecutive epochs with no improvement in validation loss) or stopped after 100 epochs.
Internal and external validation
A multi-input multitask deep learning model, as described above, at delivery/birth was trained using fivefold cross-validation in newborns in cohort 1 and tested in newborns in cohort 2 to internally validate the deep learning model in an independent cohort. We then compared AUCs and AUPRCs obtained in the two cohorts. In addition, we trained a simplified model for five selected outcomes (RDS, NEC, IVH, PDA, and anemia of prematurity) using cohorts 1 and 2 combined and validated the performance in the external cohort obtained from the UCSF/Benioff Children’s Hospital. Linked maternal-newborn EHRs including conditions, medications, procedures, and measurements were available for 12,256 neonates in the UCSF EHR database. We first identified 1808 different OMOP CDM concept codes that were present in the maternal medical history up to delivery of at least 0.2% of pregnancies identified in the Stanford delivery cohorts (cohorts 1 and 2 combined). These were mapped to the relevant coding system used for UCSF EHRs: International Classification of Diseases (ICD) 9 and 10 for conditions, RxNorm for medications, Current Procedural Terminology (CPT4) for procedures, and Logical Observation Identifiers Names and Codes (LOINC) for measurements. Mapping was done as indicated in the OMOP CDM concept relationship table. For each of the codes, we then compared the proportion of maternal medical histories in which these codes were present up to delivery in Stanford and UCSF pregnancies (fig. S7A). To avoid bias because of the differential utilization of codes in the two EHR systems, we restricted subsequent analyses to the 850 concept codes for which the proportions in the two datasets were similar (when the proportion of maternal medical histories at UCSF in which the concept code was present was at least half and less than twice the same proportion at Stanford).
Binary variables indicating the presence/absence of these selected 850 concept codes in the maternal medical history up to delivery were generated in both Stanford and UCSF data. For each selected outcome, concept codes were ranked on the basis of their association with the outcome (assessed using odds ratio) in the Stanford data, and a logistic model with the top 10 codes plus gestational age was trained using Stanford cohorts. These models were then tested in the USCF data, and AUC and AUPRC were calculated. These simplified models served to verify the generalizability and transferability of the more complex multi-input multitask model to external health care settings. External validation of the full model was not possible because of the difference in the coding system used.
Associations between input features and outcomes
To investigate what information drives the predictions of neonatal outcomes, we evaluated the importance of each EHR code, also grouped in sets of conditions, medications, observations, and procedures. Maternal medical history and measurements up to 1 week before delivery in newborns in cohorts 1 and 2 were considered to identify features contributing to the development of neonatal outcomes beyond those immediately preceding delivery and during labor.
First, a code set removal experiment was conducted. In addition, we explored the importance of each EHR code toward the prediction of each neonatal outcome. A total of 13,668 unique codes were found in maternal medical histories up to 1 week before delivery; of these, 7082 were present in fewer than five maternal medical histories and were therefore excluded from this analysis. For each of the 6586 unique codes found in at least five maternal medical histories, a binary variable was created indicating the presence/absence of that code in the maternal medical history up to 1 week before delivery. Then, odds ratios were calculated for each of these 6586 binary variables and for each of the 24 neonatal outcomes, alongside the respective P values to assess their significance. Similarly, odds ratios were calculated for each of the measurements considered (using the results closest to 1 week before delivery) and each of the 24 outcomes. Unless otherwise specified, each measurement was dichotomized splitting by the respective median, and logistic regression was used to calculate odds ratios and the corresponding P values. By the way in which they were defined, there were no missing data for the binary variables indicating the presence/absence of concept codes. For measurements, missing data were not imputed; a complete case approach was used to estimate odds ratios.
To balance between the strength of the association and the statistical significance, we developed a metric as follows: Odds ratios (or the inverse of their reciprocal: −1/odds ratio, for odds ratios <1) were multiplied by 1 minus the respective P value. The obtained metric was capped to 10 (or −10) to reduce the impact of outliers. The obtained metric ranged from −10 (a strong negative association between the code and outcome, meaning that the presence of the code in the maternal medical history, or the measurement being above the median, reduces the risk of the outcome) to +10 (a very strong positive association indicating that the presence of the code in the maternal medical history, or the measurement being above the median, increases the risk of the outcome).
Supplementary Material
Acknowledgments:
This research used data or services provided by STARR,“Stanford medicine Research data Repository,” a clinical data warehouse containing live Epic data from Stanford Health Care, the Stanford Children’s Hospital, the University Healthcare Alliance and Packard Children’s Health Alliance clinics, and other auxiliary data from hospital applications such as radiology picture archiving and communication system (PACS). The STARR platform is developed and operated by the Stanford Medicine Research IT team and is made possible by Stanford School of Medicine Research Office.
Funding:
This work was supported by the NIH grants R35GM138353 (to N.A.), 1R01HL139844 (to B.G., M.S.A., D.K.S., and N.A.), 3P30AG066515 (to N.A.), 1R61NS114926 (to M.S.A., B.G., and N.A.), 1R01AG058417 (to M.S.A., B.G., and N.A.), R01HD105256 (to B.G., D.K.S., M.S., and N.A.), P01HD106414 (to B.G., D.K.S., M.S., and N.A.), T32GM007618 (to A.S.T.),and T32GM067547 (to J.R.); the National Science Foundation Graduate Research Fellowship Program 2038436 (to J.R.); the Burroughs Welcome Fund (to N.A.); the American Heart Association 19PABHI34580007 (to N.A.); the Alfred E. Mann Foundation (to N.A.); March of Dimes (to M.S.A., B.G., D.K.S., M.S., and N.A.); and the Robertson Foundation (to D.K.S.).
Footnotes
Competing interests: The methods described in this manuscript are covered in the U.S. provisional patent no. 63/268,689 (“Systems and methods to assess neonatal health risk and uses thereof”) filed on 28 February 2022 by Stanford University. The authors declare that they have no other competing interests relevant to this work. S.M. is a paid consultant for Danaher and Longitude Capital and receives a paid fellowship from Nucleate. N.G.R. is currently a full-time employee of Illumina Inc. J.H.F. is an advisor to Vitara, OvaryIt, Keriton, EmpoHealth, and Avanos; the consulting medical director of Novonate; and a cofounder for EMME. B.C. is a paid consultant for Gauss Surgical and currently consults for Stryker and Flat Medical. K.G.S. is a consultant for Avexegen Therapeutics, Infinant Health, mProbe,and Mission Biocapital. M.S.A. is a member of the Scientific Advisory Board of Cytonics Inc. and AfaSci Research Laboratories and is a paid consultant for Syneos Health. D.K.S. is a member of the Clinical Advisory Board of Maternica Therapeutics. M.S. is a member of the Scientific Advisory Board of Exagen and Aria Pharmaceuticals and is a shareholder at Somnics. N.A. is a member of the Scientific Advisory Boards of January AI, Parallel Bio, Celine Therapeutics, and WellSim Biomedical Technologies and is a paid consultant for MaraBio Systems.
Data and materials availability:
The aggregated results set, excluding patient-level health information, are available in data file S1. Data partners (Stanford University and University of California, San Francisco) contributing to this study remain custodians of individual patient-level health information. A repository with the original R code used to train the multi-input multitask model has been created (10.5281/zenodo.7537865). All data associated with this study are present in the paper or the Supplementary Materials.
REFERENCES AND NOTES
- 1.Liu L, Oza S, Hogan D, Chu Y, Perin J, Zhu J, Lawn JE, Cousens S, Mathers C, Black RE, Global, regional, and national causes of under-5 mortality in 2000–15: An updated systematic analysis with implications for the Sustainable Development Goals. Lancet 388, 3027–3035 (2016). [DOI] [PMC free article] [PubMed] [Google Scholar]
- 2.Tyson JE, Parikh NA, Langer J, Green C, Higgins RD, Intensive care for extreme prematurity—Moving beyond gestational age. N. Engl. J. Med 358, 1672–1681 (2008). [DOI] [PMC free article] [PubMed] [Google Scholar]
- 3.Stoll BJ, Hansen NI, Bell EF, Walsh MC, Carlo WA, Shankaran S, Laptook AR, Sánchez PJ, Van Meurs KP, Wyckoff M, Das A, Hale EC, Ball BB, Newman NS, Schibler K, Poindexter BB, Kennedy KA, Cotten CM, Watterberg KL, D’Angio CT, DeMauro SB, Truog WE, Devaskar U, Higgins RD, Trends in care practices, morbidity, and mortality of extremely preterm neonates, 1993-2012. JAMA 314, 1039–1051 (2015). [DOI] [PMC free article] [PubMed] [Google Scholar]
- 4.Stoll BJ, Hansen NI, Bell EF, Shankaran S, Laptook AR, Walsh MC, Hale EC, Newman NS, Schibler K, Carlo WA, Kennedy KA, Poindexter BB, Finer NN, Ehrenkranz RA, Duara S, Sanchez PJ, O’Shea TM, Goldberg RN, Van Meurs KP, Faix RG, Phelps DL, Frantz ID, Watterberg KL, Saha S, Das A, Higgins RD; Eunice Kennedy Shriver National Institute of Child Health and Human Development Neonatal Research Network, Neonatal outcomes of extremely preterm infants from the NICHD Neonatal Research Network. Pediatrics 126, 443–456 (2010). [DOI] [PMC free article] [PubMed] [Google Scholar]
- 5.Stevenson DK, Wong RJ, Hay WW Jr, Comments on the 20th anniversary of NeoReviews. Neoreviews 21, e643–e648 (2020). [DOI] [PubMed] [Google Scholar]
- 6.Rysavy MA, Li L, Bell EF, Das A, Hintz SR, Stoll BJ, Vohr BR, Carlo WA, Shankaran S, Walsh MC, Tyson JE, Cotten CM, Smith PB, Murray JC, Colaizy TT, Brumbaugh JE, Higgins RD; Eunice Kennedy Shriver National Institute of Child Health and Human Development Neonatal Research Network, Between-hospital variation in treatment and outcomes in extremely preterm infants. N. Engl. J. Med 372, 1801–1811 (2015). [DOI] [PMC free article] [PubMed] [Google Scholar]
- 7.Laughon MM, Langer JC, Bose CL, Smith PB, Ambalavanan N, Kennedy KA, Stoll BJ, Buchter S, Laptook AR, Ehrenkranz RA, Cotten CM, Wiison-Costeiio DE, Shankaran S, Meurs KPV, Davis AS, Gantz MG, Finer NN, Yoder BA, Faix RG, Carlo WA, Schibler KR, Newman NS, Rich W, Das A, Higgins RD, Walsh MC, Prediction of bronchopulmonary dysplasia by postnatal age in extremely premature infants. Am. J. Respir. Crit. Care Med 183, 1715–1722 (2011). [DOI] [PMC free article] [PubMed] [Google Scholar]
- 8.Ambalavanan N, Carlo WA, Tyson JE, Langer JC, Walsh MC, Parikh NA, Das A, Van Meurs KP, Shankaran S, Stoll BJ, Higgins RD; Generic Database; Subcommittees of the Eunice Kennedy Shriver National Institute of Child Health and Human Development Neonatal Research Network, Outcome trajectories in extremely preterm infants. Pediatrics 130, e115–e125 (2012). [DOI] [PMC free article] [PubMed] [Google Scholar]
- 9.Fleiss N,Coggins SA,Lewis AN,Zeigler A,Cooksey KE,Walker LA,Husain AN,de Jong BS, Wallman-Stokes A, Alrifai MW, Visser DH, Good M, Sullivan B, Polin RA, Martin CR, Wynn JL, Evaluation of the neonatal sequential organ failure assessment and mortality risk in preterm infants with late-onset infection. JAMA Netw. Open 4, e2036518 (2021). [DOI] [PMC free article] [PubMed] [Google Scholar]
- 10.Lewis AN, de la Cruz D, Wynn JL, Frazer LC, Yakah W, Martin CR, Yang H, Itriago E, Unger J, Hair AB, Miele J, Sullivan BA, Husain A, Good M, Evaluation of the neonatal sequential organ failure assessment and mortality risk in preterm infants with necrotizing enterocolitis. Neonatology 119, 334–344 (2022). [DOI] [PMC free article] [PubMed] [Google Scholar]
- 11.King WE, Carlo WA, O’Shea TM, Schelonka RL; HRC neurodevelopmental follow-up investigators, Multivariable predictive models of death or deurodevelopmental impairment among extremely low birth weight infants using heart rate characteristics. J. Pediatr 242, 137–144.e4 (2022). [DOI] [PubMed] [Google Scholar]
- 12.Moorman JR, Carlo WA, Kattwinkel J, Schelonka RL, Porcelli PJ, Navarrete CT, Bancalari E, Aschner JL, Whit Walker M, Perez JA, Palmer C, Stukenborg GJ, Lake DE, O’Shea TM, Mortality reduction by heart rate characteristic monitoring in very low birth weight neonates: A randomized trial. J. Pediatr 159, 900–906.e1 (2011). [DOI] [PMC free article] [PubMed] [Google Scholar]
- 13.Tarabichi Y, Frees A, Honeywell S, Huang C, Naidech AM, Moore JH, Kaelber DC, The cosmos collaborative: A vendor-facilitated electronic health record data aggregation platform. ACI Open 05, e36–e46 (2021). [DOI] [PMC free article] [PubMed] [Google Scholar]
- 14.Espinosa C, Becker M, Marić I, Wong RJ, Shaw GM, Gaudilliere B, Aghaeepour N, Stevenson DK; Prematurity Research Center at Stanford, Data-driven modeling of pregnancy-related complications. Trends Mol. Med 8, 762–776 (2021). [DOI] [PMC free article] [PubMed] [Google Scholar]
- 15.Goldstein BA, Navar AM, Pencina MJ, loannidis JPA, Opportunities and challenges in developing risk prediction models with electronic health records data: A systematic review. J. Am. Med. Inform. Assoc 24, 198–208 (2017). [DOI] [PMC free article] [PubMed] [Google Scholar]
- 16.Hochreiter S, Schmidhuber J, Long short-term memory. Neural Comput. 9, 1735–1780 (1997). [DOI] [PubMed] [Google Scholar]
- 17.Ruder S, An overview of multi-task learning in deep neural networks. arXiv:1706.05098 (15 June 2017). [Google Scholar]
- 18.Dorling JS, Field DJ, Manktelow B, Neonatal disease severity scoring systems. Arch. Dis. Child. Fetal Neonatal Ed 90, F11–F16 (2005). [DOI] [PMC free article] [PubMed] [Google Scholar]
- 19.NICHD Neonatal Research Network (NRN). Extremely preterm birth outcome data; https://nichd.nih.gov/research/supported/EPBO.
- 20.Seaton SE, Draper ES, Adams M, Kusuda S, Håkansson S, Helenius K, Reichman B, Lehtonen L, Bassler D, Lee SK, Vento M, Darlow BA, Rusconi F, Beltempo M, Isayama T, Lui K, Norman M, Yang J, Shah PS, Modi N; UK Neonatal Collaborative; International Network for Evaluating Outcomes of Neonates (iNeo) Investigators; ANZNN (Australian and New Zealand Neonatal Network); CNN (Canadian Neonatal Network); NRNJ (Neonatal Research Network Japan); SEN1500 (Spanish Neonatal Network); SwissNeoNet (Swiss Neonatal Network), Variations in neonatal length of stay of babies born extremely preterm: An international comparison between iNeo networks. J. Pediatr 233, 26–32.e6 (2021). [DOI] [PubMed] [Google Scholar]
- 21.Leviton A, Dammann 0, Engelke S, Allred E, Kuban KC, O’Shea TM, Paneth N; ELGAN study investigators, The clustering of disorders in infants born before the 28th week of gestation. Acta Paediatr. 99, 1795–1800 (2010). [DOI] [PMC free article] [PubMed] [Google Scholar]
- 22.Schmidt B, Asztalos EV, Roberts RS, Robertson CMT, Sauve RS, Whitfield MF; Trial of Indomethacin Prophylaxis in Preterms (TIPP) Investigators, Impact of bronchopulmonary dysplasia, brain injury, and severe retinopathy on the outcome of extremely low-birth-weight infants at 18 months: Results from the trial of indomethacin prophylaxis in pre-terms. JAMA 289, 1124–1129 (2003). [DOI] [PubMed] [Google Scholar]
- 23.Bassler D, Stoll BJ, Schmidt B, Asztalos EV, Roberts RS, Robertson CMT, Sauve RS; Trial of Indomethacin Prophylaxis in Preterms Investigators, Using a count of neonatal morbidities to predict poor outcome in extremely low birth weight infants: Added role of neonatal infection. Pediatrics 123, 313–318 (2009). [DOI] [PMC free article] [PubMed] [Google Scholar]
- 24.Patel RM, Knezevic A, Shenvi N, Hinkes M, Keene S, Roback JD, Easley KA, Josephson CD, Association of red blood cell transfusion, anemia, and necrotizing enterocolitis in very low-birth-weight infants. JAMA 315, 889–897 (2016). [DOI] [PMC free article] [PubMed] [Google Scholar]
- 25.Cibulskis CC, Maheshwari A, Rao R, Mathur AM, Anemia of prematurity: How low is too low? J. Perinatol 41, 1244–1257 (2021). [DOI] [PubMed] [Google Scholar]
- 26.Beam KS, Lee M, Hirst K, Beam A, Parad RB, Specificity of International Classification of Diseases codes for bronchopulmonary dysplasia: An investigation using electronic health record data and a large insurance database. J. Perinatol 41, 764–771 (2021). [DOI] [PMC free article] [PubMed] [Google Scholar]
- 27.Waljee AK, Higgins PDR, Singal AG, A primer on predictive models. Clin. Transl. Gastroenterol 5, e44 (2014). [DOI] [PMC free article] [PubMed] [Google Scholar]
- 28.Hripcsak G, Duke JD, Shah NH, Reich CG, Huser V, Schuemie MJ, Suchard MA, Park RW, Wong ICK, Rijnbeek PR, van der Lei J, Pratt N, Norén GN, Li Y-C, Stang PE, Madigan D, Ryan PB, Observational Health Data Sciences and Informatics (OHDSI): Opportunities for observational researchers. Stud. Health Technol. Inform 216, 574–578 (2015). [PMC free article] [PubMed] [Google Scholar]
- 29.Datta S, Posada J, Olson G, Li W, O’Reiiiy C, Balraj D, Mesterhazy J, Paiias J, Desai P, Shah N, A new paradigm for accelerating clinical data science at Stanford Medicine. arXiv:2003.10534 (2020). [Google Scholar]
- 30.Matcho A, Ryan P, Fife D, Gifkins D, Knoll C, Friedman A, Inferring pregnancy episodes and outcomes within a network of observational databases. PLOS ONE 13, e0192033 (2018). [DOI] [PMC free article] [PubMed] [Google Scholar]
- 31.Apgar V, A proposal for a new method of evaluation of the newborn infant. Originally published in July 1953, volume 32, pages 250–259. Anesth. Analg 120, 1056–1059 (2015). [DOI] [PubMed] [Google Scholar]
- 32.Baldi P, Autoencoders, Unsupervised Learning, and Deep Architectures, paper presented at JMLR: Workshop and Conference Proceedings, Workshop on Unsupervised and Transfer Learning, 2012. [Google Scholar]
- 33.Atzmueller M, Subgroup discovery. WIREs Data Mining Knowl. Discov 5, 35–49 (2015). [Google Scholar]
- 34.Herrera F, Carmona CJ, González P, del Jesus MJ, An overview on subgroup discovery: Foundations and applications. Knowl Inf Syst 29, 495–525 (2011). [Google Scholar]
- 35.Lemmerich F, Becker M, Machine Learning and Knowledge Discovery in Databases, Lecture Notes in Computer Science. Brefeld U, Curry E, Daly E, MacNamee B, Marascu A, Pinelli F, Berlingerio M, Hurley N, Eds. (Springer International Publishing, 2019), 11053, 658–662 (2019). [Google Scholar]
Associated Data
This section collects any data citations, data availability statements, or supplementary materials included in this article.
Supplementary Materials
Data Availability Statement
The aggregated results set, excluding patient-level health information, are available in data file S1. Data partners (Stanford University and University of California, San Francisco) contributing to this study remain custodians of individual patient-level health information. A repository with the original R code used to train the multi-input multitask model has been created (10.5281/zenodo.7537865). All data associated with this study are present in the paper or the Supplementary Materials.