Adherence to healthy dietary patterns is associated with reduced risk of chronic kidney disease (CKD) progression and mortality in adults with CKD.1–3 However, diet is modifiable, and changes in diet quality may predict disease course and survival.4,5 Using data from the Chronic Renal Insufficiency Cohort (CRIC) Study, we assessed associations between 4-year changes in diet quality and risk of CKD progression and all-cause mortality in adults with CKD.
The CRIC Study enrolled adults with reduced estimated glomerular filtration rate (eGFR; 20-70 ml/min/1.73 m2) (Item S1).6 Diet was assessed at baseline and year 4. We included participants with non-missing dietary assessments and covariates (Figure S1). We calculated diet quality using four index scores: Healthy Eating Index (HEI)-2015, Alternative Healthy Eating Index (AHEI)-2010, Dietary Approaches to Stop Hypertension (DASH) diet score, and alternate Mediterranean diet score (aMed) (Table S1). We classified scores as low (less than or equal to the baseline median) or high (greater than the median) and categorized changes as sustained low (low on both assessments), sustained high (high on both assessments), worsened (high at baseline, low at follow-up), or improved (low at baseline, high at follow-up). We also examined absolute diet score changes (year 4 – baseline), categorized as increased, stable, or decreased.
We calculated covariate-adjusted hazard ratios (95% confidence intervals) for associations between changes in diet quality and time to: (1) CKD progression defined as 50% reduction in eGFR from year 4, or initiation of kidney replacement therapy and, (2) all-cause mortality (Item S2). Person-years were calculated from year 4 until the event, study withdrawal, loss to follow-up, or administrative censoring (January 2019). We assessed robustness of findings across subgroups by sex, race, diabetes, year 4 eGFR, and year 4 proteinuria.
Mean diet scores did not change substantially over 4 years (Figure S2), but there was considerable variation in observed changes (Figure S3).
Participants with sustained high diet scores were more educated and reported higher incomes than those with sustained low scores or scores that changed (Table 1; Table S2). Food and nutrient changes associated with categorized score changes are in Table S3.
Table 1.
Participant characteristics by categorized 4-year AHEI-2010 score change for the analysis of time to chronic kidney disease progression (n=1,396)a
| Sustained Low (Low-Low) |
Improved (Low-High) |
Worsened (High-Low) |
Sustained High (High-High) |
P-valueb | |
|---|---|---|---|---|---|
| n | 510 | 197 | 162 | 527 | |
| Age, yr | 61.1 ± 10.9 | 61.9 ± 10.9 | 64.8 ± 9.2 | 63.2 ± 9.5 | <0.001 |
| Female, n (%) | 225 (44) | 99 (50) | 83 (51) | 309 (59) | <0.001 |
| Race/ethnicity, n (%) | <0.001 | ||||
| Non-Hispanic white, n (%) | 273 (54) | 116 (59) | 82 (51) | 363 (69) | |
| Non-Hispanic black, n (%) | 211 (41) | 71 (36) | 64 (40) | 119 (23) | |
| Hispanic, n (%) | 15 (3) | 6 (3) | 7 (4) | 14 (3) | |
| Other, n (%) | 11 (2) | 4 (2) | 9 (6) | 31 (6) | |
| College graduate, n (%) | 155 (30) | 87 (44) | 59 (36) | 312 (59) | <0.001 |
| Income, n (%) | <0.001 | ||||
| >$50,000 | 173 (34) | 75 (38) | 62 (38) | 268 (51) | |
| Do not wish to answer | 78 (15) | 30 (15) | 25 (15) | 68 (14) | |
| eGFR, mL/min/1.73 m2 | 43 ± 19 | 47 ± 20 | 42 ± 17 | 50 ± 20 | <0.001 |
| Physical activity, MET-hrs/wk | 188 ± 117 | 210 ± 123 | 187 ± 126 | 197 ± 109 | 0.1 |
| Change in physical activity, MET-hrs/wk | −21 ± 141 | 10 ± 115 | −10 ± 128 | −12 ± 111 | 0.03 |
| BMI, kg/m2 | 31.8 ± 7.3 | 33.7 ± 9.6 | 32.1 ± 7.5 | 30.4 ± 6.8 | <0.001 |
| Change in BMI, kg/m2 | 0 ± 2.9 | 0.2 ± 3.8 | 0.4 ± 3.0 | 0.2 ± 2.5 | 0.4 |
| 4Energy intake, kcal/d | 1669 ± 749 | 1777 ± 779 | 1618 ± 618 | 1637 ± 619 | 0.08 |
| Change in energy intake, kcal/d | −214 ± 773 | 3 ± 629 | −258 ± 708 | −141 ± 607 | <0.001 |
| Drinking status, n (%) | <0.001 | ||||
| Consistent non-drinker | 396 (78) | 142 (72) | 117 (72) | 314 (60) | |
| Consistent drinker | 63 (12) | 35 (18) | 28 (17) | 146 (28) | |
| Changed from drinker to nondrinker | 27 (5) | 10 (5) | 14 (9) | 26 (5) | |
| Changed from nondrinker to drinker | 24 (5) | 10 (5) | 3 (2) | 41 (8) | |
| Smoking status, n (%) | <0.001 | ||||
| Consistent never smoker | 235 (46) | 100 (51) | 66 (41) | 278 (53) | |
| Changed from current to former smoker or remained former smoker | 210 (41) | 82 (42) | 79 (49) | 226 (43) | |
| Changed from never or former smoker to current smoker | 11 (2) | 4 (2) | 0 (0) | 3 (1) | |
| Consistent smoker | 54 (11) | 11 (6) | 17 (10) | 20 (4) | |
| Proteinuria, n (%)c | 46 (15) | 9 (8) | 21 (23) | 26 (9) | 0.009 |
| Hypertension, n (%) | 480 (94) | 178 (90) | 148 (91) | 439 (83) | <0.001 |
| Diabetes, n (%) | 218 (43) | 94 (48) | 70 (43) | 224 (43) | 0.6 |
| Cardiovascular disease, n (%) | 203 (40) | 65 (33) | 79 (49) | 164 (31) | <0.001 |
| Lipid-lowering medication use, n (%) | 345 (68) | 135 (69) | 111 (69) | 367 (70) | 0.9 |
| ACE inhibitor/ARB use, n (%) | 361 (71) | 142 (72) | 113 (70) | 348 (66) | 0.3 |
| Antiplatelet medication use, n (%) | 273 (54) | 106 (54) | 91 (56) | 292 (55) | 0.9 |
Values are means ± SD at year 4 timepoint unless otherwise specified. Change refers to 4-year change, from initial visit to year 4. ACE, angiotensin-converting enzyme; AHEI, Alternative Healthy Eating Index; ARB, angiotensin II receptor blocker; BMI, body mass index; eGFR, estimated glomerular filtration rate; MET, metabolic equivalent of task
P-value is for Pearson’s chi-squared test (categorical variables) or analysis of variance (continuous variables) comparing categories of diet score change
Proteinuria defined as 24-hour urinary protein >1.5 g/d; n=810
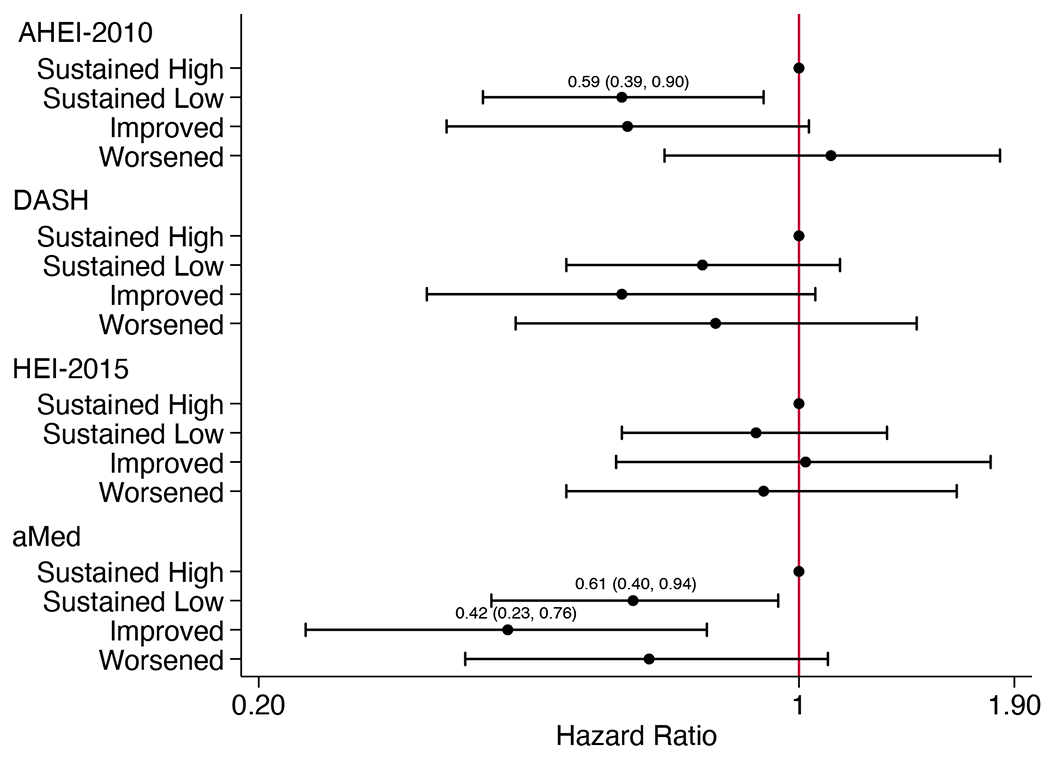
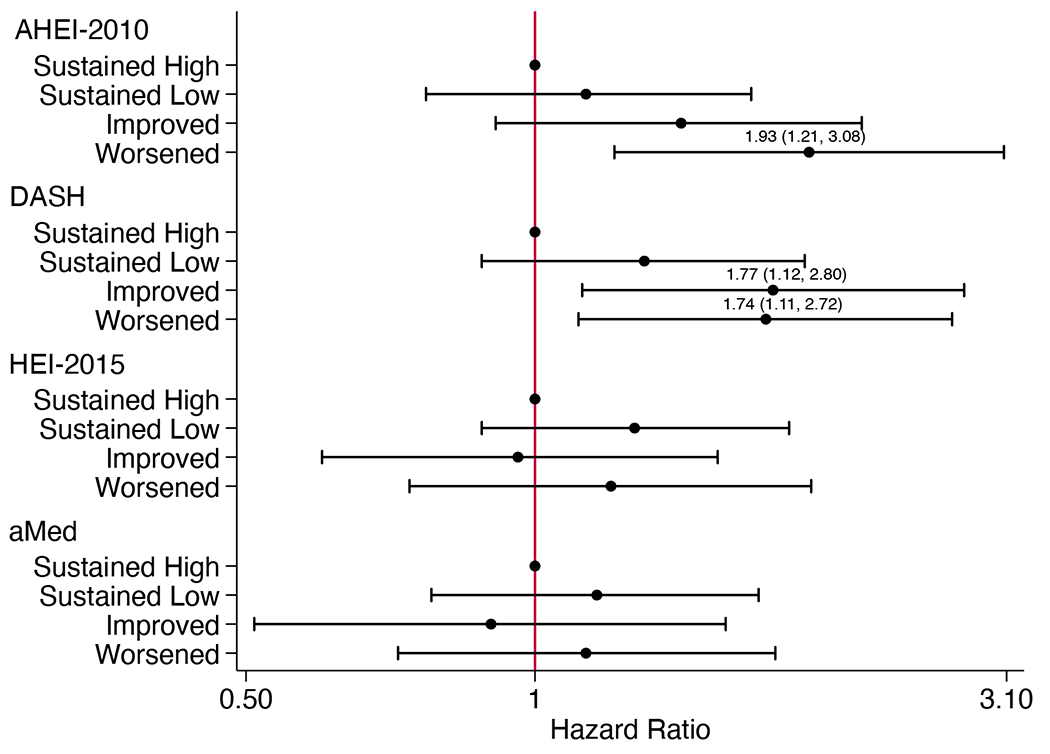
There were 412 CKD progression events (308 were kidney replacement therapy initiation) observed over a median of 7.0 (IQR 3.3-9.5) years. The association between categorized diet change and CKD progression differed by diabetes status. Among adults without diabetes, those with sustained low AHEI-2010 and aMed scores had 41% and 39% lower risk of CKD progression, respectively, while those with improved aMed scores had 58% lower risk relative to those with sustained high scores (Figure 1A; Table S4). Among adults with diabetes, those with AHEI-2010 scores that worsened had 93% higher risk of CKD progression, while both improvements and declines in DASH scores were associated with higher risk relative to those with sustained high scores (Figure 1B). Changes in HEI-2015 scores were not associated with CKD progression. Results were similar across subgroups defined by sex, race, eGFR, or proteinuria.
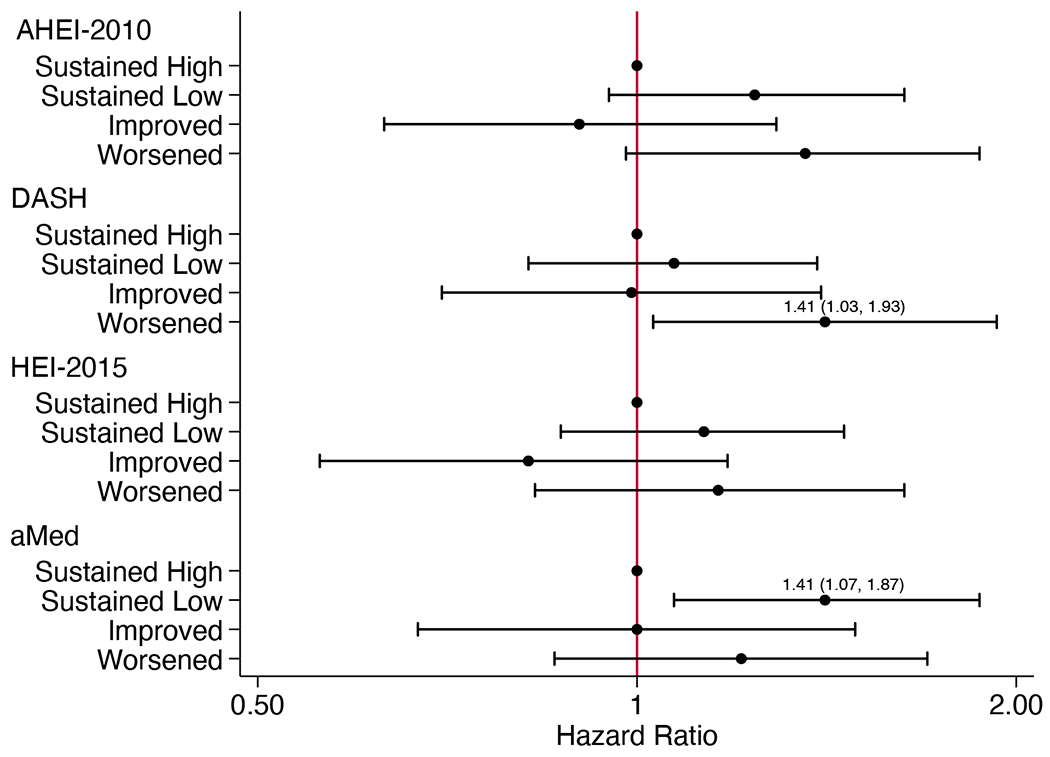
Figure 1.


Adjusted hazard ratios (95% CI) for (A) chronic kidney disease progression in participants without diabetes (n=790), (B) chronic kidney disease progression in participants with diabetes (n=606), and (C) all-cause mortality (n=1461), according to categorized 4-year changes in diet quality scoresa
aHazard ratios (95% CI) estimated using Cox proportional hazards models adjusted for CRIC study site, age, sex, race, education, income, eGFR, total energy intake, physical activity, BMI, change in smoking status, change in physical activity, change in BMI, change in energy intake, cardiovascular disease, hypertensive status, use of lipid-lowering medications, use of ARB or ACE inhibitor medications, and use of antiplatelet medications. For DASH and HEI-2015 scores, alcohol use and change in alcohol intake were also included. Models for all-cause mortality additionally adjust for diabetes status. ACE, angiotensin-converting enzyme; AHEI, Alternative Healthy Eating Index; aMed, alternate Mediterranean diet score; ARB, angiotensin II receptor blocker; BMI, body mass index; CI, confidence interval; DASH, Dietary Approaches to Stop Hypertension; eGFR, estimated glomerular filtration rate; HEI, Healthy Eating Index
When analyzed as categorized 4-year absolute score changes, among adults without diabetes, increased DASH scores were associated with 39% lower risk of CKD progression compared to stable scores (Table S5). Among adults with diabetes, those with decreased AHEI-2010 scores had 63% higher risk of CKD progression compared to those with stable scores.
There were 393 deaths over a median of 9.4 (IQR 7.9-10.4) years. Associations between diet change and mortality were consistent across all subgroups. Compared to those with sustained high scores, those with worsened DASH scores had 41% higher risk of death, and those with sustained low aMed scores had 41% higher risk of death (Figure 1C; Table S6).
Analyzed as categorized 4-year absolute score changes, adults with decreased AHEI-2010 scores had 34% higher risk of death compared to those with stable scores (Table S7).
As diet was not assessed after year 4, we could not measure subsequent changes that may have influenced these associations. We cannot discern the extent to which changes in scores were influenced by random measurement error associated with self-reported diet. Inclusion in our study sample required survival to year 4 and complete diet and covariate assessments, which may have introduced selection bias (Table S8). The main analysis does not account for albuminuria, which is a key predictor of CKD progression. Reverse causality may explain findings, as participants might have changed their diets in response to their health condition. Additional research is warranted to understand motivators of diet change in this population.
Four-year changes in diet quality were not consistently associated with CKD progression in adults with CKD. Associations varied by diet quality index and diabetes status. Different associations by diabetes status may be due to differing motivations for change, as people with diabetes may be followed more closely by physicians and receive instruction to change their diet. Declines in DASH scores were associated with higher mortality risk. Worsening diet quality may predict earlier death in adults with CKD.
Supplementary Material
Acknowledgements:
The authors thank the Chronic Renal Insufficiency Cohort (CRIC) Study staff and participants for their contributions to this study, as well as Xiaoming Zhang and Jesse Hsu for preparing the datasets for statistical analyses.
Support:
Funding for the CRIC Study was obtained under a cooperative agreement from National Institute of Diabetes and Digestive and Kidney Diseases (U01DK060990, U01DK060984, U01DK061022, U01DK061021, U01DK061028, U01DK060980, U01DK060963, U01DK060902 and U24DK060990). In addition, this work was supported in part by: the Perelman School of Medicine at the University of Pennsylvania Clinical and Translational Science Award NIH/NCATS UL1TR000003, Johns Hopkins University UL1 TR-000424, University of Maryland GCRC M01 RR-16500, Clinical and Translational Science Collaborative of Cleveland, UL1TR000439 from the National Center for Advancing Translational Sciences (NCATS) component of the National Institutes of Health and NIH roadmap for Medical Research, Michigan Institute for Clinical and Health Research (MICHR) UL1TR000433, University of Illinois at Chicago CTSA UL1RR029879, Tulane COBRE for Clinical and Translational Research in Cardiometabolic Diseases P20 GM109036, Kaiser Permanente NIH/NCRR UCSF-CTSI UL1 RR-024131, Department of Internal Medicine, University of New Mexico School of Medicine Albuquerque, NM R01DK119199. VKS is supported by grant T32HL007024 from the National Heart, Lung, and Blood Institute. ACR is supported by grant R01DK118736 from the NIDDK. SJS is supported by NIH grant K23DK118198. CYH is supported by NIH grant K24DK092291. VOS is supported by NIH grant R01MD015003 and project number 2P20GM103451. CMR is supported by grant R03DK128386 from the NIDDK and grant R01HL153178 from the NHLBI. This work is also supported by the Intramural Research Program of the National Institute of Diabetes and Digestive and Kidney Diseases. The funders had no role in the study design; collection, analysis, and interpretation of these data; writing the report; and the decision to submit the report for publication.
Abbreviations:
- AHEI
Alternative Healthy Eating Index
- aMed
alternate Mediterranean diet score
- BMI
body mass index
- CKD
chronic kidney disease
- CRIC
Chronic Renal Insufficiency Cohort
- DASH
Dietary Approaches to Stop Hypertension
- DHQ
Diet History Questionnaire
- eGFR
estimated glomerular filtration rate
- HEI
Healthy Eating Index
- MET
metabolic equivalent of task
Footnotes
Financial Disclosures: The authors declare no relevant financial interests.
References
- 1.Gutiérrez OM, Muntner P, Rizk D v., et al. Dietary patterns and risk of death and progression to ESRD in individuals with CKD: a cohort study. Am J Kidney Dis. 2014;64(2):204. doi: 10.1053/J.AJKD.2014.02.013 [DOI] [PMC free article] [PubMed] [Google Scholar]
- 2.Kelly JT, Palmer SC, Wai SN, et al. Healthy dietary patterns and risk of mortality and ESRD in CKD: a meta-analysis of cohort studies. Clin J Am Soc Nephrol. 2017;12(2):272–279. doi: 10.2215/CJN.06190616 [DOI] [PMC free article] [PubMed] [Google Scholar]
- 3.Hu EA, Coresh J, Anderson CAM, et al. Adherence to healthy dietary patterns and risk of CKD progression and all-cause mortality: findings from the CRIC (Chronic Renal Insufficiency Cohort) Study. Am J Kidney Dis. 2021;77(2):235–244. doi: 10.1053/J.AJKD.2020.04.019 [DOI] [PMC free article] [PubMed] [Google Scholar]
- 4.Sotos-Prieto M, Bhupathiraju SN, Mattei J, et al. Changes in diet quality scores and risk of cardiovascular disease among US men and women. Circulation. 2015;132(23):2212–2219. doi: 10.1161/CIRCULATIONAHA.115.017158 [DOI] [PMC free article] [PubMed] [Google Scholar]
- 5.Sotos-Prieto M, Bhupathiraju SN, Mattei J, et al. Association of changes in diet quality with total and cause-specific mortality. New England Journal of Medicine. 2017;377(2):143–153. doi: 10.1056/NEJMoa1613502 [DOI] [PMC free article] [PubMed] [Google Scholar]
- 6.Feldman HI, Appel LJ, Chertow GM, et al. The Chronic Renal Insufficiency Cohort (CRIC) Study: design and methods. Journal of the American Society of Nephrology. 2003;14(7 Suppl 2):S148–53. doi: 10.1097/01.asn.0000070149.78399.ce [DOI] [PubMed] [Google Scholar]
Associated Data
This section collects any data citations, data availability statements, or supplementary materials included in this article.


