

Abstract
Phenotyping for Type 2 Diabetes (T2DM) is needed due to the increasing demand for T2DM research on electronic health records (EHRs). eMERGE is a reliable and interpretable rule-based algorithm for the identification of T2DM cases and controls in EHRs. MIMIC-IV, an extension of MIMIC-III, contains more than 520,000 hospital admissions and has become a valuable EHR database for secondary medical research. However, there was no prior work to extract T2DM cases and controls from MIMIC-IV, which requires a comprehensive knowledge of the database. Our work provided insight into the structure and data elements in MIMIC-IV and adapted eMERGE to accomplish the task. The results included MIMIC-IV’s data tables and elements used, 12,735 cases and 9,828 controls of T2DM, and summary statistics of the cohorts in comparison with those on other EHR databases. They could be used for the development of statistical and machine learning models in future studies about the disease.
Introduction
Diabetes has become one of the major diseases that can cause severe complications and deaths.1 There are three main types of diabetes mellitus (DM), namely, type 1 (T1DM), type 2 (T2DM), and gestational diabetes. A report in 2015 predicted that the number of people with diabetes would increase from 415 million in 2015 to 642 million in 2040.2 T2DM is one of the most significant healthcare concerns of the 21st century.3 Approximately 90% of diabetes patients are T2DM cases, which may cause many forms of complications leading to their morbidity and mortality.4 There is also a worrying trend that the prevalence of T2DM in children, adolescents, and young adults has also increased.5 Since the need for T2DM clinical research keeps growing, diagnosing and identifying T2DM have also been a heavy task for researchers. However, there were different phenotype definitions of diabetes mellitus.6 The criteria for screening and diagnosis of diabetes kept changing, from the WHO’s one without a threshold of blood sugar levels in 1965 to the American Diabetes Association’s standard based on fasting blood glucose, HbA1c, and oral glucose tolerance test in 2017.7 Even the Hb1Ac cut-off of 6.5% could not be a single marker as T2DM could be present at HbA1c levels below 6.5%.8 In contrast to many other phenotypes for which structured data recorded in electronic health records (EHRs) are sufficient, T2DM requires validation by expert review of clinical notes to understand the final determination of a diagnosing physician.9 In fact, many T2DM cases went undiagnosed, particularly at an estimated rate of 25% in the United States (US) due to the prohibitive administering of laboratory tests to everyone.10 Therefore, it has attracted much research effort in diabetes diagnosis and prediction.1, 11 In this paper, we focus on T2DM but not the other types of diabetes.
Starting in 1992, when hardware became more powerful and the internet became faster, EHRs have developed for over 30 years.12 In the US, nearly 96% of hospitals had EHRs in 2015.13 Although EHRs have been growing rapidly in recent years, establishing and using such rich datasets is still challenging since the initial goal of EHRs was for billing.14 With the goal of integrating deidentified and complex clinical data for secondary medical research, MIMIC-III (Medical Information Mart for Intensive Care) system was established, which is a large and freely available EHR database containing deidentified health-related data from patients who were admitted to the intensive care units (ICU) of the Beth Israel Deaconess Medical Center.15 MIMIC-III contains data with 53,423 unique hospital admissions for patients admitted between 2001 and 2012. Recently a significant number of research investigations have been devoted to T2DM research on MIMIC-III, such as predicting mortality of T2DM using machine learning16-18 and detecting the association between risk factors and DM.19, 20 All such kinds of research required automated identification of T2DM patients from an EHR database. However, the phenotyping algorithms in those studies on MIMIC-III have a limitation that used only a simple combination of diagnosis codes, medications, and lab values. We recall that diagnosis codes have limited accuracy and completeness,21, 22 for which one should not rely only on them for phenotyping.
There are also some EHR-based T2DM phenotyping algorithms applied to other EHR databases. Recent phenotyping algorithms in EHRs can be categorized into rule-based, machine learning, statistical modelling, and hybrid ones. In a rule-based system, a set of rules needs to be developed on the extracted features as a condition that can lead to the final decision. These rules are set by a group of experts in the given field or derived from an organization. Existing popular rule-based algorithms include eMERGE (Electronic Medical Records and Genomics)23, SUPREME-DM24, DDC25, CCW26 and PCORnet27. Distinguished from the others, eMERGE has a systematic and restrictive flowchart that excludes T1DM and other diabetes-related diseases and provides rules to identify both cases and controls for T2DM.6 SUPREME-DM is a rule-based algorithm developed by a consortium of 11 integrated health systems to identify patients with T1DM and T2DM for research purposes. The DDC algorithm identifies T2DM cases in Durham County, North Carolina. The CCW algorithm uses questionnaires, physical examinations, medical facility records, and death certificates, which can be found in Medicare claim records. PCORnet adapts existing computable phenotypes for identification of patients with T2DM.
Machine learning methods usually use natural language processing (NLP) to exploit unstructured clinical notes for phenotyping.28-31 One phenotyping algorithm based on PheMap, a knowledge base of medical concepts with quantified relationships to phenotypes extracted by natural language processing from publicly available resources.28 There was also a phenotyping algorithm using a Bayesian latent model.32 Besides, hybrid systems have been used in some studies, such as Mayo Clinic’s proposed methodthat combined a rule-based algorithm and a keyword-based search technique.33 A review of these rule-based and machine learning algorithms is provided in Table 1, including the data elements they used and their performance measures. The first four rule-based algorithms in the table were evaluated on the same EHR dataset in a study in 2017.20 Some performance measures of the remaining methods were reported in their original papers evaluated on different EHR datasets, for which the values are just for a reference, but not a direct comparison. Moreover, besides the performance of a method, its interpretability is also important so that clinicians can understand and trust its results, for which rule-based methods are preferred to black-box ones.
Table 1.
Data elements and performance measures of the cited T2DM case identification algorithms
| Algorithm | Algorithm Type | Separated Case and Control Flowcharts? | T1DM Exclusion | Data Elements Used | Sensitivity | Specificity | PPV | |||
|---|---|---|---|---|---|---|---|---|---|---|
| ICD Diagnosis Codes | Lab Values | Medications | Clinical Notes | |||||||
| eMERGE23 | Rule-based | ✓ | ✓ | ✓ | ✓ | ✓ | × | 0.658 | 0.990 | 0.860 |
| SUPREME-DM24 | Rule-based | × | × | ✓ | ✓ | ✓ | × | 0.877 | 0.965 | 0.710 |
| DDC25 | Rule-based | × | ✓ | ✓ | ✓ | ✓ | × | 0.942 | 0.952 | 0.660 |
| CCW*26 | Rule-based | × | × | ✓ | × | × | × | 0.837 | 0.978 | 0.780 |
| PCORnet27 | Rule-based | × | ✓ | ✓ | ✓ | ✓ | × | - | - | 0.962 |
| PheMap28 | Machine Learning | × | ✓ | ✓ | ✓ | ✓ | × | 0.976 | 0.917 | 0.969 |
| MAP40 | Machine Learning | × | × | ✓ | × | × | ✓ | - | - | 0.891 |
| SVM41 | Machine Learning | × | × | × | × | × | ✓ | 0.951 | - | 0.919 |
| Decision Tree38 | Machine Learning | × | × | ✓ | ✓ | × | × | 0.812 | - | 0.903 |
| ARM38 | Machine Learning | × | × | ✓ | ✓ | × | × | 0.894 | - | 0.900 |
| Bayesian Model32 | Bayesian | × | ✓ | ✓ | ✓ | ✓ | × | 0.959 | 0.997 | - |
| Mayo Clinic33 | Rule-based + ML | × | × | ✓ | ✓ | ✓ | ✓ | 0.990 | 0.990 | 0.990 |
The first four rule-based algorithms were evaluated on the same EHR dataset.42
* CCW also based on responses from the participants in the study to identify cases.
The four common measures to evaluate the performance of a diagnosis or prediction method are sensitivity, specificity, positive predictive value (PPV), and negative predictive value (NPV).34 By definition, there is often a tradeoff between these measures.6 In particular, increasing the sensitivity (or specificity) may decrease the PPV (or NPV), and vice versa. We note that, for case identification, a true positive instance is a true case, i.e., a patient who truly has the phenotype of discourse. Meanwhile, a true negative instance is the opposite, which cannot be confirmed as a case but is not necessarily a control. Dually, for control identification, a true positive instance is a true control, i.e., a patient who truly does not have the phenotype, while a true negative instance is not necessarily a case. Therefore, unlike other works, eMERGE provided both of T2DM case identification and control identification algorithms, for which the case identification outputs either a case or “unknown” and the control identification outputs either a control or “unknown”. In this work, we aim at obtaining accurate T2DM case and control cohorts for future construction of statistical and supervised machine learning models, for which high PPVs for both case and control identifications are desirable.
An early research showed that eMERGE achieved PPVs of 98% and 100% for identification of T2DM cases and controls, respectively, across five different EHR systems.35 Then, it was shown to achieve PPVs of 95% and 92.6% respectively for T2DM cases and controls when there was data fragmentation across healthcare centers.36 Later, a study in 2017 compared some rule-based algorithms and showed that eMERGE’s PPV was 86%, higher than those of SUPREME-DM (71%), DDC (66%), and CCW (78%) evaluated on the same EHR dataset. Recently in 2020, eMERGE was updated to incorporate ICD-10 codes and its PPVs for T2DM cases and controls were still 82% and 100%, respectively.37 eMERGE has also been used to construct gold-standard T2DM cohorts for supervised machine learning, or a reference standard to evaluate T2DM phenotyping algorithms.28, 38 Therefore, eMERGE has been considered as a reliable algorithm for positive and negative T2DM classification in many case-control cohort studies.
Meanwhile, in 2020, MIMIC-IV was published by PhysioNet.39 It was an update and improvement to MIMIC-III in the following aspects: (1) it covers more patients, with 523,740 unique hospital admissions from 2008 to 2019; (2) it optimizes the database structure; and (3) it includes new sources of data such as electronic medication administration records. Following MIMIC-III, MIMIC-IV has become a valuable EHR database for secondary medical research, in particular on T2DM. However, to the best of our knowledge, our work here was the first attempt to extract T2DM case and control cohorts from MIMIC-IV.
In this work, we chose eMERGE to do this task for the following reasons: (1) it has been used and evaluated in many T2DM studies; (2) it identifies both T2DM cases and controls by two distinct flowcharts, but excludes T1DM and other diabetes-related diseases; (3) it has high PPVs for both case and control identifications on different cohorts; (4) eMERGE flowcharts are simple and easily understood by medical practitioners; and (5) clinical notes have not been provided in MIMIC-IV yet, and thus machine learning models relying on them are not even applicable. Our obtained results provide a necessary basis for answering T2DM research questions from the MIMIC-IV population.
Methods
Data sources
All the data are extracted from MIMIC IV v1.0 published on March 16, 2021.39 In the MIMIC-IV database, there are three modules namely, core, hosp and icu. The core module includes patients’ information and the record of admission and transformation. The hosp module stores data obtained from hospital stays including lab events, microbiology cultures, medication prescriptions, etc. The icu module contains data from the clinical information system.
Data extraction and pre-processing
The eMERGE case and control identification algorithms require certain patient-level data elements to be extracted from an EHR database that includes diagnoses, lab results, and medications. The flowchart provided by eMERGE’s original paper23 expressing the logic of the T2DM case identification algorithm is shown in Figure 1, applied to MIMIC-IV with the number of remaining patients satisfying each checked condition. A summary of all the data elements that we used to perform eMERGE’s case identification algorithm and the corresponding tables where to find those elements in MIMIC-IV are provided in Table 2. In EHR databases such as MIMIC-IV, disease diagnoses are recorded by ICD-9 and/or ICD-10 codes. Since the ICD-10 codes for T2DM were not found in MIMIC-IV, we only used ICD-9 codes for the case identification. To identify T2DM cases and exclude T1DM ones, the ICD-9 codes for T1DM and T2DM diagnoses provided by eMERGE’s original paper in 2012 are shown in Table 3. For T2DM medications, since the eMERGE’s original drug list was in 2012, we applied the additional updated medications from a recent study in 202243 provided by the author clinicians, based on the feedback and pharmacology resource of the American Diabetes Association in 2020 (Table 4).
Figure 1.

(A) eMERGE’s flowchart for identifying T2DM cases in MIMIC-IV; (B) eMERGE’s flowchart for identifying T2DM controls in MIMIC-IV. The numbers in the flowcharts indicate the remaining numbers of patients after each step by our study.
Table 2.
The MIMIC-IV tables for extraction of the data elements used in eMERGE
| Data Elements in eMERGE | Tables in MIMIC-IV |
| Counts of T1DM ICD-9 code assignment dates | diagnoses_icd (Table 3) |
| Counts of T2DM ICD-9 code assignment dates | diagnoses_icd (Table 3) |
| The earliest date of T1DM medications prescriptions | prescriptions (Table 4) |
| The earliest date of T2DM medications prescriptions | prescriptions (Table 4) |
| The maximum fasting blood glucose lab values | labevents (Table 5) chartevents (Table 5) |
| The maximum HbA1c lab values | labevents (Table 5) |
| Diabetes family history | diagnoses_icd (Table 6) |
Table 3.
DM-related diagnosis codes in MIMIC-IV
| Diabetes Type | ICD-9 |
| T1DM | 250.x1, 250.x3 |
| T2DM | 250.x0, 250.x2 (excluding 250.10, 250.12) |
Table 4.
DM-related medications in MIMIC-IV
| Diabetes Type | Medication Name |
| T1DM | insulin |
| pramlintide | |
| T2DM | acetohexamide, tolazamide, chlorpropamide, glipizide, glyburide, glimepiride, repaglinide, nateglinide, metformin, rosiglitazone, pioglitazone, troglitazone, acarbose, miglitol, sitagliptin, exenatide |
| T2DM additional updated medications | alogliptin, saxagliptin, linagliptin, ertugliflozin, dapagliflozin, empagliflozin, canagliflozin, dulaglutide, semaglutide, liraglutide, lixisenatide, colesevelam, bromocriptine |
For lab values, the definition of an abnormal lab value indicative of DM is as follows: value of random glucose > 200 mg/dl; value of fasting glucose ≥ 125 mg/dl; or value of HbA1c ≥ 6.5%.44 The eMERGE’s original paper used LOINC code 4546-4 to extract HbA1c values and other LOINC codes to find other glucose measurements. However, only the HbA1c LOINC code exists in MIMIC-IV, but none of the other LOINC codes. Therefore, we constructed a list updating the glucose measurements in MIMIC-IV with their item identifiers and labels, by using eMERGE’s HbA1c LOINC code and the glucose measurement identifiers and labels in a study in 202145 to search in MIMIC-IV (Table 5). Except for HbA1c, we assumed all of the other values are fasting glucose, since the reference normal range for those values are 70 mg/dl to 100 mg/dl as recorded in the labevents table in MIMIC-IV, close to the normal fasting glucose range advised by CDC (Centers for Disease Control and Prevention) being [70, 99] mg/dl.46 All glucose values ≥ 1000 mg/dl are viewed as outliers and are removed.44 Specifically, the glucose values were extracted from two tables in MIMIC-IV, namely, labevents and chartevents. The labevents table stores the results of all laboratory measurements made for a single patient. The chartevents table contains all the charted data available for a patient during their ICU stays. Furthermore, even though laboratory values are captured in labevents, they are frequently repeated within chartevents. Fingerstick glucometer measurements are only recorded in chartevents. As by eMERGE, we used the largest fasting glucose value available to each patient for the case and control identifications. There is a condition in eMERGE’s original paper that it requires at least 2 diagnoses by physicians. In MIMIC-IV, since all the diagnoses were recorded by trained persons, we adapted the condition to be simply at least 2 diagnoses.
Table 5.
DM-related lab values in MIMIC-IV
| Table | Item ID | Label | LOINC Code |
| labevents | 50809 | Glucose - Blood - Blood Gas | |
| 50931 | Glucose - Blood - Chemistry | 6777-7 | |
| 52569 | Glucose - Blood - Chemistry | ||
| 52027 | Glucose (Whole Blood) - Blood - Blood Gas | ||
| 50852 | % Hemoglobin A1c | 4548-4 | |
| chartevents | 220621 | Glucose (Serum) | |
| 225664 | Glucose Finger Stick | ||
| 226537 | Glucose (Whole Blood) |
For application of eMERGE’s control identification algorithm, the data elements used in eMERGE as shown in Table 1 were also extracted from MIMIC-IV. Specifically, one ICD-9 code and one ICD-10 code were used to determine family histories of diabetes (Table 5). The flowchart of eMERGE’s control identification is shown in Figure 1. We note that, for identifying a T2DM control, the thresholds for the abnormal fasting glucose and HbA1c are lower than for a T2DM case identification: value of fasting glucose ≥ 110 mg/dl; or HbA1c ≥ 6%. The DM-related diagnoses and medications are the same as in the case identification algorithm (Table 3 and Table 4)
Results
By conducting eMERGE on MIMIC-IV with 382,278 patients, we extracted 12,735 T2DM cases (i.e., 3.33%) and 9,828 T2DM controls (i.e., 2.57%). The number of patients filtered by each route of the flowcharts is shown in Figure 1. Table 7 summarizes the number of patients, admissions, diagnoses, medications, and lab results in each cohort.
Table 7.
The numbers of patients, admissions, diagnoses, medications, and lab results in MIMIC-IV and T2DM case and control cohorts
| Table | MIMIC-IV | T2DM Cases | T2DM Controls |
| Patients | 382,278 | 12,735 | 9,828 |
| Hospital admissions | 523,740 | 53,038 | 24,129 |
| Diagnoses | 5,280,351 | 708,476 | 144,797 |
| Medications | 17,008,053 | 2,223,164 | 300,042 |
| Lab results | 122,103,667 | 13,853,256 | 2,401,647 |
In the obtained T2DM cases and controls, we derived their demographic statistics separately, including the gender, ethnicity, and age (Table 8, Table 9). In the case cohort, the number of females is smaller than that of males (46.4% vs. 54.7%), while in the control cohort the number of females is larger than that of males (67.5% vs. 32.5%), indicating that the ratio of getting T2DM for males is higher than that of females (Figure 2). In 2013, there were 14 million more men than woman with diabetes,47 which is consistent with our results. For ethnicity, there is inconsistency with some patients in MIMIC-IV, for whom the most frequent ethnicity among all the records was viewed as the final one. Our results show that over 62% of T2DM patients are White (Table 8, Figure 3). The mean age of T2DM patients is 65.6, which is significantly older than 40.0 of the controls (Table 8, Figure 4). For the HbA1c distribution of the T2DM cases, the highest value of HbA1c is 23.0% and the lowest value is 2.7%. For the glucose distributions, the median of glucose measurements for the T2DM cases is greater than 200 mg/dl, while that of the controls is 93 mg/dl (Figure 5).
Table 8.
The gender, ethnicity, and age distributions of T2DM cases in MIMIC-IV
| Demographics | Number of T2DM Cases | Percent of T2DM Cases (%) |
| Gender | ||
| Female | 5,906 | 46.4 |
| Male | 6,829 | 54.7 |
| Ethnicity | ||
| White | 8,042 | 63.1 |
| Black/African American | 2,354 | 18.5 |
| Asian | 476 | 3.7 |
| Hispanic/Latino | 854 | 6.7 |
| American Indian/Alaska Native | 23 | 0.2 |
| Other | 572 | 4.5 |
| Unknown | 414 | 3.3 |
| Age in years | ||
| Mean (SD) | 65.6 (14.2) | |
| Median (Range) | 66 (18, 91) | |
| Patients under 18 (%) | 0 | |
Table 9.
The gender, race, and age distributions of T2DM controls in MIMIC-IV
| Demographics | Number of T2DM Controls | Percent of T2DM Controls (%) |
| Gender | ||
| Female | 6,636 | 67.5 |
| Male | 3,192 | 32.5 |
| Race | ||
| White | 6.309 | 64.2 |
| Black/African American | 1754 | 17.8 |
| Asian | 429 | 4.4 |
| Hispanic/Latino | 589 | 6.0 |
| American Indian/Alaska Native | 36 | 0.4 |
| Other | 522 | 5.3 |
| Unknown | 189 | 2.0 |
| Age in years | ||
| Mean (SD) | 40.0 (18.1) | |
| Median (Range) | 35.0 (0, 91) | |
| Patients under 18 (%) | 50 (0.5%) | |
Figure 2.
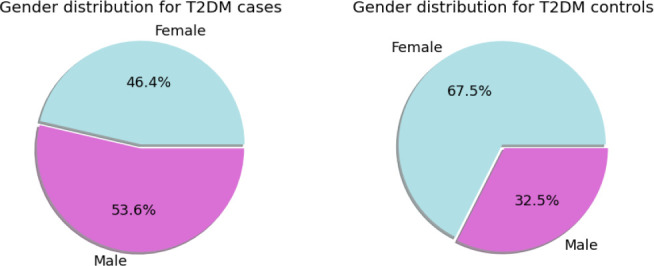
The gender distributions of T2DM cases and controls.
Figure 3.

The ethnicity distributions of T2DM cases and controls.
Figure 4.

The age distributions of T2DM cases and controls.
Figure 5.

The HbA1c and glucose distributions of T2DM cases and controls. The orange line in each plot rectangle is the median. The left edge of the rectangle denotes the .75 percentile, and the right edge of the rectangle denotes the .25 percentile. The plots for glucose were generated after removing the glucose value outliers.
We also compared the obtained results on MIMIC-IV with those on MIMIC-III and the nationwide Cerner EHR database.48 The summary statistics for Cerner is from a technical report in 2020 from UTHealth, which used eMERGE for T2DM case identification.49 The summary statistics for MIMIC-III is from a study in 202118, which used a T2DM case identification algorithm simpler than eMERGE. Actually, to our knowledge after doing literature review, there has been no application of eMERGE on MIMIC-III so far. That algorithm excluded gestational DM and drug-induced DM, and required T2DM patients to have HbA1c ≥ 6.5% or T2DM prescriptions besides diagnoses. The total numbers of patients in MIMIC-IV, MIMIC-III and Cerner are 382,278, 46,520, and over 65,000,000, respectively. The percentages of T2DM cases are respectively 3.33%, 5.23%, and 1.75% (Table 10). Compared to the summary statistics of Cerner (Table 11), the ratio of females by males with T2DM from MIMIC-IV (0.86) is smaller than that from Cerner (1.05). For Cerner, Caucasian takes over among all races (70.0%). Similarly for MIMIC-IV, the majority of T2DM cases are White (62.6%). The median ages of T2DM cases from MIMIC-IV and Cerner are close, which are 65.6 years old for MIMIC-IV and 61.4 years old for Cerner.
Table 10.
Comparison on different EHR databases MIMIC-IV, MIMIC-III, and Cerner
| Count | MIMIC-IV | MIMIC-III | Cerner |
| Number of total patients | 382,278 | 46,520 | > 65,000,000 |
| Number of T2DM cases | 12,735 | 2,435 | 1,136,301 |
| Number of admissions in T2DM cohort | 53,038 | - | 34,893,649 |
Table 11.
Gender, race, and age distributions of T2DM cases in Cerner
| Demographics | Number of T2DM Cases | Percent of T2DM Cases (%) |
| Gender | ||
| Female | 581,276 | 51.2 |
| Male | 554,903 | 48.8 |
| Unknown | 122 | 0.0 |
| Race | ||
| Caucasian | 795,957 | 70.0 |
| African American | 201,051 | 17.7 |
| Other | 58,145 | 5.0 |
| Asian | 25,039 | 2.2 |
| Unknown | 22,346 | 2.0 |
| Hispanic | 16,090 | 1.4 |
| Native American | 14,138 | 1.2 |
| Pacific Islander | 2,413 | 0.2 |
| Biracial | 1,122 | 0.1 |
| Age in years | ||
| Mean (SD) | 61.4 (14.8) | |
| Median (Range) | 62 (0, 90) | |
| Patients under 18 (%) | 5,463 (0.5%) | |
Discussion
Cohort identification is important to assemble a group of patients who have a certain disease (i.e., cases) and a group of those who do not (i.e., controls) for medical research, in particular for determining risk factors and making prediction of getting the disease. A large scale of EHRs requires automatic cohort identification, when the traditional method with manual chart review becomes impractical.50 By conducting eMERGE on MIMIC-IV, we could extract the T2DM cases and controls cohorts separately. We chose eMERGE because it has high PPVs for both case and control identifications and its flowcharts are simple and interpretable, which has been proved reliable in many studies. Identification of both cases and controls and exclusion of T1DM and other diabetes-related diseases are eMERGE’s strengths as compared to other DM phenotyping algorithms.
As noted in a previous study,6 we found that eMERGE’s case identification algorithm has relatively low sensitivity because it was designed to identify exact T2DM cases and exclude any other potential type of similar diseases such as T1DM, obesity, and gestational diabetes. Therefore, it might still miss T2DM cases in MIMIC-IV. However, we recall that increasing the sensitivity may decrease the PPV.
Some NLP-based phenotyping algorithms have both high sensitivity and PPVs because they make use of clinical notes written by physicians, but they may also become complicated. To have larger case and control T2DM cohorts from MIMIC-IV when it is supplemented with clinical notes, future work may combine structured data elements and unstructured clinical notes for phenotyping. In the meantime, eMERGE is a suitable method for T2DM case and control identifications on MIMIC-IV.
Another limitation of our study is that we do not have a gold-standard T2DM cases and controls in MIMIC-IV verified by clinical experts to evaluate our results. It can only be accomplished with clinical notes, because in many cases just structured data elements do not provide sufficient information for clinical experts to confirm if a patient has T2DM or not, and even two reviewers of clinical notes may have different opinions that need to be resolved by a another physician.9. Despite these limitations, thanks to eMERGE’s high PPVs, our work provides the first T2DM case and control cohorts from MIMIC-IV that can be used for further T2DM studies.
Conclusion
We chose the rule-based eMERGE phenotyping algorithm to extract T2DM cases and controls from the MIMIC-IV database because of its high reliability and interpretability. We applied the up-to-date lists of ICD-9 codes and medications for T2DM and identified those MIMIC-IV tables that contain the data elements used by eMERGE. We obtained 12,735 T2DM cases and 9,828 T2DM controls from nearly 400 thousand patients in MIMIC-IV, and presented the distributions of gender, ethnicity, and age of the cohorts. To our knowledge, these are the first case and control T2DM cohorts that can be used for further research on T2DM in the MIMIC-IV population, such as estimation of diabetes risk or prediction of diabetes-related outcomes. This study could be useful for applying eMERGE to extract T2DM cases and controls from MIMIC-III, which has similar data structures as MIMIC-IV. For future work, we also suggest overcoming the above-discussed limitations by using clinical notes when they are supplemented to MIMIC-IV.
Figures & Table
Table 6.
DM-related family history ICD codes in MIMIC-IV
| ICD System | ICD Code |
| ICD-9 | V180 |
| ICD-10 | Z833 |
References
- 1.Khan FA, Zeb K, Al-Rakhami M, Derhab A, Bukhari SAC. Detection and prediction of diabetes using data mining: a comprehensive review. IEEE Access. 2021;9:43711–35. [Google Scholar]
- 2.Bommer C, Sagalova V, Heesemann E, Manne-Goehler J, Atun R, Bärnighausen T, et al. Global economic burden of diabetes in adults: projections from 2015 to 2030. Diabetes Care. 2018;41(5):963–70. doi: 10.2337/dc17-1962. [DOI] [PubMed] [Google Scholar]
- 3.DeFronzo RA, Ferrannini E, Groop L, Henry RR, Herman WH, Holst JJ, et al. Type 2 diabetes mellitus. Nature Reviews Disease Primers. 2015;1(1):1–22. doi: 10.1038/nrdp.2015.19. [DOI] [PubMed] [Google Scholar]
- 4.Kazerouni F, Bayani A, Asadi F, Saeidi L, Parvizi N, Mansoori Z. Type2 diabetes mellitus prediction using data mining algorithms based on the long-noncoding RNAs expression: a comparison of four data mining approaches. BMC Bioinformatics. 2020;21(1):1–13. doi: 10.1186/s12859-020-03719-8. [DOI] [PMC free article] [PubMed] [Google Scholar]
- 5.Zimmet P, Magliano D, Herman H, Shaw J. Diabetes: a 21st century challenge. Lancet Diabetes and Endocrinology. 2014;Jan 2(1):56–64. doi: 10.1016/S2213-8587(13)70112-8. [DOI] [PubMed] [Google Scholar]
- 6.Richesson RL, Rusincovitch SA, Wixted D, Batch BC, Feinglos MN, Miranda ML, et al. A comparison of phenotype definitions for diabetes mellitus. Journal of the American Medical Informatics Association. 2013;20(e2):e319–e26. doi: 10.1136/amiajnl-2013-001952. [DOI] [PMC free article] [PubMed] [Google Scholar]
- 7.Sun Y-l, Zhang D-l. Machine learning techniques for screening and diagnosis of diabetes: a survey. Tehnički Vjesnik. 2019;26(3):872–80. [Google Scholar]
- 8.Giveki D, Salimi H, Bahmanyar G, Khademian Y. Automatic detection of diabetes diagnosis using feature weighted support vector machines based on mutual information and modified cuckoo search. arXiv Preprint arXiv:12012173. 2012 [Google Scholar]
- 9.Newton KM, Peissig PL, Kho AN, Bielinski SJ, Berg RL, Choudhary V, et al. Validation of electronic medical record-based phenotyping algorithms: results and lessons learned from the eMERGE network. Journal of the American Medical Informatics Association. 2013;20(e1):e147–e54. doi: 10.1136/amiajnl-2012-000896. [DOI] [PMC free article] [PubMed] [Google Scholar]
- 10.Anderson AE, Kerr WT, Thames A, Li T, Xiao J, Cohen MS. Electronic health record phenotyping improves detection and screening of type 2 diabetes in the general United States population: A cross-sectional, unselected, retrospective study. Journal of Biomedical Informatics. 2016;60:162–8. doi: 10.1016/j.jbi.2015.12.006. [DOI] [PMC free article] [PubMed] [Google Scholar]
- 11.Kavakiotis I, Tsave O, Salifoglou A, Maglaveras N, Vlahavas I, Chouvarda I. Machine learning and data mining methods in diabetes research. Computational and Structural Biotechnology Journal. 2017;15:104–16. doi: 10.1016/j.csbj.2016.12.005. [DOI] [PMC free article] [PubMed] [Google Scholar]
- 12.Evans RS. Electronic health records: then, now, and in the future. Yearbook of Medical Informatics. 2016;25(S 01):S48–S61. doi: 10.15265/IYS-2016-s006. [DOI] [PMC free article] [PubMed] [Google Scholar]
- 13.Kim E, Rubinstein SM, Nead KT, Wojcieszynski AP, Gabriel PE, Warner JL, editors. The evolving use of electronic health records (EHR) for research. Seminars in Radiation Oncology. 2019 doi: 10.1016/j.semradonc.2019.05.010. [DOI] [PubMed] [Google Scholar]
- 14.Alzoubi H, Alzubi R, Ramzan N, West D, Al-Hadhrami T, Alazab M. A review of automatic phenotyping approaches using electronic health records. Electronics. 2019;8(11):1235. [Google Scholar]
- 15.Johnson AE, Pollard TJ, Shen L, Lehman L-wH, Feng M, Ghassemi M, et al. MIMIC-III, a freely accessible critical care database. Scientific Data. 2016;3(1):1–9. doi: 10.1038/sdata.2016.35. [DOI] [PMC free article] [PubMed] [Google Scholar]
- 16.Ye J, Yao L, Shen J, Janarthanam R, Luo Y. Predicting mortality in critically ill patients with diabetes using machine learning and clinical notes. BMC Medical Informatics and Decision Making. 2020;20(11):1–7. doi: 10.1186/s12911-020-01318-4. [DOI] [PMC free article] [PubMed] [Google Scholar]
- 17.Anand RS, Stey P, Jain S, Biron DR, Bhatt H, Monteiro K, et al. Predicting mortality in diabetic ICU patients using machine learning and severity indices. AMIA Summits on Translational Science Proceedings. 2018;2018:310. [PMC free article] [PubMed] [Google Scholar]
- 18.Theis J, Galanter WL, Boyd AD, Darabi H. Improving the in-hospital mortality prediction of diabetes ICU patients using a process mining/deep learning architecture. IEEE Journal of Biomedical and Health Informatics. 2021;26(1):388–99. doi: 10.1109/JBHI.2021.3092969. [DOI] [PubMed] [Google Scholar]
- 19.Yang Q, Zheng J, Wen D, Chen X, Chen W, Chen W, et al. Association between metformin use on admission and outcomes in intensive care unit patients with acute kidney injury and type 2 diabetes: A retrospective cohort study. Journal of Critical Care. 2021;62:206–11. doi: 10.1016/j.jcrc.2020.12.007. [DOI] [PubMed] [Google Scholar]
- 20.Yang Q, Zheng J, Chen W, Chen X, Wen D, Chen W, et al. Association between preadmission metformin use and outcomes in intensive care unit patients with sepsis and type 2 diabetes: a cohort study. Frontiers in Medicine. 2021;8:640785. doi: 10.3389/fmed.2021.640785. [DOI] [PMC free article] [PubMed] [Google Scholar]
- 21.Quan H, Li B, Duncan Saunders L, Parsons GA, Nilsson CI, Alibhai A, et al. Assessing validity of ICD‐9‐ CM and ICD‐10 administrative data in recording clinical conditions in a unique dually coded database. Health Services Research. 2008;43(4):1424–41. doi: 10.1111/j.1475-6773.2007.00822.x. [DOI] [PMC free article] [PubMed] [Google Scholar]
- 22.Crabb BT, Lyons A, Bale M, Martin V, Berger B, Mann S, et al. Comparison of international classification of diseases and related health problems, tenth revision codes with electronic medical records among patients with symptoms of coronavirus disease 2019. JAMA Network Open. 2020;3(8):e2017703-e. doi: 10.1001/jamanetworkopen.2020.17703. [DOI] [PMC free article] [PubMed] [Google Scholar]
- 23.Pacheco JA, Thompson W. Type 2 diabetes mellitus electronic medical record case and control selection algorithms. Hemoglobin. 2011;1:6–5. [Google Scholar]
- 24.Nichols GA, Desai J, Lafata JE, Lawrence JM, O’Connor PJ, Pathak RD, et al. Construction of a multisite DataLink using electronic health records for the identification, surveillance, prevention, and management of diabetes mellitus: the SUPREME-DM project. Preventing Chronic Disease. 2012;9 doi: 10.5888/pcd9.110311. [DOI] [PMC free article] [PubMed] [Google Scholar]
- 25.Spratt SE, Batch BC, Davis LP, Dunham AA, Easterling M, Feinglos MN, et al. Methods and initial findings from the Durham Diabetes Coalition: integrating geospatial health technology and community interventions to reduce death and disability. Journal of Clinical & Translational Endocrinology. 2015;2(1):26–36. doi: 10.1016/j.jcte.2014.10.006. [DOI] [PMC free article] [PubMed] [Google Scholar]
- 26.Gorina Y, Kramarow EA. Identifying chronic conditions in Medicare claims data: evaluating the Chronic Condition Data Warehouse algorithm. Health Services Research. 2011;46(5):1610–27. doi: 10.1111/j.1475-6773.2011.01277.x. [DOI] [PMC free article] [PubMed] [Google Scholar]
- 27.Wiese AD, Roumie CL, Buse JB, Guzman H, Bradford R, Zalimeni E, et al. Performance of a computable phenotype for identification of patients with diabetes within PCORnet: The Patient‐Centered Clinical Research Network. Pharmacoepidemiology and Drug Safety. 2019;28(5):632–9. doi: 10.1002/pds.4718. [DOI] [PMC free article] [PubMed] [Google Scholar]
- 28.Zheng NS, Feng Q, Kerchberger VE, Zhao J, Edwards TL, Cox NJ, et al. PheMap: a multi-resource knowledge base for high-throughput phenotyping within electronic health records. Journal of the American Medical Informatics Association. 2020;27(11):1675–87. doi: 10.1093/jamia/ocaa104. [DOI] [PMC free article] [PubMed] [Google Scholar]
- 29.Kagawa R, Kawazoe Y, Ida Y, Shinohara E, Tanaka K, Imai T, et al. Development of type 2 diabetes mellitus phenotyping framework using expert knowledge and machine learning approach. Journal of Diabetes Science and Technology. 2017;11(4):791–9. doi: 10.1177/1932296816681584. [DOI] [PMC free article] [PubMed] [Google Scholar]
- 30.Banda JM, Seneviratne M, Hernandez-Boussard T, Shah NH. Advances in electronic phenotyping: from rule-based definitions to machine learning models. Annual Review of Biomedical Data Science. 2018;1:53. doi: 10.1146/annurev-biodatasci-080917-013315. [DOI] [PMC free article] [PubMed] [Google Scholar]
- 31.Wei W-Q, Tao C, Jiang G, Chute CG, editors. AMIA annual symposium proceedings. American Medical Informatics Association; 2010. A high throughput semantic concept frequency based approach for patient identification: a case study using type 2 diabetes mellitus clinical notes. [PMC free article] [PubMed] [Google Scholar]
- 32.Hubbard RA, Huang J, Harton J, Oganisian A, Choi G, Utidjian L, et al. A Bayesian latent class approach for EHR‐based phenotyping. Statistics in Medicine. 2019;38(1):74–87. doi: 10.1002/sim.7953. [DOI] [PMC free article] [PubMed] [Google Scholar]
- 33.Upadhyaya SG, Murphree Jr DH, Ngufor CG, Knight AM, Cronk DJ, Cima RR, et al. Automated diabetes case identification using electronic health record data at a tertiary care facility. Mayo Clinic Proceedings: Innovations, Quality & Outcomes. 2017;1(1):100–10. doi: 10.1016/j.mayocpiqo.2017.04.005. [DOI] [PMC free article] [PubMed] [Google Scholar]
- 34.Wong HB, Lim GH. Measures of diagnostic accuracy: sensitivity, specificity, PPV and NPV. Proceedings of Singapore Healthcare. 2011;20(4):316–8. [Google Scholar]
- 35.Kho AN, Hayes MG, Rasmussen-Torvik L, Pacheco JA, Thompson WK, Armstrong LL, et al. Use of diverse electronic medical record systems to identify genetic risk for type 2 diabetes within a genome-wide association study. Journal of the American Medical Informatics Association. 2012;19(2):212–8. doi: 10.1136/amiajnl-2011-000439. [DOI] [PMC free article] [PubMed] [Google Scholar]
- 36.Wei W-Q, Leibson CL, Ransom JE, Kho AN, Caraballo PJ, Chai HS, et al. Impact of data fragmentation across healthcare centers on the accuracy of a high-throughput clinical phenotyping algorithm for specifying subjects with type 2 diabetes mellitus. Journal of the American Medical Informatics Association. 2012;19(2):219–24. doi: 10.1136/amiajnl-2011-000597. [DOI] [PMC free article] [PubMed] [Google Scholar]
- 37.Wang L, Olson JE, Bielinski SJ, St. Sauver JL, Fu S, He H, et al. Impact of diverse data sources on computational phenotyping. Frontiers in Genetics. 2020;11:556. doi: 10.3389/fgene.2020.00556. [DOI] [PMC free article] [PubMed] [Google Scholar]
- 38.Li D, Simon G, Chute CG, Pathak J. Using association rule mining for phenotype extraction from electronic health records. AMIA Summits on Translational Science Proceedings. 2013;2013:142. [PMC free article] [PubMed] [Google Scholar]
- 39.Johnson A, Bulgarelli L, Pollard T, Horng S, Celi LA, Mark R. Mimic-iv. version 04) PhysioNet. 2020 https://doi org/1013026/a3wn-hq05 . [Google Scholar]
- 40.Liao KP, Sun J, Cai TA, Link N, Hong C, Huang J, et al. High-throughput multimodal automated phenotyping (MAP) with application to PheWAS. Journal of the American Medical Informatics Association. 2019;26(11):1255–62. doi: 10.1093/jamia/ocz066. [DOI] [PMC free article] [PubMed] [Google Scholar]
- 41.Wright A, McCoy AB, Henkin S, Kale A, Sittig DF. Use of a support vector machine for categorizing free-text notes: assessment of accuracy across two institutions. Journal of the American Medical Informatics Association. 2013;20(5):887–90. doi: 10.1136/amiajnl-2012-001576. [DOI] [PMC free article] [PubMed] [Google Scholar]
- 42.Spratt SE, Pereira K, Granger BB, Batch BC, Phelan M, Pencina M, et al. Assessing electronic health record phenotypes against gold-standard diagnostic criteria for diabetes mellitus. Journal of the American Medical Informatics Association. 2017;24(e1):e121–e8. doi: 10.1093/jamia/ocw123. [DOI] [PMC free article] [PubMed] [Google Scholar]
- 43.Brady V, Whisenant M, Wang X, Ly VK, Zhu G, Aguilar D, et al. Characterization of Symptoms and Symptom Clusters for Type 2 Diabetes Using a Large Nationwide Electronic Health Record Database. Diabetes Spectrum. 2022;35(2):159–70. doi: 10.2337/ds21-0064. [DOI] [PMC free article] [PubMed] [Google Scholar]
- 44.Association AD. 2. Classification and diagnosis of diabetes. Diabetes care. 2016;39(Supplement_1):S13–S22. doi: 10.2337/dc16-S005. [DOI] [PubMed] [Google Scholar]
- 45.Robles Arévalo A, Maley JH, Baker L, da Silva Vieira SM, da Costa Sousa JM, Finkelstein S, et al. Data-driven curation process for describing the blood glucose management in the intensive care unit. Scientific Data. 2021;8(1):1–13. doi: 10.1038/s41597-021-00864-4. [DOI] [PMC free article] [PubMed] [Google Scholar]
- 46.Diabetes tests.: Centers for Disease Control and Prevention. [Available from: https://www.cdc.gov/diabetes/basics/getting-tested.html.
- 47.Kautzky-Willer A, Harreiter J, Pacini G. Sex and gender differences in risk, pathophysiology and complications of type 2 diabetes mellitus. Endocrine Reviews. 2016;37(3):278–316. doi: 10.1210/er.2015-1137. [DOI] [PMC free article] [PubMed] [Google Scholar]
- 48.Cerner. Data and research. 2021. Available from https://www.cerner.com/ap/en/solutions/data-research.
- 49.Ly V. Type 2 Diabetes Phenotyping Report. Scientic Report. 2020 [Google Scholar]
- 50.Yadav P, Steinbach M, Kumar V, Simon G. Mining electronic health records (EHRs) A survey. ACM Computing Surveys (CSUR) 2018;50(6):1–40. [Google Scholar]