

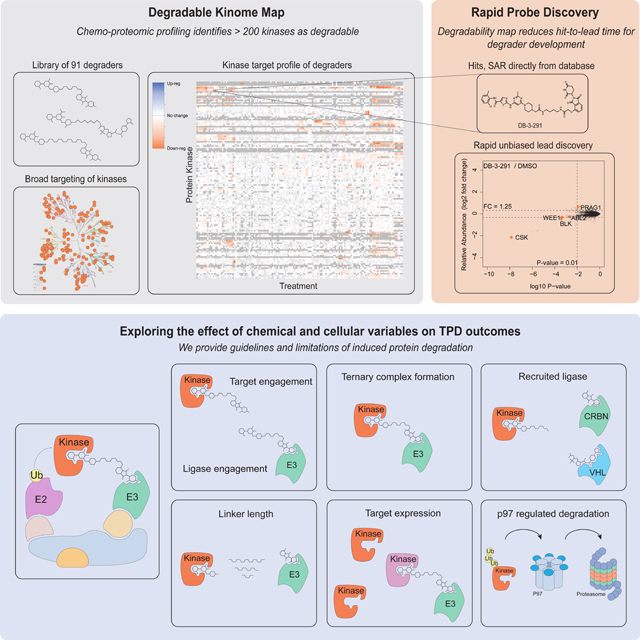
Summary
Targeted protein degradation (TPD) refers to the use of small molecules to induce ubiquitin-dependent degradation of proteins. TPD is of interest in drug development as it can address previously inaccessible targets. However, degrader discovery and optimization remain an inefficient process due to a lack of understanding of the relative importance of the key molecular events required to induce target degradation. Here we use chemo-proteomics to annotate the degradable kinome. Our expansive dataset provides chemical leads for ~200 kinases and demonstrates that the current practice of starting from the highest potency binder is an ineffective method for discovering active compounds. We develop multitargeted degraders to answer fundamental questions about the ubiquitin proteasome system, uncovering that kinase degradation is p97 dependent. This work will not only fuel kinase degrader discovery, but also provides a blueprint for evaluating targeted degradation across entire gene families, to accelerate understanding of TPD beyond the kinome.
Keywords: Ubiquitin, PROTAC, IMiD, Kinase, degrader, Ubiquitin proteasome system, targeted degradation, E3 ligase
In Brief:
A synthetic chemistry and chemo-proteomics platform used to annotate the ‘degradable kinome’, provides chemical leads for developing degraders of approximately 200 distinct kinase targets and offers new general design principles for developing future kinase degraders.
Graphical Abstract
INTRODUCTION
Targeted Protein Degradation (TPD) is an emerging therapeutic modality with the potential to overcome limitations of traditional pharmacological inhibition approaches (Bondeson and Crews, 2017; Burslem and Crews, 2020; Neklesa et al., 2017). TPD uses small molecules (degraders) to hijack the cellular degradation machinery by recruiting E3 ubiquitin ligases to proteins of interest (POI), which would not otherwise be recognized as substrates (Sakamoto et al., 2001) (Figure 1A).
Figure 1 |. An Experimental Map of the Degradable Kinome.

(A) Mode of action of targeted protein degraders. (B) Experimental approach taken in this study. (C) Features of the profiled degrader library. Chemical structures reported in Table S1. (D) Kinome tree presenting protein kinases that were significantly downregulated by at least one degrader. Image created using KinMap, illustration reproduced courtesy of Cell Signaling Technology, Inc. (www.cellsignal.com). (E) Proportion of the human protein kinome detected and degraded by proteomics in at least one experiment. Data reported in Table S1, 4. (F) Comparison of degraded kinase targets reported in the literature and in this study. Literature searching was performed in PubMed, using search terms ‘kinase PROTAC’ and ‘kinase degrader’. Data reported in Table S5. (G) The number of independent compound treatments for which degradation was observed for each kinase. Inset, the top 20 most frequently degraded kinases. (H) Comparison of kinase degradability score with PubMed Count and PDB count. (I) Proportion of understudied kinases, lipid kinases and pseudokinases detected and degraded by proteomics in at least one experiment in this study. Data reported in Tables S4. (J) Scatterplot displaying relative fold change in protein abundance following treatment of MOLT-4 cells with 1 μM DD-03–156 for 5 h. Inset, chemical structure of DD-03-156. Data are from n = 1 biologically independent treatment samples. The associated dataset is provided in Table S3-4.
A key promise of TPD is the prospect of increased efficacy due to a single degrader molecule being able to degrade multiple protein molecules, this unique mechanism of action is referred to as event-driven pharmacology (Bondeson et al., 2015). Degraders result in loss of both enzymatic and non-enzymatic functions of proteins, such as the scaffolding function of kinases (Cromm et al., 2018), or the gene regulatory functions of transcriptional effectors (Winter et al., 2015). Finally TPD may expand our ability to target the remaining 80% of the human proteome that has previously been considered undruggable (Russ and Lampel, 2005), due to the ability to utilize phenotypically silent ligands as POI-recruiting handles (Silva et al., 2019).
The majority of degraders recruit the CUL4-RBX1-DDB1-CRBN (CRL4crbn) (Ito et al., 2010; Kronke et al., 2014; Winter et al., 2015), or CUL2-RBX1-ElonginB-ElonginC-VHL (CRL2vhl) (Buckley et al., 2012; Galdeano et al., 2014) E3 ligases to ubiquitinate a POI. Additional ligases, such as MDM2 (Hines et al., 2019), cIAP1 (Okuhira et al., 2011), XIAP (Ohoka et al., 2017) and others (Bingqi et al., 2020; Lu et al., 2018; Simonetta et al., 2019; Spradlin et al., 2019; Ward et al., 2019; Zhang et al., 2019) have also been utilized. Over 60 POIs from diverse protein families and structural classes have been successfully degraded using a TPD strategy. Notable targets include; BCR/ABL (Lai et al., 2016), BRD4 (Lu et al., 2015; Nowak et al., 2018; Winter et al., 2015; Zengerle et al., 2015), HDAC6 (Wu et al., 2019), PI3K (Li et al., 2018) and aberrant Tau (Silva et al., 2019). Although degraders often have chemical properties outside the typical range for therapeutics (Lipinski et al., 1997), recent advancements in medicinal chemistry have resulted in development of orally bioavailable TPD molecules evaluated in human trials (NCT03888612, NCT04072952).
Despite the widespread exploration of TPD as a novel pharmacological modality, it remains difficult to predict which proteins are tractable and which may prove recalcitrant to this approach. Similarly, because of a non-linear dependence on binding, degradation target profiles often differ vastly from parental inhibitor selectivity profiles (Olson et al., 2018), and therefore large empirical datasets are necessary to establish the TPD target space.
We chose to focus on kinases due to the size of the gene family, the availability of chemically-diverse binders, and their high translational potential. Despite the increasing number of small molecule kinase inhibitors approved by the FDA (52 as of January 1st 2020) or in clinical development (> 175) (Roskoski Jr, 2019; Roskoski, 2019), only 7% of the human kinome has been therapeutically explored, and it is likely that many more attractive kinase targets await discovery. In this study, we built an experimental map of degradable kinases, targeting all clades of the kinome and containing chemical starting points for more than 200 distinct kinases, which we present as a public resource (http://proteomics.fischerlab.org), to accelerate chemical probe development, drug discovery, and the study of fundamental aspects of protein degradation pathways.
RESULTS
Part 1: An experimental map of the degradable kinome
Mapping the Degradable Kinome
The human protein kinase super family consists of 514 protein kinases (Manning et al., 2002), which makes up 2.5% of the total human genome. Utilizing the vast amount of chemical matter reported to bind kinases, as well as access to more than six thousand protein kinase X-ray structures in the Protein Data Bank (PDB) (Roskoski, 2019) to guide the positioning of linker exit vectors compatible with compound binding, we developed a large library of kinase-targeting degraders as a toolset to define the degradable kinome (Table S1). We designed this library to incorporate a wide range of kinase targeting scaffolds and binding modes, including Type I, Type II and allosteric. These parental molecules were derived from numerous sources including; FDA approved small molecules, such as imatinib (Gleevec), and ibrutinib (Imbruvica), where degraders that can overcome clinical resistance may be of value, patents, publications and novel in-house kinase targeting ligands (Figure 1C; Table S1). Finally, several degraders were synthesized based on highly multitargeted kinase inhibitors, such as desmethoxy-TAE684, AT7519 and ponatinib. Based on reported and in-house biochemical data, the parental inhibitors corresponding to degraders profiled in this study are able to engage 370 of the 395 unique kinases present in the DiscovRX kinomeSCAN panel (93%), corresponding to at least 70% coverage of the human kinome, enabling large scale investigation of the relative degradability of kinases (Figure 1D, E; Data File S1). To increase the probability of favorable ternary complex formation between a target kinase and the recruited ligase, we employed a variety of linker lengths, compositions and attachment chemistries, and incorporated E3-recruiting ligands targeting both CRBN and VHL into the library design (Figure 1C; Table S1). Degraders were prescreened for cellular permeability in the relevant ligase engagement assays and a final set of 91 compounds were selected based on their chemical diversity and their ranking in cellular ligase engagement assays relative to close analogs for unbiased profiling of their degradation targets (Table S1; Figure 1B, C).
We employed global proteomics to identify targets by measuring changes in protein abundance in response to treatment with each of the kinase degrader molecules (Table S1-3). Initial standard screening conditions of 5 h treatment time with 1 μM degrader compound were selected to reduce the likelihood of observing secondary effects on protein abundance and allow for similar comparisons (Bushman et al., 2020) (Table S1). Deep proteome coverage permitted quantification of 411 protein kinases across 7 cell lines: HEK293T, MOLT-4, Mino, MM1.S, OVCAR-8, KATO III and KELLY cells (Table S1-2). Using significance cutoffs of FC < −1.25, P-value < 0.01, identified 172 degraded protein-kinases, corresponding to 33% of the human kinome, and 42% of the detected kinome (Figure 1D, E; Data File S1; Table S2-3). An additional 204 proteins, that define the extended human kinome, have been identified as protein kinase-like and include mitochondrial kinases, metabolic kinases which phosphorylate lipids, carbohydrates and nucleosides, and a subset of bromodomains (Moret et al., 2020). We detected 173 of these proteins in at least one experiment, and identified degraders for 40 proteins from this list (Table S4; Figure S1A), validating them as pharmacologically related to protein kinases, and tractable TPD targets. In total, we identify 212 degraded protein kinase/kinase-related targets, a substantial increase from the 57 kinases that have been reported to be targetable through degrader-induced mechanisms in the literature (Table S5; Figure 1F) (Bondeson et al., 2018; Huang et al., 2018). Additionally, our dataset identifies kinases that may be refractory to degradation using currently available TPD technologies, and characterizes their binary target engagement, ternary complex formation and expression profiles (Table S2-6). This data quantifies how different parental kinase-binder chemotypes affect degradation of individual kinases.
Assigning a Degradability Score
Empirical measures of target ligandability, a term that reflects the expected balance between effort and reward in a traditional small molecule inhibitor discovery project based on currently available technologies, have proved critical for target prioritization (Vukovic and Huggins, 2018). Although development of targeted protein degraders requires a POI binder, among already-liganded proteins such as kinases, we hypothesized that different targets would have a different propensity for current approaches to degrader-mediated destruction, which we termed ‘degradability’. To assess degradability, we determined the frequency of degradation (number of times a kinase is determined to be a down-regulated hit across the database) for each protein kinase across all 155 treatments (Table S3-4). We rationalized that the probability of identifying the same kinase as a false positive in multiple treatments is low, therefore this analysis also served to assess the robustness of our data and subsequent interpretations. Across the 172 hits, 136 were shown to be downregulated in at least two independent treatments, and remarkably, 9 of these (CDK4, AURKA, FER, WEE1, BLK, LIMK2, CDK6, GAK, LIMK1) were each degraded in at least 40 of the 155 independent treatments, emphasizing their predisposition to induced degradation (Figure 1G; Table S4).
To assess transcriptional changes in response to the most multitargeted degrader molecule, SK-3–91, we performed a time-course RNA-sequencing experiment (Table S7) and found that transcript levels were largely unchanged up until the 4 h time point (Figure S1B), indicating that the hits in our database are unlikely to be transcriptionally downregulated. By the 8 and 12 h time points, complete transcriptional collapse occurred (Figure S1C), an unsurprising result given the number of kinases (including transcriptional kinases such as CDK9) that are down-regulated in response to SK-3–91, and these data were therefore excluded from our kinase degradation count and degradability scoring assessments (Figure 1E, G).
We next corrected the frequency of degradation assessment for over-representation of molecules in the full dataset by omitting replicate profiling of compounds under different experimental conditions. This allowed us to calculate “the degradability score” across all unique compound treatments (Table S8). Unsurprisingly, the top degradable kinases mirror those from the previous analysis (CDK4, AURKA, FER, WEE1, BLK), confirming that in sufficiently large datasets, even with over-representation of certain molecules, frequency of degradation is a good measure of general tractability.
We utilized published literature to assess the degree to which our scoring underestimates kinase degradability (Table S5). Here, we found that 52 of the 57 kinases with at least one active degrader reported were also identified as degradable in this study (> 90%, Figure 1F). Of the 5 degradable kinases that were detected in at least one published experiment by proteomics, and not degraded by any molecules in our study (ALK, CK2, MEK, MAPK13 and HER2) we found that all targets could be explained by low frequency of detection (Table S2), and/or slow degradation kinetics by the reported molecule. For example, reported CK2 degraders were active only at the 24 h time point (Chen et al., 2018). Outliers such as CK2 represent limitations of the study, and indicate that some detected but not degraded kinases may indeed be tractable under different experimental conditions.
With a large dataset in hand, we evaluated whether our degradable kinase hits were biased towards kinases that are well-studied, by examining the correlation between frequency of degradation and maximum observed protein abundance fold change for each kinase, with knowledge metrics such as the pubmed score (Pletscher-Frankild et al., 2015) and the number of entries in the PDB (Figure 1H; Figure S1D, E). We found no correlation between these variables, consistent with evidence that kinase inhibitor pharmacophores display a high degree of polypharmacology (Karaman et al., 2008; Knight et al., 2010) and indicating that our degradable kinome dataset may prove a valuable resource for generating initial leads for the development of selective chemical tools for understudied kinases (Rodgers et al., 2018). This analysis revealed active degraders for at least 16 of the NIH’s understudied kinases, some of which may be highly tractable for TPD (Table S4, Figure 1I). For example, cyclin-dependent kinase 17 (CDK17) is degraded by 15 different compounds. Here, we identified at least one lead-like degrader molecule, DD-03–156, which induces potent and selective degradation of CDK17 and LIMK2 (Figure 1J).
The human kinome contains approximately 55 pseudokinases, which are kinases that lack catalytic phospho-transfer activity but often have important scaffolding functions, making them potentially attractive targets for degraders (Moret et al., 2020). Out of 42 pseudokinases quantified, 10 were degradable by at least one compound in our set, including well characterized pseudokinases IRAK3 and TRIB3 (Table S4; Figure 1I). Due to the increased interest in targeting lipid kinases for therapeutic applications (Burke, 2018), we examined their degradability and identified leads for putative cancer targets PI3K-γ, PIP5K1A, PIP4K2B and PIP4K2C (Table S4; Figure 1I). Together with our extended kinome analysis (Table S4), these data suggest a subset of therapeutically relevant non-protein kinases are tractable targets for TPD.
Degradable Kinome Dataset Accelerates Lead Discovery
Current degrader design for a selected target typically starts with the identification of a high affinity binding ligand followed by the synthesis of a library of molecules incorporating different ligase recruiters and linkers. While the number of reported successes in compound development might imply that the design of these molecules is seamless (Lebraud and Heightman, 2017), some proteins have proven resistant to TPD, and most unsuccessful campaigns likely remain unpublished (Gasic et al., 2020; Zeng et al., 2019).
Beginning a targeted protein degrader discovery project with solid prior knowledge of optimal chemotype-target pairs can rapidly speed up hit-to-lead time (Brand et al., 2019; Cromm et al., 2018; Dobrovolsky et al., 2019; Jiang et al., 2019; Li et al., 2019; Olson et al., 2018). Our chemoproteomics data provides critical insights regarding target tractability, and potential starting points for degraders against novel targets. Equally important is the negative data contained within the dataset which illuminates the kinases that are not yet ‘degradable’ and reveals the chemical structures that are not active towards a particular kinase target (Table S1; Table S3-4).
Here we used two examples to illustrate the utility of database-assisted prioritization of lead molecules for novel kinase targets (Figure 2). To identify tractable targets, we created a list of degradable kinases (Table S3; represented as heatmap Figure 2A) and evaluated the active molecules for lead-like selectivity profiles. Despite an absence of prior reports that CSK is a degradable kinase, 15 compounds in our library were able to target CSK. Compound DB-3-291 was found to induce the strongest degradation, in addition to having the greatest selectivity (Figure 2A, B; Table S4). The DB-3-291 degrader incorporates the multitargeted inhibitor dasatinib as the kinase binding ligand, which was found to have a 1 nM in vitro binding affinity to CSK (KINOMEscan), however CSK was ranked 40th of over 100 kinases that had sub μM binding affinity (KD) (Davis et al., 2011). Thus, it is surprising that this molecule does not degrade additional kinases.
Figure 2 |. Degradable Kinome Dataset Accelerates Lead Discovery.

(A) Heatmap comparing relative fold change in protein abundance in response to treatment with indicated degrader (see Table S1 for treatment details and Table S3 for data). Inset, chemical structure of degrader DB-3-291. (B) Scatterplot displaying relative fold change in protein abundance following treatment of MOLT-4 cells with 1 μM DB-3-291 for 5 h. (C) Kinome tree representing the kinase degradability (DK) score calculated for each of the protein kinases degraded in this study. Data reported in Table S8. Image created using KinMap, illustration reproduced courtesy of Cell Signaling Technology, Inc. (www.cellsignal.com). (D) Strategy for conversion of Alisertib into selective AURKA degrader dAURK-4. (E) Scatterplot depicting relative fold change in protein abundance following treatment of MOLT-4 cells with 1 μM dAURK-4 for 5 h. Data in B, E are from n = 1 biologically independent treatment samples. Associated dataset is provided in Table S3. (F) Immunoblot analysis of MM.1S cells treated with the indicated concentration of dAURK-4 for 4 or 24 h. Data in F are representative of n = 2 independent experiments. (G) DMSO-normalized antiproliferation of MM.1S cells treated with Alisertib or dAURK-4. Data are presented as mean ± s.d. of n = 3 biologically independent samples and are representative of n = 2 independent experiments.
Given the general lack of reported selective CSK inhibitors, and the role of this kinase in promoting the innate immune response to viral DNA (Gao et al., 2020), DB-3-291 not only provides an advanced lead for further development into a chemical probe, but also demonstrates the utility of this resource for providing lead molecules for indications beyond oncology.
Using a similar strategy, we identified 31 molecules capable of inducing degradation of AURKA (Aurora A) (Figure 2C; Table S4). Incorporation of an AURKA selective inhibitor, alisertib, as the target binder resulted in potent and selective degradation by dAURK-4, validated by immunoblotting, confirming the relative ease of active compound development for highly degradable kinases with reported selective ligands (Figure 2C-F). Viability studies revealed that dAURK-4 has superior antiproliferative effects over parental inhibitor alisertib in the MM.1S multiple myeloma cell line (Figure 2G).
Part 2: Examining the effect of chemical and cellular variables on TPD outcomes
Having established tractable targets, we next set out to evaluate the contributions that chemical and cellular variables have on TPD efficacy and selectivity. Guidelines and observations, oftentimes contradictory, have been reported for the optimization of degraders and summarized in a number of reviews (Churcher, 2019; Paiva and Crews, 2019). However, as these studies are usually limited to one scaffold/binder, protein target and cell line combination, general conclusions about the frequency, magnitude and significance of these effects across a target space are challenging to extract. Motivated by a desire to understand the factors contributing to a successful TPD event, we sought to investigate some of the field’s hypotheses kinome-wide. Here, we examined cellular events including; cellular target engagement (Figure 3), ternary complex formation, target protein abundance, expression of components of the ubiquitin proteasome system (UPS) and ABC-drug transporters, target protein half-life, cell line variance (Figure 4), and the impact of altering the recruited E3-ligase (Figure 5), as well as chemical variables such as; linker length and exit vector (Figure 6).
Figure 3 |. Cellular Target Engagement Does Not Predict Degradation Efficiency.

Multiplexed TMT-based quantitative proteomics workflow used in this study. (B) ABPP-based KiNativ proteomics workflow used for target engagement measurements. (C) AP-MS approach used to enrich for degrader-mediated ternary complexes with CRBN. (D) Chemical structures of the 4 multitargeted degrader probes. (E) Scatterplot comparing kinase engagement (KiNativ, B) with kinase degradation (proteomics, A). KiNativ data are from n = 2 technically independent samples, proteomics analysis data are from n = 1 biologically independent treatment samples. Associated datasets are provided in Table S3, 4, 6. Negative KiNativ values were interpreted as 0% inhibition of binding. (F) Bar chart showing the proportion of degraded kinase targets for which detectable target engagement (TE, > 35% inhibition of binding) and degradation (FC > 1.25, P-value < 0.01) were observed for the 4 compounds tested.
Figure 4 |. Effects of ternary complex formation and target protein abundance on degrader efficacy.

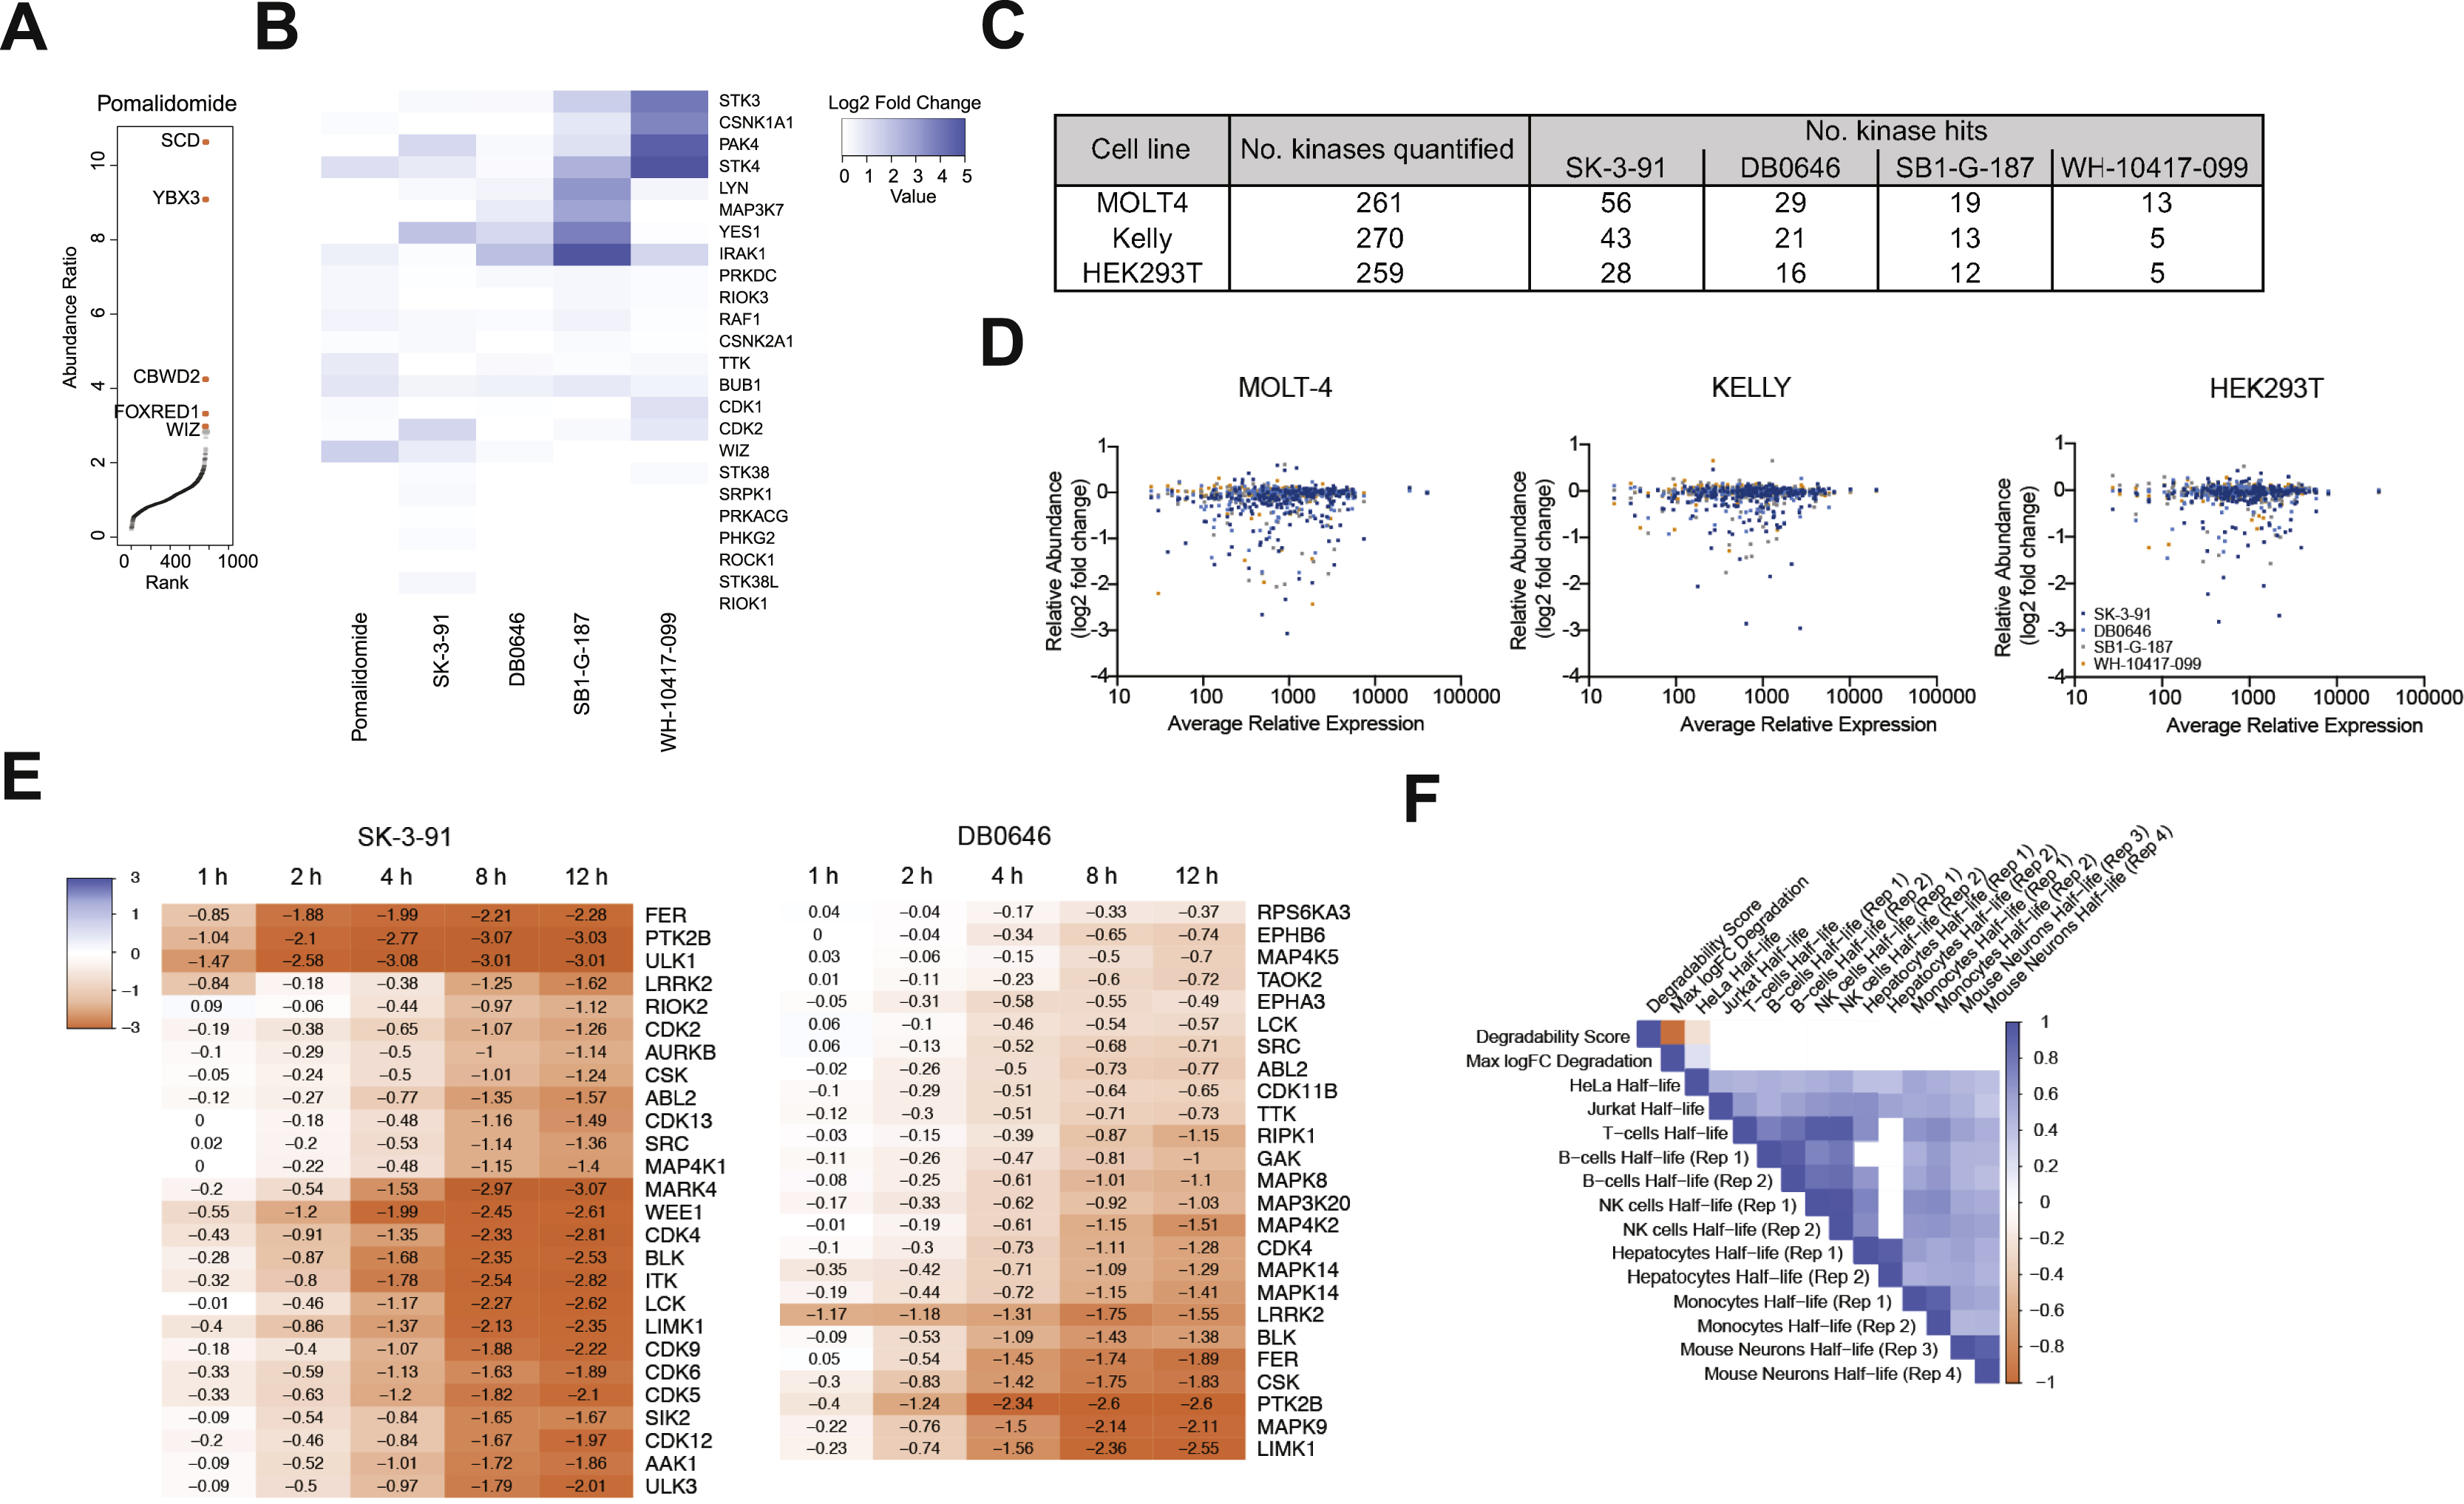
(A) Left. Scatterplot depicts relative fold change in protein abundance following treatment of HEK293T cells (See Fig. 3A). Right. Rank order plot showing the ranked relative abundance ratios of enriched proteins in FLAG-CRBN AP-MS experiments from HEK293T cells (see Fig. 3C). Data in scatterplots are from n = 2 biologically independent treatment samples. Data in rank order plots are from n = 3 biologically independent treatment samples. Associated datasets are provided in Tables S3, 7, 6. (B) Bar chart depicting the proportion of targets complexed and degraded by the indicated compounds. (C) Venn diagrams showing number of unique and overlapping kinase hits found for each compound in MOLT-4 (blue), KELLY (orange) and HEK293T (gray) cells. (D) Kinome wide comparison of the degradation frequency and the relative protein abundance in MOLT-4 cells. (E) Bar plot showing the average relative expression the indicated proteins (left) and number of kinases degraded by the indicated degraders (right) in MOLT-4, KELLY and HEK293T cells. Average abundance measurements were derived from n = 2 independent biological samples. Associated datasets are provided in Tables S2. (F) Correlation of kinase degradability score and reported protein half-life in listed cell types.
Figure 5 |. Varying the target recruiting ligase can influence degrader selectivity.

(A-C) Chemical structures and scatterplot log2 FC pairwise comparisons from treatment with VHL vs CRBN degrader pairs. Relative fold change in protein abundance measurements were determined from global quantitative proteomics experiments (Fig. 3C). Quantitative proteomics analysis data are from n = 2 biologically independent treatment samples. (D) Venn diagram illustrating the target overlap for the aggregated data in A, for lists see Table S9.
Figure 6 |. Protein kinases and IMiD off-target proteins have varied tolerance for subtle changes in linker design.

(A) Chemical structures of the compounds evaluated. (B) Intracellular ligase engagement assay. Data are represented as means ± s.d of n = 3 biologically independent replicates. (C, D) Heatmap showing log2 FC of (C) kinases, (D) known IMiD targets determined to be hits (FC >1.25 and P-value <0.01) following a 5 h treatment of MOLT-4 cells with 0.1 μM of the indicated compounds. (E) Split bar plot showing the number of CRBN-recruiting degraders found to hit at least one known IMiD off-target compared to the number that do not hit IMiD off-targets. CRBN-recruiting degraders are categorized according their linker attachment chemistry. Associated dataset is provided in Table S10.
Cellular Target Engagement Does Not Predict Degradation Efficiency
It is widely believed that degraders uncouple efficacy from target occupancy (Gadd et al., 2017; Nowak et al., 2018; Olson et al., 2018; Roy et al., 2019). While this has been confirmed in a limited number of individual studies, we sought to test the generalizability of this hypothesis. To do so, we selected the four degraders (SK-3–91, DB0646, SB1-G-187, and WH-10417–099) that could collectively induce degradation of the largest number of unique kinases (> 125 unique kinases) (Figure 3D, Figure S2A-B). To measure the occupancy of kinase targets in live cells, we performed KiNativ profiling (Patricelli et al., 2007) with each of the four degraders (Figure 3B). KiNativ is an activity based chemoproteomic assay, which measures the ability of a small molecule of interest to block binding of a covalent ATP-mimetic probe. The resulting data revealed that of the ~ 170 kinases quantified in both experiments, 47 were significantly engaged (> 35% inhibition of binding) by at least one of the four multi-kinase targeting degraders (Figure S2C; Table S6). Comparison of the change in relative abundance of all quantified protein kinases (Figure S2D) with their occupancy revealed that there is no correlation between cellular target engagement and potency of degradation across the four degraders (Figure 3E), suggesting that target binding is not a major factor that drives efficacy of degradation. In agreement with this, unlike kinase inhibitors, the clogP and the number of (degraded) targets of a molecule are not correlated across the dataset (Table S1; Figure S2E). Furthermore, the proportion of degraded kinases with detectable binding varied dramatically between compounds, and was unrelated to cellular permeability (Figure 3F). However, we did observe instances where a specific kinase is potently degraded with a high affinity degrader but shows no degradation with weaker affinity molecules, suggesting that in order to be efficacious some degraders need to clear a certain threshold of binding affinity. For example, GCK is bound and degraded by DB0646 (58 %I) and SB1-G-187 (94 %I), but not degraded by SK-3–91 (50 %I). We also observed examples of kinases that were engaged by multiple degraders to a similar extent, but were degraded by only one of these molecules, such as IRAK1 and CDK17 (Tables S4, S6).
There are many factors to consider when designing a degrader, and when a series is unsuccessful it is often difficult to gauge if this is in part because the target is particularly hard to degrade, and the size of the challenge if development is continued. Here, we used the degradability score to identify four protein kinases (CAMKK2, DNAPK, IKKe, and JAK2) that despite sufficient engagement by at least one molecule, show no indication of degradation by any of the 91 degraders included in our chemical library (Tables S4). To assess whether the absence of downregulation of protein levels could be a result of transcriptional compensation, we evaluated the transcriptional changes of these four kinases in response to a 4 h treatment with SK-3–91 (Table S7). The resulting transcriptional analysis showed no upregulation of these kinases (Figure S2F), ruling out compensatory upregulation (Figure S2C; Figure S2B), as causes of a lack of observed degradation.
Instead of relying on the binding profile of compounds to inform design, an activity-guided approach based on broad profiling data of multiple different scaffolds can accelerate lead identification for degraders.
Formation of a Stable Ternary Complex Does Not Predict Degradation Efficacy.
An important aspect of protein degraders is their potential for heightened target selectivity due to differences in the complementarity of target-ligase protein-protein interactions (Farnaby et al., 2019). For compound-induced degradation to be successful, productive ternary complex formation (ligase-degrader-POI) is necessary for proximity-mediated ubiquitin transfer onto the POI. Multiple studies have reported that the stability of the E3-degrader-POI ternary complex may influence degradation kinetics and selectivity, and may be a more reliable predictor for degradation than target engagement alone (Bondeson et al., 2018; Roy et al., 2019). To compare ternary complex formation to both target engagement and degradation across the kinome, and scaffolds, we experimentally assessed the breadth of kinases that form complexes with CRBN in the presence of our 4 selected multi-kinase targeting degraders (Figure 4A,B; Figure S3B). We performed cellular affinity purification followed by mass spectrometry (AP-MS) of FLAG-tagged CRBN, and the degree of kinase target enrichment was compared to kinase degradation hits in matched global proteomics experiments (Figure 3A, C). The proteins identified as complexed with CRBN were enriched for kinases as well as their known binding partners such as Cyclin B (CDK1) and RASSF1 (STK4), consistent with the binding profiles of the assayed degraders. All kinases identified by AP-MS except CSNK1A1 were also detected in the global degradation profiling, allowing us to interrogate trends across 52 unique kinases (Figure 4A; Figure S3B; Table S6). Limitations of this experiment include the potential loss of transient or weakly bound complexes in the enrichment and subsequent wash steps, the inherent noise associated with AP-MS relative to global proteomics analysis (Dunham et al., 2012; Yugandhar et al., 2019) and the short time point of the experiment, which precludes detection of degradation events with slow kinetics. Therefore, we focus here on the relationship between the formation of abundant, stable ternary complexes and rapid degradation.
We found instances where a kinase enriched in the AP-MS experiment was degraded in the corresponding global proteomics profiling for every compound. However, overall a low proportion of the degraded kinases for each molecule formed detectable ternary complexes in our experiment (Figure 4B; Table S4, 6). For the two molecules with the highest number of degradation targets (DB0646, SK-3–91), we observed fewer enriched proteins in the CRBN AP-MS, relative to SB1-G-187 and WH-10417–099. We hypothesize that this may be because these degraders form low levels of stable unique ternary complexes with multiple kinase partners, which dilutes the enrichment of many targets to immeasurable levels, or these degraders form transient, unstable, but highly productive ternary complexes that are unable to be captured in AP-MS experiments, indicating the rapid activity of DB0646 and SK-3–91 against their kinase targets, relative to SB1- G-187 and WH-10417–099, is driven by their ability to induce more effective degradation catalysis, rather than induce higher levels of stable complex formation with their targets,.
Although ternary complex formation is a mechanistic requirement of TPD, the frequency with which effective complex formation results in productive degradation, is poorly understood. In our experiment we observed evidence of the formation of both productive and unproductive ternary complexes with all compounds (Figure 4A; Figure S3B; Table S6). For YES1, IRAK1 and LYN, complex formation and degradation are sometimes detected together (YES1: DB0646, SB1-G-187. IRAK1, LYN: SB1-G-187), but complex formation does not predict degradation (YES1: SK-3–91, IRAK1: WH-10417–099). These data indicate that kinases have high compatibility for degrader induced binding with CRBN, but that different complexes differ in their ability to efficiently catalyze degradation. Finally, we observed that BUB1 was complexed but not degraded by all 4 degraders in HEK293T experiments, but was degraded in 24 independent treatments across the database in MOLT-4 and MM.1S cell lines, including by DB0646 and SK-3–91 (Tables S3-6). Here, altered degradation kinetics or other cell-type related variables could be drivers of this discrepancy. Together, these data highlight how the complex cellular environment, and the substoichiometric mode of action of degraders, decouple single molecular events, such as the degree of stable ternary complex formation, from efficient degradation.
Target Protein Abundance Does Not Predict Degrader Efficacy
The concentration of the two protein binding partners can affect ternary complex formation kinetics and equilibria in cells, and it has been suggested that target expression and/or local concentration influence target degradability (Sievers et al., 2018). To investigate the dependence of TPD efficiency on target expression level, we quantitatively evaluated the relative expression of proteins across 3 orthogonal cell lines, MOLT-4, KELLY and HEK293T, and profiled the 4 multi-kinase degraders in these lines (Figure 4C; Table S2-3). We observed differences in the number of degraded kinase targets of each molecule dependent on the cell line. In all cases the largest number of protein kinases per compound were degraded in MOLT-4 cells, followed by KELLY and HEK293T (Figure S3C). Encouragingly, the target overlap across cell lines was good, with ~ 50% of the hits in MOLT-4 cells degraded in all 3 cell lines. Cell-line specific kinase hits were found for 3 of the 4 compounds (Figure S3C). Whilst a small number of these differences are driven by differences in kinase detection, globally we did not observe a linear relationship between protein expression and protein abundance fold change (FC) upon degrader treatment across the 3 cell lines (Figure 4E). We examined this relationship across the dataset, by calculating the frequency of degradation for each kinase profiled in MOLT-4 cells (Table S8). In both cases, a U-shaped relationship was observed between either max FC or degradation frequency and protein expression (Figure 4D), consistent with that expected from mathematical models of three-body binding equilibria (Douglass Jr et al., 2013). These data suggest it may be more challenging to rapidly degrade kinases with either very high or very low relative expression levels. We looked at expression levels of the previously identified poorly-degradable kinases. Here we found DNAPK is the most highly expressed kinase in MOLT-4 cells, potentially explaining its resistance to rapid degradation (Table S2).
Although target expression did not appear to be the key driver of degradation differences between cell lines, we hypothesized that kinase expression level may alter degradation kinetics. To assess this, we performed a degradation time course (1 to 12 h) in MOLT-4 cells treated with SK-3–91 or DB0646 (Figure S3E; Table S3-4), however no correlation between expression level and degradation rate was observed (Table S2).
We next examined the expression levels of the CRL4crbn E3 ligase subunits, the E2 enzyme UBE2G1, the p97-unfoldase, proteasome subunits and ABC drug transporters across the 3 cell lines (Figure 4E; Table S2). Here we found expression levels of the CRL4crbn complex did not correlate with number of targets per compound (Figure 4E; Table S2). Finally, we examined the relationship between the reported protein half-life and a targets degradability. We utilized reported kinase half-life data from 3 independent studies, and 8 different cell lines or primary cell types and compared this to the totaled degradation frequency across our dataset (Becher et al., 2018; Mathieson et al., 2018; Zecha et al., 2018). We observed positive correlation between kinase half-lives reported in different studies and different cell types (Figure 4F; Figure S3F). A weak negative correlation was observed in the HeLa cell kinase half-life data, where highly degradable kinases had a lower T1/2 (Figure 4F). No correlation was present between kinase half-life and either degradation frequency or maximal protein abundance fold change in response to degraders in all other cell types (Figure 4F; Figure S3F), leading us to conclude that endogenous protein turnover rate is unrelated to TPD tractability.
Varying the Recruited E3 Ligase Can Influence Degrader Target Space
The propensity of different E3 ligases to ubiquitinate specific proteins has been reported to vary in the literature (Bondeson et al., 2018; Smith et al., 2019) and variation is attributed to the unique protein-protein interactions that may form between the E3 ligase and target. To assess the impact of altering the target scaffold on the ability of the E3 ligase to influence accessible target scope (Bondeson et al., 2018), we compared the degradation profiles of three matched pairs of multitargeted kinase degraders in MOLT-4 cells. Each of the pairs contained the same kinase targeting ligand (either a thienopyrimidine, desmethoxy-TAE684, or GNF-7) and either a CRBN or a VHL binding moiety, enabling an evaluation of the E3-ligase preference of 86 degraded kinases (Figure 5, Table S9).
The CRBN and VHL ligands have distinct chemical properties (Table S9). To rule out differences in cell permeability as a cause for observed differences in target scope, we tested these six degraders in intracellular E3 ligase engagement assays. Side-by-side comparison of each of the matched pairs of degrader molecules revealed only minor differences (Figure S4A-C), with the exception of the desmethoxy-TAE684 based degraders where the CRBN-based degrader was significantly more cell permeable (Figure S4C).
By altering the ligase recruited, the kinases accessible using these three scaffolds expanded. Seventy unique kinases were degraded by at least one of the three CRBN-recruiting degraders. Upon inclusion of the VHL-recruiting pairs, we identified an additional 16 degraded kinases, corresponding to a 23% increase in kinases targeted. Encouragingly, 50 kinases were degradable by either CRBN or VHL ligase (Figure 5D; Table S9). We assessed whether the nature of the target recruiting ligand impacted the observed ligase preference. We found that a number of kinases showed the same ligase preference across more than one pair, and this preference held true across the entire degradable kinome database, for example MAP3K11 and SRC, which despite being targeted by many different compounds (8 and 14 respectively), were found to be degraded exclusively by CRBN-recruiting degraders (Table S9).
In addition to highlighting kinases that are exclusively targeted by one E3 ligase over another, we can also use this dataset to assist with compound design and synthetic prioritization by extracting information about which ligase may be more effective at degrading specific targets. Such as NEK9, which is degradable by both ligases but clearly favors CRBN (Figure 5A; Figure S4B, C). Utilizing direct comparisons of CRBN and VHL degrader pairs with three different kinase targeting scaffolds we quantified the magnitude of effect that can be achieved by the addition of another E3 ligase to the TPD toolbox (23% increase in degraded kinases) and provide additional evidence that expanding the number of ligandable E3-ligases may significantly expand the degradable target space, thus justifying efforts towards developing new E3-targeting molecules. In addition, this dataset delivers critical insights into E3 ligase preferences for over 80 protein kinases which is valuable information for assisting the initial design of new degrader molecules.
Protein Kinases and IMiD Off-Targets Have Varied Tolerance for Subtle Changes in Linker Design
Changes to linker length have proven to significantly alter the selectivity profile of degraders, such as the transformation of a pan-BET degrader to a BRD4 selective degrader (Nowak et al., 2018). Using post hoc PPI docking, it was rationalized that the observed differences in selectivity were likely due to differences in the ternary complex conformations available.
To systematically assess the importance of subtle linker differences more broadly, we synthesized six multitargeted kinase degraders designed to cover the linker space and E3 binding exit vector around the previously published TL12–186 degrader (Huang et al., 2018) (Figure 6A). These compounds were profiled to confirm comparable intracellular CRBN engagement across the series (Figure 6B). We found that of the 26 kinases degraded, a subset showed comparable degradation across all 6 compounds suggesting that they are highly tolerant of linker alterations (Figure 6C; Table S3-4) and indicating that these specific kinases may have the ability to adopt multiple productive complex conformations with CRBN. This set is enriched for kinases found to be highly degradable across the dataset, suggesting that the plasticity of the ternary complex may be an important feature of highly degradable targets.
Analysis of the data revealed that the number of kinase targets decreased with increasing linker length - PEG1 (25), PEG2 (23) and PEG3 (18) (Figure 6C; Table S10). This is surprising because multiple use cases have reported that longer linkers can be more productive at forming ternary complexes and inducing degradation than their shorter counterparts (Chan et al., 2018; Zorba et al., 2018), highlighting the difficulty in extrapolating TPD design rules across different E3 ligase-target pairs. In our data, a subset of kinases had strong linker preferences, ranging from preference for a specific molecule (CSK, CDK9), preference for short linker (ABL2, CDK4, CDK5, CDK12 and LIMK2), or specific linker-attachment regioselectivity (CDK7, AAK1, BLK). In the absence of empirical data, or yet-to-be developed predictive models, linker exploration by extensive analog synthesis may be required to find compounds active toward the subset of kinases with narrow linker SAR. Another aspect of target specificity that has shown to be amenable to manipulation of the linker exit vector is the degradation of IMiD targets, a consequence of using IMiD molecules to recruit CRBN. Direct comparison of the expression of known IMiD targets in response to these degraders provided insights into the linker structure activity relationships (SAR) for this family of off-targets, revealing that ZNF653 and IKZF1 clearly favor ortho-linked degraders, whereas RNF166 favors meta-linked degraders (Figure 6D, Table S10).
Previous studies have shown that a nitrogen to oxygen modification on the thalidomide aryl attachment point can reduce or remove IMiD off-target effects in BTK and CDK4/6 targeted degraders (Dobrovolsky et al., 2019; Jiang et al., 2019). To assess the applicability of this design feature to a broad target and scaffold scope, we assessed the propensity of the 68 CRBN-recruiting degraders in this database to degrade known IMiD targets (Donovan et al., 2018; Sievers et al., 2018). Consistent with previous reports, we found that all 34 degraders containing an aryl amine exit vector, were able to induce degradation of at least one, but in most cases several, IMiD targets. Surprisingly, the majority of aryl ether linked degraders also induced degradation of IMiD targets. However, 19 of the 25 CRBN-recruiting degraders with an aryl oxy acetamide conjugation to linker showed no degradation of IMiD off-targets, highlighting this as a preferred linker-attachment chemistry for selective degraders (Figure 6E).
Proteasomal Degradation of Most Kinases is p97 Dependent
AAA+ ATPase p97 unfoldase activity has been demonstrated to be necessary for extracting a subset of proteins marked for degradation from multi-protein complexes, chromatin, or membrane bound complexes (Ramadan et al., 2007; Shcherbik and Haines, 2007; Verma et al., 2011). However, it is unclear what factors determine whether degradation of a ubiquitinated protein occurs in a p97 dependent, or independent manner. The ability to induce rapid polyubiquitination of large numbers of kinases with multitargeted degraders provided an opportunity to examine whether degradation of protein kinases is p97 dependent, and if this dependency changes with differences in recruited E3 ligase.
To assess p97 dependence across the kinome we measured changes in protein abundance in response to treatment with each of the four multi-kinase targeting degraders alone and compared to co-treatment with the p97 inhibitor CB-5083 (Table S3). Analysis of the four treatment groups revealed that almost all of the kinases downregulated in response to degrader treatment show some degradation rescue when p97 is inhibited (Figure 7A; Figure S5A). Given the major role of p97 in regulating cellular protein degradation, we sought to rule out the possibility of indirect effects of p97 inhibition contributing to the observed p97-dependent degradation rescue. To thoroughly test the global proteome response to p97 inhibition, we performed protein expression measurements after a time course (20 min to 6 h) of p97 inhibition (Table S3). Analysis of protein expression of the top kinase hits from each experiment revealed that expression levels were stable over 6 h, confirming that in absence of degrader, p97 inhibition does not cause global blocking of kinase degradation (Figure 7B). In addition, we confirmed that the proposed p97 dependence is independent of the ligase responsible for mediating ubiquitination by comparing results from three GNF-7-based multitargeted kinase degraders that recruit different E3 ligases (CRBN, VHL or IAP) (Figures 7C, D; Figure S5B).
Figure 7 |. Proteasomal degradation of most kinases is p97 dependent.

(A) Scatterplots depicting the fold change in relative abundance following a 5 h treatment of MOLT-4 cells with 1 μM of the indicated compounds with (blue) and without (orange) co-treatment with 5 μM of p97 inhibitor CB-5083. Relative expression data are derived from n = 2 biologically independent treatment. Datasets are provided in Table S3. (B) Bar chart comparing the relative protein abundance of the top 5 degraded kinases from each of the indicated treatments in A. Bars indicate relative protein expression in response to inhibition of p97 with 5 μM of CB-5083, over a time course experiment in MOLT-4 cells. Relative expression data are represented as mean ± s.d. of from n = 2 biologically independent treatment. (C) Chemical structures of GNF7-based kinase degraders utilizing either a CRBN, VHL or IAP binding moiety. (D) As in A but for compounds indicated in C. (A-D) Datasets are provided in Table S3.
Taken together, our results suggest that the role of p97 in the handover of substrates to the proteasome goes beyond the extraction of proteins from large cellular structures, but also includes unfolding soluble polyubiquitinated proteins, such as the diverse array of protein kinases.
DISCUSSION
Targeted protein degradation is a rapidly growing area of interest, yet degrader development remains empirical (Kostic and Jones, 2020). In this study we applied a broad analysis of the degradability of the kinome to address the current lack of datasets from which to extract general features of TPD-mediated degradation. We combined a curated library of degraders, with mass spectrometry-based quantitative proteomics to map the degradability of more than 200 kinases across 7 different cell lines.
Many of the degraders characterized here represent valuable initial leads for the development of selective degrader chemical probes for understudied kinases (Oprea et al., 2018). Strikingly, we found active degrader molecules for more than 16 understudied kinases including two potent and selective degraders for CDK17. The kinase ligand in these two molecules is dabrafenib (Tafinlar), an approved inhibitor of BRAF V600E mutations in patients with malignant melanoma. Given that dabrafenib is commonly described as a BRAF selective molecule (Rheault et al., 2013), it is extremely unlikely that it would feature on the list of initial ligands for beginning a CDK17 selective degrader campaign, yet the selectivity and potency of DD-03–156 is exquisite and would make an advanced starting point for the development of a chemical probe for the degradation of CDK17. This example illustrates how the additional constraints required for degradation can lead to dramatically altered selectivity in the degrader relative to a parental inhibitor, and the significant benefit that informed scaffold selection can have for the identification of starting chemistry and degrader design. Whilst the inhibition profile of kinase binders will likely contribute to phenotypic effects of selective degraders developed from multitargeted inhibitors at high doses, the substoichiometric and irreversible nature of degraders means that it is feasible to optimize degraders to achieve complete target depletion at cellular concentrations below those required for measurable target occupancy (Olson et al., 2018). One of the largest challenges in the use of degrader technology is the length of the resource-intensive discovery phase (Burslem and Crews, 2020). So far, a number of potential trends or observations to guide rational degrader design have been reported, often only backed by a few exemplified molecules and targets. With the large dataset presented here, we observed that many factors typically considered important, such as linker length, ligase binding moiety, cellular target occupancy, ternary complex formation or target expression level, play a surprisingly inconsistent role in the efficacy of degraders for kinases, highlighting the need for data-driven approaches. We were able to successfully sort kinases according to how they are affected by each of these variables, and this experimentally-determined categorization will prove crucial for the design of optimization workflows and synthetic prioritization. For example, while we can generally conclude that cellular target engagement is not a good predictor of degrader efficacy, suggesting a catalytic mechanism uncoupled from primary affinities, we also discovered kinases where an affinity threshold must be met for degradation, such as GCK. We found evidence of both productive and unproductive degrader induced ternary complex formation with CRBN, and observe that many kinases are degraded even though they do not form detectable ternary complexes, indicating transient or low abundance complexes can result in efficient degradation. While many targets can be degraded with both CRBN and VHL targeting degraders, a significant number show clear preferential compatibility with one over the other. We observed differences in the target profile of compounds when tested in MOLT-4, KELLY or HEK293T cells, and ruled out target expression levels as the determining factors driving these differences. We conclude that the downregulated targets of degraders should be characterized in the cellular or in vivo systems in which their effects will be studied. Furthermore, we found the effects of linker composition differences on degradation are highly variable across the kinome. High linker-variant tolerance was observed for the most degradable kinases, indicating that these proteins can form a range of productive ternary complex conformations with CRBN. Together our conclusions underline the complexity of the degradation-based mechanism of action, and the importance of creating and expanding systematic resources. Crucially, the database includes negative data, which although often overlooked and underreported is critical for accelerating degrader discovery in the broader community.
Technological advances often facilitate new biological discoveries (Botstein, 2010). We demonstrate that this database can serve as a rich source of small molecule tools with which to study the basic biology of the ubiquitin proteasome system (UPS), by interrogating the role of the AAA+-ATPase p97. Our observations suggest that the majority of the degradable kinome is processed in a p97-dependent fashion, and that this dependence occurs irrespective of the E3 ligase recruited (CRBN, VHL and IAP). Although much still remains to be understood about the role of p97 in facilitating the proteasomal degradation of kinases, this study demonstrates how our collection of multitargeted degraders can be harnessed to reveal effects of perturbations to the UPS on protein degradation across gene families.
A limitation of our approach is that it informs on TPD in the context of degraders developed from reported kinase binders and commonly employed linkers and E3-recruiting ligands, of which it is implausible to generate all possible variants. In addition, these degraders are tested in the biological setting of immortalized cancer cell lines. These variables were all found to dramatically influence the degradation of specific targets, and it is probable that there are more discoveries to be made by expanding beyond the scope of this study. Hence, we envision the degradable kinome database as a living resource that will continue to expand as new results become available. We anticipate this large dataset will accelerate development not only of degrader chemical probes and clinically relevant lead compounds across the kinome, but also of informatics and molecular modeling-based approaches that may lead to improved prediction of degradation activity and rational design of these bifunctional entities.
STAR★Methods
RESOURCES AVAILABILITY
Lead Contact
Further information and requests for resources and reagents should be directed to and will be fulfilled by the Lead Contact, Eric Fischer (Eric_Fischer@DFCI.HARVARD.EDU).
Materials Availability
Small molecules described in this study will be made available on request, upon completion of a Materials Transfer Agreement.
Data and Code Availability
The raw proteomics datasets generated during this study are available at PRIDE accession: PXD019142; PXD019143; PXD019144; PXD019242; PXD019168; PXD019167; PXD019166; PXD019164; PXD019165; PXD019171; PXD021255; PXD021313; PXD021242.
Proteomics data generated during this study are also available in our custom online database webtool: http://proteomics.fischerlab.org.
The RNA sequencing data generated during this study is available at GEO accession: GSE157560.
EXPERIMENTAL MODEL AND SUBJECT DETAILS
Cell culture
All cells were grown in a 37 °C incubator with 5% CO2.
HEK293T cells:
Human embryonic kidney cells (fetus) were cultured in DMEM media supplemented with 10% fetal bovine serum.
MOLT-4 cells:
Human T lymphoblastic cells from acute lymphoblastic leukemia (male, 19 yr) were cultured in RPMI-1640 media supplemented with 10% fetal bovine serum.
MM. 1S cells:
Human B lymphoblastic cells from immunoglobulin A lambda myeloma (female, 42 yr) were cultured in RPMI-1640 media supplemented with 10% fetal bovine serum.
KELLY cells:
Human brain cells from neuroblastoma were cultured in RPMI-1640 media supplemented with 10% fetal bovine serum.
OVCAR-8 cells:
Human ovarian cells from ovarian carcinoma (female, 64 yr) were cultured in RPMI-1640 media supplemented with 10% fetal bovine serum.
Mino cells:
Human lymphoblastic cells from mantle cell lymphoma (male, 64 yr) were cultured in RPMI-1640 media supplemented with 15% fetal bovine serum.
KATO III cells:
Human stomach cells from gastric carcinoma (male, 55 yr) were cultured in IMDM media supplemented with 20% fetal bovine serum.
METHOD DETAILS
Competitive displacement assay for cellular CRBN and VHL engagement
HEK293T cells stably expressing the BRD4BD2-GFP with mCherry reporter were seeded at 30 – 50% confluency in 384-well plates with 50 μL FluoroBrite DMEM media (Thermo Fisher Scientific A18967) containing 10% FBS per well a day before compound treatment. Degrader titrations and 100 nM dBET6 or 250 nM AT1 were dispensed using a D300e Digital Dispenser (HP), normalized to 0.5% DMSO, and incubated with cells for 5 h. Assay plates were imaged using Acumen (TTP Labtech) as described above. Experiments were performed in triplicates and the values for the concentrations that lead to a 50% increase in BRD4BD2-eGFP accumulation (EC50) were calculated using the nonlinear fit variable slope model (GraphPad Software).
CellTiter-Glo Viability Assay
MM1.S (purchased from ATCC) was seeded in a 96-well microplate at 10,000 cells per well in RPMI-1640 media supplemented with 10% FBS and incubated with compounds (final DMSO concentration at 0.1%). Relative cell viability was measured 72 h after addition of drug using CellTiter-Glo (Promega) according to the manufacturer’s protocol. Each analysis was performed in biological triplicate.
KiNativ Live Cell Profiling Protocol
CRBN−/− MOLT-4 cells were plated in fresh media (RPMI-1640 + 10% FBS) in 15 cm plates and treated for 5 h with candidate compounds. To harvest cells, plates were harvested using detachment using CellStripper detachment solution (Corning) and washed twice with cold PBS, followed by centrifugation and snap-freezing of cell pellets in liquid nitrogen. The remainder of the KiNativ profiling experiment was performed by ActivX Biosciences (La Jolla, CA).
RNA Sequencing
MOLT-4 cells were seeded into 24 T25 flasks with 10 mL of culture at 106 cells/mL prior to compound treatment. Cells were treated in four replicates each with either 0.05% DMSO or 1 μM SK-3–91 for a total duration of 1, 2, 4 or 8 h. Cells were harvested using CellStripper Dissociation reagent (Corning), washed twice with PBS, followed by snap freezing in liquid nitrogen. Total RNA was isolated from cell pellets using the RNeasy Mini Kit (Qiagen) following the manufacturer’s directions. For quality control, RNA concentration and rRNA ratio (28S/18S) were measured using an Agilent 2100 Bioanalyzer. Samples were submitted to BGI Group for RNA-seq library preparation and Next Generation Sequencing using the BGISEQ-500 platform producing 50 base-pair single-end reads. Sequencing reads were aligned to the human genome (BSgenome.Hsapiens.UCSC.hg19 Bioconductor package, using splicedAlignment = FALSE) and quantified at the level of genes (TxDb.Hsapiens.UCSC.hg19.knownGene Bioconductor package) using the QuasR package with default parameters (Gaidatzis et al., 2015). Expressed genes were identified using the edgeR Bioconductor package (Robinson et al., 2010).
Immunoblots
Cells were treated with indicated compounds and doses for 4 h and washed once with cold PBS. Cells were lysed in an NP40 buffer (50 mM Tris-HCl pH 7.5, 1% NP40, 1 mM EDTA, 150 mM NaCl, 5 mM Na3VO4 and 2.5 mM NaF) containing a protease inhibitor cocktail (Roche, 11873580001) or a triton buffer (20 mM Tris HCl pH 7.5, 150 mM NaCl, 1 mM EDTA, 1 mM EGTA, 1% Triton, 2.5 mM sodium pyrophosphate, 1mM β-glycerophosphate, 1 mM Na3VO4, 1 μg/ml leupeptin) containing halt protease and phosphatase inhibitor cocktail (Thermo Fisher Scientific, 78442). Protein quantification was performed using Pierce BCA Protein Assay (Life Technologies). Equal amounts of each lysate were loaded and separated on a 8% SDS-PAGE gel and transferred to PVDF membrane. All primary antibodies were diluted in TBS containing 0.05% Tween-20 were incubated overnight. After three washes with TBS-T, secondary antibodies were incubated for 1 h. The ECL (Enhanced ChemiLuminescence solution) (Lugen LGW-P1001, Korea) was dropped on the membrane and exposed to X-ray film (Agfa, Japan).
Affinity purification TMT LC-MS3 mass spectrometry
HEK293T cells were seeded into 15 cm plates and cells were transiently transfected with 8 μg of pNTM-FLAG-CRBN construct using lipofectamine 2000. 30 h post transfection, cells were co-treated for 5 h with 0.1 μM bortezomib and 1 μM of either SK-3–91, DB0646, SB1-G-187, WH-10417099 in biological triplicates or pomalidomide or DMSO control in biological duplicates. Cells were harvested with non-enzymatic CellStripper Dissociation reagent (Corning), followed by three washes with cold PBS and snap freezing. Cell lysis was performed by the addition of IP lysis buffer (50 mM Tris, pH 7.5, 0.5% NP-40, 1 mM EDTA, 10% glycerol and 200 mM NaCl) containing protease inhibitor cocktail (cOmplete) and relevant co-treatment (above), followed by end-over-end rotation at 4 °C for 3 h. Lysate was clarified by centrifugation and salt concentration diluted to 100 mM NaCl with the addition of 0 mM NaCl lysis buffer (containing protease inhibitors and 1 μM of relevant compounds to retain ternary complexes throughout binding). Lysate was added to 20 μL of pre-washed anti-FLAG M2 magnetic bead slurry (Millipore Sigma) and incubated with end-over-end rotation at 4 °C overnight. Beads were washed six times with 100 mM NaCl lysis buffer containing 1 μM of relevant degraders to retain ternary complexes throughout wash steps. Proteins were eluted in a two-step elution with the addition of 0.1 M Glycine hydrochloride (Millipore Sigma) and elution buffered to pH 8.5 using 200 mM Tris buffer, pH 8.5.
Protein eluates were reduced, alkylated and precipitated using methanol/chloroform as previously described (Donovan et al., 2018) and the resulting washed precipitated protein was allowed to air dry. Protein pellets were resuspended in 50 μL of EPPs pH 8 and first digested with 2 μg LysC for 12 h at room temperature (RT), followed by 1 jg of trypsin for 6 h at 37 °C. Tandem mass tag (TMT) reagents (Thermo Fisher Scientific) were dissolved in anhydrous acetonitrile (ACN) according to manufacturer’s instructions. Anhydrous ACN was added to each peptide sample to a final concentration of 30% v/v, and labeling was induced with the addition of 4 μL of TMT reagent to each sample. The 16-plex labeling reactions were performed for 1 h at RT and the reaction quenched by the addition of hydroxylamine to a final concentration of 0.3% for 15 minutes at RT. Each of the sample channels were combined in a 1:1 ratio, desalted using C18 solid phase extraction plates (SOLA, Thermo Fisher Scientific) and analyzed by LC-MS.
Sample preparation TMT LC-MS3 mass spectrometry
Cells were treated with DMSO (biological triplicate) or degrader at indicated dose and time (Table S1) and cells were harvested by centrifugation. Lysis buffer (8 M Urea, 50 mM NaCl, 50 mM 4-(2-hydroxyethyl)-1-piperazineethanesulfonic acid (EPPS) pH 8.5, Protease and Phosphatase inhibitors) was added to the cell pellets and homogenized by 20 passes through a 21-gauge (1.25 in. long) needle to achieve a cell lysate with a protein concentration between 1 – 4 mg/mL. A bradford (Bio-Rad) was used to determine the final protein concentration in the cell lysate. 100 – 200 μg of protein for each sample was reduced, alkylated and precipitated using methanol/chloroform as previously described (Donovan et al., 2018) and the resulting washed precipitated protein was allowed to air dry. Precipitated protein was resuspended in 4 M Urea, 50 mM HEPES pH 7.4, followed by dilution to 1 M urea with the addition of 200 mM EPPS, pH 8. Proteins were first digested with LysC (1:50; enzyme:protein) for 12 h at RT. The LysC digestion was diluted to 0.5 M Urea with 200 mM EPPS pH 8 followed by digestion with trypsin (1:50; enzyme:protein) for 6 h at 37 °C. Tandem mass tag (TMT) reagents (Thermo Fisher Scientific) were dissolved in anhydrous acetonitrile (ACN) according to manufacturer’s instructions. Anhydrous ACN was added to each peptide sample to a final concentration of 30% v/v, and labeling was induced with the addition of TMT reagent to each sample at a ratio of 1:4 peptide:TMT label. The 10, 11 or 16-plex labeling reactions were performed for 1.5 h at RT and the reaction quenched by the addition of hydroxylamine to a final concentration of 0.3% for 15 minutes at RT. Each of the sample channels were combined in a 1:1 ratio, desalted using C18 solid phase extraction cartridges (Waters) and analyzed by LC-MS for channel ratio comparison. Samples were then combined using the adjusted volumes determined in the channel ratio analysis and dried down in a speed vacuum. The combined sample was then resuspended in 1% formic acid and acidified (pH 2 – 3) before being subjected to desalting with C18 SPE (Sep-Pak, Waters). Samples were then offline fractionated into 96 fractions by high pH reverse-phase HPLC (Agilent LC1260) through an aeris peptide xb-c18 column (phenomenex) with mobile phase A containing 5% acetonitrile and 10 mM NH4HCO3 in LC-MS grade H2O, and mobile phase B containing 90% acetonitrile and 10 mM NH4HCO3 in LC-MS grade H2O (both pH 8.0). The 96 resulting fractions were then pooled in a non-contiguous manner into 24 fractions and desalted using C18 solid phase extraction plates (SOLA, Thermo Fisher Scientific) followed by subsequent mass spectrometry analysis.
Data were collected using an Orbitrap Fusion Lumos mass spectrometer (Thermo Fisher Scientific, San Jose, CA, USA) coupled with a Proxeon EASY-nLC 1200 LC pump (Thermo Fisher Scientific) or an Orbitrap Eclipse Tribrid mass spectrometer (Thermo Fisher Scientific, San Jose, CA, USA) coupled with an UltiMate 3000 RSLCnano System. Peptides were separated on an EasySpray ES803a/ES803a.rev2 75 μm inner diameter microcapillary column (Thermo Fisher Scientific) or a 100 μm inner diameter microcapillary column packed with ~ 50 cm of Accucore C18 resin (2.6 μM, 100 Å, Thermo Fisher Scientific). Peptides were separated using a 190 min gradient of 6 – 27% acetonitrile in 1.0% formic acid with a flow rate of 350 nL/min.
Each analysis used a MS3-based TMT method as described previously (McAlister et al., 2014). The data were acquired using a mass range of m/z 340 – 1350, resolution 120,000, AGC target 5 × 10⁵, maximum injection time 100 ms, dynamic exclusion of 120 seconds for the peptide measurements in the Orbitrap. Data dependent MS2 spectra were acquired in the ion trap with a normalized collision energy (NCE) set at 35%, AGC target set to 1.8 × 10⁴ and a maximum injection time of 120 ms. MS3 scans were acquired in the Orbitrap with HCD collision energy set to 55%, AGC target set to 2 × 10⁵, maximum injection time of 150 ms, resolution at 50,000 and with a maximum synchronous precursor selection (SPS) precursors set to 10.
LC-MS data analysis
Proteome Discoverer 2.1, 2.2 or 2.4 (Thermo Fisher Scientific) was used for .RAW file processing and controlling peptide and protein level false discovery rates, assembling proteins from peptides, and protein quantification from peptides. MS/MS spectra were searched against a Uniprot human database (September 2016 or December 2019) with both the forward and reverse sequences as well as known contaminants such as human keratins. Database search criteria were as follows: tryptic with two missed cleavages, a precursor mass tolerance of 20 ppm, fragment ion mass tolerance of 0.6 Da, static alkylation of cysteine (57.02146 Da), static TMT labelling of lysine residues and N-termini of peptides (229.16293 Da), and variable oxidation of methionine (15.99491 Da).
QUANTIFICATION AND STATISTICAL ANALYSIS
Global proteomics datasets
This manuscript contains data from 50 independent multiplexed (10, 11, and 16plex) global mass spectrometry experiments. Each experiment was fractionated and included LC/MS analysis of 24 fractions to maximize proteome coverage. Throughout the manuscript we refer to the ‘degradable kinome database’, which contains a subset of the 50 multiplexed experiments. In this database we only include degrader treatments that we believe best represents direct degrader-induced target degradation (excluded treatments of > 8 h and treatments that induced transcriptional collapse to reduce misinterpretation of cellular stress and secondary effects as direct targets). We included 155 degrader treated samples in this database and the remaining treatments/samples presented in the manuscript were used to probe various other aspects of TPD, e.g., requirement of p97 for degradation or time course of target degradation (Table S1). We combined the results of all treatments into one excel sheet (Table S3). Each independent multiplexed experiment contained three biological replicates of DMSO control treatments and the number of biological replicates for each sample treatment is listed in Table S1.
Protein quantification
For quantification, TMT reporter ion intensities were measured using a 0.003 Da window around the theoretical m/z value for each reporter ion in the MS3 scan and the maximum intensity peak nearest to the theoretical m/z was used for quantification. Following the manufacturer’s specifications, the reporter ion intensities were adjusted to correct for the isotopic impurities of each different TMT reagent set. Peptide spectral matches with poor quality MS3 spectra were excluded from quantitation (summed signal-to-noise across channels < 100 (Whole Proteome) or < 50 (Affinity Purification) and precursor isolation specificity < 0.5), and resulting data was filtered to only include proteins that had a minimum of 2 unique peptides quantified. Reporter ion intensities were normalized and scaled using in-house scripts in the R framework (R Development Core Team, 2014). Significant changes comparing the relative protein abundance of treatment samples to the DMSO control treatments were assessed by moderated t-test as implemented in the limma package within the R framework (Ritchie et al., 2015). A protein was considered a ‘hit’ if it met our pre-determined ‘hit’ threshold of P-value < 0.01 and fold change > 1.25.
Supplementary Material
Scatterplots depicting the fold change in relative abundance comparing treatment to DMSO control determined using global proteomics. Log2 FC is displayed on the y-axis and negative log10 P-value on the x-axis. Scatterplots for all 155 treatments can be found in a separate PDF “Figure S1 - all volcano plots”. Left. All proteins determined to be hits are colored orange and labeled. Right. All quantified protein kinases determined to be hits colored orange and labeled. Significant changes were assessed by moderated t-test as implemented in the limma package (Ritchie et al., 2015). Data are from n = 1–3 biologically independent samples.
Table S1 | Related to Figure 1. Composition, treatment details and kinase targets for the library of kinase degraders profiled in this study. Meta-data for compounds included in the degradable kinome dataset including: compound names, chemical structures, recruited ligase, linker category, kinase binder, reported target of binder utilized, reported binding mode, SMILES strings provided, clogP and treatment details.
Table S2 | Related to Figure 1. Kinases quantified in each multiplexed experiment and quantification of the normalized relative protein expression levels of kinases in MOLT-4, KELLY and HEK293T cells. Cell line expression data are presented as the means ± s.d of n = 2 biological replicates.
Table S3 | Related to Figure 1. Degradable kinome database. Log2 Fold Change and P-value for kinases in response to each of the 155 treatments included in the degradable kinome database (page one) as well as additional treatments included in this manuscript.
Table S4 | Related to Figures 1–2. The detection, degradation frequency and compound hits with protein abundance fold change and P-values for protein kinases, extended kinome kinases, understudied kinases, pseudo kinases and lipid kinases detected and degraded in this study.
Table S5 | Related to Figures 1–2. Kinases targeted by heterobifunctional degraders reported in the literature, either through multitargeted approaches or focused target-specific efforts. Source: NCBI PubMed, updated as of August 2020.
Table S6 | Related to Figures 3–4. KiNativ and AP-MS cellular engagement experiments. KiNativ cellular target engagement in MOLT-4 CRBN −/− cells treated for 5 h with either DMSO or 1 μM SK-3–91, DB0646, SB1-G-187 or WH-10417–099. Data are presented as the mean of n = 2 technical replicates. AP-MS data measuring ternary complex formation upon treatment of HEK293T cells expressing Flag-CRBN with either DMSO or 1 μM SK-3–91, DB0646, SB1-G-187 or WH-10417–099 for 5 h, followed by immunoprecipitation with anti-Flag.
Table S7 | Related to Figures 1–2. RNA-sequencing dataset. Normalized and scaled data for MOLT-4 cells treated in n = 4 biological replicates with DMSO or 1 μM of SK-3–91 for 1, 4, and 8 h.
Table S8 | Related to Figure 4. Compound hits and degradation frequencies for all kinases quantified in selected portions of this study: unique compounds - corrected kinase degradability scores based on single treatment per unique compound, or MOLT-4 cells – including only treatments in MOLT-4 cells.
Table S9 | Related to Figure 5. Physicochemical properties and kinase E3 ligase preferences of matched molecular pairs of degrader molecules recruiting CRBN or VHL. Related to Figure 5A.
Table S10 | Related to Figure 6. Proteomics data for CRBN-based degrader linker analysis. Related to Figure 7.
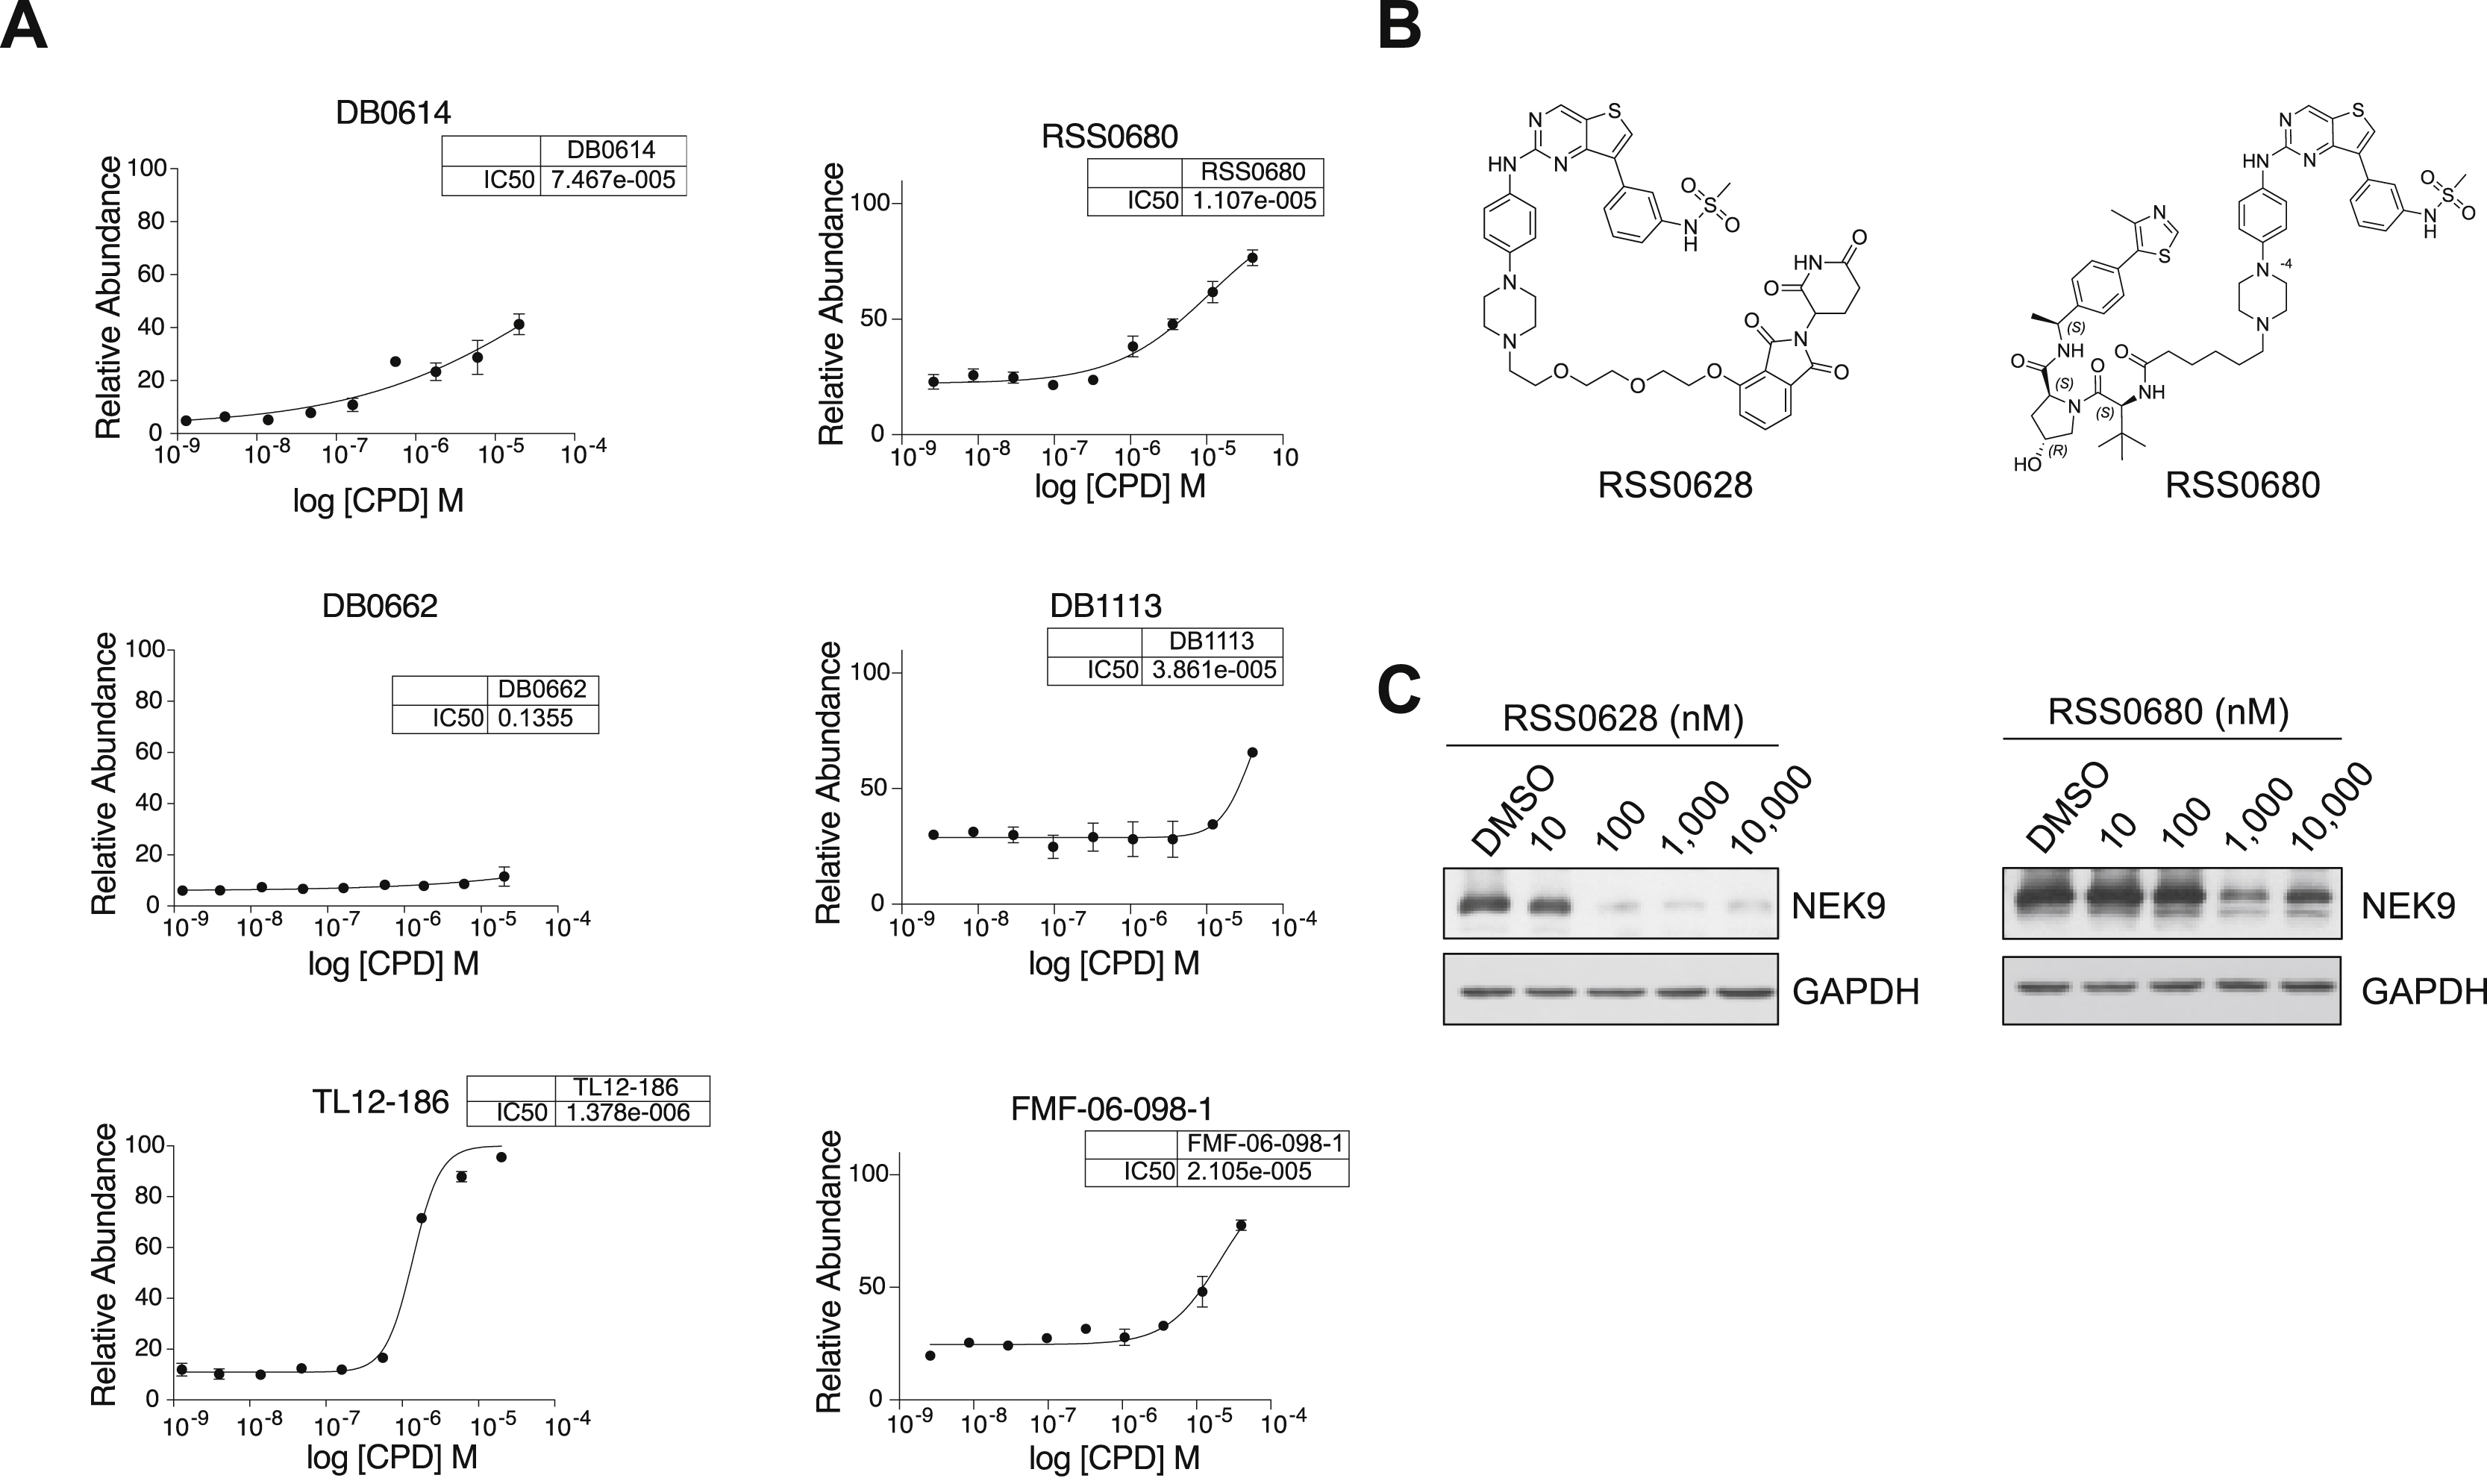
(A) Intracellular ligase engagement assay. BRD4BD2-GFP reporter cells were treated with increasing concentration of lenalidomide or indicated compound for 5 h in the presence of dBET6 (CRBN) or ATI (VHL). Relative abundance of BRD4BD2-GFP was measured by FACS. Data are represented as means ± s.d of n = 3 biologically independent replicates. (B) Chemical structures of RSS0628 and RSS0680. (C) Immunoblot analysis of MOLT-4 cells treated with RSS0628 or RSS0680 at the indicated dose for 4 h. Data representative of n = 2 independent experiments.
(A) Scatterplot depicting the fold change in relative abundance following a 5 h treatment of MOLT-4 cells with 1 μM of the indicated compounds with (blue) and without (orange) co-treatment with 5 μM of CB-5083, a p97 inhibitor. (B) As in A.
(A) Rank order plot showing the ranked relative abundance ratios of enriched proteins in FLAG-CRBN AP-MS experiments from HEK293T cells co-treated with proteasome inhibitor and 1 μM of Pomalidomide for 5 h. Data are from n = 2 biologically independent samples. (B) Heatmap comparing the relative fold change in protein abundance of protein kinases enriched by the presence of indicated degraders in AP-MS experiments. (C) Table summarizing the number of protein kinases quantified and degraded in response to treatment with indicated compounds (1 μM, 5 h) in MOLT-4, KELLY and HEK293T cells. (D) Kinome wide comparison of the fold change in relative abundance and the relative protein abundance of protein kinases in MOLT-4, KELLY and HEK293T cells. (E) Heatmap displaying the log2 FC in protein abundance resulting from MOLT-4 cells treated in a time course (1, 2, 4, 8 and 12 h) with 1 μM SK-3–91, or 1 μM of DB0646. Data are from n = 1 biologically independent treatment samples. (F) Correlation of kinase degradability score and reported protein half-life in listed cell types.
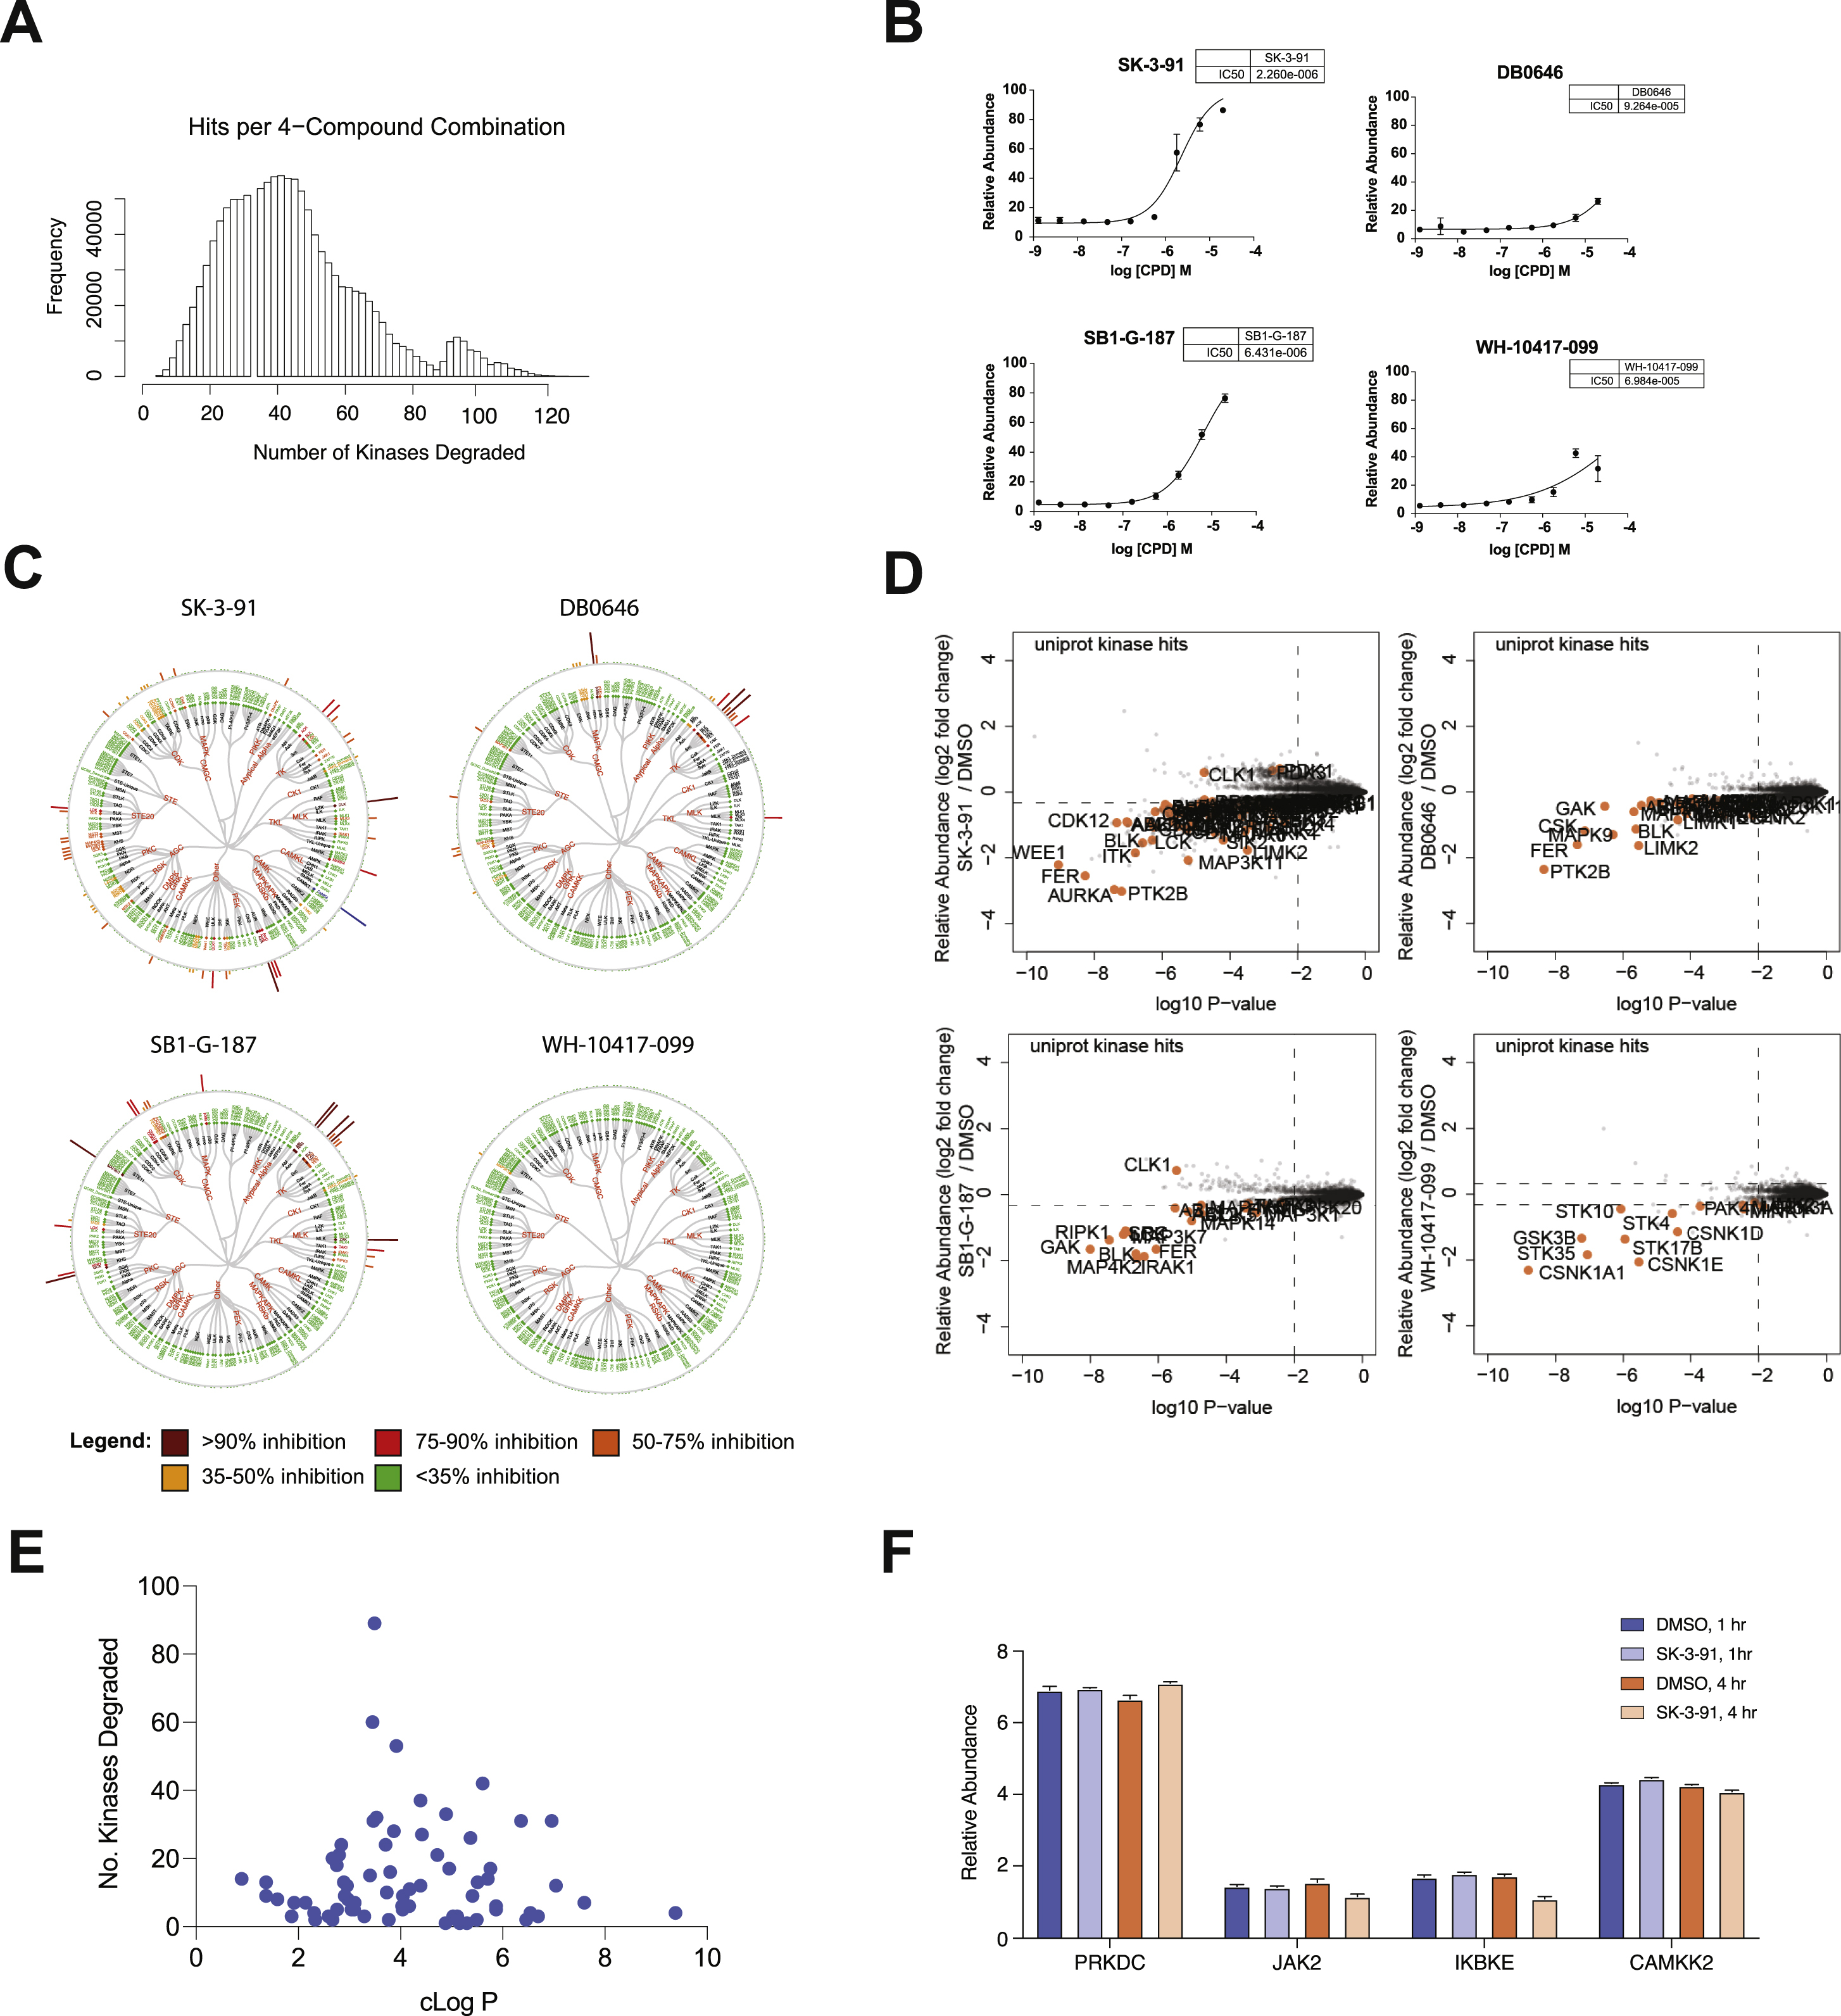
(A) Plot of various 4-degrader combinations and the number of unique protein kinases that can be degraded by that combination. (B) Intracellular CRBN E3 ligase engagement assay. BRD4BD2-GFP reporter cells were treated with increasing concentration of lenalidomide or indicated compounds for 5 h in the presence of dBET6. Relative abundance of BRD4BD2-GFP was measured by FACS. Data are represented as means ± s.d of n = 3 biologically independent replicates. (C) Dendrograms of inhibition of ABPP probe binding for each kinase from MOLT-4 CRBN−/− cells treated with 1 μM of indicated multi-kinase targeting degraders for 5 h. (D) Scatterplots depicting the fold change in relative abundance of following treatment of MOLT-4 cells with 1 μM SK-3–91, DB0646, SB1-G-187 or WH-10417–099 for 5 h. All quantified protein kinases determined to be hits colored orange and labeled. Log2 FC is displayed on the y-axis and negative log10 P-value on the x-axis. Significant changes were assessed by moderated t-test as implemented in the limma package (Ritchie et al., 2015). (E) Scatterplot comparing the cLogP of degrader molecules and the number of kinase degradation targets. cLogP was calculated using CDD. (F) Bar chart showing the relative transcript levels of selected kinases after treatment with DMSO or SK-3–91 (1 and 4 h). Plot depicts replicates presented as means ± s.d of n = 4 biologically independent samples.
(A) Pie chart depicting the proportion of kinases unique to the extended kinome detected in at least one experiment and degraded in at least one compound treatment in this study. Data reported in Tables S4. (B) Heatmap comparing relative abundance of representative kinase transcripts following treatment with DMSO or 1 μM SK-3–91 for the indicated time periods. (C) Mean reads per gene observed by RNA-sequencing analysis of MOLT-4 cells treated with 1 μM SK-3–91 or DMSO for the indicated time periods. Data in B and C are from n = 4 biologically independent samples and associated datasets are provided in Table S7. (D) Plot showing full correlation relationships between kinase degradation frequency, maximum fold change in protein abundance and common knowledge metrics (PDB and PubMed count). (E) Correlation between degradation frequency and common knowledge metrics (PDB and PubMed count) of how well studied a gene of interest is.
KEY RESOURCES TABLE
| REAGENT or RESOURCE | SOURCE | IDENTIFIER |
|---|---|---|
| Critical Commercial Assays | ||
| Tandem Mass Tag (TMT) Reagents | Thermo Fisher Scientific | Cat# A90406 Cat# 4808 Cat# A44520 |
| Pierce BCA Protein Assay Kit | Life Technologies | Cat# 23225 |
| RNeasy Mini Kit | Qiagen | Cat# 74136 |
| KiNativ | ActivX Biosciences | http://www.kinativ.com/ |
| CellTiter-Glo | Promega | Cat# G7570 |
| Chemicals, Peptides, and Recombinant Proteins | ||
| CB-5083 | Med Chem Express | HY-12861 |
| complete, Mini Protease Inhibitor Cocktail | Sigma-Aldrich | Cat# 11836153001 |
| PhosSTOP Phosphatase Inhibitor Tablets | Sigma-Aldrich | Cat# 04906837001 |
| Halt Protease and Phosphatase Inhibitor Single-Use Cocktail | Thermo Fisher Scientific | Cat# 78442 |
| dBET6 | Gray Lab | N/A |
| AT1 | Tocris | Cat# 6356 |
| BRD4BD2-GFP-P2a-mCherry | Fischer Lab Nowak et al. (2018) Nat. Chem. Biol. |
N/A |
| Deposited Data | ||
| wp-esf_016 | This paper | PXD019142 |
| wp-esf_103 | This paper | PXD019143 |
| wp-esf_105 | This paper | PXD019144 |
| wp-esf_107 | This paper | PXD019242 |
| wp-esf_117 | This paper | PXD019168 |
| wp-esf_131 | This paper | PXD019167 |
| wp-esf_133 | This paper | PXD019166 |
| wp-esf_152 | This paper | PXD019164 |
| wp-esf_160 | This paper | PXD019165 |
| wp-esf_168 | This paper | PXD019171 |
| wp-esf_172 | This paper | PXD021255 |
| wp-esf_173 | This paper | PXD021313 |
| wp-esf_195 | This paper | PXD021242 |
| RNA sequencing | This paper | GSE157560 |
| Experimental Models: Cell Lines | ||
| HEK293T (H. sapiens) | ATCC | CRL-11268; RRID: CVCL_0063 |
| MOLT-4 (H. sapiens) | ATCC | CRL-1582; RRID: CVCL_0013 |
| Mino (H. sapiens) | ATCC | CRL-3000; RRID:CVCL_1872 |
| MM1.S (H. sapiens) | ATCC | CRL-2974; RRID:CVCL_8792 |
| OVCAR-8 (H. sapiens) | Gray Lab | RRID:CVCL_1629 |
| KATO III (H. sapiens) | ATCC | HTB-103; RRID:CVCL_0371 |
| KELLY (H. sapiens) | Sigma-Aldrich | 92110411; RRID:CVCL_2092 |
| Recombinant DNA | ||
| pKD214 | This paper | pNTM-Flag-CRBN |
| Software and Algorithms | ||
| Proteome Discoverer 2.1, 2.2, 2.4 | Thermo Fisher Scientific | RRID: SCR_014477 |
| R Framework | Team RCR: A Language and Environment for Statistical Computing | http://www.R-proiect.org/ |
| Statistical Analysis Limma Package (R framework) |
Ritchie et al. (2015) Nucleic Acids Res. |
https://bioconductor.org/packages/release/bioc/html/limma.html |
| GraphPad Prism 8 | http://www.graphpad.com/ | |
| Antibodies | ||
| NEK9 (1:1,000) | Santa Cruz Biotech | Cat# SC-100401 |
| GAPDH (1:5,000) | Cell Signaling | Cat# 5174S; RRID:AB_10622025 |
| GAPDH (1:5,000) | Santa Cruz Biotech | Cat# sc-47724; RRID:AB_627678 |
| AURKA (1:1,000) | Cell Signaling | Cat# D3E4Q; RRID:AB_2665504 |
| Goat anti-Mouse IgG-HRP (1:10,000) | genDEPOT | Cat# SA001-500 |
| Goat anti-Rabbit IgG-HRP (1:10,000) | genDEPOT | Cat# SA002-500 |
| Anti-Flag M2 magnetic beads | Millipore Sigma | Cat# M8823; RRID:AB_2637089 |
Highlights.
A global map of kinase degradability provides chemical leads for > 200 kinases.
Open-access chemical proteomics resource (http://proteomics.fischerlab.org).
Large scale chemical exploration of key variables for targeted protein degradation.
Multi-targeted degraders uncover fundamentals of ubiquitin mediated protein turnover.
ACKNOWLEDGEMENTS
This work was supported by grants from the National Institute of Health; R01CA214608 (E.S.F), R01CA218278 (E.S.F, N.S.G), U24-DK116204 (F.M.F., N.S.G.). E.S.F. is a Damon Runyon-Rachleff Innovator (DRR-50-18). L.T. and K.S. were supported by grants from the China National Natural Science Foundation (21778066) and the Natural Science Foundation of Shanghai, 18JC1420500. T.B.S. was supported by Korea Institute of Science and Technology (2E29260), the KU-KIST Graduate School of Converging Science and Technology Program, and Support for Candidate Development Program (NRF-2016M3A9B5940991) of the National Research Foundation of Korea funded by the Ministry of Science and ICT. We thank Dennis L. Buckley for providing the following compound samples: DB-03-291, ImatinIMiD-2, ImatinIMiD-5, dRAF-3, dFLT-2, dAURK-4 and dAbl-2. We also thank Lyn H. Jones, Milka Kostic and Dennis L. Buckley for critical reading of the manuscript.
DECLARATION OF INTERESTS
N. S. G. is a founder, science advisory board member (SAB) and equity holder in Gatekeeper, Syros, Petra, C4, B2S, Aduro, Jengu, and Soltego (board member). The Gray lab receives or has received research funding from Novartis, Takeda, Astellas, Taiho, Janssen, Kinogen, Voronoi, Her2llc, Deerfield and Sanofi. E. S. F. is a founder, science advisory board member and equity holder in Civetta, Jengu (board member), and Neomorph, an equity holder in C4, and a consultant to Astellas, Novartis, Deerfield, and EcoR1. The Fischer lab receives or has received research funding from Novartis, Astellas, and Deerfield. K.A.D, F.M.F, J.W.B., T.S., E.S.F. and N.S.G. are inventors on a patent application relating to this work owned by DFCI.
Footnotes
ADDITIONAL RESOURCES
Proteomics data generated during this study are also available in our custom online database webtool: http://proteomics.fischerlab.org.
Publisher's Disclaimer: This is a PDF file of an unedited manuscript that has been accepted for publication. As a service to our customers we are providing this early version of the manuscript. The manuscript will undergo copyediting, typesetting, and review of the resulting proof before it is published in its final form. Please note that during the production process errors may be discovered which could affect the content, and all legal disclaimers that apply to the journal pertain.
REFERENCES
- Backus KM, Correia BE, Lum KM, Forli S, Horning BD, González-Páez GE, Chatterjee S, Lanning BR, Teijaro JR, and Olson AJ (2016). Proteome-wide covalent ligand discovery in native biological systems. Nature 534, 570–574. [DOI] [PMC free article] [PubMed] [Google Scholar]
- Becher I, Andrés-Pons A, Romanov N, Stein F, Schramm M, Baudin F, Helm D, Kurzawa N, Mateus A, and Mackmull M-T (2018). Pervasive protein thermal stability variation during the cell cycle. Cell 173, 1495–1507. e1418. [DOI] [PMC free article] [PubMed] [Google Scholar]
- Bingqi T, Mai L, Yi X, Jessica S, John A, Jeffrey M,M, Markus S, Thomas J,M, and Daniel N. (2020). Targeted Protein Degradation via a Covalent Reversible Degrader Based on Bardoxolone. ChemRxiv.
- Bondeson DP, and Crews CM (2017). Targeted protein degradation by small molecules. Annu Rev Pharmacol Toxicol 57, 107–123. [DOI] [PMC free article] [PubMed] [Google Scholar]
- Bondeson DP, Mares A, Smith IE, Ko E, Campos S, Miah AH, Mulholland KE, Routly N, Buckley DL, and Gustafson JL (2015). Catalytic in vivo protein knockdown by small-molecule PROTACs. Nat Chem Biol 11, 611. [DOI] [PMC free article] [PubMed] [Google Scholar]
- Bondeson DP, Smith BE, Burslem GM, Buhimschi AD, Hines J, Jaime-Figueroa S, Wang J, Hamman BD, Ishchenko A, and Crews CM (2018). Lessons in PROTAC Design from Selective Degradation with a Promiscuous Warhead. Cell Chem Biol 25, 78–87.e75. [DOI] [PMC free article] [PubMed] [Google Scholar]
- Botstein D. (2010). Technological innovation leads to fundamental understanding in cell biology. Mol Biol Cell 21, 3791–3792. [DOI] [PMC free article] [PubMed] [Google Scholar]
- Brand M, Jiang B, Bauer S, Donovan KA, Liang Y, Wang ES, Nowak RP, Yuan JC, Zhang T, and Kwiatkowski N. (2019). Homolog-Selective Degradation as a Strategy to Probe the Function of CDK6 in AML. Cell Chem Biol 26, 300–306. e309. [DOI] [PMC free article] [PubMed] [Google Scholar]
- Buckley DL, Van Molle I, Gareiss PC, Tae HS, Michel J, Noblin DJ, Jorgensen WL, Ciulli A, and Crews CM (2012). Targeting the von Hippel-Lindau E3 ubiquitin ligase using small molecules to disrupt the VHL/HIF-1a interaction. J Am Chem Soc 134, 4465–4468. [DOI] [PMC free article] [PubMed] [Google Scholar]
- Burke JE (2018). Structural basis for regulation of phosphoinositide kinases and their involvement in human disease. Mol Cell 71, 653–673. [DOI] [PubMed] [Google Scholar]
- Burslem GM, and Crews CM (2020). Proteolysis-Targeting Chimeras as Therapeutics and Tools for Biological Discovery. Cell. [DOI] [PMC free article] [PubMed]
- Bushman JW, Donovan KA, Schauer NJ, Liu X, Hu W, Varca AC, Buhrlage SJ, and Fischer ES (2020). Proteomics-Based Identification of DUB Substrates Using Selective Inhibitors. Cell Chem Biol 27, 1–10. [DOI] [PMC free article] [PubMed] [Google Scholar]
- Chan K-H, Zengerle M, Testa A, and Ciulli A. (2018). Impact of target warhead and linkage vector on inducing protein degradation: comparison of bromodomain and extra-terminal (BET) degraders derived from triazolodiazepine (JQ1) and tetrahydroquinoline (I-BET726) BET inhibitor scaffolds. J Med Chem 61, 504–513. [DOI] [PMC free article] [PubMed] [Google Scholar]
- Chen H, Chen F, Liu N, Wang X, and Gou S. (2018). Chemically induced degradation of CK2 by proteolysis targeting chimeras based on a ubiquitin-proteasome pathway. Bioorg Chem 81, 536–544. [DOI] [PubMed] [Google Scholar]
- Churcher IA-O (2019). Protac-Induced Protein Degradation in Drug Discovery: Breaking the Rules or Just Making New Ones? [DOI] [PubMed]
- Cromm PM, Samarasinghe KTG, Hines J, and Crews CM (2018). Addressing Kinase-Independent Functions of Fak via PROTAC-Mediated Degradation. J Am Chem Soc. [DOI] [PubMed]
- Davis MI, Hunt JP, Herrgard S, Ciceri P, Wodicka LM, Pallares G, Hocker M, Treiber DK, and Zarrinkar PP (2011). Comprehensive analysis of kinase inhibitor selectivity. Nat Biotechnol 29, 1046–1051. [DOI] [PubMed] [Google Scholar]
- Dobrovolsky D, Wang ES, Morrow S, Leahy C, Faust T, Nowak RP, Donovan KA, Yang G, Li Z, and Fischer ES (2019). Bruton tyrosine kinase degradation as a therapeutic strategy for cancer. Blood 133, 952–961. [DOI] [PMC free article] [PubMed] [Google Scholar]
- Donovan KA, An J, Nowak RP, Yuan JC, Fink EC, Berry BC, Ebert BL, and Fischer ES (2018). Thalidomide promotes degradation of SALL4, a transcription factor implicated in Duane Radial Ray syndrome. eLife 7. [DOI] [PMC free article] [PubMed] [Google Scholar]
- Douglass EF Jr, Miller CJ, Sparer G, Shapiro H, and Spiegel DA (2013). A comprehensive mathematical model for three-body binding equilibria. J Am Chem Soc 135, 6092–6099. [DOI] [PMC free article] [PubMed] [Google Scholar]
- Dunham WH, Mullin M, and Gingras AC (2012). Affinity-purification coupled to mass spectrometry: Basic principles and strategies. Proteomics 12, 1576–1590. [DOI] [PubMed] [Google Scholar]
- Farnaby W, Koegl M, Roy MJ, Whitworth C, Diers E, Trainor N, Zollman D, Steurer S, Karolyi-Oezguer J, and Riedmueller C. (2019). BAF complex vulnerabilities in cancer demonstrated via structure-based PROTAC design. Nat Chem Biol 15, 672–680. [DOI] [PMC free article] [PubMed] [Google Scholar]
- Gadd MS, Testa A, Lucas X, Chan K-H, Chen W, Lamont DJ, Zengerle M, and Ciulli A. (2017). Structural basis of PROTAC cooperative recognition for selective protein degradation. Nat Chem Biol 13, 514. [DOI] [PMC free article] [PubMed] [Google Scholar]
- Gaidatzis D, Lerch A, Hahne F, and Stadler MB (2015). QuasR: quantification and annotation of short reads in R. Bioinformatics 31, 1130–1132. [DOI] [PMC free article] [PubMed] [Google Scholar]
- Galdeano C, Gadd MS, Soares P, Scaffidi S, Van Molle I, Birced I, Hewitt S, Dias DM, and Ciulli A. (2014). Structure-guided design and optimization of small molecules targeting the protein-protein interaction between the von Hippel-Lindau (VHL) E3 ubiquitin ligase and the hypoxia inducible factor (HIF) alpha subunit with in vitro nanomolar affinities. J Med Chem 57, 8657–8663. [DOI] [PMC free article] [PubMed] [Google Scholar]
- Gao P, Hu M-M, and Shu H-B (2020). CSK promotes innate immune response to DNA virus by phosphorylating MITA. Biochemical and biophysical research communications. [DOI] [PubMed]
- Gasic IA-O, Groendyke BA-O, Nowak RA-O, Yuan JC, Kalabathula J, Fischer EA-O, Gray NS, and Mitchison TJ (2020). Tubulin Resists Degradation by Cereblon-Recruiting PROTACs. Cells. [DOI] [PMC free article] [PubMed]
- Hacker SM, Backus KM, Lazear MR, Forli S, Correia BE, and Cravatt BF (2017). Global profiling of lysine reactivity and ligandability in the human proteome. Nat Chem 9, 1181. [DOI] [PMC free article] [PubMed] [Google Scholar]
- Hines J, Lartigue S, Dong H, Qian Y, and Crews CM (2019). MDM2-recruiting PROTAC offers superior, synergistic antiproliferative activity via simultaneous degradation of BRD4 and stabilization of p53. Cancer Res 79, 251–262. [DOI] [PMC free article] [PubMed] [Google Scholar]
- Huang HT, Dobrovolsky D, Paulk J, Yang G, Weisberg EL, Doctor ZM, Buckley DL, Cho JH, Ko E, Jang J, et al. (2018). A Chemoproteomic Approach to Query the Degradable Kinome Using a Multi-kinase Degrader. Cell Chem Biol 25, 88–99.e86. [DOI] [PMC free article] [PubMed] [Google Scholar]
- Ito T, Ando H, Suzuki T, Ogura T, Hotta K, Imamura Y, Yamaguchi Y, and Handa H. (2010). Identification of a primary target of thalidomide teratogenicity. Science 327, 1345–1350. [DOI] [PubMed] [Google Scholar]
- Jiang B, Wang ES, Donovan KA, Liang Y, Fischer ES, Zhang T, and Gray NS (2019). Development of dual and selective degraders of cyclin-dependent kinases 4 and 6. Angew Chem Int Ed Engl 58, 6321–6326. [DOI] [PMC free article] [PubMed] [Google Scholar]
- Karaman MW, Herrgard S, Treiber DK, Gallant P, Atteridge CE, Campbell BT, Chan KW, Ciceri P, Davis MI, and Edeen PT (2008). A quantitative analysis of kinase inhibitor selectivity. Nat Biotechnol 26, 127–132. [DOI] [PubMed] [Google Scholar]
- Klaeger SA-O, Heinzlmeir SA-O, Wilhelm MA-O, Polzer H, Vick BA-O, Koenig PA-O, Reinecke M, Ruprecht B, Petzoldt S, Meng C, et al. (2017). The target landscape of clinical kinase drugs. Science. [DOI] [PMC free article] [PubMed]
- Knight ZA, Lin H, and Shokat KM (2010). Targeting the cancer kinome through polypharmacology. Nat Rev Cancer 10, 130–137. [DOI] [PMC free article] [PubMed] [Google Scholar]
- Kostic M, and Jones LH (2020). Critical Assessment of Targeted Protein Degradation as a Research Tool and Pharmacological Modality. Trends in Pharmacological Sciences. [DOI] [PMC free article] [PubMed]
- Kronke J, Udeshi ND, Narla A, Grauman P, Hurst SN, McConkey M, Svinkina T, Heckl D, Comer E, Li X, et al. (2014). Lenalidomide causes selective degradation of IKZF1 and IKZF3 in multiple myeloma cells. Science 343, 301–305. [DOI] [PMC free article] [PubMed] [Google Scholar]
- Lai AC, Toure M, Hellerschmied D, Salami J, Jaime-Figueroa S, Ko E, Hines J, and Crews CM (2016). Modular PROTAC design for the degradation of oncogenic BCR-ABL. Angew Chem Int Ed Engl 55, 807–810. [DOI] [PMC free article] [PubMed] [Google Scholar]
- Lebraud H, and Heightman TD (2017). Protein degradation: a validated therapeutic strategy with exciting prospects. Essays Biochem 61, 517–527. [DOI] [PubMed] [Google Scholar]
- Li W, Gao C, Zhao L, Yuan Z, Chen Y, and Jiang Y. (2018). Phthalimide conjugations for the degradation of oncogenic PI3K. Eur J Med Chem 151, 237–247. [DOI] [PubMed] [Google Scholar]
- Li Z, Pinch BJ, Olson CM, Donovan KA, Nowak RP, Mills CE, Scott DA, Doctor ZM, Eleuteri NA, and Chung M. (2019). Development and Characterization of a Wee1 Kinase Degrader. Cell Chem Biol. [DOI] [PMC free article] [PubMed]
- Lipinski CA, Lombardo F, Dominy BW, and Feeney PJ (1997). Experimental and computational approaches to estimate solubility and permeability in drug discovery and development settings. Adv Drug Deliv Rev 23, 3–25. [DOI] [PubMed] [Google Scholar]
- Lu J, Qian Y, Altieri M, Dong H, Wang J, Raina K, Hines J, Winkler JD, Crew AP, Coleman K, et al. (2015). Hijacking the E3 Ubiquitin Ligase Cereblon to Efficiently Target BRD4. Chem Biol 22, 755–763. [DOI] [PMC free article] [PubMed] [Google Scholar]
- Lu M, Liu T, Jiao Q, Ji J, Tao M, Liu Y, You Q, and Jiang Z. (2018). Discovery of a Keap1-dependent peptide PROTAC to knockdown Tau by ubiquitination-proteasome degradation pathway. Eur J Med Chem 146, 251–259. [DOI] [PubMed] [Google Scholar]
- Manning G, Whyte DB, Martinez R, Hunter T, and Sudarsanam S. (2002). The protein kinase complement of the human genome. Science 298, 1912–1934. [DOI] [PubMed] [Google Scholar]
- Mathieson T, Franken H, Kosinski J, Kurzawa N, Zinn N, Sweetman G, Poeckel D, Ratnu VS, Schramm M, and Becher I. (2018). Systematic analysis of protein turnover in primary cells. Nat Commun 9, 1–10. [DOI] [PMC free article] [PubMed] [Google Scholar]
- McAlister GC, Nusinow DP, Jedrychowski MP, Wuhr M, Huttlin EL, Erickson BK, Rad R, Haas W, and Gygi SP (2014). MultiNotch MS3 enables accurate, sensitive, and multiplexed detection of differential expression across cancer cell line proteomes. Anal Chem 86, 7150–7158. [DOI] [PMC free article] [PubMed] [Google Scholar]
- Moret N, Liu C, Gyori BM, Bachman JA, Steppi A, Taujale R, Huang L-C, Hug C, Berginski M, Gomez S, et al. (2020). Exploring the understudied human kinome for research and therapeutic opportunities. bioRxiv, 2020.2004.2002.022277. [Google Scholar]
- Neklesa TK, Winkler JD, and Crews CM (2017). Targeted protein degradation by PROTACs. Pharmacol Ther 174, 138–144. [DOI] [PubMed] [Google Scholar]
- Nowak RP, DeAngelo SL, Buckley D, He Z, Donovan KA, An J, Safaee N, Jedrychowski MP, Ponthier CM, Ishoey M, et al. (2018). Plasticity in binding confers selectivity in ligand-induced protein degradation. Nat Chem Biol 14, 706–714. [DOI] [PMC free article] [PubMed] [Google Scholar]
- Ohoka N, Okuhira K, Ito M, Nagai K, Shibata N, Hattori T, Ujikawa O, Shimokawa K, Sano O, and Koyama R. (2017). In vivo knockdown of pathogenic proteins via specific and nongenetic inhibitor of apoptosis protein (IAP)-dependent protein erasers (SNIPERs). J Biol Chem 292, 4556–4570. [DOI] [PMC free article] [PubMed] [Google Scholar]
- Okuhira K, Ohoka N, Sai K, Nishimaki-Mogami T, Itoh Y, Ishikawa M, Hashimoto Y, and Naito M. (2011). Specific degradation of CRABP-II via cIAP1-mediated ubiquitylation induced by hybrid molecules that crosslink cIAP1 and the target protein. FEBS lett 585, 1147–1152. [DOI] [PubMed] [Google Scholar]
- Olson CM, Jiang B, Erb MA, Liang Y, Doctor ZM, Zhang Z, Zhang T, Kwiatkowski N, Boukhali M, and Green JL (2018). Pharmacological perturbation of CDK9 using selective CDK9 inhibition or degradation. Nat Chem Biol 14, 163. [DOI] [PMC free article] [PubMed] [Google Scholar]
- Oprea TI, Bologa CG, Brunak S, Campbell A, Gan GN, Gaulton A, Gomez SM, Guha R, Hersey A, Holmes J, et al. (2018). Unexplored therapeutic opportunities in the human genome. Nat Rev Drug Discov 17, 317–332. [DOI] [PMC free article] [PubMed] [Google Scholar]
- Paiva S-L, and Crews CM (2019). Targeted protein degradation: elements of PROTAC design. Curr Opin Chem Biol 50, 111–119. [DOI] [PMC free article] [PubMed] [Google Scholar]
- Patricelli MP, Szardenings AK, Liyanage M, Nomanbhoy TK, Wu M, Weissig H, Aban A, Chun D, Tanner S, and Kozarich JW (2007). Functional interrogation of the kinome using nucleotide acyl phosphates. Biochemistry 46, 350–358. [DOI] [PubMed] [Google Scholar]
- Pletscher-Frankild S, Palleja A, Tsafou K, Binder JX, and Jensen LJ (2015). DISEASES: Text mining and data integration of disease-gene associations. Methods 74, 83–89. [DOI] [PubMed] [Google Scholar]
- Powell CE, Gao Y, Tan L, Donovan KA, Nowak RP, Loehr A, Bahcall M, Fischer DS, Janne PA, George RE, et al. (2018). Chemically Induced Degradation of Anaplastic Lymphoma Kinase (ALK). J Med Chem 61, 4249–4255. [DOI] [PMC free article] [PubMed] [Google Scholar]
- R Development Core Team (2014). R: A language and environment for statistical computing. (R Foundation for Statistical Computing; ). [Google Scholar]
- Raina K, Lu J, Qian Y, Altieri M, Gordon D, Rossi AM, Wang J, Chen X, Dong H, Siu K, et al. (2016). PROTAC-induced BET protein degradation as a therapy for castration-resistant prostate cancer. Proc Natl Acad Sci U S A 113, 7124–7129. [DOI] [PMC free article] [PubMed] [Google Scholar]
- Ramadan K, Bruderer R, Spiga FM, Popp O, Baur T, Gotta M, and Meyer HH (2007). Cdc48/p97 promotes reformation of the nucleus by extracting the kinase Aurora B from chromatin. Nature 450, 1258–1262. [DOI] [PubMed] [Google Scholar]
- Rheault TR, Stellwagen JC, Adjabeng GM, Hornberger KR, Petrov KG, Waterson AG, Dickerson SH, Mook RA Jr, Laquerre SG, and King AJ (2013). Discovery of dabrafenib: a selective inhibitor of Raf kinases with antitumor activity against B-Raf-driven tumors. ACS Med Chem Lett 4, 358–362. [DOI] [PMC free article] [PubMed] [Google Scholar]
- Ritchie ME, Phipson B, Wu D, Hu Y, Law CW, Shi W, and Smyth GK (2015). limma powers differential expression analyses for RNA-sequencing and microarray studies. Nucleic Acids Res 43, e47. [DOI] [PMC free article] [PubMed] [Google Scholar]
- Robinson MD, McCarthy DJ, and Smyth GK (2010). edgeR: a Bioconductor package for differential expression analysis of digital gene expression data. Bioinformatics 26, 139–140. [DOI] [PMC free article] [PubMed] [Google Scholar]
- Rodgers G, Austin C, Anderson J, Pawlyk A, Colvis C, Margolis R, and Baker J. (2018). Glimmers in illuminating the druggable genome. Nat Rev Drug Discov 17, 301–302. [DOI] [PMC free article] [PubMed] [Google Scholar]
- Roskoski R Jr (2019). Properties of FDA-approved small molecule protein kinase inhibitors: a 2020 update. Pharmacol Res, 104609. [DOI] [PubMed]
- Roskoski R. (2019). Properties of FDA-approved small molecule protein kinase inhibitors. Pharmacol Res. [DOI] [PubMed]
- Roy MJ, Winkler S, Hughes SJ, Whitworth C, Galant M, Farnaby W, Rumpel K, and Ciulli A. (2019). SPR-measured dissociation kinetics of PROTAC ternary complexes influence target degradation rate. ACS Chem Biol 14, 361–368. [DOI] [PMC free article] [PubMed] [Google Scholar]
- Russ AP, and Lampel S. (2005). The druggable genome: an update. Drug Discov Today 10, 1607–1610. [DOI] [PubMed] [Google Scholar]
- Sakamoto KM, Kim KB, Kumagai A, Mercurio F, Crews CM, and Deshaies RJ (2001). Protacs: chimeric molecules that target proteins to the Skp1-Cullin-F box complex for ubiquitination and degradation. Proc Natl Acad Sci U S A 98, 8554–8559. [DOI] [PMC free article] [PubMed] [Google Scholar]
- Shcherbik N, and Haines DS (2007). Cdc48pNpl4p/Ufd1p binds and segregates membrane-anchored/tethered complexes via a polyubiquitin signal present on the anchors. Mol Cell 25, 385–397. [DOI] [PMC free article] [PubMed] [Google Scholar]
- Sievers QL, Petzold G, Bunker RD, Renneville A, Slabicki M, Liddicoat BJ, Abdulrahman W, Mikkelsen T, Ebert BL, and Thoma NH (2018). Defining the human C2H2 zinc finger degrome targeted by thalidomide analogs through CRBN. Science 362. [DOI] [PMC free article] [PubMed] [Google Scholar]
- Silva MC, Ferguson FM, Cai Q, Donovan KA, Nandi G, Patnaik D, Zhang T, Huang H-T, Lucente DE, and Dickerson BC (2019). Targeted degradation of aberrant tau in frontotemporal dementia patient-derived neuronal cell models. eLife 8, e45457. [DOI] [PMC free article] [PubMed] [Google Scholar]
- Simonetta KR, Taygerly J, Boyle K, Basham SE, Padovani C, Lou Y, Cummins TJ, Yung SL, von Soly SK, and Kayser F. (2019). Prospective discovery of small molecule enhancers of an E3 ligase-substrate interaction. Nat Commun 10, 1–12. [DOI] [PMC free article] [PubMed] [Google Scholar]
- Smith BE, Wang SL, Jaime-Figueroa S, Harbin A, Wang J, Hamman BD, and Crews CM (2019). Differential PROTAC substrate specificity dictated by orientation of recruited E3 ligase. Nat Commun 10, 131. [DOI] [PMC free article] [PubMed] [Google Scholar]
- Spradlin JN, Hu X, Ward CC, Brittain SM, Jones MD, Ou L, To M, Proudfoot A, Ornelas E, and Woldegiorgis M. (2019). Harnessing the anti-cancer natural product nimbolide for targeted protein degradation. Nat Chem Biol 15, 747–755. [DOI] [PMC free article] [PubMed] [Google Scholar]
- Testa A, Hughes SJ, Lucas X, Wright JE, and Ciulli A. (2020). Structure-Based Design of a Macrocyclic PROTAC. Angew Chem Int Ed Engl 132, 1744–1751. [DOI] [PMC free article] [PubMed] [Google Scholar]
- Verma R, Oania R, Fang R, Smith GT, and Deshaies RJ (2011). Cdc48/p97 mediates UV-dependent turnover of RNA Pol II. Mol Cell 41, 82–92. [DOI] [PMC free article] [PubMed] [Google Scholar]
- Vukovic S, and Huggins DJ (2018). Quantitative metrics for drug-target ligandability. Drug Discov Today. [DOI] [PubMed] [Google Scholar]
- Ward CC, Kleinman JI, Brittain SM, Lee PS, Chung CYS, Kim K, Petri Y, Thomas JR, Tallarico JA, and McKenna JM (2019). Covalent ligand screening uncovers a RNF4 E3 ligase recruiter for targeted protein degradation applications. ACS Chem Biol 14, 2430–2440. [DOI] [PMC free article] [PubMed] [Google Scholar]
- Winter GE, Buckley DL, Paulk J, Roberts JM, Souza A, Dhe-Paganon S, and Bradner JE (2015). Phthalimide conjugation as a strategy for in vivo target protein degradation. Science 348, 1376–1381. [DOI] [PMC free article] [PubMed] [Google Scholar]
- Wu H, Yang K, Zhang Z, Leisten ED, Li Z, Xie H, Liu J, Smith KA, Novakova Z, and Barinka C. (2019). Development of multifunctional histone deacetylase 6 degraders with potent antimyeloma activity. J Med Chem 62, 7042–7057. [DOI] [PubMed] [Google Scholar]
- Yugandhar K, Gupta S, and Yu H. (2019). Inferring protein-protein interaction networks from mass spectrometry-based proteomic approaches: a mini-review. Computational and Structural Biotechnology Journal 17, 805–811. [DOI] [PMC free article] [PubMed] [Google Scholar]
- Zecha J, Meng C, Zolg DP, Samaras P, Wilhelm M, and Kuster B. (2018). Peptide level turnover measurements enable the study of proteoform dynamics. Mol Cell Proteomics 17, 974–992. [DOI] [PMC free article] [PubMed] [Google Scholar]
- Zeng M, Xiong Y, Safaee N, Nowak RP, Donovan KA, Yuan CJ, Nabet B, Gero TW, Feru F, and Li L. (2019). Exploring Targeted Degradation Strategy for Oncogenic KRASG12C. Cell Chem Biol. [DOI] [PubMed]
- Zengerle M, Chan K-H, and Ciulli A. (2015). Selective small molecule induced degradation of the BET bromodomain protein BRD4. ACS Chem Biol 10, 1770–1777. [DOI] [PMC free article] [PubMed] [Google Scholar]
- Zhang X, Crowley VM, Wucherpfennig TG, Dix MM, and Cravatt BF (2019). Electrophilic PROTACs that degrade nuclear proteins by engaging DCAF16. Nat Chem Biol 15, 737–746. [DOI] [PMC free article] [PubMed] [Google Scholar]
- Zhou F, Chen L, Cao C, Yu J, Luo X, Zhou P, Zhao L, Du W, Cheng J, and Xie Y. (2020). Development of selective mono or dual PROTAC degrader probe of CDK isoforms. European journal of medicinal chemistry 187, 111952. [DOI] [PubMed] [Google Scholar]
- Zorba A, Nguyen C, Xu Y, Starr J, Borzilleri K, Smith J, Zhu H, Farley KA, Ding W, and Schiemer J. (2018). Delineating the role of cooperativity in the design of potent PROTACs for BTK. Proc Natl Acad Sci U S A 115, E7285–E7292. [DOI] [PMC free article] [PubMed] [Google Scholar]
Associated Data
This section collects any data citations, data availability statements, or supplementary materials included in this article.
Supplementary Materials
Scatterplots depicting the fold change in relative abundance comparing treatment to DMSO control determined using global proteomics. Log2 FC is displayed on the y-axis and negative log10 P-value on the x-axis. Scatterplots for all 155 treatments can be found in a separate PDF “Figure S1 - all volcano plots”. Left. All proteins determined to be hits are colored orange and labeled. Right. All quantified protein kinases determined to be hits colored orange and labeled. Significant changes were assessed by moderated t-test as implemented in the limma package (Ritchie et al., 2015). Data are from n = 1–3 biologically independent samples.
Table S1 | Related to Figure 1. Composition, treatment details and kinase targets for the library of kinase degraders profiled in this study. Meta-data for compounds included in the degradable kinome dataset including: compound names, chemical structures, recruited ligase, linker category, kinase binder, reported target of binder utilized, reported binding mode, SMILES strings provided, clogP and treatment details.
Table S2 | Related to Figure 1. Kinases quantified in each multiplexed experiment and quantification of the normalized relative protein expression levels of kinases in MOLT-4, KELLY and HEK293T cells. Cell line expression data are presented as the means ± s.d of n = 2 biological replicates.
Table S3 | Related to Figure 1. Degradable kinome database. Log2 Fold Change and P-value for kinases in response to each of the 155 treatments included in the degradable kinome database (page one) as well as additional treatments included in this manuscript.
Table S4 | Related to Figures 1–2. The detection, degradation frequency and compound hits with protein abundance fold change and P-values for protein kinases, extended kinome kinases, understudied kinases, pseudo kinases and lipid kinases detected and degraded in this study.
Table S5 | Related to Figures 1–2. Kinases targeted by heterobifunctional degraders reported in the literature, either through multitargeted approaches or focused target-specific efforts. Source: NCBI PubMed, updated as of August 2020.
Table S6 | Related to Figures 3–4. KiNativ and AP-MS cellular engagement experiments. KiNativ cellular target engagement in MOLT-4 CRBN −/− cells treated for 5 h with either DMSO or 1 μM SK-3–91, DB0646, SB1-G-187 or WH-10417–099. Data are presented as the mean of n = 2 technical replicates. AP-MS data measuring ternary complex formation upon treatment of HEK293T cells expressing Flag-CRBN with either DMSO or 1 μM SK-3–91, DB0646, SB1-G-187 or WH-10417–099 for 5 h, followed by immunoprecipitation with anti-Flag.
Table S7 | Related to Figures 1–2. RNA-sequencing dataset. Normalized and scaled data for MOLT-4 cells treated in n = 4 biological replicates with DMSO or 1 μM of SK-3–91 for 1, 4, and 8 h.
Table S8 | Related to Figure 4. Compound hits and degradation frequencies for all kinases quantified in selected portions of this study: unique compounds - corrected kinase degradability scores based on single treatment per unique compound, or MOLT-4 cells – including only treatments in MOLT-4 cells.
Table S9 | Related to Figure 5. Physicochemical properties and kinase E3 ligase preferences of matched molecular pairs of degrader molecules recruiting CRBN or VHL. Related to Figure 5A.
Table S10 | Related to Figure 6. Proteomics data for CRBN-based degrader linker analysis. Related to Figure 7.
(A) Intracellular ligase engagement assay. BRD4BD2-GFP reporter cells were treated with increasing concentration of lenalidomide or indicated compound for 5 h in the presence of dBET6 (CRBN) or ATI (VHL). Relative abundance of BRD4BD2-GFP was measured by FACS. Data are represented as means ± s.d of n = 3 biologically independent replicates. (B) Chemical structures of RSS0628 and RSS0680. (C) Immunoblot analysis of MOLT-4 cells treated with RSS0628 or RSS0680 at the indicated dose for 4 h. Data representative of n = 2 independent experiments.
(A) Scatterplot depicting the fold change in relative abundance following a 5 h treatment of MOLT-4 cells with 1 μM of the indicated compounds with (blue) and without (orange) co-treatment with 5 μM of CB-5083, a p97 inhibitor. (B) As in A.
(A) Rank order plot showing the ranked relative abundance ratios of enriched proteins in FLAG-CRBN AP-MS experiments from HEK293T cells co-treated with proteasome inhibitor and 1 μM of Pomalidomide for 5 h. Data are from n = 2 biologically independent samples. (B) Heatmap comparing the relative fold change in protein abundance of protein kinases enriched by the presence of indicated degraders in AP-MS experiments. (C) Table summarizing the number of protein kinases quantified and degraded in response to treatment with indicated compounds (1 μM, 5 h) in MOLT-4, KELLY and HEK293T cells. (D) Kinome wide comparison of the fold change in relative abundance and the relative protein abundance of protein kinases in MOLT-4, KELLY and HEK293T cells. (E) Heatmap displaying the log2 FC in protein abundance resulting from MOLT-4 cells treated in a time course (1, 2, 4, 8 and 12 h) with 1 μM SK-3–91, or 1 μM of DB0646. Data are from n = 1 biologically independent treatment samples. (F) Correlation of kinase degradability score and reported protein half-life in listed cell types.
(A) Plot of various 4-degrader combinations and the number of unique protein kinases that can be degraded by that combination. (B) Intracellular CRBN E3 ligase engagement assay. BRD4BD2-GFP reporter cells were treated with increasing concentration of lenalidomide or indicated compounds for 5 h in the presence of dBET6. Relative abundance of BRD4BD2-GFP was measured by FACS. Data are represented as means ± s.d of n = 3 biologically independent replicates. (C) Dendrograms of inhibition of ABPP probe binding for each kinase from MOLT-4 CRBN−/− cells treated with 1 μM of indicated multi-kinase targeting degraders for 5 h. (D) Scatterplots depicting the fold change in relative abundance of following treatment of MOLT-4 cells with 1 μM SK-3–91, DB0646, SB1-G-187 or WH-10417–099 for 5 h. All quantified protein kinases determined to be hits colored orange and labeled. Log2 FC is displayed on the y-axis and negative log10 P-value on the x-axis. Significant changes were assessed by moderated t-test as implemented in the limma package (Ritchie et al., 2015). (E) Scatterplot comparing the cLogP of degrader molecules and the number of kinase degradation targets. cLogP was calculated using CDD. (F) Bar chart showing the relative transcript levels of selected kinases after treatment with DMSO or SK-3–91 (1 and 4 h). Plot depicts replicates presented as means ± s.d of n = 4 biologically independent samples.
(A) Pie chart depicting the proportion of kinases unique to the extended kinome detected in at least one experiment and degraded in at least one compound treatment in this study. Data reported in Tables S4. (B) Heatmap comparing relative abundance of representative kinase transcripts following treatment with DMSO or 1 μM SK-3–91 for the indicated time periods. (C) Mean reads per gene observed by RNA-sequencing analysis of MOLT-4 cells treated with 1 μM SK-3–91 or DMSO for the indicated time periods. Data in B and C are from n = 4 biologically independent samples and associated datasets are provided in Table S7. (D) Plot showing full correlation relationships between kinase degradation frequency, maximum fold change in protein abundance and common knowledge metrics (PDB and PubMed count). (E) Correlation between degradation frequency and common knowledge metrics (PDB and PubMed count) of how well studied a gene of interest is.
Data Availability Statement
The raw proteomics datasets generated during this study are available at PRIDE accession: PXD019142; PXD019143; PXD019144; PXD019242; PXD019168; PXD019167; PXD019166; PXD019164; PXD019165; PXD019171; PXD021255; PXD021313; PXD021242.
Proteomics data generated during this study are also available in our custom online database webtool: http://proteomics.fischerlab.org.
The RNA sequencing data generated during this study is available at GEO accession: GSE157560.