

Summary
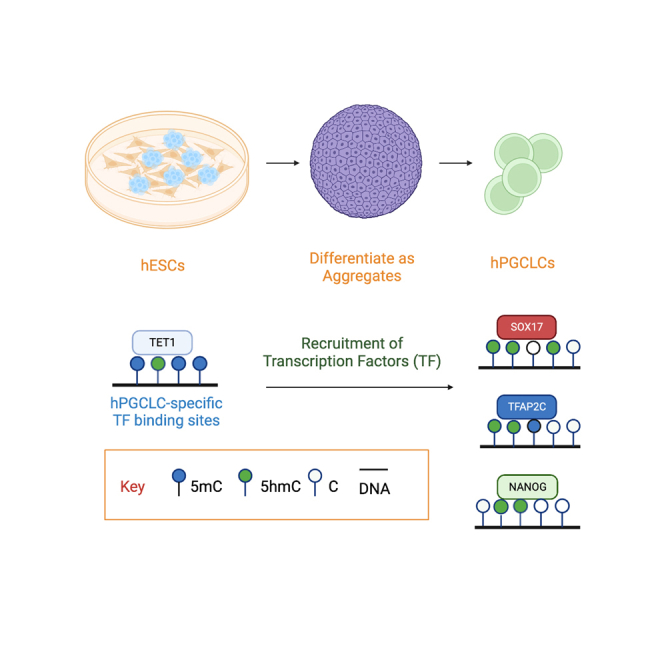
Ten Eleven Translocation 1 (TET1) is a regulator of localized DNA demethylation through the conversion of 5-methylcytosine (5mC) to 5-hydroxymethylcytosine (5hmC). To examine DNA demethylation in human primordial germ cell-like cells (hPGCLCs) induced from human embryonic stem cells (hESCs), we performed bisulfite-assisted APOBEC coupled epigenetic sequencing (bACEseq) followed by integrated genomics analysis. Our data indicates that 5hmC enriches at hPGCLC-specific NANOG, SOX17 or TFAP2C binding sites on hPGCLC induction, and this is accompanied by localized DNA demethylation. Using CRISPR-Cas9, we show that deleting the catalytic domain of TET1 reduces hPGCLC competency when starting with hESC cultured on mouse embryonic fibroblasts, and this phenotype can be rescued after transitioning hESCs to defined media and a recombinant substrate. Taken together, our study demonstrates the importance of 5hmC in facilitating hPGCLC competency, and the role of hESC culture conditions in modulating this effect.
Subject areas: Epigenetics, Developmental biology, Embryology
Graphical abstract
Highlights
-
•
TET1 is enriched in human PGC-like cells (hPGCLCs) with induction from hESCs
-
•
5-hydroxymethyl cytosine (5hmC) is globally elevated in the genome of hPGCLCs
-
•
hPGCLC-specific transcription factor (TF) binding sites enrich with 5hmC
-
•
5hmC enrichment at TF binding sites is accompanied by targeted demethylation
Epigenetics; Developmental biology; Embryology
Introduction
Germ cells carry hereditary information from one generation to the next. Each generation, germ cell progenitors called primordial germ cells (PGCs) are specified in the early post-implantation embryo. Problems with human PGC (hPGC) specification have been proposed to cause human reproductive failure and infertility.1,2,3 Therefore, the cell and molecular events that occur during hPGC specification are important determinants for reproductive health and fertility later in life. Despite an important role for hPGC specification in future reproductive health and reproductive longevity, the genes and pathways involved in hPGC specification are poorly understood.
In post-implantation human embryos, the specification of hPGCs begins at Carnegie Stage 5 (CS5), with hPGC specification predicted to end around CS9.4,5 Acquiring new fundamental knowledge between CS5-CS9 informs research on hPGC specification as well as development of embryonic and extraembryonic tissues critical for establishing successful pregnancies, formation of healthy embryos, and desirable pregnancy outcomes. Recently, a single cell RNA-seq study of an early post-implantation human embryo at Carnegie Stage 7 (CS7) corresponding to 16–19 days post-fertilization was reported.6 This dataset yielded critical transcriptional insights into cells of the early human embryo, and remarkably included the identification of rare hPGCs.6 As predicted from the mouse model, specified hPGCs at CS7 express the conserved PGC-specific gene NANOS3,7 as well as hPGC TFs SOX17 and TFAP2C.8,9 Ape-specific RNAs of the Long Terminal Repeat 5 Human-Specific (LTR5Hs) transposable elements (TEs), also known as TE Enhancers (TEENhancers) were also found to be uniquely expressed in hPGCs at CS7.6,10 Therefore, understanding mechanisms of hPGC specification benefit from studying human cells and tissues, particularly for genes or gene regulatory mechanisms that are not conserved in laboratory model organisms.
Functional studies to model putative mechanisms underlying hPGC specification involve the differentiation of human embryonic stem cells (hESCs) or human induced pluripotent stem cells (hiPSCs) into hPGC-like cells (hPGCLCs) in the presence of Bone morphogenetic protein 4 (BMP4) and other cytokines.8,11,12 Human stem cell-based embryo models that model certain spatiotemporal aspects of CS5 post-implantation human embryo development have revealed that hPGCLC induction occurs around the same time as the amniotic ectoderm is induced in vitro.13 Micropatterned discs, which model events between CS5-6, demonstrate that on induction in the presence of BMP4, hPGCLCs are juxtaposed next to ISL-1+ putative amniotic ectoderm-like cells, and TBXT/EOMES positive primitive-streak like cells.14,15 Pseudotime analysis using 10X Genomics scRNA-seq suggests that the immediate embryonic precursors to hPGCLCs correspond to lineage-primed NANOG+ progenitors, that express early amniotic, trophoblast and gastrulating marker genes such as TFAP2A, CDX2, EOMES, TBX2, and GATA3 which are subsequently repressed at the time of hPGCLC induction by TFs such as TFAP2C.5,9
DNA methylation remodeling, particularly the loss of 5-methylcytosine (5mC) from hPGCs is a conserved feature of mammals including humans,16,17,18 mice19,20 macaques21,22 and porcine species.23,24 Mechanisms involved in DNA methylation remodeling in hPGCs have been studied using the mouse embryo, with replication-coupled loss of 5mC occurring first,25 and expression of ten eleven translocation 1 (TET1) which oxidizes of 5mC to 5-hydroxymethylcytosine (5hmC) occurring next, as PGCs enter the genital ridge.26,27,28 In contrast to mouse embryos, porcine embryos express TET1 at the time of PGC specification, together with enrichment of 5hmC in the PGC genome.24 In human embryos, TET1 expression and 5hmC enrichment have been identified from at least week 4 (∼CS10-13) in hPGCs.17 This suggests that 5hmC and TET1 may have an earlier role in PGC development in porcine and humans, (bilaminar disc shaped embryos), compared to the mouse, which forms an egg-cylinder shaped embryo at the time of PGC specification.
To address the role of 5hmC in hPGC specification, we induced hPGCLCs from hESCs and demonstrated that TET1 is expressed in newly specified hPGCLCs. Using bisulfite-assisted APOBEC-Coupled Epigenetic Sequencing (bACEseq)29,30 to profile 5hmC at base-resolution across the genome of hPGCLCs and hESCs, we identified hPGCLC-specific TF binding sites that are pre-bound by TET1 in undifferentiated hESCs, and on hPGCLC induction, acquire TFAP2C, NANOG and SOX17, while also becoming enriched in 5hmC. LTR5Hs TEENhancers are also bound by TET1 in hESCs and on hPGCLC induction retain 5hmC. To evaluate the role of TET1 we used gene editing approaches with CRISPR/Cas9 to delete part of the catalytic domain of TET1, which leads to hESCs cultured on mouse embryonic fibroblasts (MEFs) loosing germline competency on hPGCLC differentiation.
Results
TET1 protein is enriched in hPGCLCs during in vitro differentiation
There are three TET genes encoded in the human genome, TET1, TET2 and TET3. To determine which of the three TET enzymes are expressed by hPGCLCs, we used the induction of hPGCLCs from hESCs by differentiating MEF-cultured hESCs into incipient mesoderm-like cells (iMeLCs), followed by differentiation of the iMeLCs as three dimensional (3D) aggregates in low adhesion 96-well plates in the presence of BMP4 and other cytokines to generate hPGCLCs (Figure 1A).3,6,11 Using previously published single cell transcriptomes generated with 10X Genomics technology,5 we show that TET1 mRNA is the only member of the TET family expressed at detectable levels in aggregate cells including the hPGCLCs (shown is UCLA1 in Figures 1B and 1C and UCLA2 in Figures S1A and S1B). Therefore, we focused on TET1 for the remainder if this manuscript.
Figure 1.

TET1 protein is enriched in hPGCLCs during in vitro differentiation
(A) hPGCLCs in this study are differentiated from hESCs through an iMeLC intermediate followed by aggregate differentiation in the presence of BMP4 and other cytokines for four days (D). Shown in the main figure are results with UCLA1.
(B) UMAPs of scRNA-seq data from5 showing hESCs, iMeLCs and D1-D4 of aggregate differentiation (n = 34,880 cells displayed).
(C) UMAPs from (B) displaying expression of the pluripotency gene (NANOG), the hPGC/hPGCLC-specific gene (NANOS3), the hPGC/hPGCLC and endoderm gene (SOX17) as well as the TET family mRNAs (TET1, TET2 and TET3). TET1 mRNA is the only TET family member expressed at detectable levels.
(D) Representative immunofluorescence (IF) images showing TET1 protein expression in undifferentiated NANOG positive hESCs (n = 3 replicates). Scale bar, 40μm.
(E) Representative IF images showing TET1 protein expression in NANOG and OCT4 positive cells but not SOX17 positive iMeLCs (n = 3 replicates). Scale bar, 40μm.
(F) Representative IF images showing TET1 protein expression in NANOG+/PRDM1+ hPGCLCs at D4 of aggregate differentiation. PRDM1+ hPGCLCs are also positive for TFAP2C and SOX17 (n = 3 replicates). Scale bar, 40μm.
(G) ChIP-seq and ATACseq at the TET1 locus. The transcription start site (TSS) of full-length TET1 is indicated as (a). A new site (b) becomes bound by NANOG at the TET1 locus in hPGCLCs at D4. Data from.10,31
Next, we verified that TET1 protein expression in NANOG+ hESCs (Figure 1D), and NANOG and OCT4+ iMeLCs (Figure 1E). Notably, the SOX17+ iMeLCs are negative for TET1 protein (Figure 1E). On aggregate formation, we discovered that TET1 protein becomes enriched in NANOG/PRDM1 hPGCLCs by day 4 (D4) (Figures 1F and S1C–S1E). NANOG/PRDM1+ germ cell identity was further confirmed by co-expression of PRDM1 with TFAP2C and SOX17.
To evaluate whether TET1 is expressed in early PGCs in vivo, we examined TET1, TET2 and TET3 expression in hPGCs from a Carnegie stage 7 (CS7) XY human embryo dataset,6 and PGCs from cynomolgus (cy) macaque dataset.22,32 This result shows that TET1 is expressed in hPGCs at CS7, whereas TET2 and TET3 are not (Figure S1F). In cyPGCs, TET1 is the dominant TET family member, being expressed in early and late cyPGCs, with stochastic expression of TET2 and TET3 in some cyPGCs across the embryonic time course (Figure S1G).
To address the regulation of TET1 expression in hESCs and hPGCLCs, we examined chromatin accessibility using Assay for transposase accessible chromatin (ATAC) and chromatin immunoprecipitation (ChIP) sequencing (ChIP-Seq) datasets focusing on the TET1 locus (Figure 1G). Specifically, we examined binding of key TFs that are known to be functionally involved in hPGCLC induction, NANOG,10 TFAP2C,33 SOX17,10 as well as the enhancer/promoter histone modification H3K27ac5,34 and the active promoter histone modification H3K4me3.35 In addition, we examined PRDM1 peaks in hPGCLCs35 and TET1 peaks in hESCs36 (Figure 1G). Analysis of browser tracks reveals that the transcription start site (TSS) of TET1 (denoted as “a” in Figure 1G) is accessible, enriched in H3K27ac, and is bound by TET1, TFAP2C and NANOG (Figure 1G). Analysis of hPGCLC chromatin reveals that on hPGCLC induction, SOX17 and PRDM1 join TFAP2C and NANOG at the TSS of TET1, accompanied by a new peak of NANOG proximal to the TSS at position “b” (Figure 1G). This proximal site b is also bound by TFAP2C and exhibits H3K27ac and H3K4me3 enrichment before and after hPGCLC induction.
RNA-seq of hPGCLCs12 and hPGCs37 shows that this new regulatory site is associated with reads aligning to the untranslated exon 1 of TET1. This result is different from the prediction made in mouse38 where Tet1 expression in mPGCs and mESCs occurs via transcription initiation from exon 1b, whereas in humans, the alternate transcription initiation occurs in hPGCLCs but not hESCs. Taken together, these results suggest that on hPGCLC induction, TET1 is the dominant TET family member expressed by hPGCLCs, hPGCs and cyPGCs. Integrated analysis of chromatin at the TET1 locus reveals that the TET1 promoter becomes bound by the hPGCLC-expressed TFs, SOX17 and PRDM1 at the TSS on hPGCLC induction. We also identified a new putative enhancer/promoter (1b) which becomes bound by NANOG on hPGCLC induction. This is associated with transcription of an alternate untranslated exon at TET1 in hPGCLCs and hPGCs but not hESCs.
5hmC is enriched at the hPGCLC-specific transcription factor binding sites on hPGCLC induction
A major function of TET1 is the oxidation of 5mC to 5hmC,39 where it can serve as a relatively stable epigenetic mark in non-dividing cells, or as an intermediate for active DNA demethylation. To examine 5hmC enrichment in hPGCLCs, we profiled genome-wide 5hmC levels at single-base resolution using bisulfite-assisted ACEseq (bACEseq).29 By pairing bACEseq with whole genome bisulfite sequencing (WGBS), true 5mC levels and sites can be inferred by subtracting bACEseq signals (5hmC only) from WGBS signals (5mC + 5hmC mixed readout), thereby resolving the epigenetic base ambiguity between 5mC and 5hmC. By profiling ∼40 million (M) common CpG sites between UCLA1 and UCLA2 hESCs and hPGCLCs, we identified a doubling of 5hmC levels in hPGCLCs coupled with a modest reduction of 5mC that can be partially explained by the presence of 5hmC (Figure 2A).
Figure 2.

5hmC is enriched in hPGCLCs during in vitro differentiation
(A) Bisulfite APOPEC-coupled epigenetic sequencing (bACEseq) in hESCs and hPGCLCs at D4 of aggregate differentiation. Analysis was performed using ∼49 million (M) common CpG sites. Each dot represents average 5hmC and/or 5mC levels in an independent differentiation experiment. Data are represented as mean ± SEM. The Student’s t test was performed to determine the significances with ∗p < 0.05 and ∗∗p < 0.01.
(B) Percentage of hyper and hypo-DhMRs in hPGCLCs relative to hESCs. (Δ5hmC level >10% and FDR <0.05).
(C) Heatmap of TFAP2C binding sites in hESCs and hPGCLCs. Data from.33
(D) Percentage 5hmC at genomic sites in (C) reveals that 5hmC is uniquely enriched at hPGCLC-specific TFAP2C binding sites in hPGCLCs. Data are represented as mean ± SEM. The Student’s t test was performed to determine the significances with ∗p < 0.05, ∗∗p < 0.01 and ∗∗∗p < 0.001.
(E) Metaplot of Δ5hmC level of regions from (C).
(F) Heatmap of SOX17-specific binding sites in hPGCLCs and randomly selected regions. Data from.10
(G) Percentage 5hmC at genomic sites in (F) reveals that 5hmC becomes uniquely enriched at SOX17 binding regions in hPGCLCs. Data are represented as mean ± SEM. The Student’s t test was performed to determine the significances with ∗p < 0.05, ∗∗p < 0.01 and ∗∗∗p < 0.001.
(H) Metaplot Δ5hmC level of regions from (F).
(I) Metaplot of Δ5hmC at genes expressed in hPGCLCs (DEGs were calculated using the bulk RNA-seq dataset of 12). 5hmC is uniquely associated with the genebody of up-regulated genes in hPGCLCs.
(J) Genome browser shot of the NANOS3 locus showing 5hmC enrichment in the genebody.
Next, we queried 5hmC enrichment at specific sites in hPGCLCs relative to hESCs by calling differentially hydroxymethylated regions (DhMRs) using the criteria of Δ5hmC >10%, with at least 10 CpG sites in 500bp bins and a false discovery rate (FDR) < 0.05. In total, 42,997 hPGCLC hyper- and 1,606 hPGCLC hypo-DhMR were identified in hPGCLCs (Figure 2B). These DhMRs are enriched in gene-centric regulatory regions (Figure S2A). We also performed principal component analysis (PCA) using the WGBS and bACEseq datasets to show that that the methylome and hydroxymethylome of hESCs can be discriminated from hPGCLCs over the PC1 axis (Figure S2B). Therefore, the 5hmC enrichment in the hPGCLC genome is sufficient to re-wire the 5hmC epigenome to classify hPGCLCs as having a distinct 5hmC landscape relative to hESCs.
Next, we performed integrative genomic analysis using previously published TFAP2C, NANOG and SOX17 ChIP-seq5,10 and ATACseq33 datasets to evaluate changes in TF binding and chromatin accessibility with enrichment of 5hmC during hPGCLC induction in vitro. First, for TFAP2C we identified hESC-specific, shared and hPGCLC-specific TFAP2C peaks (Figure 2C). The hPGCLC-specific peaks refer to genomic sites that become bound by TFAP2C on hPGCLC induction from hESCs (therefore hPGCLC-specific relative to hESCs). Among the three categories, only hPGCLC-specific TFAP2C peaks showed a statistically significant increase in 5hmC relative to undifferentiated hESCs (Figure 2D). We further plotted Δ5hmC levels between hPGCLCs and hESCs displaying 3kb upstream and downstream of the TFAP2C binding peak, and show that 5hmC levels are increased next to the peak (Figure 2E). Similar patterns were also observed for NANOG (Figures S2C–S2E).5 This same trend was also observed for SOX17-specific peaks relative to randomly selected regions (Figures 2F–2H). For this analysis, randomly selected regions were used because SOX17 protein is not expressed in undifferentiated hESCs. Therefore, any SOX17 peaks in hPGCLCs would be considered hPGCLC-specific relative to hESCs. We also characterized hESC-specific, shared and hPGCLC-specific accessible regions (Figure S2F), and similar to the hPGCLC-specific TFs, 5hmC is uniquely enriched in hPGCLC-specific accessible regions (Figures S2G and S2H) indicating that enrichment of 5hmC is occurring at hPGCLC-specific TF binding sites that acquire TFAP2C, NANOG and SOX17 binding on hPGCLC induction.
A previous report revealed that 5hmC enrichment at gene bodies positively associates with gene expression.40 To evaluate this phenomenon in hPGCLCs, we categorized differentially expressed genes (DEGs) using a previously published RNA-seq dataset,12 and categorized DEGs as either hPGCLC-up, hPGCLC-down or non-significant relative to expression in hESCs. Next, we profiled Δ5hmC levels at the gene bodies of genes in each category (Figure 2I). As predicted, we identified 5hmC enrichment at gene bodies of the hPGCLC-up group, compared to the hPGCLC-down or no change group. A genome browser shot of the hPGCLC-up gene NANOS3 confirms gene body 5hmC enrichment as predicted in the prior analysis (Figure 2J) and consistent with 5hmC enrichment at gene bodies of expressed genes identified in the previous study of heart cells.40 Taken together the induction of hPGCLCs from hESCs leads to the enrichment of 5hmC at uniquely accessible regions in hPGCLCs, most notably at sites that acquire TFAP2C, NANOG and SOX17 on hPGCLC induction which we call hPGCLC-specific TF binding sites. This suggests that TET1 and 5hmC may be involved early in hPGCLC development, and possibly the induction of hPGCLCs.
The catalytic activity of TET1 facilitates hPGCLC induction
Since 5hmC becomes enriched in the DNA of sites that acquire TFAP2C, NANOG and SOX17 with hPGCLC induction, we used CRISPR/Cas9 to partially delete the catalytic domain of TET1, including the Fe2+ binding site with a pair of guide RNAs to evaluate the catalytic role of TET1 in hPGCLCs (Figure S3A). Following nucleofection, colony picking and genotyping, three control (CTRL) and three catalytic domain knockout (catKO) sublines were identified (Figure S3B). Analysis of the sublines by phase contrast microscopy revealed no morphological differences between CTRL and catKO cells when grown under self-renewing hESC conditions (Figure 3A). To evaluate whether 5hmC levels were affected in hESCs before differentiation, we performed dot blot analysis to show that three catKO hESC sublines have reduced 5hmC levels relative to control consistent with a defect in catalytic activity (Figure S3C).
Figure 3.

The catalytic activity of TET1 is required for hPGCLC differentiation
(A) TET1 catalytic domain knockout (catKO) hESCs (left), iMeLCs (middle) and D4 aggregates (right) have similar morphology when compared to control (CTRL) cells. Scale bar, hESC: 100μm, iMeLC: 40μm, D4 aggregate: 200μm.
(B) Representative flow cytometry plots of aggregate cells at D4 showing ITGA6/EPCAM positive hPGCLCs in CTRL but not catKO cells.
(C) Quantification of data from (B) using n = 3 sublines of CTRL and n = 3 sublines catKO cells. All sublines were differentiated in two independent experiments (12 experiments total). Data are represented as mean ± SEM. Statistics were calculated using paired Student’s t test with ∗p < 0.05 and ∗∗p < 0.01.
(D and E) Representative IF images of CTRL and catKO D4 aggregates for triple positive. TFAP2C, PRDM1, SOX17 hPGCLCs (D) Inserts show examples of hPGCLC clusters in CTRL aggregates, in catKO aggregates, TFAP2C single positive cells are localized to the edge, with SOX17/PRDM1 double-positive cells in the core. Scale bar, 80μm. (E) High power image of a hPGCLC cluster in CTRL and rare triple positive hPGCLC clusters in catKO. Scale bar, 40μm.
(F) scRNA-seq using 10X Genomics at D4 with CTRL and catKO aggregate cells. CTRL (Green) and catKO (magenta) cells are displayed together on a UMAP (n = 38,219 cells). On the right show the hPGCLC cluster (pink) and endoderm-like cell cluster (blue), the other cells of the aggregate (others) are colored (gray).
(G) Quantification of cells in the hPGCLC cluster in (F) shows >80% of hPGCLCs are from the CTRL aggregates. (n = 2,936 hPGCLCs in total, 2,536 corresponding to CTRL and 400 in the catKO). In contrast, >70% of endodermal cells are from the catKO aggregates (n = 3,349 endodermal cells in total, 811 corresponding to CTRL and 2,538 in the catKO). “All” refers to all cells in the analysis (n = 38,219 cells), “Others” = n = 31,934 cells. Fisher’s exact was performed to determine the significance with ∗p < 0.05 and ∗∗p < 0.01.
Next, we initiated hPGCLC differentiation from the three CTRL and three catKO sublines using the differentiation method indicated in Figure 1A. Phase contrast microscopy of the iMeLCs revealed no morphological differences between CTRL and catKO sublines before aggregate differentiation (Figure 3A). To quantify hPGCLC induction in the aggregates, we performed flow cytometry at D4 using antibodies conjugated to fluorescent proteins. These fluorescent antibodies recognize the surface proteins ITGA6 and EPCAM.11 Using this strategy, hPGCLCs are identified as EPCAM/ITGA6 double-positive cells which are identified in the CTRL sublines at D4 (representative flow plot shown in Figure 3B, quantified in Figure 3C). In contrast, the catKO sublines generated very few ITGA6/EPCAM double-positive cells at D4 (Figure 3B and quantified in Figure 3C). To confirm this result, we performed IF using a triple stain for the hPGCLC TFs TFAP2C (T), SOX17 (S) and PRDM1 (P) at D4 of aggregate differentiation. Triple positive (T/S/P) cells corresponding to hPGCLCs are identified in the CTRL aggregates (Figure 3D, insert shows a magnified cluster of hPGCLCs). In contrast, catKO aggregates had SOX17/PRDM1 double-positive (S/P) cells in the core, with TFAP2C-single positive (T) cells at the edge (Figure 3D). Higher magnification of the catKO aggregates reveals rare T/S/P cells amongst the PRDM1/SOX17 cells in the core of the catKO mutant aggregates which we speculate correspond to rare hPGCLCs (Figure 3E). Given that hPGCLC induction begins at D2 in this model,9,11,33 we next evaluated whether hPGCLCs are induced at D2, and therefore lost by D4. Using IF, we identified triple positive T/S/P hPGCLCs in CTRL but not in catKO aggregates at D2 (Figure S3D). In contrast, the core of the catKO aggregates at D2 shows accumulation of S/P double-positive cells similar to D4. This result indicates TET1/5hmC is involved in hPGCLC induction in vitro.
To further interrogate hPGCLC induction and the identity of the PRDM1/SOX17 cells at D4 in the catKO mutants we performed single cell RNA-seq using 10X Genomics of all six sublines, and clustered the entire dataset together on a single UMAP (Figure 3F). In this analysis, the hPGCLC cluster is defined as expressing TFAP2C, SOX17, NANOG and NANOS3 (Figure S3E), and is color coded pink. We did not observe any change in TET2 or TET3 expression levels in the catKO hPGCLCs. In contrast, the SOX17/PRDM1 cluster is color coded blue. The SOX17/PRDM1 cluster is also enriched in FOXA2 (Figure S3F), a marker of endoderm, therefore we defined this cluster of cells at D4 as endoderm-like cells.
Consistent with the catKO hESC lines inducing fewer hPGCLCs, the composition of the hPGCLC cluster is mostly CTRL cells (p value <0.05). In contrast, the endoderm-like cluster is mostly composed of catKO cells (p value <0.05) (Figure 3G). When comparing gene expression levels of diagnostic PGC or endoderm genes in the catKO and CTRL clusters at D4, the expression levels are indistinguishable (Figures S3E and S3F). This result suggests that once induced, the catalytic domain of TET1 is not involved in maintaining early PGCLC identity. To confirm this, we performed fluorescence-activated cell sorting (FACS) of catKO and CTRL cells at D4 of aggregate differentiation to isolate hPGCLCs and cultured the D4 hPGCLCs in extended culture (C) for 21 days (D4C21) which promotes survival and self-renewal of specified hPGCLCs.41 This result shows that catKO hPGCLCs are still detectable at D4C21 similar to CTRL hPGCLCs (Figure S3G). Taken together, our data suggests that the catalytic domain of TET1 is critical for coordinating hPGCLC induction from MEF-cultured hESCs before D2, but is not necessary to maintain hPGCLC identify once induced.
TET1 is bound at LTR5Hs and hPGCLC-specific transcription factor binding sites in hESCs
Given that hPGCLC induction is observed by D2 of BMP4 exposure, we next asked whether the hPGCLC induction phenotype could begin with loss of 5hmC in undifferentiated hESCs. To achieve this, we performed bACEseq and WGBS on catKO hESCs and compared levels of 5hmC and 5mC to wild type UCLA1 from Figure 2A. Using bACEseq, our data demonstrate that TET1 catKO hESCs have significantly less 5hmC relative to wild-type (Figure 4A), consistent with the dot blot performed earlier (Figure S3C). PCA results separate UCLA1 and catKO hESCs on the PC1 axis indicating that the methylome (WGBS) and position of 5hmC in the hESC genome are now distinct in wild-type relative to catKO cells (Figure 4B). To identify DhMRs in the catKO cells, we used the criteria of Δ5hmC >10%, with at least 10 CpG sites in 500bp bins and a false discovery rate (FDR) < 0.05. From this analysis, 64,986 catKO hypo-DhMRs were identified in the catKO cells. The catKO hypo-DhMRs were enriched at gene-centric regulatory regions (Figure 4C), but do not show significant overlap with the hPGCLC hyper-DhMRs that become enriched in 5hmC with hPGCLC induction (Figure 4D). Therefore, our results suggest that loss of 5hmC in undifferentiated catKO hESCs is not occurring at the same genomic regions that gain 5hmC on hPGCLC induction.
Figure 4.

TET1 protein is primed at LTR5Hs and the hPGCLC-specific network
(A) bACEseq was used to show that catKO cells have reduced levels of 5hmC compared to wild-type hESCs. Analysis was performed using ∼40M common CpG sites. Each dot represents 5hmC or 5hmC+5mC levels in an independent differentiation experiment. Data are represented as mean ± SEM. The Student’s t test was performed to determine the significances with ∗p < 0.05.
(B) Principal component analysis (PCA) using WGBS and bACEseq of catKO hESCs indicates that the DhMRs separate mutant and wild-type cells in PC1.
(C) TET1 catKO hypo-hydroxymethylated regions (hypo-DhMRs) are enriched at gene regulatory regions.
(D) TET1 catKO hypo-DhMRs identified in undifferentiated hESCs are mostly distinct from hPGCLC hyper-DhMRs from Figure 2B.
(E) The majority of TET1 bound sites in undifferentiated hESCs do not gain additional 5hmC with hPGCLC differentiation. TET1 ChIP-seq data is from.36
(F) TET1 protein is bound to LTR5Hs in hESCs as determined by ChIP-seq HERVK is used as a control for non-specific binding.
(G) 5hmC is enriched at LTR5Hs (n = 697) in hESCs and hPGCLCs. HERVK (n = 262) as control regions showing no 5hmC enrichment.
(H) TET1 protein in hESCs is bound to the hPGCLC-specific SOX17, TFAP2C and NANOG binding sites identified in Figures 2C, 2F, and S2C.
We next evaluated TET1 binding and 5hmC enrichment in hESCs. To do this, we used the published TET1 ChIP-seq datasets of hESCs36 and termed these binding sites “TET1 bound sites in hESCs”. Tracking the 5hmC deposition at these TET1 bound sites in hESCs through hPGCLC induction, we show a peak of 5hmC at the center of the TET1 binding sites in hESCs. Then upon hPGCLC induction, 5hmC is lost from the center whereas the neighboring regions exhibit the expected gain in 5hmC (Figure 4E). This data indicates the majority of TET1 bound sites in hESCs become unmethylated with hESC differentiation into hPGCLCs, whereas the neighboring regions gain 5hmC.
Previously, we reported the identification of ape-specific transposable elements (TEs) called LTR5Hs, which serve as TE ENhancers (TEENhancer) for hPGCLC induction.10 Using WGBS analysis (which does not discriminate between 5mC and 5hmC) we previously revealed that LTR5Hs is partially demethylated in hPGCLCs relative to hESCs.10 Based on this, we hypothesize that TET1 may be bound to LTR5Hs in hESCs, and that these sites may be enriched in 5hmC. Using the published ChIP-seq dataset of TET1,36 we show that, TET1 is bound to LTR5Hs in hESCs (Figure 4F), and these sites are enriched in 5hmC (Figure 4G). With induction of hPGCLCs, 5hmC levels remain high at the TET1 bound sites, as the neighboring regions simultaneously gain 5hmC. This data suggests that TET1 remains bound, and active, at the LTR5Hs TEENhancers during hPGCLC induction.
Finally, given that the TEENhancers are bound by TET1 in undifferentiated hESCs, we next evaluated TET1 binding at the hPGCLC-specific TF binding sites identified in Figure 2 (Figure 4H). This result shows that similar the LTR5Hs TEENhancers, TET1 also binds to the hPGCLC-specific TF binding sites in hESCs (Figure 4H), and this is associated with a peak of 5hmC (Figure S4A). To determine whether the hPGCLC-specific TF binding sites lose 5mC on hPGCLC induction, we mapped 5mC and 5hmC peaks at the hPGCLC-specific TF binding sites in hESCs and in hPGCLCs and show that on hPGCLC differentiation, the hPGCLC-specific TF binding sites gain a peak of 5hmC, while at the same time being depleted in 5mC (Figure S4B). Taken together, the binding of TFAP2C or SOX17 or NANOG to their hPGCLC-specific binding sites on hPGCLC induction is associated with a localized gain in 5hmC combined with a dramatic localized loss in 5mC.
TET1 restrains spontaneous endoderm differentiation
Finally, given that TET1 protein is repressed on endoderm differentiation (Figure 1E), and deletion of the catalytic domain of TET1 is associated with increased fractions of endoderm-like cells (Figure 3G), we hypothesize that TET1 and/or 5hmC serves a negative role in regulating spontaneous endoderm differentiation. To address this, we performed bulk-RNA-seq of CTRL and catKO hESCs and iMeLCs (Figures 5A and S5A). Bulk RNA-seq confirmed deletion of the 9th exon in catKO cells. Using this analysis, we discovered a small number of DEGs, n = 151 and n = 149 upregulated genes, and n = 244 and n = 283 down-regulated genes in hESCs and iMeLCs respectively. In both datasets we identified SOX17 mRNA as being significantly up-regulated in the catKO mutant cells. To determine whether SOX17 is up-regulated in all hESCs/iMeLCs, or just a subset of cells, we utilized 10X Genomics (Figures S5B and S5C), and show that a small population of hESCs and iMeLCs express SOX17 under CTRL conditions, with 2 to 3-fold increase in these cells in the catKO hESCs and iMeLCs. Therefore, loss of TET1 catalytic activity leads to a small but appreciable increased propensity for spontaneous differentiation toward SOX17/PRDM1+ endoderm beginning in the hESC and iMeLC state before hPGCLC induction, a phenomenon that is further exacerbated in aggregates.
Figure 5.

TET1 catalytic activity restrains spontaneous endoderm differentiation
(A) Differentially expressed gene (DEG) analysis by bulk RNA-seq comparing CTRL and catKO hESCs and iMeLCs.
(B) catKO hPGCLC competency could be rescued by culturing in a defined feeder-free condition (StemFit).
(C) Model for TET1 in hPGCLC induction.
Given that hPGCLC competency requires progenitors to remain in the germline trajectory, and hESCs cultured in KSR/MEF conditions exhibit spontaneous differentiation (Figures S5B and S5C), we evaluated whether hPGCLC induction in the catKO could be rescued by transitioning hESCs from KSR/MEFs to a defined media (StemFit) on recombinant E8 Laminin 511 Fragment (rLN511E8), which is reported to exhibit a high doubling time and low spontaneous somatic differentiation.42 Following adaptation to StemFit/rLN511E8, our results show a restoration of germline competency to the catKO lines equivalent to CTRL cells (Figure 5B).
Taken together, our data support a model where TET1 binding in hESCs at both LTR5Hs TEENhancers10 as well as hPGCLC-specific TF binding sites facilitates hPGCLC induction upon differentiation from KSR/MEF hESC cultures. In the absence of TET1 catalytic activity, our data demonstrate that hESCs spontaneously differentiate into a small population of endoderm-like cells starting in undifferentiated KSR/MEF culture conditions and in iMeLC culture conditions, as well as during aggregate formation at the expense of hPGCLCs (Figure 5C).
Discussion
Using the mouse as a model, TET proteins and the conversion of 5mC to 5hmC function late in PGC development, well after PGC specification, to regulate transition into gonadal-stage germ cells, while facilitating DNA demethylation of imprinted genes.26,28,43,44,45,46 In the mouse embryo, PGC specification occurs in an embryological structure known as an egg cylinder.47,48,49 However, in human embryos, and other non-rodent embryos such as the pig, PGC specification occurs in an embryologic structure called a bilaminar disc.50,51 In bilaminar disc embryos, the TF SOX17 serves as a key determinant of PGC specification.52 In contrast, in egg-cylinder embryos SOX17 is not.49 Given these key differences in embryo structure, as well as TF expression and utilization at the time of PGC specification in different mammals, it could be hypothesized that epigenetic regulation of PGC specification is also different.
We began our study intrigued by the observation that the epigenetic regulator TET1 and 5hmC are specifically enriched in porcine PGCs (a bilaminar disc embryo) at the time of PGC specification.24 Given this, we hypothesized that TET1 and 5hmC may function at the time of PGC specification in humans. To address this, we differentiated hPGCLCs from hESCs and show that the catalytic activity of TET1 functions to regulate hPGCLC induction. This is distinct from mouse where the induction of germ cells in vitro can occur in the absence of TETs.46 As we were preparing our manuscript for submission, hPGCLC induction was evaluated in a triple knockout of TET1, TET2 and TET3 using the H1 hESC line.53 This knockout hESC line failed to induce hPGCLCs in vitro, however, the specific TET protein responsible for this phenotype was not interrogated, and a genome-wide analysis of 5hmC was not performed.53 In the current study, we focused on TET1 given this TET is specifically expressed at the time of hPGCLC induction. Our data unveils the localization of 5hmC in the hPGCLC genome at single base resolution and reveals a role for the catalytic domain of TET1 in hPGCLC induction when starting the culture on MEFs, a phenotype that can be rescued when transitioned to feeder-free conditions.
There are two main isoforms of TET1 in mouse,28 a full-length isoform that includes the CXXC domain responsible for DNA binding54 and a short form, which is expressed by somatic cells where it serves a distinct role in gene regulation.55 Transcription of full-length TET1 involves a super enhancer28 bound by pluripotent TFs such as OCT4.56 The full-length version is expressed by pluripotent cells in early mouse embryos, ESCs and PGCs.28 In the current study, we show that hPGCLCs and hPGCs also express full-length TET1, however, unlike hESCs, hPGCs and hPGCLCs appear to utilize an alternate 5′UTR which is associated with the re-distribution of NANOG at the TET1 locus. Alternate 5′ UTRs are known to impact RNA stability, ribosome recruitment, translation and other aspects of gene regulation.57 Therefore, future studies could be aimed at understanding the purpose of this alternate TSS in hPGCLC/hPGC biology.
A major finding our study was the discovery that hPGCLC-specific TF’s become bound at a subset of sites on hPGCLC induction, which begin as TET1 bound sites in undifferentiated hESCs. Although we do not know whether these hPGCLC-specific TF bind to TET1, the interaction of TET1 with TFs has previously been shown using mouse ESCs, including with PRDM14, a TF required within the first two days of hPGCLC differentiation.58 In mouse ESCs, PRDM14 physically interacts with TET1 to enhance the recruitment of TET1 to target loci resulting in transient elevation of 5hmC at these sites.59 Furthermore, previous studies have also shown that NANOG can also physically interacts with TET1.60 Therefore, redistribution of NANOG to hPGCLC-specific TET1 bound sites could serve as a mechanism to promote 5hmC enrichment and facilitate hPGCLC induction in vitro.
LTR5Hs contains CpG rich sequences, and CpG rich sequences are known to be preferential targets of TET1.61 Given that 5hmC is highly enriched at LTR5Hs relative to the neighboring genomic regions before hPGCLC induction, we propose that LTR5Hs serves as a TET1/5hmC enriched site, which may facilitate the induction of hPGCLCs from hESCs.10 Gene body enrichment of 5hmC on hPGCLC induction is also an important observation in our study. Gene body 5hmC enrichment at expressed genes has been observed in prior studies,40,62 however, the purpose of this enrichment beyond correlation remains elusive. Recent work linking TET1 to METTL3 to facilitate RNA-coupled DNA demethylation at gene bodies is intriguing.63 Therefore, the role of METTL3 in hPGCLC induction could be evaluated in future studies.
Unlike hPGCLC induction which is positively regulated by TET1/5hmC, we discovered that deleting a part of the catalytic domain of TET1 causes increased spontaneous differentiation of endoderm-like cells before and during aggregate differentiation in vitro when starting with KSR/MEF hESC cultures. A recent siRNA knockdown of TET1 did not impair directed DE differentiation64 and neither was directed endoderm differentiated affected in a TET1/2/3 triple knockout.65 In contrast, evidence for TET1’s role in repressing spontaneous endoderm/mesendoderm differentiation in vitro has been reported in mouse ESCs.56,66,67 In these studies, the mechanism by which TET1 regulates spontaneous mesendoderm and endoderm differentiation is through the DNA demethylation of NODAL antagonists Lefty1 and Lefty2.56,67 Unlike mouse ESCs NODAL/ACTIVIN is necessary for maintenance of human pluripotency.68 Therefore, we propose that in the absence of TET1 catalytic domain, the delicate balance between hESC self-renewal and spontaneous differentiation is affected, leading to modest increase in spontaneous differentiation toward SOX17 expressing endoderm-like cells beginning in the undifferentiated state when cultured on MEFs, and this phenotype is further exacerbated in the presence of BMP4 in aggregates.
In summary, this study reveals that amongst the TET family of proteins, TET1 facilitates hPGCLC induction from KSR/MEF-cultured human pluripotent stem cells, and that the mechanism is likely occurring through the catalytic conversion of 5mC to 5hmC at LTR5Hs as well as at PGC-specific TF binding sites which bind TFAP2C or NANOG or SOX17 on hPGCLC induction. This work reveals that epigenetic regulation of hPGCLC induction is different in humans compared to mice and our study also revealed the importance of the starting stem cell culture conditions in modulating the differentiation phenotype.
Limitations of the study
In this study, we are utilizing the differentiation of hESCs into hPGCLCs to model the specification of hPGCs in vivo. In vitro differentiation studies can be subject to technical variability as well as differences in cell and molecular biology when comparing laboratory generated cells to ones generated in an embryo in vivo. We have reduced the technical limitation of our study by analyzing hPGCLC differentiation across multiple independent sublines. The differentiation method used in the current study is a standard method in the field and this approach is known to create in vitro hPGCLCs that are transcriptionally similar to in vivo hPGCs from CS7 embryos.
STAR★Methods
Key resources table
| REAGENT or RESOURCE | SOURCE | IDENTIFIER |
|---|---|---|
| Antibodies | ||
| Mouse-anti-TFAP2C | Santa Cruz Biotechnology | Cat# sc-12762; RRID: AB_667770 |
| Rabbit-anti-PRDM1 | Cell Signaling Technology | Cat# 9115; RRID: AB_2169699 |
| Mouse-anti-TET1 | GeneTex | Cat# GTX627420, RRID:AB_11172316 |
| Goat-anti-NANOG | R&D systems | Cat# AF1997, RRID:AB_355097 |
| Rabbit-anti-OCT4 | Cell Signaling Technology | Cat# 2840, RRID:AB_216769 |
| Brilliant Violet 421™ anti-human/mouse CD49f (ITGA6) | BioLegend | BioLegend Cat# 313624, RRID:AB_2562244 |
| Alexa Fluor® 488 anti-human CD326 (EpCAM) | BioLegend | BioLegend Cat# 324210, RRID:AB_756084 |
| APC anti-mouse/rat CD29 Antibody | BioLegend | BioLegend Cat# 102216, RRID:AB_492833 |
| Human TRA-1-85/CD147 PE-conjugated | R&D systems | Cat# FAB3195P, RRID:AB_2066683 |
| Donkey-anti-mouse-488 | Thermo Fisher Scientific | Cat# A-21202, RRID:AB_141607 |
| Donkey-anti-rabbit-594 | Thermo Fisher Scientific | Cat# A-21207, RRID:AB_141637 |
| Donkey-anti-goat-647 | Thermo Fisher Scientific | Cat# A-21447, RRID:AB_141844 |
| anti-rabbit-HRP | Abcam | Cat# ab6721, RRID:AB_955447 |
| Rabbit-anti-5hmC | Active Motif | Cat# 39769, RRID:AB_10013602 |
| Chemicals, peptides, and recombinant proteins | ||
| CHIR99021 | Stemgent | Cat# 04-0004 |
| Y27632 | Stemgent | Cat# 04-0012-10 |
| Recombinant Human FGF basic Protein | R&D systems | Cat# 233-FB |
| Recombinant Activin A | Peprotech | Cat# AF-120-14E |
| Recombinant human LIF | Millipore | Cat# LIF1005 |
| Recombinant human BMP4 | R&D systems | Cat# 314-BP |
| Recombinant human EGF | R&D systems | Cat# 236-EG |
| StemFit Basic03 | Ajinomoto | Cat# 34770 |
| Amsbio LLC Recombinant Laminin iMatrix-511silk E8 | Fisher Scientific | Cat# 502041396 |
| TrypLE | Fisher Scientific | Cat# 50591419 |
| Stem Cell Factor | R&D Systems | Cat# 255-SC-010 |
| Knockout Serum Replacement | GIBCO | Cat# 10828-028 |
| PierceTM ECL Western Blotting Substrate | Thermo Fisher Scientific | Cat# 32109 |
| Klenow (3′→ 5′ exo-) | Enzymatics | Cat# P7010-HC-L |
| Exonuclease | Enzymatics | Cat# X8010L |
| Shrimp Alkaline Phosphatase (rSAP) | New England Biolabs | Cat# M0371L |
| KAPA HiFi HotStart ReadyMix | KAPA BIOSYSTEMS | Cat# KK2602 |
| Critical commercial assays | ||
| SMARTer Stranded Total RNA-Seq Kit v3 - Pico Input Mammalian | TAKARA | Cat# 634486 |
| P3 Primary Cell 4D-Nucleofector X Kit | Lonza | Cat# V4XP-3032 |
| EZ DNA Methylation-Direct™ Kit | Zymo Research | Cat# D5020 |
| Qubit™ dsDNA High Sensitivity Assay Kit | Invitrogen | Cat# Q32851 |
| Agilent High Sensitivity DNA Kit | Agilent | Cat# 5067-4626 |
| Accel-NGS Adaptase Module | Swift Biosciences | Cat# 33096 |
| Deposited data | ||
| RNAseq | This paper | GSE217541 |
| single cell RNAseq | This paper | GSE217542 |
| bACEseq | This paper | GSE218910 |
| WGBS | This paper | GSE217954 |
| Experimental models: Cell lines | ||
| UCLA1 | Perez et al.69 | N/A |
| UCLA2 | Perez et al.69 | N/A |
| Oligonucleotides | ||
| FH_hTET1cat_gRNA1F: GTTGCCCGAGAATGTCGGCT | IDT | N/A |
| FH_hTET1cat_gRNA1R: AGCCGACATTCTCGGGCAAC | IDT | N/A |
| FH_hTET1cat_gRNA3F: GCAGCCTAAGCATATAGTGA | IDT | N/A |
| FH_hTET1cat_gRNA3R: TCACTATATGCTTAGGCTGC | IDT | N/A |
| FH_hTET1_genotype_F3: TAGTATCCTCACCCTGCCTTC | IDT | N/A |
| FH_hTET1_genotype_R4: GAAGACCTGCACTACACACT | IDT | N/A |
| Recombinant DNA | ||
| pSpCas9(BB)-2A-Puro (PX459) | Addgene | RRID:Addgene_48139 |
| Software and algorithms | ||
| Cutadapt | https://cutadapt.readthedocs.org/ | RRID:SCR_011841 |
| STAR | https://github.com/alexdobin/STAR | RRID:SCR_004463 |
| Subread | https://subread.sourceforge.net/ | RRID:SCR_009803 |
| Seurat | https://satijalab.org/seurat/articles/get_started.html | RRID:SCR_016341 |
| Bisulfite Bolt | https://github.com/NuttyLogic/BSBolt | RRID:SCR_019080 |
| BD FACSDiva | BD Biosciences | RRID:SCR_001456 |
| FlowJo | FLOWJO | RRID:SCR_008520 |
| Prism | GraphPad | RRID:SCR_002798 |
| UMI-tools | https://github.com/CGATOxford/UMI-tools | RRID:SCR_017048 |
| Picard | http://broadinstitute.github.io/picard/ | RRID:SCR_006525 |
| FastQC | https://www.bioinformatics.babraham.ac.uk/projects/fastqc/ | RRID:SCR_014583 |
Resource availability
Lead contact
Further information and requests for resources and reagents should be directed to and will be fulfilled by the Lead Contact, Amander T. Clark (clarka@ucla.edu).
Materials availability
hESC lines used in this study are available from the lead contact.
Experimental model and study participant details
hESC culture
The hESC lines are cultured on gelatin-coated plates (0.1%, Sigma-Aldrich, Cat# G1890) pre-plated with mitomycin C-inactivated mouse embryonic fibroblasts (MEFs) at 37°C, 5% CO2. Self-renewal is maintained in DMEM/F12 media (GIBCO, Cat# 11330-032) containing 20% knockout serum replacement (KSR) (GIBCO, Cat# 10828-028), 1x MEM Non-Essential Amino Acids (NEAA) (GIBCO, Cat#11140-050), 55μM 2-Mercaptoethanol (GIBCO, Cat#21985-023), 10ng/mL recombinant human FGF basic (R&D systems, Cat# 233-FB), 1x Penicillin-Streptomycin-Glutamine (GIBCO, Cat# 10378-016), and 50ng/mL primocin (InvivoGen, Cat# ant-pm-2). The hESC lines are split approximately every 7 days using Collagenase type IV (GIBCO, Cat# 17104-019). Mycoplasma testing (Lonza, Cat# LT07-418) was performed every 3 months to confirm lack of mycoplasma contamination in the cultures. The derivation, self-renewal and pluripotency of UCLA1 (46, XX) and UCLA2 (46, XY) hESC lines were published previously.69 All experiments were performed between passage 20-48.
Differentiation of hPGCLCs
Confluent wells of hESCs were dissociated into single cells with 0.05% Trypsin-EDTA (GIBCO, Cat# 25300-054) followed by quenching the Trypsin-EDTA with trypsin inhibitor (GIBCO, Cat# 17075029) and centrifugation at 1,200 rpm. The cell pellet was resuspended in Glasgow’s MEM (GMEM) (GIBCO, Cat#11710-035) containing 15% KSR (GIBCO, Cat#10828-028), 1x NEAA (GIBCO, Cat# 11140-050), 0.1mM 2-Mercaptoethanol (GIBCO, Cat# 21985-023), 1x Penicillin-Streptomycin-Glutamine (GIBCO, Cat# 10378-016), 1mM sodium pyruvate (GIBCO, Cat# 11360-070), 50ng/mL Activin A (Peprotech, Cat# AF-120-14E), 3μM CHIR99021 (Stemgent, Cat# 04-0004), 10μM of ROCKi (Y27632, Stemgent, Cat# 04-0012-10), and 50ng/mL primocin and strained through a 40um cell strainer (Flacon, Cat# 352340). Following straining, the cells are plated onto Human Plasma Fibronectin (Invitrogen, Cat# 33016-015)-coated 12-well-plates at a density of 200,000 cells/well and incubated for 24 hours at 37°C , 5% CO2 to create, iMeLCs were dissociated into single cells with 0.05% Trypsin-EDTA (GIBCO, Cat# 25300-054), counted, and 3,000 cells/well are plated into U-bottom 96-well plates (Corning, Cat# 7007) to generate three-dimensional aggregates. The day of plating is called D0. Aggregates were cultured to day 4 (D4) with experiments on aggregates performed at D2 and D4 after plating in 96-well plates. For references, the induction of hPGCLCs from UCLA1 and UCLA2 hESC lines followed the two-step differentiation protocol through an incipient mesoderm Like Cell (iMeLC) intermediate originally developed by Sasaki et al.,11 and modified by Chen et al.,.12
Method details
Flow cytometry and fluorescence-activated cell sorting (FACS)
On D4 of differentiation, the aggregates are dissociated with 0.05% Trypsin-EDTA (GIBCO, 25300-054) for 10 mins at 37°C. The trypsin is quenched with MEF media and the cells are centrifuged at 1,200 rpm before resuspending the pellet in the FACS buffer which contains 0.1% BSA in DPBS. To analyze or sort hPGCLCs, the single cell suspension is incubated with anti-human ITGA6 (rat) antibodies conjugated to BV421 (BioLegend, 313623) at a 1:60 dilution, and anti-human EPCAM (mouse) antibodies conjugated with 488 (BioLegend, Cat# 324210) at a 1:60 dilution for 20 mins on ice in the dark. Following incubation with the conjugated antibodies, the cells are washed once with FACS buffer (1% BSA in DPBS), centrifuged at 1,200 rpm for 5 mins, and resuspended in FACS buffer, before straining through a 40μm cell strainer (Falcon, Cat# 352235). Dead cells were excluded from the population using 7-AAD (BD PharMingen, Cat# 559925), which was added 15 mins before analysis/sorting. Compensation controls included single color stains using anti-human ITGA6 antibodies conjugated to BV421 (BioLegend, Cat# 313623) and anti-human EPCAM antibodies conjugated with 488 (BioLegend, 324210) at the dilutions indicated above. Labelled cells were analyzed or sorted using a BD FACSAria. Post analysis identification of hPGCLCs used the FlowJoTM software (FLOWJO). Details of the antibodies used for flow and FACS can be found in key resources table.
Generation of TET1 catalytic domain knockout (catKO) hESC lines
To create the TET1 catKO and Control (CTRL) hESC lines in UCLA1 and UCLA2 hESC lines, pairs of guide RNAs targeting the TET1 catalytic domain were designed using http://crispor.tefor.net/, and cloned into the px459 cloning vector (Addgene, Cat# 62988). Guide RNA targeting efficiency, and identification of primer pairs for genotyping (key resources table) were validated with HEK293T cells by transfecting adherent cells with 1ug of each PX459 vector containing the gRNAs using lipofectamine 3000 (ThermoFisher, Cat# L3000001). Forty-eight hours after transfecting, HEK293T cells were harvested and DNA was extracted using Quick-DNA Miniprep Kit (Zymo Research, Cat# D3025). PCR primer pairs outside the CRISPR-Cas9 cut site were tested to identify presence or absence of a deletion in the gene edited HEK293T cells. The primer pair validated for genotyping the hESCs detect a 400bp band when TET1 is deleted and a 500bp wild type band (key resources table). Once validated in HEK293 cells, the pair of gRNAs were re-synthesized as crRNAs using the Alt-RTM CRISPR-Cas9 System (Integrated DNA Technologies, customized). The pair of crRNAs are combined with tracrRNA (Integrated DNA technologies, Cat# 1072532) to form a functional ribonucleoprotein (RNP) complex with recombinant S. pyogenes Cas9 nuclease (Integrated DNA Technologies, Cat# 1081058). The resulting RNP complex is nucleofected into a single cell suspension of 300,000 hESCs using P3 Primary Cell 4D-Nucleofector X Kit according to the manufacturer’s instructions (Lonza, Cat# V4XP-3032). After nucleofection, the cells are plated on MEFs (1 reaction on 1 well of a 24-well plate) supplemented with hESC media with 10mM of ROCKi (Y27632, Stemgent, Cat# 04-0012-10). Forty-eight hours after plating, the cells are dissociated with 0.05% Trypsin-EDTA (GIBCO, Cat# 25300-054) and seed at low density (20,000 cells per plate), onto 10cm plates coated with 0.1% Gelatin (Sigma-Aldrich, Cat# G1890), and pre-plated with MEFs. After 10 days of culture, 96 colonies were picked and individual colonies were plated onto 24-well plates coated with 0.1% gelatin and pre-plated with MEFs to create clones for genotyping. Each clone was genotyped using designed pairs of primers to confirm the deletion (key resources table). The PCR product was submitted for Sanger sequencing to identify the sequence of the alleles generated from CRISPR/Cas9 gene editing. Controls (CTRLs) for this study were the picked clones that did not undergo genome editing at the TET1 locus. Names of the clones used in this study are as follows. UCLA1 catKO clone #1102, #1105 and #1312. UCLA1 CTRL clone #1101, #1106, and #1109. UCLA2 catKO clone #2110 and #2310.
Rescue catKO hPGCLC competency
Frozen Stocks of CTRL and catKO cells at passage 35 were thawed on MEFs in conventional KSR/FGF2 media as above. At passage 37, the media was replaced with the defined media StemFit Basic03 (Ajinomoto, Cat# 34770). At passage 38, the cells were passaged onto recombinant Laminin iMatrix-511silk E8 (rLN511E8) (Fisher, cat # 502041396) in StemFit Basic03 (Ajinomoto, Cat# 34770). Cells were passaged as single cells using TrypLE (Fisher Scientific, Cat# 50591419) with 20,000 cells plated per well of a 6-well plate. Analysis of hPGCLC competency from cells cultured in feeder free-defined conditions was performed from passage 48 with 100ng/mL of Stem Cell Factor (SCF) in the PGCLC differentiation media (R&D Systems, Cat# 255-SC-010).
Dot blot
TET1 CTRL and catKO hESCs lines were isolated by FACS using PE-conjugated anti-human-TRA-1-85 (R&D systems, Cat# FAB3195P) and APC-conjugated anti-mouse-CD29 (BioLegend, Cat# 102216) in order to separate hESCs (human) from the MEFs (mouse). Genomic DNA from the FACS isolated cells were extracted using a DNA isolation kit (Zymo Research, Cat# D3020). DNA was denatured at 100°C for 10 min in 0.1M NaOH, and neutralized with cold 2M ammonium acetate (pH 7.2) and serially diluted. Three μL of each sample were loaded on nitrocellulose blotting membrane (Amersham, GE healthcare), air-dried for 10 mins and subjected to UV-crosslinking. Membranes were then rinsed with 1x TBST (ThermoFisher, Cat# 28360) and incubated with blocking solution (3% BSA in 1x TBST) for 1 hour at room temperature (RT), then incubated with 5hmC antibody (Active Motif, Cat# 39770) diluted 1:2500 overnight at 4°C. The next day, membranes were washed with 1x TBST four times for 15 min each, before incubating with HRP-conjugated secondary antibodies (Abcam, Cat# ab6721) in blocking solution for 1 hour at RT. Following this, the membranes were washed with 1x TBST four times for 15 min to remove the secondary antibody before applying the PierceTM ECL Western Blotting Substrate (ThermoFisher, Cat# 32109). Results were recorded with ChemiDoc imaging system (BioRad). Detailed antibody information could be found in key resources table.
Immunofluorescence
Paraffin-embedded sections were deparaffinized by successive treatment with xylene and re-hydrated with 100%, 95%, 70% and 50% ethanol to milliQ water and PBS. Antigen retrieval was performed by incubation with 10mM Tris pH 9.0, 1mM EDTA, 0.05% Tween 20 at 95°C for 40 mins. After cooling to RT, slides were washed with 1x PBS and 1x PBST (1x PBS + 0.1% Tween 20). The samples were then permeabilized with 0.5% Triton X-100 in 1x PBS for 10 mins, and washed with 1x PBST for 5 minutes before blocking in 10% donkey serum diluted in 1x PBST for 1 hour. After removing the blocking solution, samples were then incubated with primary antibodies diluted in blocking solution overnight at 4°C. The samples were washed 10 minutes for 3 times with 1x PBST before incubating in dark with fluorescence-conjugated secondary antibodies for 1 hour at RT. Secondary antibodies were removed by washing 3 times in 1x PBST for 10 minutes before incubating with DAPI (1:1000 in 1x PBST) for 10 mins. Samples were rinsed with 1x PBST, mounted with ProLong Gold Antifade Mountant (ThermoFisher, Cat# P10144), and cured overnight. Images were taken using LSM 780 or LSM 880 Confocal Instrument (Zeiss). Primary antibodies used for immunofluorescence in this study were mouse-anti-TFAP2C (Santa Cruz Biotechnology, Cat# sc-12726), rabbit-anti-PRDM1 (Cell Signaling Technology, Cat# 9115), goat-anti-SOX17 (R&D systems, Cat# AF1924), mouse-anti-TET1 (GeneTex, Cat# GTX627420), goat-anti-NANOG and rabbit-anti-OCT4 (Cell Signaling Technology, Cat# 2840). For antibody details please refer to key resources table.
Integrated whole genome BSseq and bACEseq
The whole genome BSseq (WGBS) and bACEseq (WG-bACEseq) experiments were performed with minor modifications.29 Briefly, ∼15 ng of genomic DNA from each sample was first spiked in with in vitro methylated lambda phage genomic DNA (0.2%) as controls and was then subjected to bisulfite conversion (EZ DNA Methylation-Direct™ Kit, Zymo Research Cat# D5020). Half of the bisulfite converted DNA was used for low input WGBS analysis (for 5mC+5hmC profiling). The other half of eluate was subjected to the low input WG-bACE-seq workflow (for 5hmC profiling). For each bACE-seq reaction, 1.5μL 200mM MES pH 6.0 + 0.1% Tween and 1.5μL DMSO were added to the 9μL eluent. The samples were then denatured at 95°C for 1min and snap cooled by transfer to a PCR tube rack pre-incubated at −80°C (for bulk samples). Before thawing, 1.5μL 200 mM MES pH 6.0 + 0.1% Tween-20 and 1.5μL 5μM A3A were added to each reaction to a final volume of 15μL (for a final concentration of 500nM/μL A3A per reaction). The deamination reactions were incubated at 37°C for 2h, purified with 1.6x homebrew SPRI beads, eluted in 9μL Low EDTA TE buffer.
To add the first PCR adaptor (P5), random priming reactions were performed for both WGBS and WG-bACE-seq library preparation. Deaminated DNA was first heated at 95°C using a thermocycler for 3min to denature and were immediately chilled on ice for 2min. 10μL enzyme mix (2μL Blue Buffer (Enzymatics Cat# B0110), 1μL 10mM dNTP (NEB Cat# N0447L), 1μL Klenow exo (50U/μL, Enzymatics Cat# P7010-HC-L), and 6μL water) was added to each well and reactions were mixed by vortexing. Plates or reactions were treated with the following program using a thermocycler: 4°C for 5min, ramp up to 25°C at 0.1°C/sec, 25°C for 5min, ramp up to 37°C at 0.1°C/sec, 37°C for 60min, 4°C forever. Following this, 2μL Exonuclease 1 (20U/μL, Enzymatics Cat# X8010L) and 1μL Shrimp Alkaline Phosphatase (rSAP) (1U/μL, NEB Cat# M0371L) was added to each reaction followed by vortexing and incubation in a thermocycler at 37°C for 30min followed by 4°C forever.
To add the second PCR adaptor (P7), the reactions were denatured in a thermocycler at 95°C for 3 min and subsequently chilled on ice for 2 min. 10.5μL Adaptase master mix (2μL Buffer G1, 2μL Reagent G2, 1.25μL Reagent G3, 0.5μL Enzyme G4, 0.5μL Enzyme G5, and 4.25μL Low EDTA TE buffer; Accel-NGS Adaptase Module for Single Cell Methyl-Seq Library Preparation, Swift Biosciences Cat# 33096) was added to each reaction, followed by vortexing. Reactions were incubated in a thermocycler at 37°C for 30min then 4°C forever. Subsequently, 30μL PCR mix (25μL KAPA HiFi HotStart ReadyMix, KAPA BIOSYSTEMS Cat# KK2602, 1μL 30μM P5 indexing primer, and 5μL 10μM P7 indexing primer) were added to each well, followed by mixing with vortexing.
Next, we perform qPCR to determine the optimal cycle number of amplifications for indexing PCR. Reactions were transferred to a thermocycler programmed with the following stages: 95°C for 2min, 98°C for 30sec, 12-15 cycles of [98°C for 15sec, 64°C for 30sec, 72°C for 2min] (optimal cycle number may vary between samples), 72°C for 5min, and 4°C forever. PCR products were cleaned with two rounds of 0.8x homebrew SPRI beads, concentration was determined via Qubit™ dsDNA High Sensitivity Assay Kit (Invitrogen Cat# Q32851), and library size and quality was determined via Bioanalyzer (Agilent High Sensitivity DNA Kit, Cat# 5067-4626). Reactions were sequenced on an Illumina MiSeq using the 300-cycle kit (v2) to determine the WGBS and WG-bACE-seq library quality. For WGBS and WG-bACE-seq sample details please refer to Table S1.
Single cell RNA sequencing
TET1 catKO (UCLA1 clone # 1102, 1105, 1312) and CTRL (UCLA1 clone # 1101, 1106, 1109) were differentiated as indicated above into iMeLCs and D4 aggregates for 10X Genomics analysis. hESCs, iMeLCs and D4 aggregates from all six lines (n= 18 samples total) were dissociated into single cells with 0.05% Trypsin-EDTA (GIBCO, Cat# 25300-054), strained with 40um cell strainer (Flacon, Cat# 352340), and washed 5 times with ice-cold DPBS with 0.04% BSA. Cell suspensions with viability over 70% was then proceeded to 10X Genomics GEM formation and library prep using the Chromium Single Cell 3’ Reagent Kits v3 (10X Genomics, Cat# PN-100075). For scRNAseq sample details please refer to Table S2.
Bulk RNA sequencing
Sorted cells or cell pellets were lysed in 350μL of RLT buffer (QIAGEN), and total RNA was extracted with RNeasy micro kit (QIAGEN, Cat# 74004). Libraries were constructed with SMARTer Stranded Total RNA-Seq Kit v3 - Pico Input Mammalian (Takara Cat# 634486) following the manufacturer’s instructions. For bulk RNAseq sample details please refer to Table S3.
Bioinformatic processing
ChIPseq analysis
The previously published ChIPseq data sets used in this study can be found in Table S4. FastQC was used to check the quality of the sequencing reads. After adaptor trimming with Cutadapt, read pairs with length above 30bp were kept, and aligned to the human reference genome GRCh38 using bowtie2. PCR duplicates were removed using Picard tools. Peak calling was performed with macs2.
Bulk RNAseq analysis
FastQC was used to check the quality of the sequencing reads. After adaptor trimming with Cutadapt,70 read pairs with length above 30bp were kept, and aligned to the human reference genome GRCh38 using STAR.71 Differentially expressed genes were called using edgeR package.72
scRNAseq analysis
Valid cells and UMIs were determined by UMI-tools73 to generate whitelist. Reads corresponding to valid barcodes were aligned to GRCh38 with STAR,71 and only uniquely mapped reads were kept for further analyses. Count matrices were generated by featureCounts v2.0.1 from the Subread R package,74 with UMIs info further appended to the alignment .bam file. Finally, the count matrix of all valid cells was generated with UMI-tools count function.
bACEseq and WGBS analysis
FastQC was used to check the quality of the sequencing reads. After adaptor trimming with Cutadapt,70 read pairs with length above 30bp were kept, and aligned to the 3-letter human reference genome GRCh38 using bsbolt Align with default setting.75 Methylation calling was done using bsbolt CallMethylation and only CpG sites with depth >= 4 were kept. Common CpG sites among each library were extracted with bsbolt AggrgateMatrix with --min-sample 1.0.
Quantification and statistical analysis
Student’s t-test was performed in Figures 2A, 2D, 2G, 3C, 4A, S2D, S2G, S3C, S3E, S3F, S5B (violin plot), and S5C (violin plot) to determine the significance. Fisher’s exact test was used in Figures 3G, S5B (stacked bar plot), and S5C (stacked bar plot) to justify the difference in ratio. ∗p < 0.05, ∗∗p < 0.01 and ∗∗∗p < 0.001. Bars graphs represent standard error of Mean (SEM).
Acknowledgments
We would like to thank Flow cytometry and Next Generation Sequencing cores at the UCLA Eli and Edythe Broad Center of Regenerative Medicine and Stem Cell Research Center (BSCRC) for help with cell sorting, sequencing and imaging. Also, we would like to thank the Translational Pathology Core Laboratory for help with histology and the UCLA MCDB/BSCRC Imaging core for confocal microscopy. This work was supported by funds from the NIH to ATC (R01HD079546), as well as research support from the UCLA CIRM-BSCRC Postdoctoral Fellowship to FMH. H.W. was supported by the National Human Genome Research Institute (NHGRI) grants R01-HG010646 and U01-HG012047. A.W. was supported by the NHGRI grant F31HG011429.
Author contributions
Conceptualization: A.T.C. and, F.M.H.
Methodology: F.M.H., E.B.F., A.W., H.W., and A.T.C.
Investigation: F.M.H. and Q.W.
Bioinformatic analysis: F.M.H.
Funding acquisition: A.T.C. and F.M.H.
Writing: F.M.H. and A.T.C.
Supervision: A.T.C.
Declaration of interests
A.T.C. is on the Board of the International Society for Stem Cell Research.
Inclusion and diversity
We support inclusive, diverse and equitable conduct of research.
Published: June 21, 2023
Footnotes
Supplemental information can be found online at https://doi.org/10.1016/j.isci.2023.107191.
Supplemental information
Data and code availability
-
•
RNAseq, scRNAseq, bACEseq and WGBS data in this study have been deposited at Gene Expression Omnibus (GEO) with the following accession numbers GEO: GSE217541, GSE217542, GSE218910 and GSE217954, and are publicly available as of the day of the publication.
-
•
All original code is available from the lead contact upon request.
-
•
Any additional information required to reanalyze the data reported in this paper is available from the lead contact upon request.
References
- 1.Wu X., Wang B., Dong Z., Zhou S., Liu Z., Shi G., Cao Y., Xu Y. A NANOS3 mutation linked to protein degradation causes premature ovarian insufficiency. Cell Death Dis. 2013;4:e825. doi: 10.1038/cddis.2013.368. [DOI] [PMC free article] [PubMed] [Google Scholar]
- 2.Santos M.G., Machado A.Z., Martins C.N., Domenice S., Costa E.M.F., Nishi M.Y., Ferraz-de-Souza B., Jorge S.A.C., Pereira C.A., Soardi F.C., et al. Homozygous Inactivating Mutation in NANOS3 in Two Sisters with Primary Ovarian Insufficiency. BioMed Res. Int. 2014;2014:787465. doi: 10.1155/2014/787465. [DOI] [PMC free article] [PubMed] [Google Scholar]
- 3.Pandolfi E.C., Hsu F.-M., Duhon M., Zheng Y., Goldsmith S., Fu J., Silber S.J., Clark A.T. In vitro germ cell induction from fertile and infertile monozygotic twin research participants. Cell Rep. Med. 2022;3:100782. doi: 10.1016/j.xcrm.2022.100782. [DOI] [PMC free article] [PubMed] [Google Scholar]
- 4.Hancock G.V., Wamaitha S.E., Peretz L., Clark A.T. Mammalian primordial germ cell specification. Development. 2021;148:dev189217. doi: 10.1242/dev.189217. [DOI] [PMC free article] [PubMed] [Google Scholar]
- 5.Chen D., Sun N., Hou L., Kim R., Faith J., Aslanyan M., Tao Y., Zheng Y., Fu J., Liu W., et al. Human Primordial Germ Cells Are Specified from Lineage-Primed Progenitors. Cell Rep. 2019;29:4568–4582.e5. doi: 10.1016/j.celrep.2019.11.083. [DOI] [PMC free article] [PubMed] [Google Scholar]
- 6.Tyser R.C.V., Mahammadov E., Nakanoh S., Vallier L., Scialdone A., Srinivas S. Single-cell transcriptomic characterization of a gastrulating human embryo. Nature. 2021;600:285–289. doi: 10.1038/s41586-021-04158-y. [DOI] [PMC free article] [PubMed] [Google Scholar]
- 7.Tsuda M., Sasaoka Y., Kiso M., Abe K., Haraguchi S., Kobayashi S., Saga Y. Conserved Role of nanos Proteins in Germ Cell Development. Science. 2003;301:1239–1241. doi: 10.1126/science.1085222. [DOI] [PubMed] [Google Scholar]
- 8.Irie N., Weinberger L., Tang W.W.C., Kobayashi T., Viukov S., Manor Y.S., Dietmann S., Hanna J.H., Surani M.A. SOX17 is a critical specifier of human primordial germ cell fate. Cell. 2015;160:253–268. doi: 10.1016/j.cell.2014.12.013. [DOI] [PMC free article] [PubMed] [Google Scholar]
- 9.Kojima Y., Sasaki K., Yokobayashi S., Sakai Y., Nakamura T., Yabuta Y., Nakaki F., Nagaoka S., Woltjen K., Hotta A., et al. Evolutionarily Distinctive Transcriptional and Signaling Programs Drive Human Germ Cell Lineage Specification from Pluripotent Stem Cells. Cell Stem Cell. 2017;21:517–532.e5. doi: 10.1016/j.stem.2017.09.005. [DOI] [PubMed] [Google Scholar]
- 10.Xiang X., Tao Y., DiRusso J., Hsu F.-M., Zhang J., Xue Z., Pontis J., Trono D., Liu W., Clark A.T. Human reproduction is regulated by retrotransposons derived from ancient Hominidae-specific viral infections. Nat. Commun. 2022;13:463. doi: 10.1038/s41467-022-28105-1. [DOI] [PMC free article] [PubMed] [Google Scholar]
- 11.Sasaki K., Yokobayashi S., Nakamura T., Okamoto I., Yabuta Y., Kurimoto K., Ohta H., Moritoki Y., Iwatani C., Tsuchiya H., et al. Robust In Vitro Induction of Human Germ Cell Fate from Pluripotent Stem Cells. Cell Stem Cell. 2015;17:178–194. doi: 10.1016/j.stem.2015.06.014. [DOI] [PubMed] [Google Scholar]
- 12.Chen D., Liu W., Lukianchikov A., Hancock G.V., Zimmerman J., Lowe M.G., Kim R., Galic Z., Irie N., Surani M.A., et al. Germline competency of human embryonic stem cells depends on eomesodermin. Biol. Reprod. 2017;97:850–861. doi: 10.1093/biolre/iox138. [DOI] [PMC free article] [PubMed] [Google Scholar]
- 13.Zheng Y., Xue X., Shao Y., Wang S., Esfahani S.N., Li Z., Muncie J.M., Lakins J.N., Weaver V.M., Gumucio D.L., Fu J. Controlled modelling of human epiblast and amnion development using stem cells. Nature. 2019;573:421–425. doi: 10.1038/s41586-019-1535-2. [DOI] [PMC free article] [PubMed] [Google Scholar]
- 14.Jo K., Teague S., Chen B., Khan H.A., Freeburne E., Li H., Li B., Ran R., Spence J.R., Heemskerk I. Efficient differentiation of human primordial germ cells through geometric control reveals a key role for Nodal signaling. Elife. 2022;11:e72811. doi: 10.7554/elife.72811. [DOI] [PMC free article] [PubMed] [Google Scholar]
- 15.Minn K.T., Fu Y.C., He S., Dietmann S., George S.C., Anastasio M.A., Morris S.A., Solnica-Krezel L. High-resolution transcriptional and morphogenetic profiling of cells from micropatterned human ESC gastruloid cultures. Elife. 2020;9:e59445. doi: 10.7554/elife.59445. [DOI] [PMC free article] [PubMed] [Google Scholar]
- 16.Guo F., Yan L., Guo H., Li L., Hu B., Zhao Y., Yong J., Hu Y., Wang X., Wei Y., et al. The Transcriptome and DNA Methylome Landscapes of Human Primordial Germ Cells. Cell. 2015;161:1437–1452. doi: 10.1016/j.cell.2015.05.015. [DOI] [PubMed] [Google Scholar]
- 17.Tang W.W.C., Dietmann S., Irie N., Leitch H.G., Floros V.I., Bradshaw C.R., Hackett J.A., Chinnery P.F., Surani M.A. A Unique Gene Regulatory Network Resets the Human Germline Epigenome for Development. Cell. 2015;161:1453–1467. doi: 10.1016/j.cell.2015.04.053. [DOI] [PMC free article] [PubMed] [Google Scholar]
- 18.Gkountela S., Zhang K.X., Shafiq T.A., Liao W.-W., Hargan-Calvopiña J., Chen P.-Y., Clark A.T. DNA Demethylation Dynamics in the Human Prenatal Germline. Cell. 2015;161:1425–1436. doi: 10.1016/j.cell.2015.05.012. [DOI] [PMC free article] [PubMed] [Google Scholar]
- 19.Seisenberger S., Andrews S., Krueger F., Arand J., Walter J., Santos F., Popp C., Thienpont B., Dean W., Reik W. The dynamics of genome-wide DNA methylation reprogramming in mouse primordial germ cells. Mol. Cell. 2012;48:849–862. doi: 10.1016/j.molcel.2012.11.001. [DOI] [PMC free article] [PubMed] [Google Scholar]
- 20.Seki Y., Hayashi K., Itoh K., Mizugaki M., Saitou M., Matsui Y. Extensive and orderly reprogramming of genome-wide chromatin modifications associated with specification and early development of germ cells in mice. Dev. Biol. 2005;278:440–458. doi: 10.1016/j.ydbio.2004.11.025. [DOI] [PubMed] [Google Scholar]
- 21.Sosa E., Chen D., Rojas E.J., Hennebold J.D., Peters K.A., Wu Z., Lam T.N., Mitchell J.M., Sukhwani M., Tailor R.C., et al. Differentiation of primate primordial germ cell-like cells following transplantation into the adult gonadal niche. Nat. Commun. 2018;9:5339. doi: 10.1038/s41467-018-07740-7. [DOI] [PMC free article] [PubMed] [Google Scholar]
- 22.Sasaki K., Nakamura T., Okamoto I., Yabuta Y., Iwatani C., Tsuchiya H., Seita Y., Nakamura S., Shiraki N., Takakuwa T., et al. The Germ Cell Fate of Cynomolgus Monkeys Is Specified in the Nascent Amnion. Dev. Cell. 2016;39:169–185. doi: 10.1016/j.devcel.2016.09.007. [DOI] [PubMed] [Google Scholar]
- 23.Hyldig S.M.W., Croxall N., Contreras D.A., Thomsen P.D., Alberio R. Epigenetic reprogramming in the porcine germ line. BMC Dev. Biol. 2011;11:11. doi: 10.1186/1471-213x-11-11. [DOI] [PMC free article] [PubMed] [Google Scholar]
- 24.Zhu Q., Sang F., Withey S., Tang W., Dietmann S., Klisch D., Ramos-Ibeas P., Zhang H., Requena C.E., Hajkova P., et al. Specification and epigenomic resetting of the pig germline exhibit conservation with the human lineage. Cell Rep. 2021;34:108735. doi: 10.1016/j.celrep.2021.108735. [DOI] [PMC free article] [PubMed] [Google Scholar]
- 25.Kagiwada S., Kurimoto K., Hirota T., Yamaji M., Saitou M. Replication-coupled passive DNA demethylation for the erasure of genome imprints in mice. EMBO J. 2013;32:340–353. doi: 10.1038/emboj.2012.331. [DOI] [PMC free article] [PubMed] [Google Scholar]
- 26.Hill P.W.S., Leitch H.G., Requena C.E., Sun Z., Amouroux R., Roman-Trufero M., Borkowska M., Terragni J., Vaisvila R., Linnett S., et al. Epigenetic reprogramming enables the primordial germ cell-to-gonocyte transition. Nature. 2018;555:392–396. doi: 10.1038/nature25964. [DOI] [PMC free article] [PubMed] [Google Scholar]
- 27.Yamaguchi S., Hong K., Liu R., Shen L., Inoue A., Diep D., Zhang K., Zhang Y. Tet1 controls meiosis by regulating meiotic gene expression. Nature. 2012;492:443–447. doi: 10.1038/nature11709. [DOI] [PMC free article] [PubMed] [Google Scholar]
- 28.Zhang W., Xia W., Wang Q., Towers A.J., Chen J., Gao R., Zhang Y., Yen C.A., Lee A.Y., Li Y., et al. Isoform Switch of TET1 Regulates DNA Demethylation and Mouse Development. Mol. Cell. 2016;64:1062–1073. doi: 10.1016/j.molcel.2016.10.030. [DOI] [PubMed] [Google Scholar]
- 29.Fabyanic E.B., Hu P., Qiu Q., Wang T., Berríos K.N., Flournoy J., Connolly D.R., Zhou Z., Kohil R.M., Wu H. Quantitative single cell 5hmC sequencing reveals non-canonical gene regulation by non-CG hydroxymethylation. bioRxiv. 2021 doi: 10.1101/2021.03.23.434325. Preprint at. [DOI] [Google Scholar]
- 30.Schutsky E.K., DeNizio J.E., Hu P., Liu M.Y., Nabel C.S., Fabyanic E.B., Hwang Y., Bushman F.D., Wu H., Kohli R.M. Nondestructive, base-resolution sequencing of 5-hydroxymethylcytosine using a DNA deaminase. Nat. Biotechnol. 2018;36:1083–1090. doi: 10.1038/nbt.4204. [DOI] [PMC free article] [PubMed] [Google Scholar]
- 31.Pastor W.A., Liu W., Chen D., Ho J., Kim R., Hunt T.J., Lukianchikov A., Liu X., Polo J.M., Jacobsen S.E., Clark A.T. TFAP2C regulates transcription in human naive pluripotency by opening enhancers. Nat. Cell Biol. 2018;20:553–564. doi: 10.1038/s41556-018-0089-0. [DOI] [PMC free article] [PubMed] [Google Scholar]
- 32.Nakamura T., Okamoto I., Sasaki K., Yabuta Y., Iwatani C., Tsuchiya H., Seita Y., Nakamura S., Yamamoto T., Saitou M. A developmental coordinate of pluripotency among mice, monkeys and humans. Nature. 2016;537:57–62. doi: 10.1038/nature19096. [DOI] [PubMed] [Google Scholar]
- 33.Chen D., Liu W., Zimmerman J., Pastor W.A., Kim R., Hosohama L., Ho J., Aslanyan M., Gell J.J., Jacobsen S.E., Clark A.T. The TFAP2C-Regulated OCT4 Naive Enhancer Is Involved in Human Germline Formation. Cell Rep. 2018;25:3591–3602.e5. doi: 10.1016/j.celrep.2018.12.011. [DOI] [PMC free article] [PubMed] [Google Scholar]
- 34.Ji X., Dadon D.B., Powell B.E., Fan Z.P., Borges-Rivera D., Shachar S., Weintraub A.S., Hnisz D., Pegoraro G., Lee T.I., et al. 3D Chromosome Regulatory Landscape of Human Pluripotent Cells. Cell Stem Cell. 2016;18:262–275. doi: 10.1016/j.stem.2015.11.007. [DOI] [PMC free article] [PubMed] [Google Scholar]
- 35.Tang W.W.C., Castillo-Venzor A., Gruhn W.H., Kobayashi T., Penfold C.A., Morgan M.D., Sun D., Irie N., Surani M.A. Sequential enhancer state remodelling defines human germline competence and specification. Nat. Cell Biol. 2022;24:448–460. doi: 10.1038/s41556-022-00878-z. [DOI] [PMC free article] [PubMed] [Google Scholar]
- 36.Dixon G., Pan H., Yang D., Rosen B.P., Jashari T., Verma N., Pulecio J., Caspi I., Lee K., Stransky S., et al. QSER1 protects DNA methylation valleys from de novo methylation. Science. 2021;372:eabd0875. doi: 10.1126/science.abd0875. [DOI] [PMC free article] [PubMed] [Google Scholar]
- 37.Floros V.I., Pyle A., Dietmann S., Wei W., Tang W.C.W., Irie N., Payne B., Capalbo A., Noli L., Coxhead J., et al. Segregation of mitochondrial DNA heteroplasmy through a developmental genetic bottleneck in human embryos. Nat. Cell Biol. 2018;20:144–151. doi: 10.1038/s41556-017-0017-8. [DOI] [PMC free article] [PubMed] [Google Scholar]
- 38.Sohni A., Bartoccetti M., Khoueiry R., Spans L., Vande Velde J., De Troyer L., Pulakanti K., Claessens F., Rao S., Koh K.P. Dynamic Switching of Active Promoter and Enhancer Domains Regulates Tet1 and Tet2 Expression during Cell State Transitions between Pluripotency and Differentiation. Mol. Cell Biol. 2015;35:1026–1042. doi: 10.1128/mcb.01172-14. [DOI] [PMC free article] [PubMed] [Google Scholar]
- 39.Kohli R.M., Zhang Y. TET enzymes, TDG and the dynamics of DNA demethylation. Nature. 2013;502:472–479. doi: 10.1038/nature12750. [DOI] [PMC free article] [PubMed] [Google Scholar]
- 40.He B., Zhang C., Zhang X., Fan Y., Zeng H., Liu J., Meng H., Bai D., Peng J., Zhang Q., et al. Tissue-specific 5-hydroxymethylcytosine landscape of the human genome. Nat. Commun. 2021;12:4249. doi: 10.1038/s41467-021-24425-w. [DOI] [PMC free article] [PubMed] [Google Scholar]
- 41.Gell J.J., Liu W., Sosa E., Chialastri A., Hancock G., Tao Y., Wamaitha S.E., Bower G., Dey S.S., Clark A.T. An Extended Culture System that Supports Human Primordial Germ Cell-like Cell Survival and Initiation of DNA Methylation Erasure. Stem Cell Rep. 2020;14:433–446. doi: 10.1016/j.stemcr.2020.01.009. [DOI] [PMC free article] [PubMed] [Google Scholar]
- 42.Nakagawa M., Taniguchi Y., Senda S., Takizawa N., Ichisaka T., Asano K., Morizane A., Doi D., Takahashi J., Nishizawa M., et al. A novel efficient feeder-free culture system for the derivation of human induced pluripotent stem cells. Sci. Rep. 2014;4:3594. doi: 10.1038/srep03594. [DOI] [PMC free article] [PubMed] [Google Scholar]
- 43.Hackett J.A., Sengupta R., Zylicz J.J., Murakami K., Lee C., Down T.A., Surani M.A. Germline DNA demethylation dynamics and imprint erasure through 5-hydroxymethylcytosine. Science (New York, N.Y.) 2013;339:448–452. doi: 10.1126/science.1229277. [DOI] [PMC free article] [PubMed] [Google Scholar]
- 44.Yamaguchi S., Shen L., Liu Y., Sendler D., Zhang Y. Role of Tet1 in erasure of genomic imprinting. Nature. 2013;504:460–464. doi: 10.1038/nature12805. [DOI] [PMC free article] [PubMed] [Google Scholar]
- 45.SanMiguel J.M., Abramowitz L.K., Bartolomei M.S. Imprinted gene dysregulation in a Tet1 null mouse model is stochastic and variable in the germline and offspring. Development. 2018;145:dev160622. doi: 10.1242/dev.160622. [DOI] [PMC free article] [PubMed] [Google Scholar]
- 46.Vincent J.J., Huang Y., Chen P.-Y., Feng S., Calvopiña J.H., Nee K., Lee S.A., Le T., Yoon A.J., Faull K., et al. Stage-specific roles for tet1 and tet2 in DNA demethylation in primordial germ cells. Cell Stem Cell. 2013;12:470–478. doi: 10.1016/j.stem.2013.01.016. [DOI] [PMC free article] [PubMed] [Google Scholar]
- 47.Lawson K.A., Dunn N.R., Roelen B.A., Zeinstra L.M., Davis A.M., Wright C.V., Korving J.P., Hogan B.L. Bmp4 is required for the generation of primordial germ cells in the mouse embryo. Gene Dev. 1999;13:424–436. doi: 10.1101/gad.13.4.424. [DOI] [PMC free article] [PubMed] [Google Scholar]
- 48.Saitou M., Barton S.C., Surani M.A. A molecular programme for the specification of germ cell fate in mice. Nature. 2002;418:293–300. doi: 10.1038/nature00927. [DOI] [PubMed] [Google Scholar]
- 49.Ohinata Y., Payer B., O’Carroll D., Ancelin K., Ono Y., Sano M., Barton S.C., Obukhanych T., Nussenzweig M., Tarakhovsky A., et al. Blimp1 is a critical determinant of the germ cell lineage in mice. Nature. 2005;436:207–213. doi: 10.1038/nature03813. [DOI] [PubMed] [Google Scholar]
- 50.Kobayashi T., Surani M.A. On the Origin of the Human Germline. Development. 2018;145:dev150433. doi: 10.1242/dev.150433. [DOI] [PubMed] [Google Scholar]
- 51.Irie N., Tang W.W.C., Azim Surani M. Germ cell specification and pluripotency in mammals: a perspective from early embryogenesis. Reprod. Med. Biol. 2014;13:203–215. doi: 10.1007/s12522-014-0184-2. [DOI] [PMC free article] [PubMed] [Google Scholar]
- 52.Kobayashi T., Castillo-Venzor A., Penfold C.A., Morgan M., Mizuno N., Tang W.W.C., Osada Y., Hirao M., Yoshida F., Sato H., et al. Tracing the emergence of primordial germ cells from bilaminar disc rabbit embryos and pluripotent stem cells. Cell Rep. 2021;37:109812. doi: 10.1016/j.celrep.2021.109812. [DOI] [PubMed] [Google Scholar]
- 53.Li Z., Fang F., Long Y., Zhao Q., Wang X., Ye Z., Meng T., Gu X., Xiang W., Xiong C., Li H. The balance between NANOG and SOX17 mediated by TET proteins regulates specification of human primordial germ cell fate. Cell Biosci. 2022;12:181. doi: 10.1186/s13578-022-00917-0. [DOI] [PMC free article] [PubMed] [Google Scholar]
- 54.Frauer C., Rottach A., Meilinger D., Bultmann S., Fellinger K., Hasenöder S., Wang M., Qin W., Söding J., Spada F., Leonhardt H. Different Binding Properties and Function of CXXC Zinc Finger Domains in Dnmt1 and Tet1. PLoS One. 2011;6:e16627. doi: 10.1371/journal.pone.0016627. [DOI] [PMC free article] [PubMed] [Google Scholar]
- 55.Greer C.B., Wright J., Weiss J.D., Lazarenko R.M., Moran S.P., Zhu J., Chronister K.S., Jin A.Y., Kennedy A.J., Sweatt J.D., Kaas G.A. Tet1 Isoforms Differentially Regulate Gene Expression, Synaptic Transmission, and Memory in the Mammalian Brain. J. Neurosci. 2021;41:578–593. doi: 10.1523/jneurosci.1821-20.2020. [DOI] [PMC free article] [PubMed] [Google Scholar]
- 56.Koh K.P., Yabuuchi A., Rao S., Huang Y., Cunniff K., Nardone J., Laiho A., Tahiliani M., Sommer C.A., Mostoslavsky G., et al. Tet1 and Tet2 Regulate 5-Hydroxymethylcytosine Production and Cell Lineage Specification in Mouse Embryonic Stem Cells. Cell Stem Cell. 2011;8:200–213. doi: 10.1016/j.stem.2011.01.008. [DOI] [PMC free article] [PubMed] [Google Scholar]
- 57.Hinnebusch A.G., Ivanov I.P., Sonenberg N. Translational control by 5’-untranslated regions of eukaryotic mRNAs. Science (New York, N.Y.) 2016;352:1413–1416. doi: 10.1126/science.aad9868. [DOI] [PMC free article] [PubMed] [Google Scholar]
- 58.Sybirna A., Tang W.W.C., Pierson Smela M., Dietmann S., Gruhn W.H., Brosh R., Surani M.A. A critical role of PRDM14 in human primordial germ cell fate revealed by inducible degrons. Nat. Commun. 2020;11:1282. doi: 10.1038/s41467-020-15042-0. [DOI] [PMC free article] [PubMed] [Google Scholar]
- 59.Okashita N., Kumaki Y., Ebi K., Nishi M., Okamoto Y., Nakayama M., Hashimoto S., Nakamura T., Sugasawa K., Kojima N., et al. PRDM14 promotes active DNA demethylation through the Ten-eleven translocation (TET)-mediated base excision repair pathway in embryonic stem cells. Development. 2014;141:269–280. doi: 10.1242/dev.099622. [DOI] [PubMed] [Google Scholar]
- 60.Costa Y., Ding J., Theunissen T.W., Faiola F., Hore T.A., Shliaha P.V., Fidalgo M., Saunders A., Lawrence M., Dietmann S., et al. Nanog-dependent function of Tet1 and Tet2 in establishment of pluripotency. Nature. 2013;495:370–374. doi: 10.1038/nature11925. [DOI] [PMC free article] [PubMed] [Google Scholar]
- 61.Xu Y., Wu F., Tan L., Kong L., Xiong L., Deng J., Barbera A.J., Zheng L., Zhang H., Huang S., et al. Genome-wide Regulation of 5hmC, 5mC, and Gene Expression by Tet1 Hydroxylase in Mouse Embryonic Stem Cells. Mol. Cell. 2011;42:451–464. doi: 10.1016/j.molcel.2011.04.005. [DOI] [PMC free article] [PubMed] [Google Scholar]
- 62.Mellén M., Ayata P., Dewell S., Kriaucionis S., Heintz N. MeCP2 Binds to 5hmC Enriched within Active Genes and Accessible Chromatin in the Nervous System. Cell. 2012;151:1417–1430. doi: 10.1016/j.cell.2012.11.022. [DOI] [PMC free article] [PubMed] [Google Scholar]
- 63.Deng S., Zhang J., Su J., Zuo Z., Zeng L., Liu K., Zheng Y., Huang X., Bai R., Zhuang L., et al. RNA m6A regulates transcription via DNA demethylation and chromatin accessibility. Nat. Genet. 2022;54:1427–1437. doi: 10.1038/s41588-022-01173-1. [DOI] [PubMed] [Google Scholar]
- 64.Wu F., Liufu Z., Liu Y., Guo L., Wu J., Cao S., Qin Y., Guo N., Fu Y., Liu H., et al. Species-specific rewiring of definitive endoderm developmental gene activation via endogenous retroviruses through TET1-mediated demethylation. Cell Rep. 2022;41:111791. doi: 10.1016/j.celrep.2022.111791. [DOI] [PubMed] [Google Scholar]
- 65.Verma N., Pan H., Doré L.C., Shukla A., Li Q.V., Pelham-Webb B., Teijeiro V., González F., Krivtsov A., Chang C.-J., et al. TET proteins safeguard bivalent promoters from de novo methylation in human embryonic stem cells. Nat. Genet. 2018;50:83–95. doi: 10.1038/s41588-017-0002-y. [DOI] [PMC free article] [PubMed] [Google Scholar]
- 66.Ito S., D’Alessio A.C., Taranova O.V., Hong K., Sowers L.C., Zhang Y. Role of Tet proteins in 5mC to 5hmC conversion, ES-cell self-renewal and inner cell mass specification. Nature. 2010;466:1129–1133. doi: 10.1038/nature09303. [DOI] [PMC free article] [PubMed] [Google Scholar]
- 67.Tu J., Ng S.H., Luk A.C.S., Liao J., Jiang X., Feng B., Lun Mak K.K., Rennert O.M., Chan W.-Y., Lee T.-L. MicroRNA-29b/Tet1 regulatory axis epigenetically modulates mesendoderm differentiation in mouse embryonic stem cells. Nucleic Acids Res. 2015;43:7805–7822. doi: 10.1093/nar/gkv653. [DOI] [PMC free article] [PubMed] [Google Scholar]
- 68.Vallier L., Mendjan S., Brown S., Chng Z., Teo A., Smithers L.E., Trotter M.W.B., Cho C.H.-H., Martinez A., Rugg-Gunn P., et al. Activin/Nodal signalling maintains pluripotency by controlling Nanog expression. Development. 2009;136:1339–1349. doi: 10.1242/dev.033951. [DOI] [PMC free article] [PubMed] [Google Scholar]
- 69.Diaz Perez S.V., Kim R., Li Z., Marquez V.E., Patel S., Plath K., Clark A.T. Derivation of new human embryonic stem cell lines reveals rapid epigenetic progression in vitro that can be prevented by chemical modification of chromatin. Hum. Mol. Genet. 2012;21:751–764. doi: 10.1093/hmg/ddr506. [DOI] [PMC free article] [PubMed] [Google Scholar]
- 70.Martin M. Cutadapt removes adapter sequences from high-throughput sequencing reads. EMBnet. J. 2011;17:10–12. doi: 10.14806/ej.17.1.200. [DOI] [Google Scholar]
- 71.Dobin A., Davis C.A., Schlesinger F., Drenkow J., Zaleski C., Jha S., Batut P., Chaisson M., Gingeras T.R. STAR: ultrafast universal RNA-seq aligner. Bioinformatics. 2013;29:15–21. doi: 10.1093/bioinformatics/bts635. [DOI] [PMC free article] [PubMed] [Google Scholar]
- 72.Robinson M.D., McCarthy D.J., Smyth G.K. edgeR: a Bioconductor package for differential expression analysis of digital gene expression data. Bioinformatics. 2010;26:139–140. doi: 10.1093/bioinformatics/btp616. [DOI] [PMC free article] [PubMed] [Google Scholar]
- 73.Smith T., Heger A., Sudbery I. UMI-tools: modeling sequencing errors in Unique Molecular Identifiers to improve quantification accuracy. Genome Res. 2017;27:491–499. doi: 10.1101/gr.209601.116. [DOI] [PMC free article] [PubMed] [Google Scholar]
- 74.Liao Y., Smyth G.K., Shi W. The Subread aligner: fast, accurate and scalable read mapping by seed-and-vote. Nucleic Acids Res. 2013;41:e108. doi: 10.1093/nar/gkt214. [DOI] [PMC free article] [PubMed] [Google Scholar]
- 75.Farrell C., Thompson M., Tosevska A., Oyetunde A., Pellegrini M. BiSulfite Bolt: A bisulfite sequencing analysis platform. GigaScience. 2021;10:giab033. doi: 10.1093/gigascience/giab033. [DOI] [PMC free article] [PubMed] [Google Scholar]
Associated Data
This section collects any data citations, data availability statements, or supplementary materials included in this article.
Supplementary Materials
Data Availability Statement
-
•
RNAseq, scRNAseq, bACEseq and WGBS data in this study have been deposited at Gene Expression Omnibus (GEO) with the following accession numbers GEO: GSE217541, GSE217542, GSE218910 and GSE217954, and are publicly available as of the day of the publication.
-
•
All original code is available from the lead contact upon request.
-
•
Any additional information required to reanalyze the data reported in this paper is available from the lead contact upon request.