

Abstract
Nanoscale chromatin organization regulates gene expression. While chromatin is dramatically reprogrammed during zygotic genome activation (ZGA), the organization of chromatin regulatory factors during this universal process remains unclear. Here, we developed chromatin expansion microscopy (ChromExM) to visualize chromatin, transcription, and transcription factors in vivo. ChromExM of embryos during ZGA revealed how the pioneer factor Nanog interacts with nucleosomes and RNA Polymerase II (Pol II), providing direct visualization of transcriptional elongation as string-like nanostructures. Blocking elongation led to more Pol II particles clustered around Nanog, with Pol II stalled at promoters and Nanog-bound enhancers. This led to a new model termed kiss-and-kick, where enhancer-promoter contacts are transient and released by transcriptional elongation. Our results demonstrate that ChromExM is broadly applicable to study nanoscale nuclear organization.
One-Sentence Summary:
In vivo nanoscale imaging with chromatin expansion microscopy reveals principles of pioneer-factor controlled transcription
Upon fertilization, embryos undergo transcriptional and cellular reprogramming to form a totipotent zygote (1–5). This reprogramming results in the transcriptional activation of genes required to initiate zygotic development. During this process, pioneer factors open the chromatin, recruit RNA Polymerase II (Pol II), and activate transcription (6–9). However, the molecular organization of these factors during genome activation remains unclear. Nanoscale visualization of transcription and chromatin using current super-resolution approaches is limited by their ability to analyze nanoscale structure at the whole-nucleus scale, particularly in vivo. Alternatively, chromatin electron microscopy and tomography (ChromEMT) (10) provides nanometer resolution but lacks the multi-label imaging required to identify specific regulatory interactions. To overcome these limitations, we combined pan-expansion microscopy (pan-ExM) (11) with multi-modal protein, RNA, and DNA labeling to resolve the nanoscale organization of chromatin, transcriptional activators, and transcription in a method we term Chromatin Expansion Microscopy (ChromExM). We applied ChromExM to uncover how the pioneer factor Nanog interacts with chromatin and recruits Pol II to activate transcription during genome reprogramming after fertilization.
Nanog forms DNA-bound foci associated with Pol II recruitment and transcription
In zebrafish, Nanog is required for genome reprogramming and transcriptional activation after fertilization (8, 9, 12, 13). To investigate the molecular organization of transcriptional activation during genome activation, we analyzed the spatial organization of Nanog from the 32 to 512 cell stage when transcription is activated. Live imaging of Nanog using a LlamaTag (14) revealed that Nanog formed clusters associated with the very early transcription of microRNA-430 (miR-430) (47% of miR-430 transcription sites contain Nanog foci) (Fig. 1A and B; Fig S1A to C) (15–18). Quantification of Nanog fluorescence revealed that these foci increased the local Nanog concentration 2.5–4 fold (Fig. S1B), consistent with the occurrence of transcription factor and co-activator foci or hubs observed during embryogenesis and in cultured cells (19–28). We also observed that Nanog foci were associated with Pol II elongation, consistent with previous observations (16, 17, 22, 25, 27–30). Within a cell cycle, the formation of Nanog foci preceded Pol II elongation (Fig. 1C and D), as visualized with a genetically encoded mintbody that detects elongating Pol II (Pol II pSer2) (25). After Pol II elongation begins, Nanog foci become less intense, suggesting that Nanog clusters may be evicted or dispersed after initiating transcription. In maternal-zygotic Nanog mutants (MZnanog−/−)(8), Pol II foci are lost and overall levels are reduced at the 256-cell stage, confirming Nanog’s role in Pol II recruitment and transcriptional activation (Fig. S1D and E) (28). Mutating the Nanog homeodomain to prevent DNA binding abolished Nanog foci, indicating that they form in a DNA-binding dependent manner, rather than strictly through protein-protein interactions (Fig. S1F to I). Thus, Nanog forms DNA-bound hubs that increase its local concentration and are associated with Pol II recruitment and transcriptional activation during genome reprogramming.
Figure 1. Nanog forms DNA-bound foci associated with zygotic transcription.
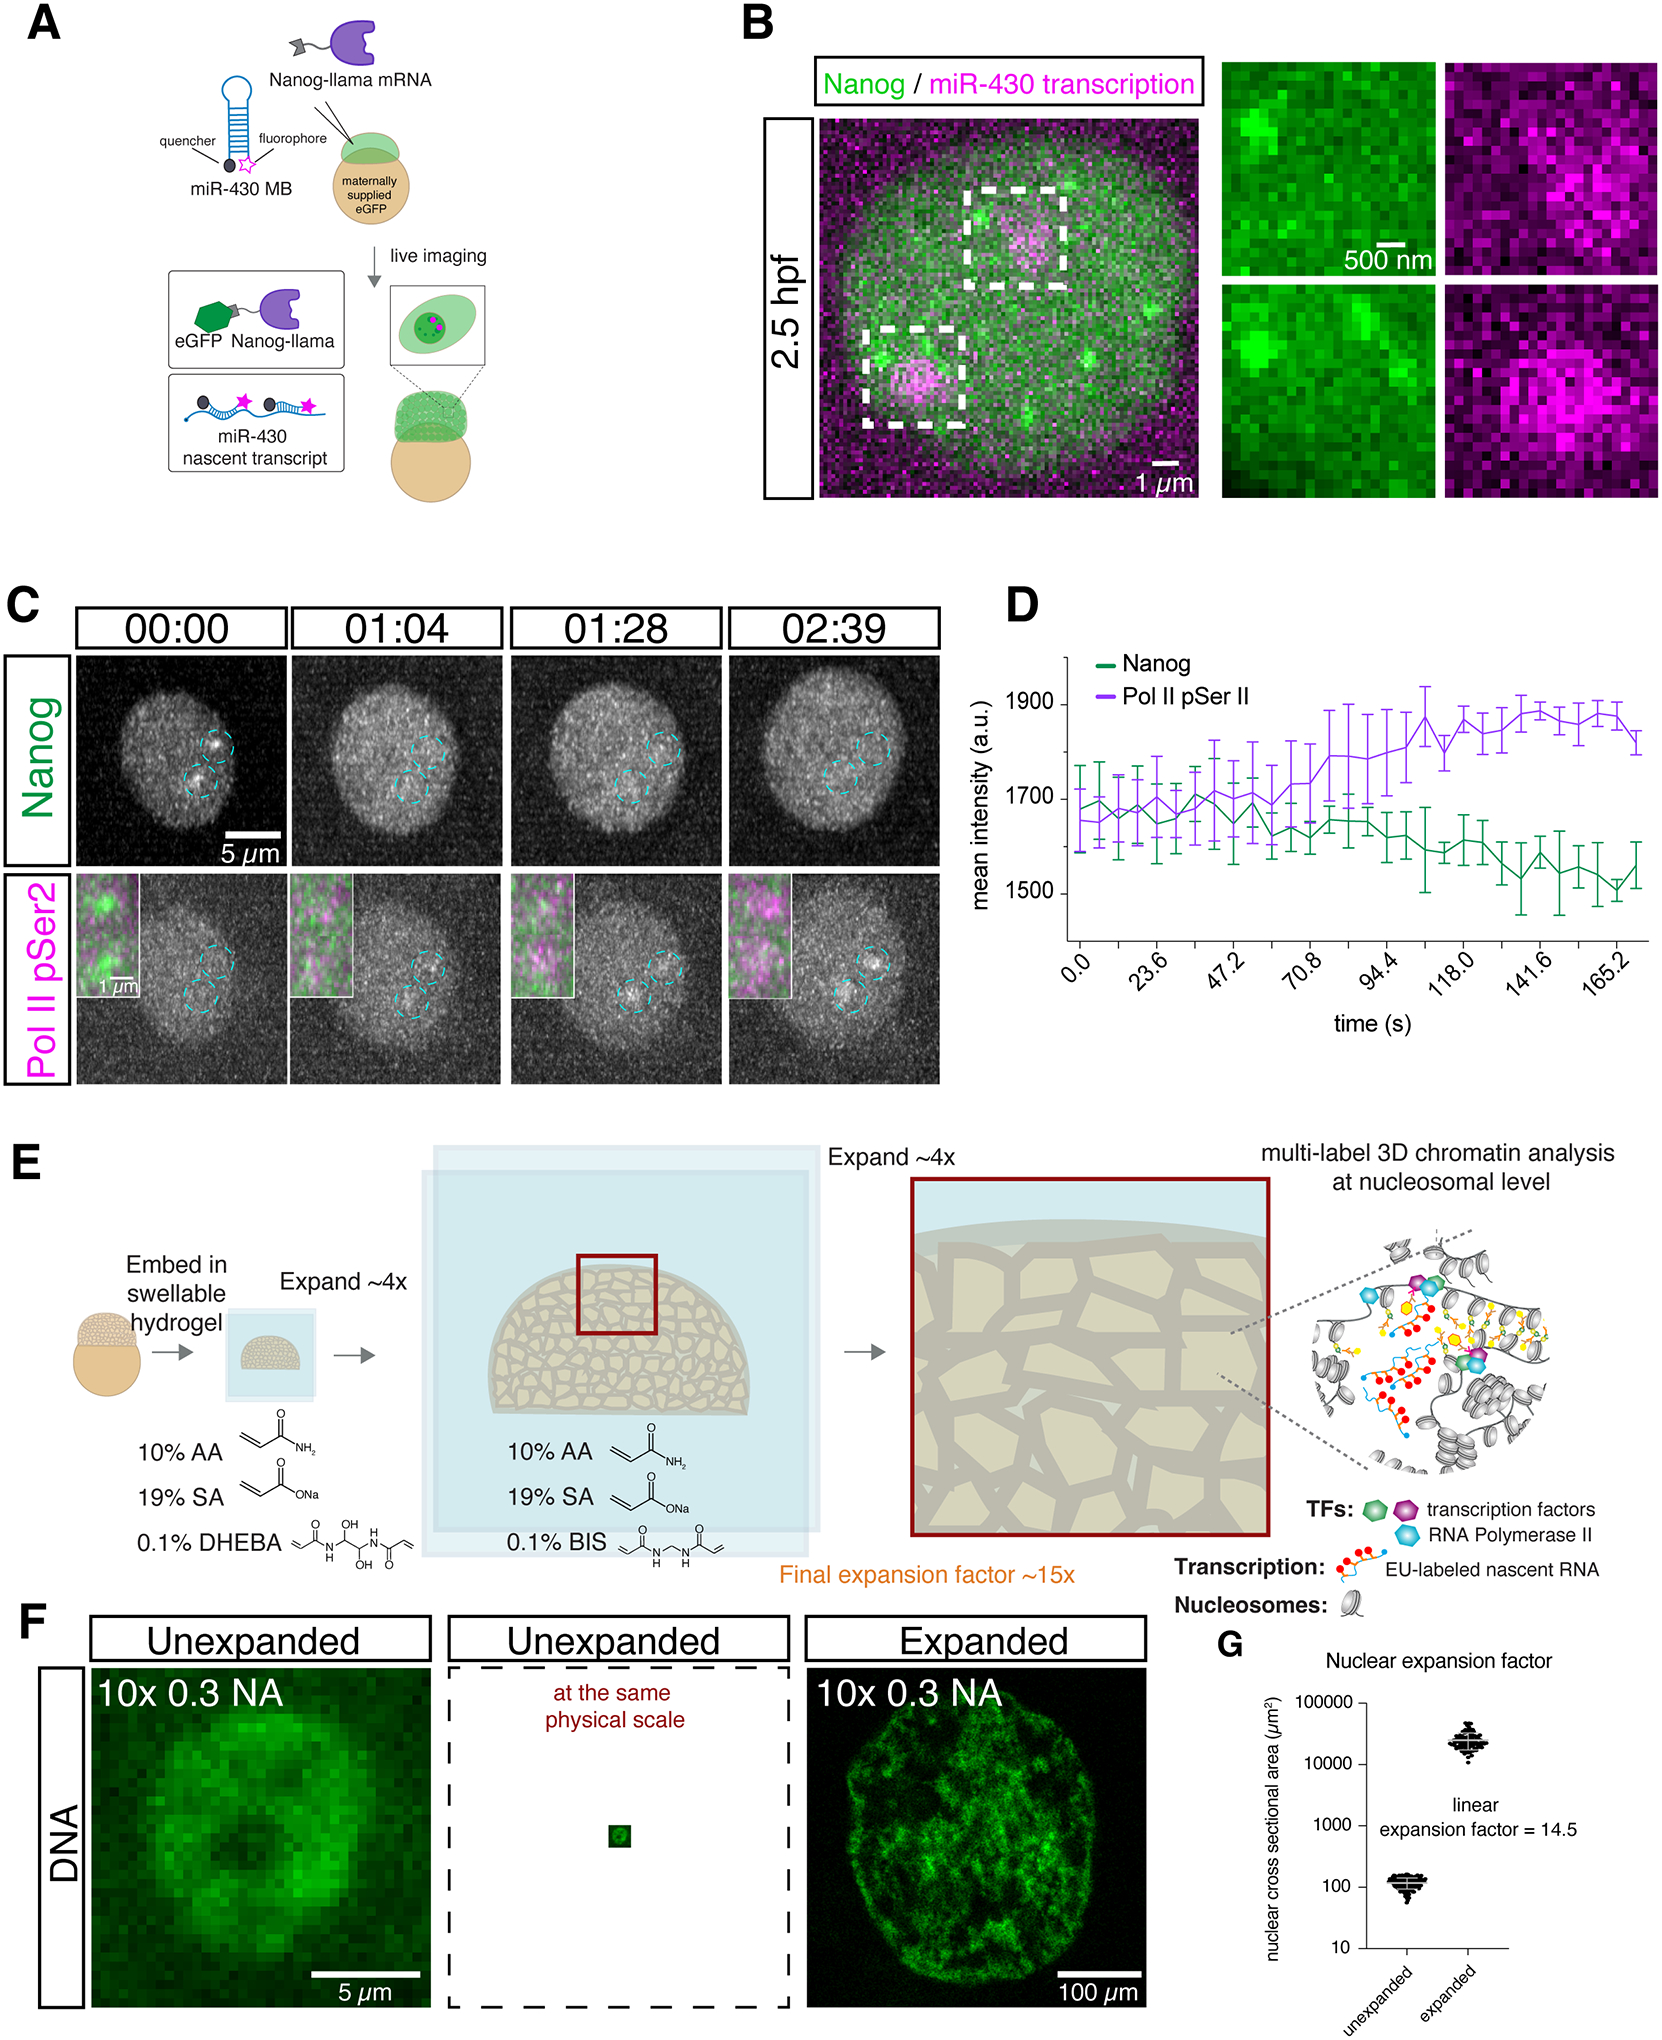
(A) Schematic detailing how Nanog and miR-430 transcription were visualized in living embryos. (B) Live imaging shows Nanog foci associated with miR-430 transcription at 2.5 hpf. n = 10 nuclei. (C) Live imaging shows Nanog foci are formed and disappear prior to Pol II elongation at 2.75 hpf. n = 2 nuclei, 1 embryo (D) Quantification of fluorescence intensity in (C). (E) Schematic showing the process of ChromExM and expected results. AA, acrylamide; SA, sodium acrylate, DHEBA, N,N’-(1,2-dihydroxyethylene)bisacrylamide; BIS, N,N′-methylenebis(acrylamide). (F) Unexpanded and expanded nuclei from two unrelated embryos stained for DNA and imaged with a 10× 0.3 NA objective demonstrate the enhanced resolution provided by ChromExM. (G) Quantification of the nuclear expansion factor determined by measuring the nuclear cross-sectional area. n = 171 unexpanded nuclei from 3 embryos and 104 expanded nuclei from 17 embryos.
Chromatin Expansion Microscopy achieves single-nucleosome resolution while preserving chromatin organization across scales
Next, we aimed to determine the underlying nanostructure and molecular organization of Nanog and RNA Pol II during chromatin reprogramming and transcriptional activation. To this end, we adapted the concept of pan-ExM (11) to include metabolic labeling of DNA and nascent RNA, along with antibody labelling to visualize the chromatin with nanometer resolution, hereafter termed ChromExM (Fig. 1E and F). ChromExM involves the direct anchoring of biomolecules to a swellable hydrogel via the addition of acryloyl groups, allowing protein and nucleic acid retention during expansion (11). We achieved an average ~15x linear expansion factor of the nuclei in embryos (Fig. 1G), corresponding to a ~4,000-fold increase in nuclear volume and providing ~15 nm lateral resolution on a confocal microscope and ~3 nm in stimulated emission depletion (STED) super-resolution microscopy (Fig. 2).
Figure 2. ChromExM preserves chromatin architecture and resolves chromatin fibers and individual nucleosomes.

(A) Schematic showing how the chromatin is painted with photocleaved (PC) stripes to detect perturbations after expansion. (B) Expanded nucleus showing that photocleaved stripes remain parallel and sharp after expansion. The image is a maximum intensity projection of several z-slices. n = 20 nuclei from 3 embryos. (C) Quantification of relative inter-strip distance in photocleaved stripes versus a simulated control (Methods) shows minimal variation in the spacing between stripes after expansion. n = 3 nuclei from 3 embryos. (D) Schematic of in vitro assembled nucleosome arrays. (E) ChromExM image (left) showing nucleosome arrays with H3 staining and electron microscopy image of nucleosome arrays with a similar conformation as the expanded array. Red scale bar is not corrected for the expansion factor. (F) ChromExM image with metabolic DNA labelling at 2.75 hpf showing individual chromatin fibers and a schematic of chromatin. n = 6 nuclei, 5 embryos. (G) H3 staining imaged with confocal and STED microscopy resolves individual nucleosomes. n = 468 nucleosomes; 3 nuclei from 2 embryos.
Previous studies have reported conflicting results regarding the isotropy of ~4–8x expansion of chromatin (31, 32). To address whether chromatin structure is perturbed by physical expansion, we developed an assay in which a pattern of parallel stripes is photocleaved into biotin labeled DNA before expansion and visualized after expansion (Fig. 2A; Fig. S2A and B; Methods). If chromatin expands isotropically, then the relative position of chromatin chains should be preserved and the photocleaved stripes will remain parallel after expansion. We observed that stripes generated before expansion remain parallel after expansion and show no significant variation in their spacing when compared to simulated perfectly straight stripes generated as controls (Fig. 2B and C; Fig. S2C and D; Methods). This indicates that chromatin expands isotropically and the relative spatial organization of chromatin is preserved across the nucleus at sub-micron to global length scales by ChromExM (Fig. 2B and C).
Preservation of chromatin structure at the nucleosomal level depends, in part, on the mesh size of the hydrogel, which impacts the positional uncertainty and anchoring frequency of biomolecules to the gel (33). To determine whether chromatin structure is maintained at the nucleosome scale, we measured the mesh size of our swellable hydrogel by assessing the mobility of differently sized molecules in the gel using fluorescence recovery after photobleaching (FRAP) (Fig. S3A to E) (34). We observed that a 3,000 molecular weight (MW) dextran recovered quickly after photobleaching with a diffusion coefficient of 0.72 μm2/s, but histone H1 and a 2,000,000 MW dextran did not recover (Fig. S3A to E). These results demonstrate that the mesh size is small enough to prevent rapid diffusion of the ~32 kDa H1 protein, suggesting that the gel polymer can anchor the chromatin with subnucleosomal resolution. To functionally test this, we compared ChomExM and electron microscopy (EM) of in vitro assembled nucleosome arrays containing 13 nucleosomes along 2.7 kb of DNA (Fig. 2D and E; Fig. S3F and G) (35). We observed a similar organization of nucleosome arrays in ChromExM and unexpanded EM, with an average of 12.7 and 12.5 nucleosomes detected per array, respectively (Fig. 2E and Fig. S3F to H). Taken together, these results demonstrate that the local chromatin organization can be maintained at the nucleosomal scale during ChromExM.
To visualize chromatin, we metabolically labeled the DNA with f-ara-EdU (36) followed by fluorescent picolyl azide detection after expansion (37). This approach was more photostable than the intercalating dye SYTOX Green and increased the labelling intensity ~45-fold compared to standard azides (Fig. S3J to L), improving chromatin labeling to overcome the effects molecular decrowding and reduced brightness caused by the ~4,000 fold volumetric expansion.
This approach resolved chromatin fibers in the nucleus (Fig. 2F) with similar diameters (<12 nm to 40 nm) to those determined by electron microscopy (10). Nucleosomes are ~10 nm in size, which is at the resolution limit of confocal microscopy after ChromExM. Therefore, we performed STED microscopy with ChromExM to improve the resolution by an additional factor of ~five, reaching <3 nm lateral resolution, and demonstrating that ChromExM can resolve individual nucleosomes using H3 immunostaining and confocal microscopy (~80% of nucleosomes detected by confocal are individual nucleosomes by STED) (Fig. 2G and Fig. S3I). The combination of ChromExM with STED provides fast multimodal molecular imaging of the chromatin, approaching <3nm resolution.
Visualizing interactions between nucleosomes and the pioneer factor Nanog
We used ChromExM to determine the underlying nanoscale organization of transcription hubs during genome activation by visualizing the molecular scale interactions between the pioneer factor Nanog (8, 9), nucleosomes, and Pol II at 4 hpf. To analyze how Nanog interacts with chromatin, we co-stained for Nanog and H3, visualizing an average of 88,619 and 104,347 individual particles of Nanog and H3 per nucleus, respectively, with a false-detection rate of 0.05% for identifying Nanog particles (Fig. 3A to D; Fig. S4A to G; movie S1). Quantitative analysis of the spatial organization of Nanog and H3 particles revealed several classes of Nanog-nucleosome conformations (Fig. 3B to G; Fig. S4A to E and H to I; Methods). In the first class, Nanog was closely associated with nucleosomes (< 20 nm distance between Nanog and H3), with 2.0% of H3, and 3.3% of Nanog particles falling into this group (Fig. 3B and E; Fig. S4A), likely indicating a bound state where Nanog is potentially initiating chromatin opening. In the second class, a subset of Class 1, Nanog clusters were bound to a nucleosome (>1 Nanog particle within 20 nm and additional Nanog particles within 50 nm), representing recruitment of multiple Nanog particles to the same chromatin regions (0.06% of H3, 0.2% of Nanog) (Fig. 3C and F; Fig. S4B and B’). The third class contained Nanog particles distantly associated with nucleosomes (20–100nm away from each other) (26.9% of H3, 39.7% of Nanog), potentially indicating chromatin regions already opened by Nanog (Fig. 3D and G; Fig. S4C). The fourth class contained nucleosomes and Nanog not closely associated with each other (>100 nm away) (71.2% of H3, 57.0% of Nanog) (Fig. S4D and E). Our analysis identified 88,619 Nanog particles per nucleus, which is consistent with the number of ChIP-seq peaks (~40,000) identified at a similar stage in zebrafish (8, 38). These measurements are likely the lower bounds of Nanog-nucleosome interactions considering that some nucleosomes may not be detected here. Taken together, we are able to characterize pioneer factor-nucleosome organization during chromatin opening.
Figure 3. Visualizing the nanoscale organization of Nanog, nucleosomes, Pol II, and transcription.
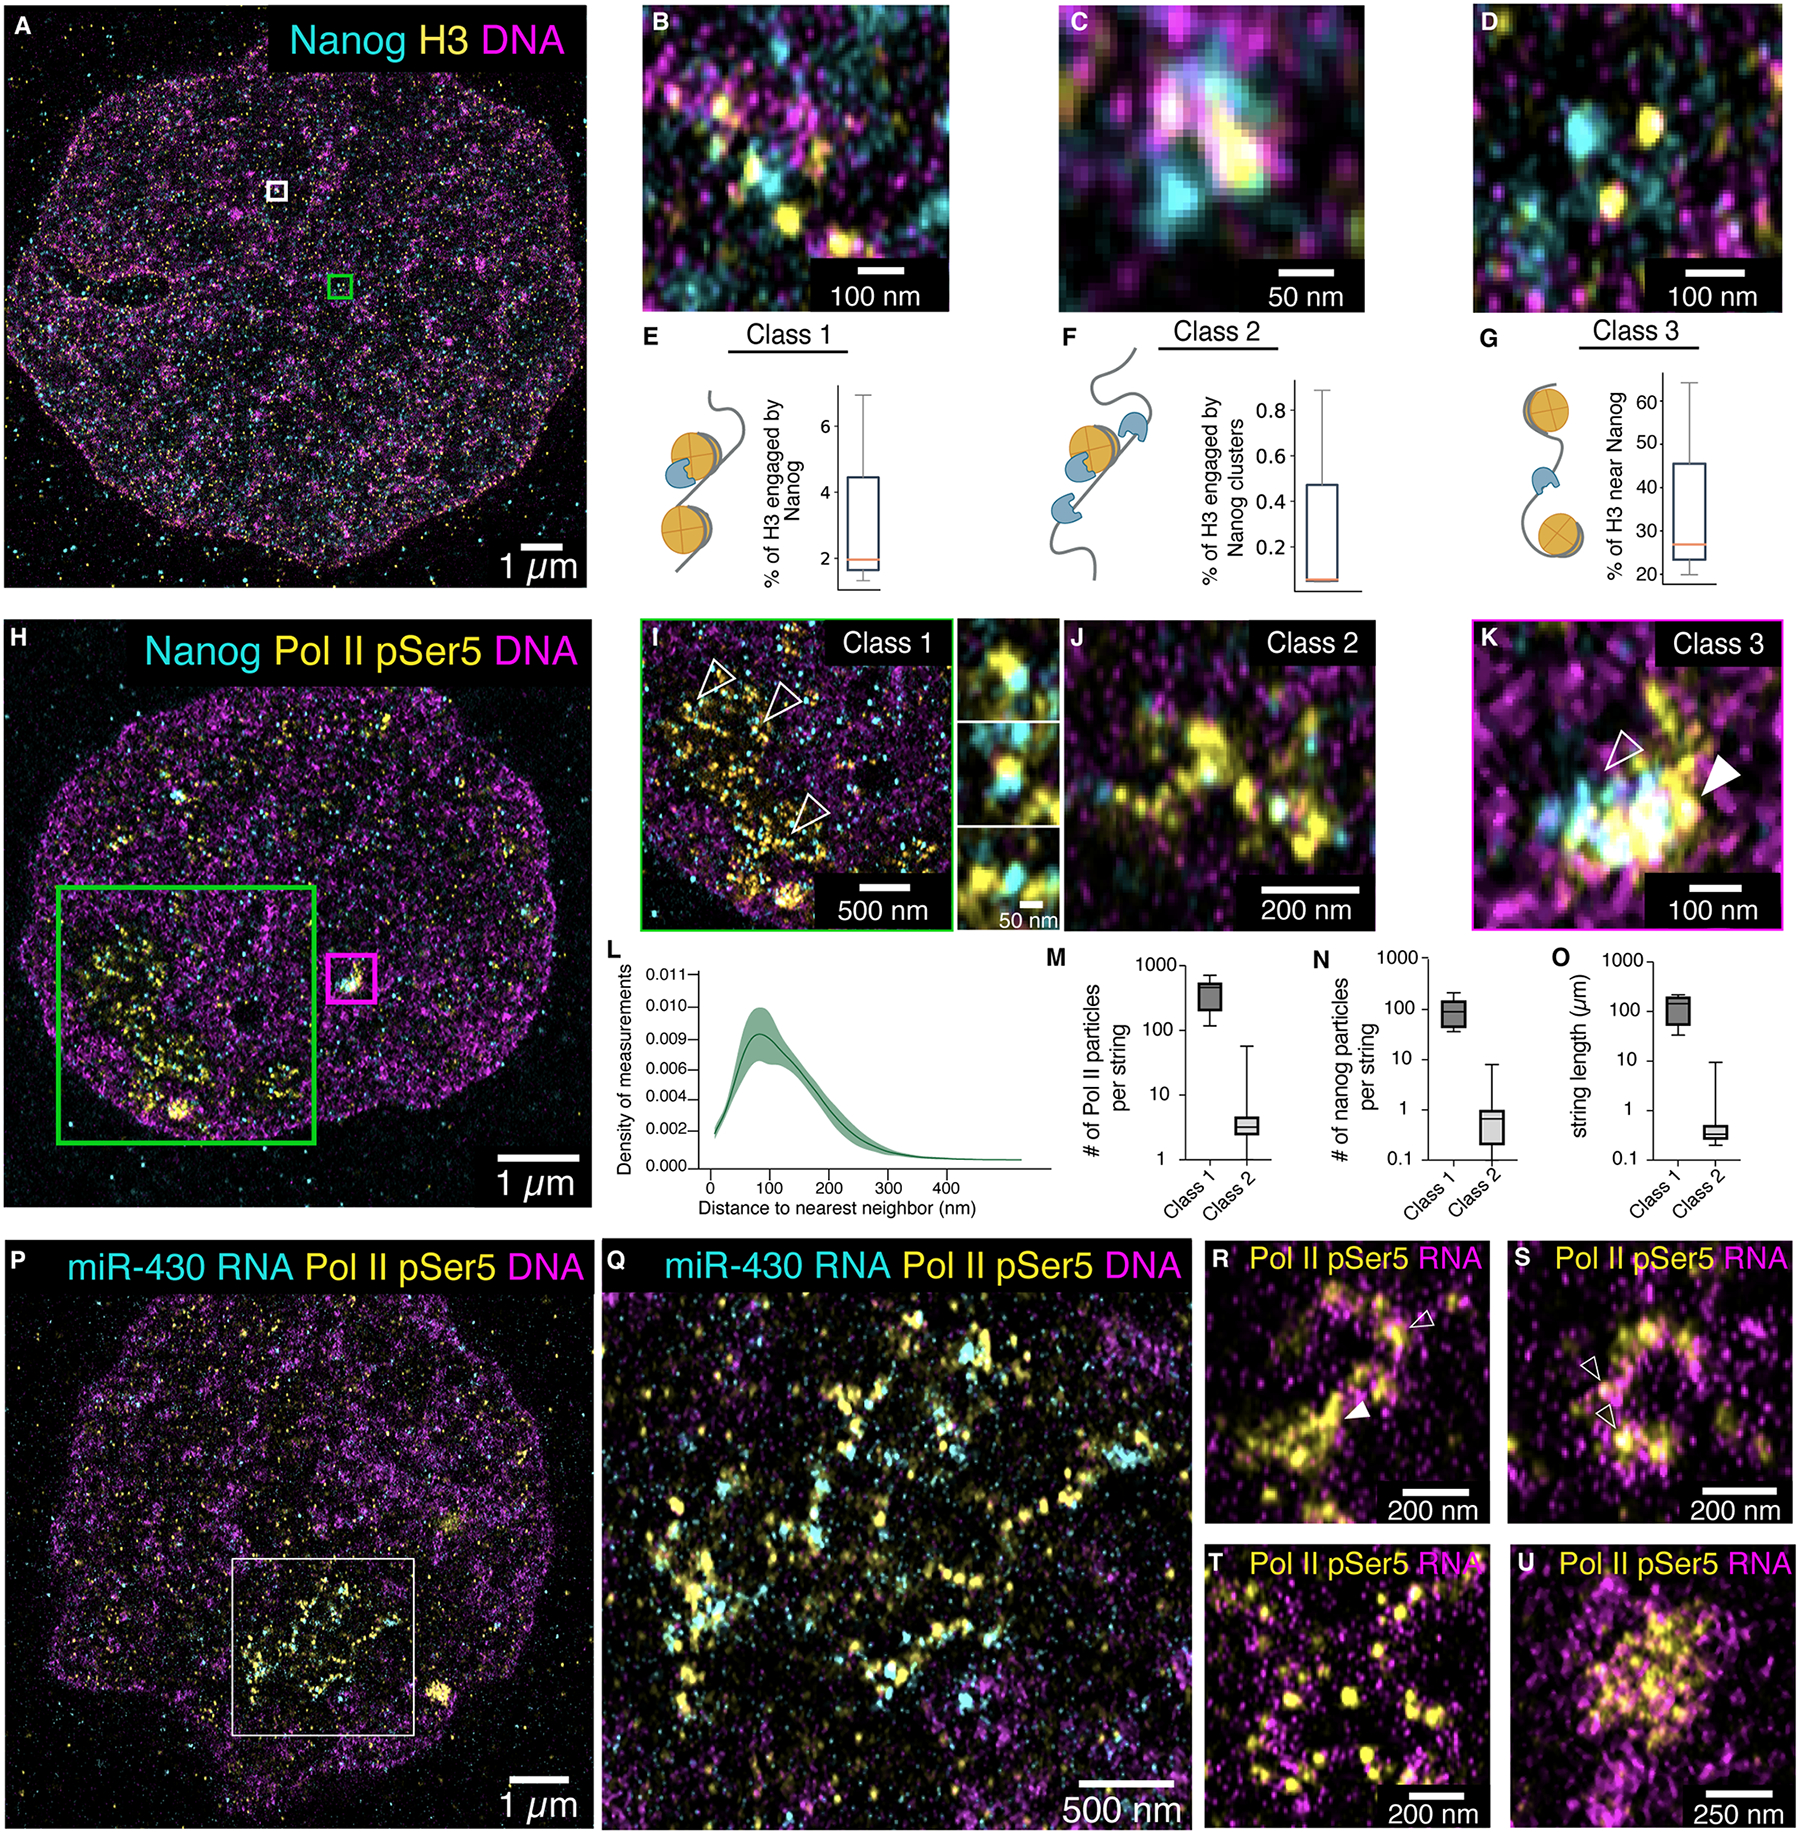
(A-D) Representative images showing Nanog and H3 staining at 4 hpf; (B) represents Class 1 organization. (C) represents the white boxed region in (A) and shows Class 2 organization. (D) represents the green boxed region in (A) and shows Class 3 organization. n = 3 nuclei from 2 embryos. (E-G) Box plots quantifying the percentage of H3 particles in each class of Nanog-H3 interactions. The median is denoted by the orange line. n = 104,347 distances. (H-K) Representative images showing Nanog and Pol II pSer5 staining at 4 hpf, n = 7 nuclei from 2 embryos. (I) represents the green boxed region in (H) and shows Class 1 organization; areas indicated by arrowheads are magnified to the right. (J) represents Class 2 organization. (K) represents the magenta boxed region in (H) and shows Class 3 organization; arrowheads indicate regions enriched for Nanog (open arrowhead) and Pol II pSer5 (closed arrowhead). (L) Density plot of the distance to nearest neighbor for Nanog and Pol II pSer5 particles; n = 169,866 distances. (M) Box plots quantifying the number of Pol II pSer5 particles in Class 1 (n = 36) and Class 2 (n = 5,682) strings. (N) Box plots quantifying the number of Nanog particles in Class 1 and Class 2 Pol II pSer5 strings. (O) Box plots quantifying the length of Pol II pSer5 strings in Class 1 and Class 2. (P-Q) ChromExM images showing Pol II pSer5 and miR-430 RNA detected by HCR (hybridization chain reaction) RNA FISH at 4 hpf. (Q) represents the boxed region in (P). (R-U) Representative images showing nascent RNA and Pol II pSer5 at 4 hpf. n = 7 nuclei from 3 embryos. Closed arrowhead in (R) indicates a central Pol II pSer5 hub with an emanating string of individual Pol II pSer5 particles associated with nascent transcripts (open arrowhead). Open arrowheads in S indicate individual Pol II pSer5 particles.
RNA Polymerase II forms string nanostructures associated with nascent RNA
To understand how transcription is organized during chromatin reprogramming, we used ChromExM to visualize Nanog and Pol II phospho-serine 5 (pSer5), which is deposited on Pol II after recruitment to the promoter (39–41) (Fig. 3H to K; Fig. S5A to C; movie S2). We detected an average of 27,503 Pol II particles per nucleus, which have characteristics consistent with single-molecule detection based on their size and homogenous intensity (Fig S5D to G).
Globally, the average distance between Pol II pSer5 and Nanog particles was 94 nm (Fig. 3L), with 19% of Pol II pSer5 particles being within 50 nm of Nanog particles, consistent with Nanog’s role in Pol II recruitment (8). However, we observed that Pol II exhibited three distinct types of organization (Fig. 3I to K and Fig. S5A, B, C, and H). The first class involved large groupings of interspersed Pol II pSer5 and Nanog particles (412 Pol II pSer5 particles and 100 Nanog particles on average, 132 μm mean length) arranged like beads on a string which we refer to as Class 1 strings and occurred twice per nucleus in 86% of nuclei observed (Fig. 3I and M to O; Fig. S5A). RNA fluorescence in situ hybridization (RNA FISH) for miR-430 revealed that Class 1 strings represent sites of active miR-430 transcription (Fig. 3P and Q; Fig. S6A–C). To validate this result, we assembled the highly repetitive miR-430 locus using single haploid embryo long-read genome sequencing and identified a single, continuous ~550 kb miR-430 locus (Fig. S7A to F), corresponding to an estimated length of ~200 μm which is consistent with the 132 μm length of Class 1 strings (Fig 3O). This locus has been estimated to have >300 promoters capable of transcribing primary miR-430 transcripts (42), consistent with the ~1,800 mature miR-430 genes detected in our assembly (Fig. S7C and D). Similarly, we detect ~400 Pol II pSer5 particles in Class 1 strings, which likely represent binding at these promoters (Fig. 3M). The string-like structure connecting Pol II and Nanog particles is consistent with Pol II and Nanog binding profiles observed by ChIP-Seq at this locus (Fig. S7G and H) (8, 12). Additionally, miR-430 RNA FISH signal and Class 1 strings are lost in miR-430−/− embryos (Fig. S6A and B; Fig. S8A and B) (43), which we confirmed lack all miR-430 genes using long-read genome sequencing (Fig. S7C to F). Together, these results demonstrate that Class 1 strings show the nanoscale organization of the transcriptionally active miR-430 cluster (16, 17).
The second class of Pol II pSer5 organization involved multiple Pol II particles organized into strings with an average length of 831 nm (2 to 70 particles; mean of 4 particles per string) (Fig. 3J and M to O; Fig. S5B and H). In this class, 37% of Pol II pSer5 particles were within 50 nm of Nanog particles, consistent with Nanog’s role in Pol II recruitment. We hypothesized that these linear Class 2 Pol II pSer5 strings represent individual genes loaded with Pol II arranged in single-file lines. Class 2 strings are still present in miR-430−/− embryos (Fig. S8B and C) indicating that they represent other transcribed genes (8). This processive organization of Pol II is reminiscent of active transcriptional elongation. In other cases, we observed branched Pol II pSer5 strings (Fig. 3J; Fig. S5B and H), consistent with the transcription factory model where multiple genes are in close proximity sharing a regulatory Pol II hub (29, 44, 45). Indeed, we detected an average of 822 Pol II pSer5 strings per nucleus, consistent with the ~1,700 active zygotic genes at 4 hpf we previously identified (17).
The third class of Pol II organization involved ‘macroclusters,’ (Fig. 3K and Fig. S5C) similar to those previously observed by super-resolution imaging (20–22). We detected an average of 28 Pol II pSer5 macroclusters per nucleus. In cases where these macroclusters were occupied by both Nanog and Pol II, we were able to resolve distinct regions within the cluster occupied solely by Nanog and Pol II (Fig. 3K and Fig. S5C), as if the two factors were tethered on distinct DNA elements. These examples are consistent with Nanog bound to enhancers residing in close proximity (<50 nm) to Pol II bound at the promoter (8, 38). Similarly, we observe all three classes of Pol II pSer5 organization during the minor wave of genome activation at 2.5 hpf, although there were fewer active sites, consistent with lower levels of transcription at this time (Fig S9A to H) (16, 17, 46). This suggests that each class of Pol II organization represents a generalizable state of Pol II organization broadly used throughout genome activation. At 4 hpf, we observed that there are an average of 5.3 Pol II particles within 200 nm of each Nanog particle among all three classes, suggesting that multiple Pol IIs are recruited by Nanog. Among the macroclusters, we also observed multiple cases where a string of RNA Pol II emanated from the cluster (Fig. 3K), raising the question of how these two distinct Pol II pSer5 structures may function.
We hypothesized that Pol II pSer5 strings represent actively transcribing Pol II, which has exited the shared regulatory hub where Nanog, Pol II, and potentially other co-activators congregate to control gene expression. To test this, we combined metabolic RNA labelling using 5-ethynyl uridine (EU) with ChromExM labelling for Pol II pSer5, and observed nascent transcripts associated with all three classes of Pol II pSer5 structures (Fig. 3R to U; Fig. S10A to F; movie S3). We observed a wide range of transcription levels associated with the Pol II pSer5 strings, suggesting that they may encompass actively transcribed gene bodies as well as paused promoters (Fig. S10G). The organization of these transcriptionally active Pol II pSer5 strings is consistent with Pol II elongation along the gene body of individual genes, where we visualized multiple Pol II pSer5 particles extruding nascent transcripts in concert (Fig. 3R to T and Fig. S10A, B, C, E, and F). Taken together, these results support a model where Nanog and Pol II clusters are in close physical proximity and form a regulatory hub that activates transcription as Pol II exits the hub, forming a string along the gene body (Fig. 3R and Fig. S10A).
Enhancers and promoters are kicked apart by transcription elongation
Next, we asked whether these Pol II pSer5 structures are formed in a transcription-dependent manner (Fig. 4A to H; Fig. S11A to G; movie S4). Inhibiting transcription elongation with α-amanitin (47–50) led to a strong reduction of Pol II pSer5 string length (66% reduction; P = 0.002) (Fig. 4C, D, G, H, and I) and a mild reduction in the size and number of Pol II macroclusters (26.3% reduction in number; P = 0.0304) (Fig. 4J and Fig. S11H), without reducing Pol II particle count (Fig. S11I). Taken together, these data indicate that Pol II pSer5 strings represent transcription elongation, while Pol II pSer5 macroclusters may function as a regulatory hub formed independent of elongation.
Figure 4. Nanog-bound enhancers and Pol II-bound promoters are kicked apart by transcription elongation.

(A-B) Representative images of Nanog and Pol II pSer5 in DMSO treated embryos at 4 hpf. n = 6 nuclei from 2 embryos. (C-D) Visualization of Pol II pSer5 strings identified in DMSO treated embryos at 4 hpf. (E-F) Representative images of Nanog and Pol II pSer5 in α-amanitin treated embryos. (G-H) Visualization of Pol II pSer5 strings identified in α-amanitin treated embryos. (I) Quantification of total Pol II pSer5 string length per nucleus in DMSO and α-amanitin treated embryos. P = 0.0002; unpaired t test. (J) Quantification of the number of Pol II pSer5 macroclusters detected in DMSO and α-amanitin treated embryos. P = 0.0304; unpaired t test. (K) Density plot of the distance to nearest neighbor for Nanog to Pol II pSer5 particles in DMSO and α-amanitin treated embryos. n = 221,335 and 229,706 distances, respectively. P < 0.001; Mann-Whitney U test. (L) Histogram showing the number of Pol II pSer5 particles within 200 nm of each Nanog particle in DMSO and α-amanitin treated embryos. P < 0.001; Mann-Whitney U test. (M) Line plot showing Pol II pSer5 binding across gene bodies +/− 2kb at zygotic genes in wild-type (WT) and α-amanitin treated embryos. (N) Representative genome tracks of pan-Pol II, Pol II pSer5, and Nanog binding showing accumulation of Pol II pSer5 at the promoter and Nanog-bound enhancers in the presence of α-amanitin. (O) Heatmaps showing Pol II pSer5 binding at Nanog-bound accessible regions in WT and α-amanitin treated embryos. Regions are ranked by Nanog ChIP-seq signal. (P) Schematic showing the kiss-and-kick model.
We also observed that Nanog and Pol II particles were closer after treatment with α-amanitin (Fig. 4K; median distance 106 nm vs 66 nm; P < 0.001), with more Pol II pSer5 particles surrounding each Nanog particle (Fig. 4L; 3.1 vs 7.6 Pol II per Nanog; P < 0.001). Similar behavior between Nanog and Pol II was observed when transcription was inhibited in miR-430−/− embryos (Fig S11J), suggesting that these changes occur at multiple loci in the genome. We explain these results with the following model: Nanog first recruits Pol II to enhancer-promoter hubs, bringing them into close proximity, then Pol II exits the regulatory hub in the form of Pol II pSer5 strings, transcribing the gene body (Fig. 4). When transcription elongation was inhibited, we observed an increase in the stoichiometry and proximity of Nanog-Pol II particles, consistent with Pol II stalling at the promoter and the stabilization of enhancer and promoter interactions.
To test this model, we performed ChIP-Seq for Pol II pSer5 in wild-type and α-amanitin treated embryos and observed extensive pileup of Pol II at promoters when blocking transcription (Fig. 4M and Fig. S11K). As predicted from our ChromExM results, Pol II pSer5 accumulated at Nanog-bound enhancers and other accessible sites (Fig. 4N and O; Fig. S11L and M), yet these regions are not enriched for RNA Pol II in wild-type embryos (Fig. 4N and O; Fig. S11L and M) (8). These results can be explained by a model where enhancer-promoter contacts are transient, consistent with the kiss-and-run model (21), and there is, therefore, a larger mean distance between Nanog and Pol II (Fig. 4K). However, in the absence of transcriptional elongation, Pol II is continuously brought to the promoter and remains in close proximity to the enhancer as observed by ChIP-seq. This is further supported by the increase in the number of Pol II particles surrounding each Nanog particle (Fig. 4L). Based on these data, we propose a modified version of the kiss-and-run model termed “kiss-and-kick,” where transcription itself kicks away the enhancer from the promoter as Pol II elongates (Fig. 4P). This would explain why we observe a stabilization of Poll II in close proximity to Nanog-bound enhancers when elongation is inhibited.
Discussion
Here, we developed ChromExM for multimodal super-resolution chromatin imaging by physically enlarging biological samples to achieve nucleosomal resolution. We demonstrate that chromatin organization is preserved and developed an improved metabolic labelling strategy for chromatin imaging (Fig. 2). ChromExM provides significantly higher resolution than previous ExM applications for chromatin imaging (~3–15 nm vs ~65 nm) (31). Other methods to visualize chromatin, such as ChromEMT (10), lack multimodal labelling, while the resolution of single-molecule localization microscopy is limited by the size of the fluorescent labels (~20 nm for primary and secondary antibody), which becomes negligible in ChromExM given labels are applied after expansion (11). Although ChromExM provides significant technical advances, it requires bright and photostable fluorescent labelling and chemical fixation, which may affect the appearance of certain structures. Future methods will be needed to identify specific loci through DNA FISH compatible with ChromExM to investigate specific regulatory structures at individual genes.
We used ChromExM to characterize the nanoscale organization of the pioneer factor Nanog and RNA Pol II as they activate transcription during genome activation. While previous studies have shown how pioneer factors direct chromatin opening in vitro (51, 52) and organize into hubs in vivo (19, 28, 53, 54), the nanoscale organization of such hubs has remained unclear. ChromExM revealed that Pol II shows three types of organization during genome activation and is intimately associated with Nanog (Fig. 3H to K). Previous studies have shown that TFs such as Oct4, Brd4, and Mediator form clusters associated with super-enhancers (21, 23, 24). With the resolution of ChromExM, we can now resolve how Nanog and Pol II often occupy distinct regions within transcription hubs, consistent with their binding at enhancers and promoters that are in close contact.
How enhancers and promoters are organized to activate transcription is central to understanding gene regulation. Previous reports have concluded that enhancer-promoter contact is correlated (55), anticorrelated (56), or unrelated (57) with transcription, leaving the question of how enhancer-promoter contact is related to transcription unanswered. Three models have been proposed to explain how enhancers and promoters interact to control gene expression: (i) stable contact between enhancers and promoters, (ii) a dynamic kissing model with transient enhancer-promoter contacts, and (iii) a TF activity gradient where TFs diffuse from enhancers to promoters rather than requiring physical contact (58). Our results are not consistent with models (i) and (iii), and lead to a model where Nanog can form clusters at enhancers, coming into physical proximity with Pol II at the promoter, eventually triggering transcription, which we observed outside of this shared regulatory hub as strings of Pol II. Consistent with this model, we found that Pol II strings were substantially reduced when elongation was inhibited, coinciding with an accumulation of Pol II at promoters and in Nanog-bound enhancers, indicating that the enhancer and promoter were stabilized in close contact (Fig. 4A to P). Taken together, these results suggest that Pol II elongation displaces enhancer-promoter contacts and lead us to propose the kiss-and-kick model. In this model, the dynamic association between the enhancer and promoter is kicked apart during elongation. This effect can be caused by either transcription elongation, or the nascent RNAs which have been shown to dissolve Mediator condensates (59). Kiss-and-kick could also explain transcriptional bursting (60), as elongation would be triggered in intervals while the enhancer and promoter are in contact, and then paused after elongation kicks away the enhancer.
Supplementary Material
Acknowledgments:
We thank Christopher Castaldi, Irina Tikhonova, Guilin Wang, and Evelyn Ng from the Yale Center for Genome Analysis for sequencing support; the Yale Center for Genome Analysis and Keck Microarray Shared Resource at Yale University for providing the necessary PacBio sequencing services, which is funded in part by the National Institutes of Health instrument grant 1S10OD028669-01; Sarah Dube, Timothy Gerson, Mario Messih, Ashley Bonneau, and Juan Pablo Fernandez for technical help; Phylicia Kidd and Yuan Tian for assistance with STED microscopy; Jacques Bothma and Hernan Garcia for assistance with Llama tag constructs; the Yale Center for Advanced Microscopy Facility for the use of their SP8, LSM 880, and FEI Biotwin microscopes; the Marine Biological Laboratory at Woods Hole and Berna Sözen for use of equipment; Luke Lavis for sharing Janelia Fluor dyes; Guy Riddihough, Shawna Hiley, and Ilil Carmi for feedback on the manuscript; and all members of the Giraldez lab for feedback and support. This work is supported by the 4DNucleome program.
Funding:
National Institutes of Health grant F31HD10444 (MEP)
National Institutes of Health grant T32HD007149 (MEP)
Yale Genetics Venture Fund and the Surdna foundation (LM)
National Institutes of Health grant F31DK123886 (MAF)
National Institutes of Health grant T32DK07780 (MAF)
National Institutes of Health grant T32GM0077223 (MDJB)
Canadian Institute of Health Research (CWB)
National Institutes of Health grant GM36477 (KSZ)
Wellcome Trust grant 203285/B/16/Z (JB)
National Institutes of Health grant P30 DK045735 (JB)
National Institutes of Health grant R01 HD100035 (AJG)
National Institutes of Health grant R35 GM122580 (AJG)
Footnotes
Competing interests: M.E.P and A.J.G are inventors on a provisional patent application filed by Yale University with the U.S. patent office covering the ChromExM method described here. J.B. has financial interests in Bruker Corp. and Hamamatsu Photonics. O.M. and J.B. filed patent applications with the U.S. patent office covering the pan-ExM method. O.M. and J.B. are co-founders of panluminate Inc. which is developing related products. The other authors declare no competing financial interests.
Data and materials availability:
Information on high-throughput sequencing data is available in Data S1. Raw high-throughput sequence reads generated in this study are publicly available in the Sequence Read Archive under project accession SRP434969/PRJNA962791. Scripts used in this study are available at Zenodo (61). Other materials generated in this study are available upon request.
References and Notes
- 1.Vastenhouw NL, Cao WX, Lipshitz HD, The maternal-to-zygotic transition revisited. Development 146, dev161471 (2019). [DOI] [PubMed] [Google Scholar]
- 2.Lee MT, Bonneau AR, Giraldez AJ, Zygotic genome activation during the maternal-to-zygotic transition. Annu Rev Cell Dev Biol 30, 581–613 (2014). [DOI] [PMC free article] [PubMed] [Google Scholar]
- 3.Yartseva V, Giraldez AJ. (Elsevier, 2015), pp. 191–232. [DOI] [PMC free article] [PubMed] [Google Scholar]
- 4.Schulz KN, Harrison MM, Mechanisms regulating zygotic genome activation. Nature Reviews Genetics 20, 221–234 (2019). [DOI] [PMC free article] [PubMed] [Google Scholar]
- 5.Wike CL et al. , Chromatin architecture transitions from zebrafish sperm through early embryogenesis. Genome Research 31, 981–994 (2021). [DOI] [PMC free article] [PubMed] [Google Scholar]
- 6.Soufi A, Donahue G, Zaret KS, Facilitators and impediments of the pluripotency reprogramming factors’ initial engagement with the genome. Cell 151, 994–1004 (2012). [DOI] [PMC free article] [PubMed] [Google Scholar]
- 7.Soufi A et al. , Pioneer Transcription Factors Target Partial DNA Motifs on Nucleosomes to Initiate Reprogramming. Cell 161, 555–568 (2015). [DOI] [PMC free article] [PubMed] [Google Scholar]
- 8.Miao L et al. , The landscape of pioneer factor activity reveals the mechanisms of chromatin reprogramming and genome activation. Molecular Cell 82, 986–1002.e1009 (2022). [DOI] [PMC free article] [PubMed] [Google Scholar]
- 9.Pálfy M, Schulze G, Valen E, Vastenhouw NL, Chromatin accessibility established by Pou5f3, Sox19b and Nanog primes genes for activity during zebrafish genome activation. PLOS Genetics 16, e1008546 (2020). [DOI] [PMC free article] [PubMed] [Google Scholar]
- 10.Ou HD et al. , ChromEMT: Visualizing 3D chromatin structure and compaction in interphase and mitotic cells. Science 357, (2017). [DOI] [PMC free article] [PubMed] [Google Scholar]
- 11.M’Saad O, Bewersdorf J, Light microscopy of proteins in their ultrastructural context. Nature Communications 11, (2020). [DOI] [PMC free article] [PubMed] [Google Scholar]
- 12.Lee MT et al. , Nanog, Pou5f1 and SoxB1 activate zygotic gene expression during the maternal-to-zygotic transition. Nature 503, 360–364 (2013). [DOI] [PMC free article] [PubMed] [Google Scholar]
- 13.Leichsenring M, Maes J, Mössner R, Driever W, Onichtchouk D, Pou5f1 transcription factor controls zygotic gene activation in vertebrates. Science 341, 1005–1009 (2013). [DOI] [PubMed] [Google Scholar]
- 14.Bothma JP, Norstad MR, Alamos S, Garcia HG, LlamaTags: A Versatile Tool to Image Transcription Factor Dynamics in Live Embryos. Cell 173, 1810–1822.e1816 (2018). [DOI] [PMC free article] [PubMed] [Google Scholar]
- 15.Heyn P et al. , The earliest transcribed zygotic genes are short, newly evolved, and different across species. Cell Rep 6, 285–292 (2014). [DOI] [PubMed] [Google Scholar]
- 16.Hadzhiev Y et al. , A cell cycle-coordinated Polymerase II transcription compartment encompasses gene expression before global genome activation. Nature Communications 10, (2019). [DOI] [PMC free article] [PubMed] [Google Scholar]
- 17.Chan SH et al. , Brd4 and P300 Confer Transcriptional Competency during Zygotic Genome Activation. Developmental Cell 49, 867–881.e868 (2019). [DOI] [PMC free article] [PubMed] [Google Scholar]
- 18.Giraldez AJ et al. , Zebrafish MiR-430 promotes deadenylation and clearance of maternal mRNAs. Science 312, 75–79 (2006). [DOI] [PubMed] [Google Scholar]
- 19.Mir M et al. , Dynamic multifactor hubs interact transiently with sites of active transcription in Drosophila embryos. eLife 7, e40497 (2018). [DOI] [PMC free article] [PubMed] [Google Scholar]
- 20.Cho W-K et al. , RNA Polymerase II cluster dynamics predict mRNA output in living cells. eLife 5, (2016). [DOI] [PMC free article] [PubMed] [Google Scholar]
- 21.Cho W-K et al. , Mediator and RNA polymerase II clusters associate in transcription-dependent condensates. Science 361, 412–415 (2018). [DOI] [PMC free article] [PubMed] [Google Scholar]
- 22.Cisse II et al. , Real-Time Dynamics of RNA Polymerase II Clustering in Live Human Cells. Science 341, 664–667 (2013). [DOI] [PubMed] [Google Scholar]
- 23.Sabari BR et al. , Coactivator condensation at super-enhancers links phase separation and gene control. Science 361, (2018). [DOI] [PMC free article] [PubMed] [Google Scholar]
- 24.Boija A et al. , Transcription Factors Activate Genes through the Phase-Separation Capacity of Their Activation Domains. Cell 175, 1842–1855.e1816 (2018). [DOI] [PMC free article] [PubMed] [Google Scholar]
- 25.Uchino S et al. , Live imaging of transcription sites using an elongating RNA polymerase II–specific probe. Journal of Cell Biology 221, (2021). [DOI] [PMC free article] [PubMed] [Google Scholar]
- 26.Sato Y et al. , Histone H3K27 acetylation precedes active transcription during zebrafish zygotic genome activation as revealed by live-cell analysis. Development 146, (2019). [DOI] [PMC free article] [PubMed] [Google Scholar]
- 27.Huang S-K, Whitney PH, Dutta S, Shvartsman SY, Rushlow CA, Spatial organization of transcribing loci during early genome activation in Drosophila. Current Biology 31, 5102–5110.e5105 (2021). [DOI] [PMC free article] [PubMed] [Google Scholar]
- 28.Kuznetsova K et al. , Nanog organizes transcription bodies. Current Biology 33, 164–173.e165 (2023). [DOI] [PubMed] [Google Scholar]
- 29.Iborra FJ, Pombo A, Jackson DA, Cook PR, Active RNA polymerases are localized within discrete transcription “factories’ in human nuclei. Journal of Cell Science 109, 1427–1436 (1996). [DOI] [PubMed] [Google Scholar]
- 30.Pombo A et al. , Regional specialization in human nuclei: visualization of discrete sites of transcription by RNA polymerase III. The EMBO Journal 18, 2241–2253 (1999). [DOI] [PMC free article] [PubMed] [Google Scholar]
- 31.Faulkner EL et al. , Imaging nanoscale nuclear structures with expansion microscopy. J Cell Sci 135, (2022). [DOI] [PMC free article] [PubMed] [Google Scholar]
- 32.Pernal SP et al. , Nanoscale imaging using differential expansion microscopy. Histochemistry and Cell Biology 153, 469–480 (2020). [DOI] [PubMed] [Google Scholar]
- 33.Chen F, Tillberg PW, Boyden ES, Expansion microscopy. Science 347, 543–548 (2015). [DOI] [PMC free article] [PubMed] [Google Scholar]
- 34.Karvinen J, Ihalainen TO, Calejo MT, Jönkkäri I, Kellomäki M, Characterization of the microstructure of hydrazone crosslinked polysaccharide-based hydrogels through rheological and diffusion studies. Materials Science and Engineering: C 94, 1056–1066 (2019). [DOI] [PubMed] [Google Scholar]
- 35.Frederick MA et al. , A pioneer factor locally opens compacted chromatin to enable targeted ATP-dependent nucleosome remodeling. Nature Structural & Molecular Biology 30, 31–37 (2023). [DOI] [PMC free article] [PubMed] [Google Scholar]
- 36.Neef AB, Luedtke NW, Dynamic metabolic labeling of DNA in vivo with arabinosyl nucleosides. Proceedings of the National Academy of Sciences 108, 20404–20409 (2011). [DOI] [PMC free article] [PubMed] [Google Scholar]
- 37.Uttamapinant C et al. , Fast, Cell-Compatible Click Chemistry with Copper-Chelating Azides for Biomolecular Labeling. Angewandte Chemie International Edition 51, 5852–5856 (2012). [DOI] [PMC free article] [PubMed] [Google Scholar]
- 38.Xu C et al. , Nanog-like regulates endoderm formation through the Mxtx2-Nodal pathway. Developmental cell 22, 625–638 (2012). [DOI] [PMC free article] [PubMed] [Google Scholar]
- 39.Buratowski S, Progression through the RNA polymerase II CTD cycle. Mol Cell 36, 541–546 (2009). [DOI] [PMC free article] [PubMed] [Google Scholar]
- 40.Lu H, Zawel L, Fisher L, Egly J-M, Reinberg D, Human general transcription factor IIH phosphorylates the C-terminal domain of RNA polymerase II. Nature 358, 641–645 (1992). [DOI] [PubMed] [Google Scholar]
- 41.Trigon S et al. , Characterization of the Residues Phosphorylated in Vitro by Different C-terminal Domain Kinases*. Journal of Biological Chemistry 273, 6769–6775 (1998). [DOI] [PubMed] [Google Scholar]
- 42.Hadzhiev Y et al. , The miR-430 locus with extreme promoter density forms a transcription body during the minor wave of zygotic genome activation. Developmental Cell 58, 155–170.e158 (2023). [DOI] [PMC free article] [PubMed] [Google Scholar]
- 43.Liu Y et al. , Inheritable and Precise Large Genomic Deletions of Non-Coding RNA Genes in Zebrafish Using TALENs. PLOS ONE 8, e76387 (2013). [DOI] [PMC free article] [PubMed] [Google Scholar]
- 44.Mitchell JA, Fraser P, Transcription factories are nuclear subcompartments that remain in the absence of transcription. Genes Dev 22, 20–25 (2008). [DOI] [PMC free article] [PubMed] [Google Scholar]
- 45.Osborne CS et al. , Active genes dynamically colocalize to shared sites of ongoing transcription. Nature Genetics 36, 1065–1071 (2004). [DOI] [PubMed] [Google Scholar]
- 46.Ugolini M, Kuznetsova K, Oda H, Kimura H, Vastenhouw NL, Targeted disruption of transcription bodies causes widespread activation of transcription. bioRxiv, 2022.2011.2021.517317 (2022). [Google Scholar]
- 47.Bushnell DA, Cramer P, Kornberg RD, Structural basis of transcription: α-Amanitin–RNA polymerase II cocrystal at 2.8 Å resolution. Proceedings of the National Academy of Sciences 99, 1218–1222 (2002). [DOI] [PMC free article] [PubMed] [Google Scholar]
- 48.Greenleaf AL, Amanitin-resistant RNA polymerase II mutations are in the enzyme’s largest subunit. Journal of Biological Chemistry 258, 13403–13406 (1983). [PubMed] [Google Scholar]
- 49.Lindell TJ, Weinberg F, Morris PW, Roeder RG, Rutter WJ, Specific Inhibition of Nuclear RNA Polymerase II by α-Amanitin. Science 170, 447–449 (1970). [DOI] [PubMed] [Google Scholar]
- 50.Kane DA et al. , The zebrafish epiboly mutants. Development 123, 47–55 (1996). [DOI] [PubMed] [Google Scholar]
- 51.Fernandez Garcia M et al. , Structural Features of Transcription Factors Associating with Nucleosome Binding. Molecular Cell 75, 921–932.e926 (2019). [DOI] [PMC free article] [PubMed] [Google Scholar]
- 52.Luzete-Monteiro E, Zaret KS, Structures and consequences of pioneer factor binding to nucleosomes. Current Opinion in Structural Biology 75, 102425 (2022). [DOI] [PMC free article] [PubMed] [Google Scholar]
- 53.Dufourt J et al. , Temporal control of gene expression by the pioneer factor Zelda through transient interactions in hubs. Nature Communications 9, 5194 (2018). [DOI] [PMC free article] [PubMed] [Google Scholar]
- 54.Gaskill MM, Gibson TJ, Larson ED, Harrison MM, GAF is essential for zygotic genome activation and chromatin accessibility in the early Drosophila embryo. Elife 10, (2021). [DOI] [PMC free article] [PubMed] [Google Scholar]
- 55.Chen H et al. , Dynamic interplay between enhancer–promoter topology and gene activity. Nature Genetics 50, 1296–1303 (2018). [DOI] [PMC free article] [PubMed] [Google Scholar]
- 56.Benabdallah NS et al. , Decreased Enhancer-Promoter Proximity Accompanying Enhancer Activation. Mol Cell 76, 473–484.e477 (2019). [DOI] [PMC free article] [PubMed] [Google Scholar]
- 57.Mateo LJ et al. , Visualizing DNA folding and RNA in embryos at single-cell resolution. Nature 568, 49–54 (2019). [DOI] [PMC free article] [PubMed] [Google Scholar]
- 58.Karr JP, Ferrie JJ, Tjian R, Darzacq X, The transcription factor activity gradient (TAG) model: contemplating a contact-independent mechanism for enhancer-promoter communication. Genes Dev 36, 7–16 (2022). [DOI] [PMC free article] [PubMed] [Google Scholar]
- 59.Henninger JE et al. , RNA-Mediated Feedback Control of Transcriptional Condensates. Cell 184, 207–225.e224 (2021). [DOI] [PMC free article] [PubMed] [Google Scholar]
- 60.Coulon A, Chow CC, Singer RH, Larson DR, Eukaryotic transcriptional dynamics: from single molecules to cell populations. Nature reviews genetics 14, 572–584 (2013). [DOI] [PMC free article] [PubMed] [Google Scholar]
- 61.Pownall ME, Vejnar CE, Giraldez AJ, Code for: Chromatin expansion microscopy reveals nanoscale organization of transcription and chromatin (1.0). Zenodo. 10.5281/zenodo.7933370, (2023). [DOI] [PMC free article] [PubMed] [Google Scholar]
- 62.Chi YI, Homeodomain revisited: a lesson from disease-causing mutations. Hum Genet 116, 433–444 (2005). [DOI] [PMC free article] [PubMed] [Google Scholar]
- 63.Kawakami K et al. , A transposon-mediated gene trap approach identifies developmentally regulated genes in zebrafish. Dev Cell 7, 133–144 (2004). [DOI] [PubMed] [Google Scholar]
- 64.Grimm JB et al. , A general method to fine-tune fluorophores for live-cell and in vivo imaging. Nat Methods 14, 987–994 (2017). [DOI] [PMC free article] [PubMed] [Google Scholar]
- 65.Grimm JB et al. , A General Method to Improve Fluorophores Using Deuterated Auxochromes. JACS Au 1, 690–696 (2021). [DOI] [PMC free article] [PubMed] [Google Scholar]
- 66.Link V, Shevchenko A, Heisenberg C-P, Proteomics of early zebrafish embryos. BMC Developmental Biology 6, 1 (2006). [DOI] [PMC free article] [PubMed] [Google Scholar]
- 67.Asano SM et al. , Expansion microscopy: protocols for imaging proteins and RNA in cells and tissues. Current protocols in cell biology 80, e56 (2018). [DOI] [PMC free article] [PubMed] [Google Scholar]
- 68.Choi HMT et al. , Third-generation in situ hybridization chain reaction: multiplexed, quantitative, sensitive, versatile, robust. Development 145, (2018). [DOI] [PMC free article] [PubMed] [Google Scholar]
- 69.Nepal C et al. , Dynamic regulation of the transcription initiation landscape at single nucleotide resolution during vertebrate embryogenesis. Genome research 23, 1938–1950 (2013). [DOI] [PMC free article] [PubMed] [Google Scholar]
- 70.Baranasic D et al. , Multiomic atlas with functional stratification and developmental dynamics of zebrafish cis-regulatory elements. Nature Genetics 54, 1037–1050 (2022). [DOI] [PMC free article] [PubMed] [Google Scholar]
- 71.Cirillo LA et al. , Opening of compacted chromatin by early developmental transcription factors HNF3 (FoxA) and GATA-4. Mol Cell 9, 279–289 (2002). [DOI] [PubMed] [Google Scholar]
- 72.Panchenko T et al. , Replacement of histone H3 with CENP-A directs global nucleosome array condensation and loosening of nucleosome superhelical termini. Proceedings of the National Academy of Sciences 108, 16588–16593 (2011). [DOI] [PMC free article] [PubMed] [Google Scholar]
- 73.Soumpasis D, Theoretical analysis of fluorescence photobleaching recovery experiments. Biophysical journal 41, 95–97 (1983). [DOI] [PMC free article] [PubMed] [Google Scholar]
- 74.Kang M, Day CA, Kenworthy AK, DiBenedetto E, Simplified equation to extract diffusion coefficients from confocal FRAP data. Traffic 13, 1589–1600 (2012). [DOI] [PMC free article] [PubMed] [Google Scholar]
- 75.Schindelin J et al. , Fiji: an open-source platform for biological-image analysis. Nature Methods 9, 676–682 (2012). [DOI] [PMC free article] [PubMed] [Google Scholar]
- 76.Sofroniew NL, Talley; Kira Evans; Juan Nunez-Iglesias; Grzegorz Bokota; Philip Winston; Gonzalo Peña-Castellanos; Kevin Yamauchi; Matthias Bussonnier; Draga Doncila Pop; Ahmet Can Solak; Ziyang Liu; Pam Wadhwa; Alister Burt; Genevieve Buckley; Andrew Sweet; Lukasz Migas; Volker Hilsenstein; Lorenzo Gaifas; Jordão Bragantini; Jaime Rodríguez-Guerra; Hector Muñoz; Jeremy Freeman; Peter Boone; Alan Lowe; Christoph Gohlke; Loic Royer; Andrea PIERRÉ; Hagai Har-Gil; Abigail McGovern, napari: a multi-dimensional image viewer for Python. (2022).
- 77.Mazo G, QuickFigures: A toolkit and ImageJ PlugIn to quickly transform microscope images into scientific figures. PLoS One 16, e0240280 (2021). [DOI] [PMC free article] [PubMed] [Google Scholar]
- 78.Legland D, Arganda-Carreras I, Andrey P, MorphoLibJ: integrated library and plugins for mathematical morphology with ImageJ. Bioinformatics 32, 3532–3534 (2016). [DOI] [PubMed] [Google Scholar]
- 79.Ollion J, Cochennec J, Loll F, Escudé C, Boudier T, TANGO: a generic tool for high-throughput 3D image analysis for studying nuclear organization. Bioinformatics 29, 1840–1841 (2013). [DOI] [PMC free article] [PubMed] [Google Scholar]
- 80.Tseng Q et al. , A new micropatterning method of soft substrates reveals that different tumorigenic signals can promote or reduce cell contraction levels. Lab on a Chip 11, 2231–2240 (2011). [DOI] [PubMed] [Google Scholar]
- 81.Doube M et al. , BoneJ: Free and extensible bone image analysis in ImageJ. Bone 47, 1076–1079 (2010). [DOI] [PMC free article] [PubMed] [Google Scholar]
- 82.Arganda-Carreras I, Fernández-González R, Muñoz-Barrutia A, Ortiz-De-Solorzano C, 3D reconstruction of histological sections: Application to mammary gland tissue. Microscopy Research and Technique 73, 1019–1029 (2010). [DOI] [PubMed] [Google Scholar]
- 83.Virtanen P et al. , SciPy 1.0: fundamental algorithms for scientific computing in Python. Nature Methods 17, 261–272 (2020). [DOI] [PMC free article] [PubMed] [Google Scholar]
- 84.Harris CR et al. , Array programming with NumPy. Nature 585, 357–362 (2020). [DOI] [PMC free article] [PubMed] [Google Scholar]
- 85.Hunter JD, Matplotlib: A 2D Graphics Environment. Computing in Science & Engineering 9, 90–95 (2007). [Google Scholar]
- 86.Westerfield M, The zebrafish book: a guide for the laboratory use of zebrafish. http://zfin.org/zf_info/zfbook/zfbk.html, (2000).
- 87.Li H, New strategies to improve minimap2 alignment accuracy. Bioinformatics 37, 4572–4574 (2021). [DOI] [PMC free article] [PubMed] [Google Scholar]
- 88.Cheng H et al. , Haplotype-resolved assembly of diploid genomes without parental data. Nature Biotechnology 40, 1332–1335 (2022). [DOI] [PMC free article] [PubMed] [Google Scholar]
- 89.Wick RR, Schultz MB, Zobel J, Holt KE, Bandage: interactive visualization of de novo genome assemblies. Bioinformatics 31, 3350–3352 (2015). [DOI] [PMC free article] [PubMed] [Google Scholar]
- 90.Kozomara A, Birgaoanu M, Griffiths-Jones S, miRBase: from microRNA sequences to function. Nucleic Acids Research 47, D155–D162 (2018). [DOI] [PMC free article] [PubMed] [Google Scholar]
- 91.Zdobnov EM et al. , OrthoDB in 2020: evolutionary and functional annotations of orthologs. Nucleic Acids Research 49, D389–D393 (2020). [DOI] [PMC free article] [PubMed] [Google Scholar]
- 92.Cunningham F et al. , Ensembl 2022. Nucleic Acids Research 50, D988–D995 (2021). [DOI] [PMC free article] [PubMed] [Google Scholar]
- 93.Daily J, Parasail: SIMD C library for global, semi-global, and local pairwise sequence alignments. BMC Bioinformatics 17, 81 (2016). [DOI] [PMC free article] [PubMed] [Google Scholar]
- 94.Dobin A et al. , STAR: ultrafast universal RNA-seq aligner. Bioinformatics 29, 15–21 (2012). [DOI] [PMC free article] [PubMed] [Google Scholar]
- 95.Lopez-Delisle L et al. , pyGenomeTracks: reproducible plots for multivariate genomic datasets Bioinformatics 37, 422–423 (2020). [DOI] [PMC free article] [PubMed] [Google Scholar]
- 96.Bogdanović O, Fernández-Miñán A, Tena JJ, de la Calle-Mustienes E, Gómez-Skarmeta JL, The developmental epigenomics toolbox: ChIP-seq and MethylCap-seq profiling of early zebrafish embryos. Methods 62, 207–215 (2013). [DOI] [PubMed] [Google Scholar]
- 97.Vejnar CE, Giraldez AJ, LabxDB: versatile databases for genomic sequencing and lab management. Bioinformatics 36, 4530–4531 (2020). [DOI] [PMC free article] [PubMed] [Google Scholar]
- 98.Yates AD et al. , Ensembl 2020. Nucleic Acids Research 48, D682–D688 (2019). [DOI] [PMC free article] [PubMed] [Google Scholar]
- 99.Langmead B, Salzberg SL, Fast gapped-read alignment with Bowtie 2. Nature Methods 9, 357–359 (2012). [DOI] [PMC free article] [PubMed] [Google Scholar]
- 100.Li H et al. , The Sequence Alignment/Map format and SAMtools. Bioinformatics 25, 2078–2079 (2009). [DOI] [PMC free article] [PubMed] [Google Scholar]
- 101.Ramírez F, Dündar F, Diehl S, Grüning BA, Manke T, deepTools: a flexible platform for exploring deep-sequencing data. Nucleic Acids Res 42, W187–191 (2014). [DOI] [PMC free article] [PubMed] [Google Scholar]
Associated Data
This section collects any data citations, data availability statements, or supplementary materials included in this article.
Supplementary Materials
Data Availability Statement
Information on high-throughput sequencing data is available in Data S1. Raw high-throughput sequence reads generated in this study are publicly available in the Sequence Read Archive under project accession SRP434969/PRJNA962791. Scripts used in this study are available at Zenodo (61). Other materials generated in this study are available upon request.