Abstract
Abrupt aggregation of amyloid () peptide is a hallmark of Alzheimer’s disease (AD), a severe pathology that affects more than 44 million people worldwide. A growing body of evidence suggests that lipids can uniquely alter rates of aggregation. However, it remains unclear whether lipids only alter rates of protein aggregation or also uniquely modify the secondary structure and toxicity of oligomers and fibrils. In this study, we investigated the effect of phosphatidylcholine (PC), cardiolipin (CL), and cholesterol (Chol) on aggregation. We found that PC, CL and Chol strongly accelerated the rate of fibril formation compared to the rate of aggregation in the lipid-free environment. Furthermore, anionic CL enabled the strongest acceleration of aggregation compared to zwitterionic PC and uncharged Chol. We also found that PC, CL, and Chol uniquely altered the secondary structure of early-, middle- and late-stage aggregates. Specifically, CL and Chol drastically increased the amount of parallel -sheet in oligomers and fibrils grown in the presence of these lipids. This caused a significant increase in the toxicity of :CL and :Chol compared to the toxicity of :PC and aggregates formed in the lipid-free environment. These results demonstrate that toxicity of aggregates correlates with the amount of their -sheet content, which, in turn, is determined by the chemical structure of lipids present at the stage of aggregation.
Keywords: amyloid β1-42, phospholipids, oligomers, fibrils, AFM-IR
Graphical Abstract
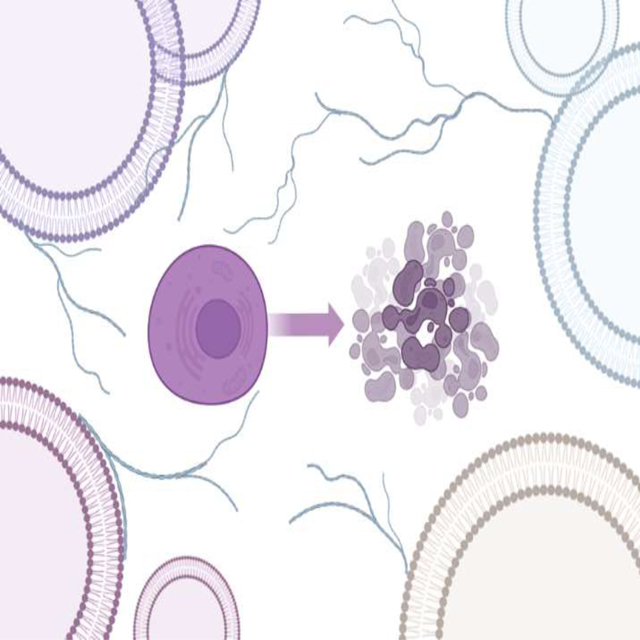
Abrupt aggregation of amyloid peptide is the expected underlying molecular cause of Alzheimer disease, a severe pathology that affects millions of people around the world. We discovered that phospholipids and cholesterol could uniquely alter rates of amyloid aggregation. Furthermore, in the presence of phospholipids and cholesterol amyloid formed structurally different oligomers are fibrils that exerted significantly greater cell toxicity compared to those formed in the lipid-free environment.
Introduction:
Alzheimer’s disease (AD) is a severe progressive pathology that is characterized by irreversible deterioration of memory, as well as a substantial impairment of cognition and behavior.[1–3] There are more than 6 million AD patients in the US alone, whereas the number of people diagnosed with AD in the world is reaching 44 million.[4] AD is characterized by a progressive degradation of neurons in the frontal cortex of the brain.[5] Although the exact cause of the neurodegeneration is unclear, there is a growing body of evidence that AD can be linked to the abrupt aggregation of amyloid (). This protein aggregates forming highly toxic oligomers and fibrils.[6,7] Solid-state nuclear magnetic resonance (ss-NMR) and cryo-electron microscopy (cryo-EM) allowed for the elucidation of the secondary structure of fibrils with Angstrom spatial resolution.[8–11] It was found that peptide formed two -sheets with ~ 4.7Å inter-strand distances that self-assembly forming cross-β-sheet, thermodynamically stable structure that has ~10Å distance between two -sheets.[12–14] The cross-β-sheet structure stretch microns in length forming filaments which, in turn, can intertwine and coil with other filaments building mature fibrils.[15–17]
Aβ oligomers are transient specimens with a large distribution of shapes and sizes.[18–20] Their morphological heterogeneity, as well as low concentrations of oligomers, limit the use of ss-NMR and cryo-EM for their studies. These limitations can be overcome with several optical nanoscopy techniques such as atomic force microscope Infrared (AFM-IR) spectroscopy.[21–26] In AFM-IR, the metalized scanning probe is positioned on the sample of interest.[26–28] Next, the scanning probe is illuminated by light, which causes thermal expansion in the protein sample.[29,30] These thermal expansions are collected by the scanning probe and then transformed into IR spectra, which, in turn, can be used to determine the protein secondary structure of the analyzed specimens.[31–33] Using AFM-IR, Zhou, and co-workers were able to reveal the secondary structure of -synuclein (-Syn) oligomers, protein aggregates that are linked to Parkinson’s disease.[34] It was found that in the early stages of protein aggregation, two distinctly different types of oligomers were formed. One of them is dominated by -helical/unordered structure, whereas the second type of oligomers was primarily composed of anti-parallel- and parallel-β-sheet.[34] Furthermore, the oligomers with -helical/unordered structure remained unchanged during protein aggregation, whereas -sheet-rich oligomers propagated into fibrils.[34] Similar findings were reported by Hemmingsen and Ghosh groups that investigated structural heterogeneity of and Tau aggregates, respectively.[35,36] Using time-resolved IR, Peralvarez-Marin investigated aggregation of a short fragment () [37]. It was found that this peptide first adopted a -strand before further assembly into fibrils. Several research groups recently demonstrated that oligomers were dominated by anti-parallel -sheet secondary structure, as was evident form an intense band at 1695 cm−1 in the IR spectra acquired from these aggregates [18,38]. It was also found that IR spectra acquired from mature fibrils exhibit vibrational bands ~1630 cm−1, which correspond to the parallel -sheet [19,39,40]. Based on these findings researchers proposed that such anti-parallel to parallel -sheet rearrangement was taken place upon the preparation of oligomers into fibrils [41,42]. Finally, experimental findings reported by Popova and co-workers demonstrated that parallel vs anti-parallel -sheet secondary structure of fibrils is primarily determined by the length of the peptide [43]. Specifically, it was found that formed fibrils with parallel -sheet, whereas a short with anti-parallel -sheet secondary structure.
A growing body of evidence suggests that lipids can uniquely alter the secondary structure of amyloid oligomers and fibrils.[44,45] Dou and co-workers discovered that phosphatidylcholine (PC) and phosphatidylserine (PS) uniquely altered the secondary structure of -Syn oligomers present at the early stages of protein aggregation compared to the oligomers formed in the lipid-free environment.[46] Similar findings were recently made by Rizevsky and co-workers.[47] Specifically, the researchers found that cardiolipin (CL) and PC uniquely altered the secondary structure and toxicity of both oligomers and fibrils. Furthermore, utilization of AFM-IR revealed that both PC and PS were present in the structure of -Syn oligomers.[46] These findings suggested that lipids templated protein aggregation. Several research groups demonstrated that such templation is initiated by electrosctatic interactions that are developed between polar heads of lipids and charge amino acids of proteins. Consequently, chemical structure of the lipid can uniquely alter the stability and aggregation properties of amyloidogenic proteins. Zhang et al. found that low levels of anionic lipids promoted aggregation of islet amyloid precursor protein (IAPP), as well as facilitated membrane permeability of the corresponding IAPP-lipid aggregates. At the same time, zwitterionic lipid did not alter the rate of IAPP aggregation, whereas cholesterol at or below physiological levels significantly decelerated IAPP amyloid formation, as well as lowered the propensity of IAPP aggregates to cause membrane leakage.[48] Matveyenka and co-workers decently demonstrated that protein-lipid aggregates induce irreversible endoplasmic reticulum (ER) stress in neuronal cells. Since ER and mitochondria are a continuous tubular network of membranes in the cytoplasm, one can expect that amyloid aggregates can also induce ER-associated mitochondrial impairment.
Microscopic examination revealed a significant reduction in the number of mitochondria in pyramidal neurons located in the frontal cortex of AD patients compared to the number of mitochondria present in neurons of healthy individuals.[49] Furthermore, such AD patients exhibit substantial mitochondrial abnormalities and mitochondrial disfunctions.[50,51] Using Drosophila models, Iijima-Ando and co-workers demonstrated that induced abnormal mitochondrial dynamics is an early stage of neurodegeneration.[52] Fragmented mitochondria were also observed near amyloid plaques in an APP transgenic model using an in vivo multiphoton imaging.[53] All these factors, as well as the reduced levels of critical components of the electron transport chain in the brain of AD patients, suggesting that mitochondrial impairment can be the underlying cause of AD.[54,55]
Expanding upon this, we investigate the role of mitochondrial lipids in the aggregation properties of . Specifically, we aim to determine the extent to which PC, CL, and cholesterol (Chol) can alter the rate of aggregation. PC is a zwitterion that dominates in the mitochondrial membranes of eukaryotic cells, including astrocytes and neurons.[56] CL is a unique negatively charged lipid that occupies around 20% of the inner mitochondrial membrane, whereas it regulates electron transport complexes, carrier proteins, and phosphate kinase.[57,58] Mitochondrial membrane also contains around 5% of cholesterol (Chol) that determines the fluidity of the lipid bilayer.[59,60] We also utilize a set of biophysical methods that include AFM-IR, circular dichroism, and conventional Infrared (IR) spectroscopy to examine the secondary structure of oligomers and fibrils that were grown in the presence of PC, CL, and Chol. Finally, we determine the extent to which these lipids change the toxicity of aggregates.
Results
Lipids uniquely alter the rate of aggregation.
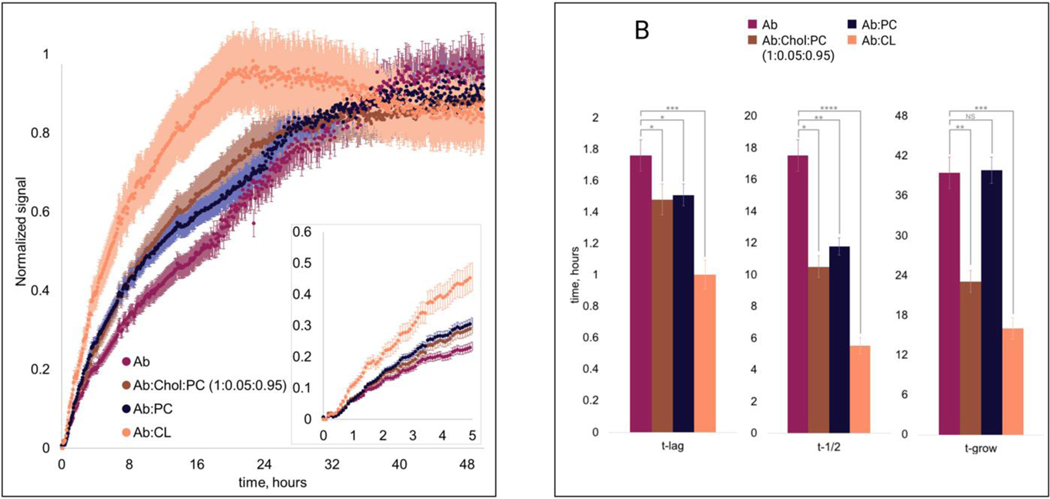
At pH 7.4, rapidly aggregates forming oligomers and fibrils, protein aggregates that enhance the fluorescence of thioflavin T (ThT). Therefore, we used ThT fluorescence to investigate the extent to which lipids alter the rate of aggregation. In the lipid-free environment, exhibited a short lag phase (), which was followed by a rapid increase in the ThT signal that reaches 50% () of its maximal value at 17±0.2h and 90% () at 40±0.2h, Figure 1. Our results showed that phosphatidylcholine (PC), drastically shortened of aggregation. Furthermore, PC accelerated aggregation which was evident from the significantly reduced . However, at the late stage, rates of and :PC aggregation appeared to be very similar (). Based on these findings, we can conclude that PC promotes the formation of oligomers. However, it has a very small if any effect on the rate of oligomer propagation into fibrils.
Figure 1.
ThT kinetics (A) of (amyloid ) aggregation in presence of LUVs (large unilamellar vesicles) and the lipid-free environment with the histograms (B) of , , and , where statistical analysis was performed Using One-way ANOVA, shows significant differences for all testing groups, n-value – 10, P-value – 0.000232. Two-tailed Student’s t-test was performed for multiple comparison procedures and the statistical test error bars represent Standard Deviation.
In the presence of cardiolipin (CL), exhibited even shorter and smaller values of and . Thus, CL strongly facilitated aggregation and, unlike PC, enhanced the propagation of oligomers into fibrils. These results are in good agreement with the experimental findings reported by Galvagnion and co-workers. Specifically, the researchers showed that the presence of LUVs of phospholipids allows for a rapid increase in the local concentration of -Syn on their surfaces, which promotes protein assembly into oligomers and fibrils.
Neuronal membranes contain ~5% of cholesterol (Chol), a lipid that lowers the fluidity of plasma membranes. Therefore, it becomes important to investigate whether Chol can alter the rate of aggregation. For this, we exposed monomeric to the mixture of Chol and PC (5:95 mol%). We found that 5% Chol in PC only insignificantly altered the rate of aggregation relative to the protein aggregation in the presence of PC itself (, ). However, we found that :Chol:PC drastically enhanced of the protein aggregation, which was not evident for :PC. These findings show that Chol does not significantly alter the rate of oligomer formation. However, this lipid strongly facilitates the propagation of oligomers into fibrils.
Elucidation of morphology and protein secondary structure of oligomers grown in the presence of lipids and in a lipid-free environment.
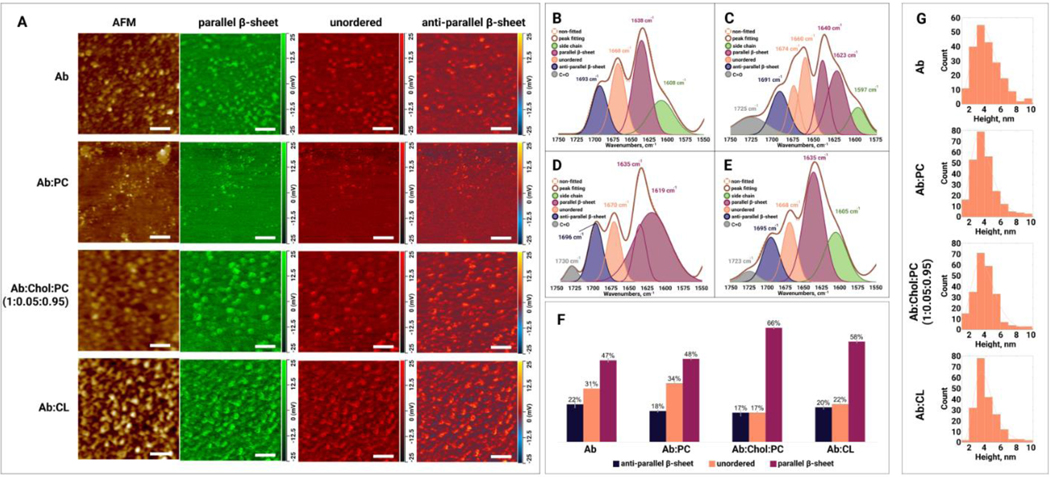
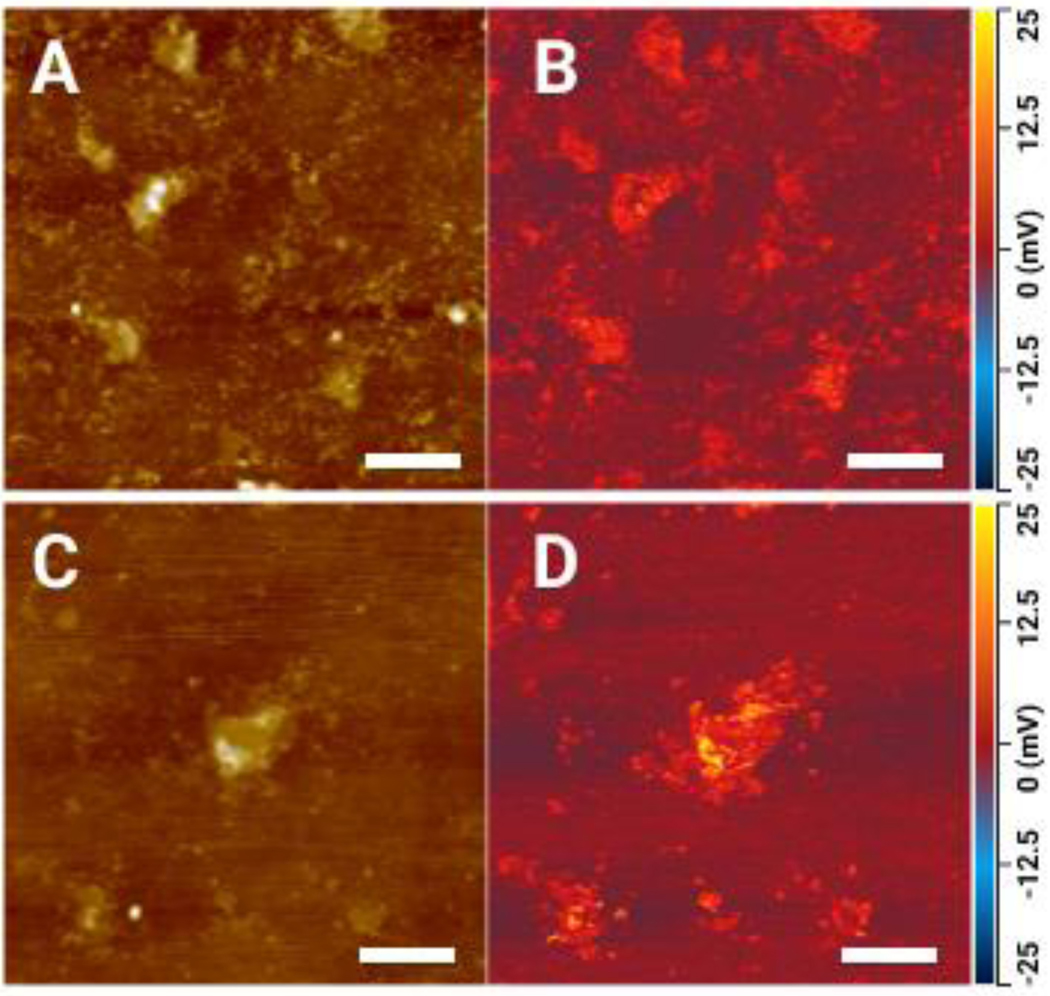
Based on the kinetic results discussed above, we analyzed the topology and secondary structure of aggregates present at the early (3h), middle (22h), and late (48h) stages of protein aggregation. We found that early-stage aggregates had a spherical appearance with heights ranging from 2 to 5 nm, Figure 2, A, G. Morphologically similar aggregates were observed for :PC, :CL and :Chol:PC. Their height ranged from 2 to 9 nm, Figure 2, G. It should be noted that in addition to the oligomers, :PC possessed large spherical lipid clusters (200–300 nm in diameter) that were not observed in :CL and :Chol:PC, Figure 3. Next, we performed a systematic AFM-IR analysis of at least 50 individual aggregates observed in , :PC, :CL and :Chol:PC. The acquired spectra provided information about the secondary structure of these protein specimens. Specifically, we were able to quantify the amount of parallel (1630 cm−1) and anti-parallel (1694 cm−1) -sheet, as well as unordered protein (1667 cm−1) in the secondary structure of aggregates.[30,46,61,62] AFM-IR images of protein oligomers revealed relatively similar abundance of these protein secondary structures in the oligomers observed in each of the samples. These findings suggest that such oligomers exhibit low structural diversity. Our results also showed that the protein secondary structure of the early stage :PC and oligomers grown in the lipid-free environment was very similar, Figure 2, B–F and G, and Table S1. Specifically, these oligomers contained ~47% parallel and ~20% anti-parallel -sheet with ~32% of unordered protein secondary structure. However, both :CL and :Chol:PC oligomers exhibited significantly higher content of parallel -sheet and significantly lower amount of unordered protein in their secondary structure. It should be noted that all analyzed early-stage oligomers had very similar amount (17–22%) of anti-parallel -sheet in their secondary structure. Thus, we can conclude that lipids uniquely altered the secondary structure of oligomers formed at the early stages of protein aggregation.
Figure 2.
(A) AFM height images and IR absorption maps of (amyloid ) oligomers formed at the early stage (3h) of protein aggregation in the absence and presence of PC (phosphatidylcholine), Chol (cholesterol) :PC and CL (cardiolipin). IR absorption maps at 1630 cm−1 reveal distribution of parallel -sheet, at 1667 cm−1 unordered protein, and at 1694 cm−1 anti-parallel -sheet. Scale bars are 200 nm. Averaged IR spectra of (B), :PC (C), :Chol:PC (D) and :CL (E) oligomers with the fitted protein secondary structures. Histogram (F) summarizes relative amount of parallel -sheet, unordered protein and anti-parallel -sheet in the analyzed oligomers. Statistical analysis was performed Using One-way ANOVA, shows significant differences for all testing groups, n-value – 10, P-value – 0.000563. Tukey’s HSD Post Hoc was performed for multiple comparison procedures and the statistical test, showed the following difference between tested groups, error bars represent Standard Deviation. Corresponding P-values listed in supplementary tables. (G) Height profile of short aggregates at the early stage (3h) of protein aggregation in the absence and presence of PC, Chol:PC and CL.
Figure 3.
IR absorption map at 1100 cm−1 (B, D) and AFM pictures (A, C) of Ab:PC after 3 hours of incubation. Scale bars 0.4 um.
Middle stage oligomers exhibited spherical appearance with an average height of ~4 nm. Morphologically similar oligomers were observed for :CPC, :CL and :Chol:PC, Figure 4, A. AFM-IR analysis of protein oligomers observed at the middle stage of aggregation revealed an increase in the amount of parallel -sheet in :PC relative to themselves, Figure 4, B–F and Table S1. Furthermore, :CL and :Chol:PC oligomers possessed a greater amount of parallel -sheet than :PC aggregates. We observed the opposite distribution of anti-parallel -sheet in these protein species. Specifically, :Chol:PC oligomers exhibited the lowest (9%), whereas had the highest (26%) amount of anti-parallel -sheet, Figure 4, B–F and Table S1. Finally, all middle stages of aggregates possessed similar amount of unordered protein in their secondary structure.
Figure 4.
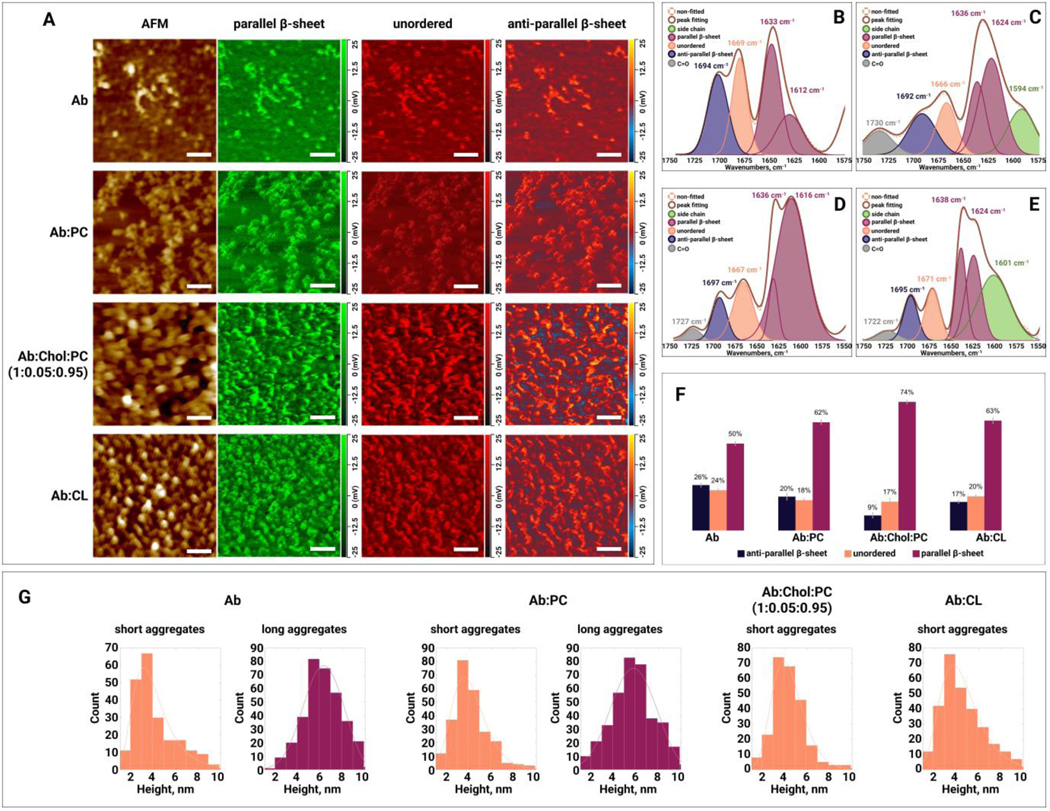
(A) AFM height images and IR absorption maps of (amyloid ) oligomers formed at the middle stage (22h) of protein aggregation in the absence and presence of PC (phosphatidylcholine), Chol (cholesterol) :PC and CL (cardiolipin). IR absorption maps at 1630 cm−1 reveal distribution of parallel -sheet, at 1667 cm−1 unordered protein, and at 1694 cm−1 anti-parallel -sheet. Scale bars are 200 nm. Averaged IR spectra of (B), :PC (C), :Chol:PC (D) and :CL (E) oligomers with the fitted protein secondary structures. Histogram (F) summarizes relative amount of parallel -sheet, unordered protein and anti-parallel -sheet in the analyzed oligomers. Statistical analysis was performed Using One-way ANOVA, shows significant differences for all testing groups, n-value – 10, P-value – 0.000497. Tukey’s HSD Post Hoc was performed for multiple comparison procedures and the statistical test, showed the following difference between tested groups, error bars represent Standard Deviation. Corresponding P-values listed in supplementary tables. (G) Height profile of short and long aggregates at the early stage (22h) of protein aggregation in the absence and presence of PC, Chol:PC and CL.
We observed drastic differences in the secondary structure of late-stage (48h) oligomers grown in the lipid-free environment, as well as in the presence of PC, CL, and Chol:PC, Figure 5. Specifically, and :CL oligomers exhibited ~61% of parallel -sheet in their secondary structure. :PC oligomers possessed significantly lower (50%), whereas :Chol:PC oligomers had significantly higher (69%) amount of parallel -sheet in their secondary structure compared to both and :CL oligomers. At the same time, the amount of anti-parallel -sheet was very similar in and :Chol:PC (~10%) oligomers, Table S1. Finally, these late-stage protein species exhibited drastically different content of unordered protein. Specifically, we found that :PC oligomers contained ~33%, whereas :Chol:PC ~22% of unordered protein in their secondary structure. At the same time, the amount of this secondary structure was found to be very similar in and :CL (~27%) oligomers, Table S1. Thus, we can conclude that lipids uniquely alter the secondary structure of aggregates present on the late stage of protein aggregation. It should be noted that a height of all observed inhibiters at this stage ranged from 2 to 9 nm. This indicates that lipids uniquely alter the secondary structure and not morphology of oligomers formed at the late stage of protein aggregation.
Figure 5.
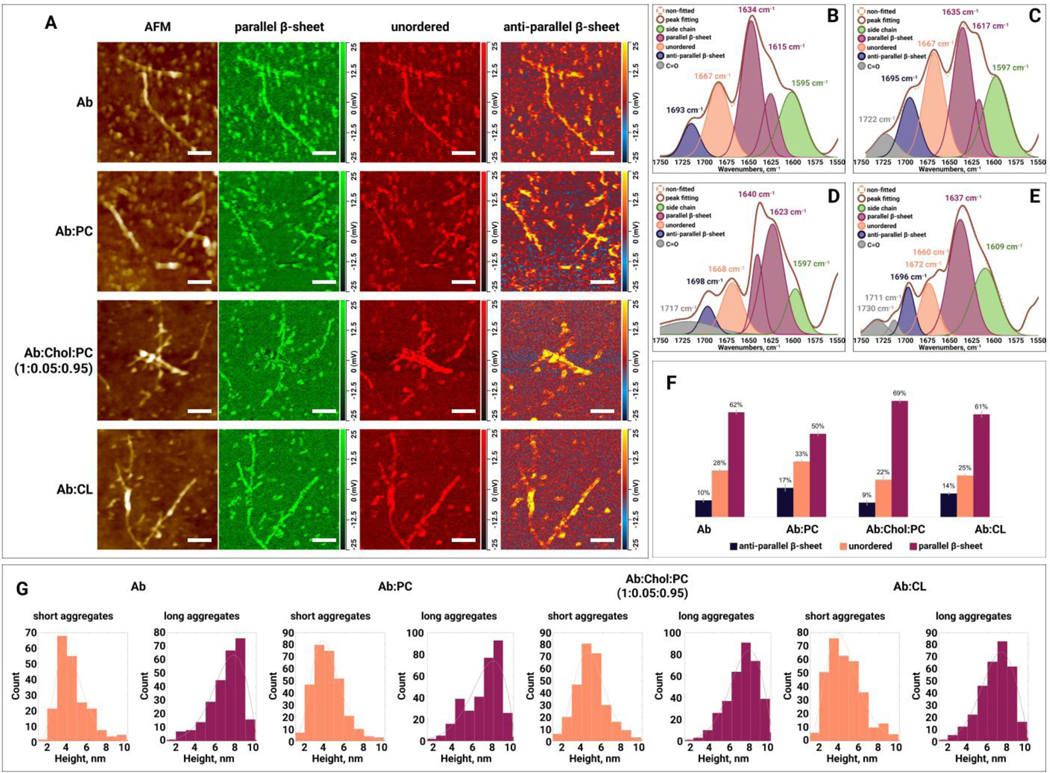
(A) AFM height images and IR absorption maps of (amyloid ) formed at the late stage (48h) of protein aggregation in the absence and presence of PC (phosphatidylcholine), Chol (cholesterol) :PC and CL (cardiolipin). IR absorption maps at 1630 cm−1 reveal distribution of parallel -sheet, at 1667 cm−1 unordered protein, and at 1694 cm−1 anti-parallel -sheet. Scale bars are 200 nm. Averaged IR spectra of (B), :PC (C), :Chol:PC (D) and :CL (E) oligomers with the fitted protein secondary structures. Histogram (F) summarizes relative amount of parallel -sheet, unordered protein and anti-parallel -sheet in the analyzed oligomers. Statistical analysis was performed Using One-way ANOVA, shows significant differences for all testing groups, n-value – 10, P-value – 0.000942. Tukey’s HSD Post Hoc was performed for multiple comparison procedures and the statistical test, showed the following difference between tested groups, error bars represent Standard Deviation. Corresponding P-values listed in supplementary tables. (G) Height profile of short and long aggregates at the early stage (48h) of protein aggregation in the absence and presence of PC, Chol:PC and CL.
Morphological analysis of protein oligomers formed after 5 days (120 h) of incubation of in the presence of lipids and in a lipid-free environment revealed presence of both oligomers and fibrils with a height of 3–5 nm and 7–9 nm, respectively (Figure 6, A–B, and G). Thus, we can conclude that presence of lipids during aggregation did not significantly alter the morphologies of oligomers and fibrils. AFM-IR revealed major changes in the secondary structure of and :PC oligomers present at day 5 protein aggregation. Specifically, :Chol:PC oligomers had a significantly lower amount of parallel -sheet (32%) than (55%) and :CL (60%) oligomers, Figure 6. :PC oligomers also possessed nearly twice lower amount of anti-parallel -sheet (10%) than (21%) and :CL (19%) oligomers, Table S1. However, the amount of unordered protein secondary structure was higher in :PC (43%) oligomers than in (24%) oligomers. Based on this observation, we can conclude that lipids drastically altered protein secondary structure of oligomeric species present at day 5 of protein aggregation.
Figure 6.
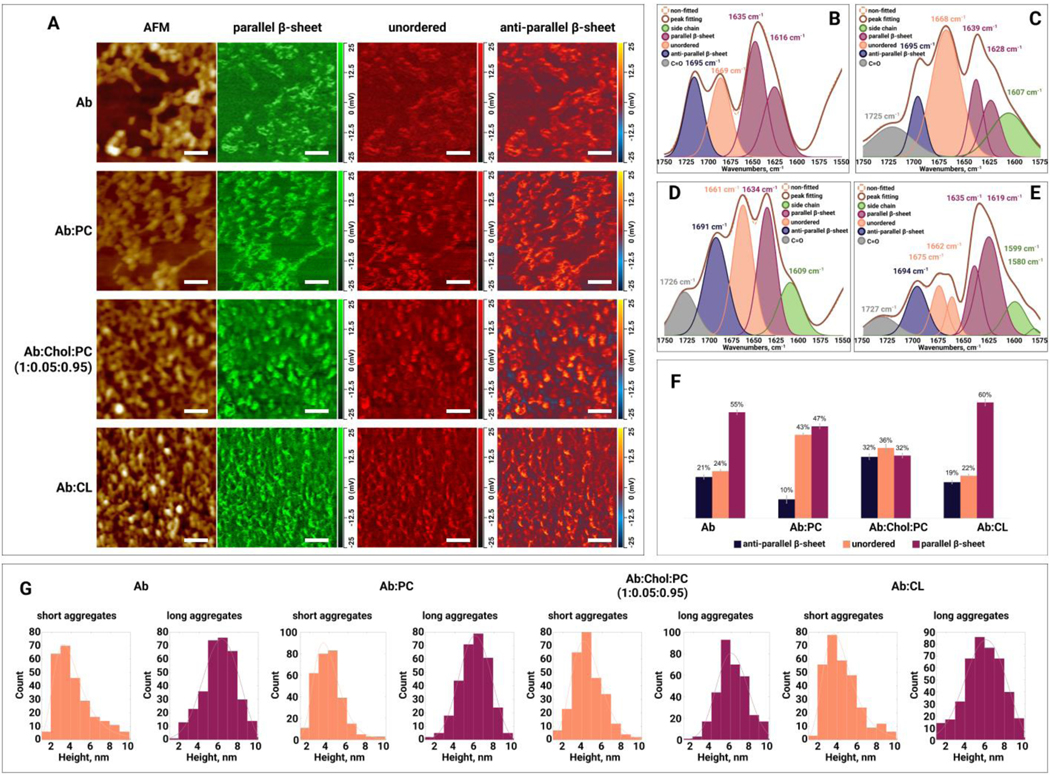
(A) AFM height images and IR absorption maps of (amyloid ) oligomers formed at the late stage ( day 5) of protein aggregation in the absence and presence of PC (phosphatidylcholine), Chol (cholesterol) :PC and CL (cardiolipin). IR absorption maps at 1630 cm−1 reveal distribution of parallel -sheet, at 1667 cm−1 unordered protein, and at 1694 cm−1 anti-parallel -sheet. Scale bars are 200 nm. Averaged IR spectra of (B), :PC (C), :Chol:PC (D) and :CL (E) oligomers with the fitted protein secondary structures. Histogram (F) summarizes relative amount of parallel -sheet, unordered protein and anti-parallel -sheet in the analyzed oligomers. Statistical analysis was performed Using One-way ANOVA, shows significant differences for all testing groups, n-value – 10, P-value – 0.000198. Tukey’s HSD Post Hoc was performed for multiple comparison procedures and the statistical test, showed the following difference between tested groups, error bars represent Standard Deviation. Corresponding P-values listed in supplementary tables. (G) Height profile of short and long aggregates at the early stage (day 5) of protein aggregation in the absence and presence of PC, Chol:PC and CL.
It should be noted that AFM-IR spectra collected from all oligomers that were grown in the presence of lipids had a well-defined peak around 1720 cm−1 (Fig. 3–8), which can be assigned to the ester (C=O) vibration of lipids. These findings demonstrate that corresponding lipid molecules are present in :CL, :PC, and :Chol:PC oligomers. AFM-IR spectra collected from some of the analyzed oligomers also had a shoulder around 1590 cm−1 (Figures 2–5), which can be assigned to amino acid side chains of valine and glycine.
Figure 8.
CD (A) and FTIR (B) spectra of (amyloid ) collected at 5 day time point of protein aggregation in presence of PC (phosphatidylcholine), Chol (cholesterol) :PC and CL (cardiolipin) (0.05:0.95) LUVs (large unilamellar vesicles).
Nanoscale structural analysis of fibrils present at different stages of protein aggregation.
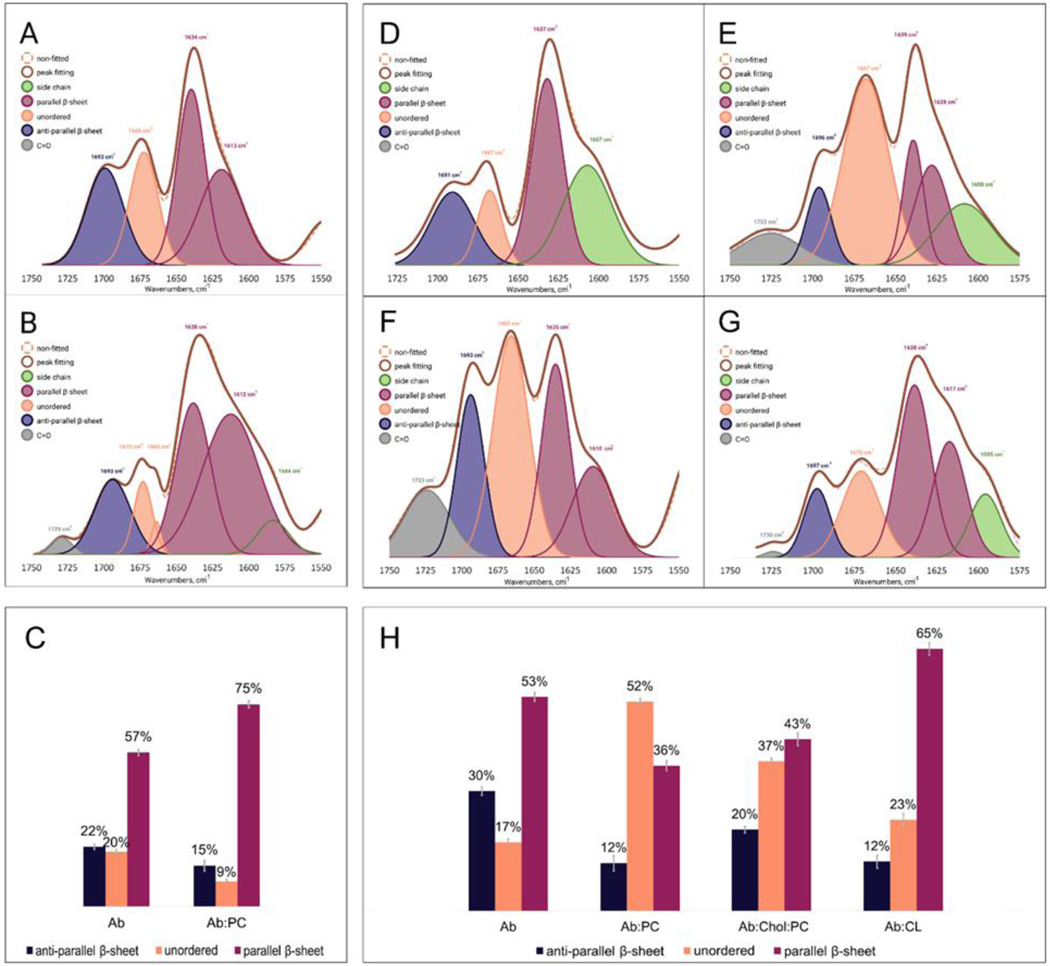
At the early (3h) stage of protein aggregation, we observed no fibrils present in any of the analyzed samples. However, at the middle stage (22h), fibril-like protein species were observed for and :PC. We found that :PC fibrils exhibited a significantly higher amount of parallel -sheet (75%) than fibrils (57%), Figure 7, A–C. :PC fibrils also possessed nearly twice the lower amount of anti-parallel -sheet and unordered protein secondary structure (15% and 9%, respectively) than fibrils (22% and 20%, respectively). AFM-IR analysis of fibrils that were present at the late state (48h) in all analyzed samples revealed drastic differences in their secondary structure, Figure 7, D–H and Table S2. Specifically, we found that :PC fibrils exhibited the lowest amount of parallel -sheet (36%) and the largest amount of unordered protein secondary structure (52%). The amount of parallel -sheet was found to be different in :Chol:PC (43%) and :CL (65%) fibrils compared to the fibrils formed in the lipid free environment (53%). Furthermore, :Chol:PC and fibrils had nearly twice and three times higher amount of anti-parallel -sheet than both :PC and :CL fibrils, respectively. Thus, we can conclude that the secondary structure of fibrils directly depends on the lipid present in the protein solution upon their formation. We can also conclude that presence of PC favored the accumulation of unordered protein secondary structure in fibrils, whereas the presence of CL yielded fibrils with the highest content of parallel -sheet. Thus, we can conclude that lipids determine differences in the secondary structure of mature fibrils. It should be noted that this information about the structure of fibrils could not be obtained using conventional optical spectroscopy, such as CD or FTIR, Figure 8 A,B.
Figure 7.
Averaged IR spectra of (amyloid ) (A) and :PC (phosphatidylcholine) (B) fibrils formed at 22h with the fitted protein secondary structures. Histogram (C) summarizes relative amount of parallel -sheet, unordered protein and anti-parallel -sheet in the analyzed and :PC fibrils. Averaged IR spectra of (D), :PC (E), :Chol (cholesterol) :PC (F) and :CL (cardiolipin) (G) fibrils formed at 48h with the fitted protein secondary structures. Histogram (H) summarizes relative amount of parallel -sheet, unordered protein and anti-parallel -sheet in the analyzed , :PC, :Chol:PC and :CL fibrils. Statistical analysis was performed Using One-way ANOVA, shows significant differences for all testing groups, n-value – 10, P-value – 0.000874. Tukey’s HSD Post Hoc was performed for multiple comparison procedures and the statistical test, showed the following difference between tested groups, error bars represent Standard Deviation. Corresponding P-values listed in supplementary tables.
Elucidation of the relationship between protein secondary structure and toxicity of oligomers and fibrils.
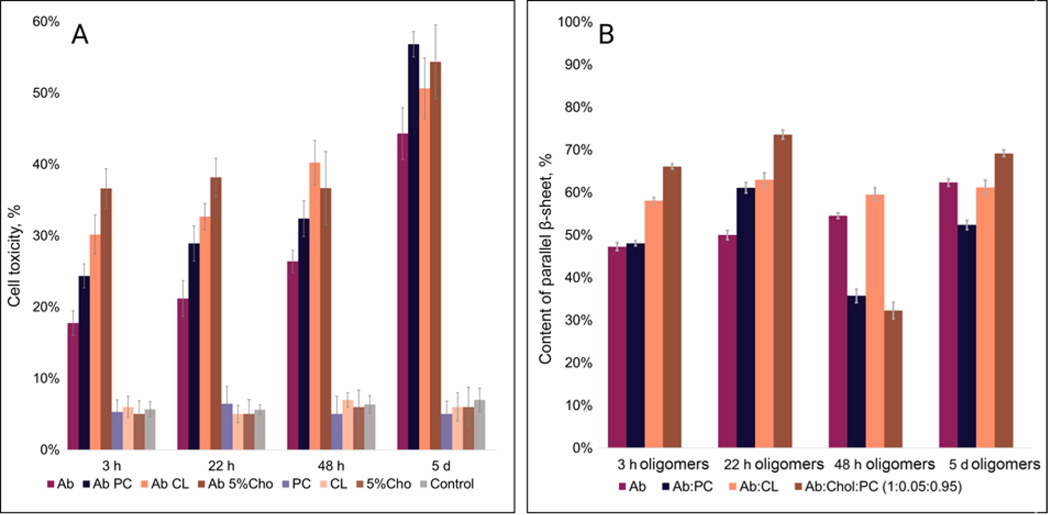
One may wonder about the biological significance of the discussed above results. To answer this question, we investigated the extent to which lipids could alter the toxicity of aggregates using mice midbrain N27 cells. We found that the toxicity of aggregates that were grown in the presence of lipids at the early, middle, and late stages were greater than the toxicity of aggregates formed in the lipid-free environment, Figure 9, A and Table S3. Furthermore, the toxicity of :Chol:PC oligomers was greater than the toxicity of :CL oligomers. LDH results also showed that the toxicity of :PC was lower than the toxicity of :CL and higher than the toxicity of oligomers grown in the lipid-free environment. These findings show that lipids uniquely alter the toxicity of oligomers formed at the early stage of protein aggregation.
Figure 9.
(A) Results of LDH (lactate dehydrogenase) toxicity assay showing relative toxicity of (amyloid ) aggregates formed at different stages of protein aggregation; (B) Content of parallel -sheet (1610–1640 cm−1) in an average of short oligomers by all-time points. Statistical analysis was performed Using One-way ANOVA, shows significant differences for all testing groups, n-value – 10, P-value – 0.000435. Tukey’s HSD Post Hoc was performed for multiple comparison procedures and the statistical test, showed the following difference between tested groups, error bars represent Standard Deviation. Corresponding P-values listed in supplementary tables.
We also found distinct differences in the toxicity that middle-stage oligomers grown in the presence of lipids and a lipid-free environment. Specifically, :Chol:PC oligomers exerted the greatest toxicity compared to all analyzed protein specimens, Table S3. We also found that the toxicity gradually decreased from :CL to :PC and oligomers. We also found that late-stage :Chol:PC and :CL aggregates exerted similar toxicity, which in turn was greater than the toxicity of :PC and aggregates, Table S3. Finally, we found that the toxicity of :Chol:PC, :CL, :PC and fibrils was very similar.
Next, we compared the relative amount of different protein secondary structures in the analyzed protein oligomers observed at early, middle and late stages of protein aggregation, Figure 9, B and Table S4. We found a direct correlation between the amount of parallel -sheet in protein aggregates and the levels of toxicity that was exerted by these samples. Specifically, early-stage :Chol:PC aggregates possessed the highest amount of parallel -sheet (~68%) compared to all other samples. As was discussed above, these aggregates were the most toxic to the mice’s midbrain N27 cells. :CL contained around 60% of parallel -sheet and their toxicity was lower compared to the toxicity of :Chol:PC oligomers. It should be noted that the amount of parallel -sheet in and :PC was very similar (~48%), Figure 9, B and Table S4. Consequently, their toxicities were lower than the toxicity of :Chol:PC and :CL oligomers. A similar relationship between the amount of parallel -sheet and toxicity is observed for middle state oligomers. These results demonstrate that the toxicity of oligomers is determined by the amount of parallel -sheet in their structure, which, in turn, depends on the chemical nature of the lipid present during protein aggregation.
However, we did not observe a direct correlation between the amount of parallel -sheet and toxicity of oligomers and fibrils formed at the late-stages (48h and day 5). We infer that such relationship was not evident because at those stages both oligomers and fibrils were present. Highly likely, formed oligomers and fibrils exerted drastically different cell toxicities. Therefore, in those samples, no clear relationship between the protein secondary structure and cell toxicity of the aggregates can be observed.
Discussion:
A growing body of evidence shows that has a strong affinity to lipids.[63–67] When exposed to lipid bilayers, the C-terminal hydrophobic region of adopts an -helical conformation that facilitates partial insertion of the peptide into membranes.[68,69] These conformational changes trigger aggregation into oligomers that form Ca2+ permeable pores in the lipid bilayers.[70,71] Our findings show that the secondary structure of such oligomers is determined by the chemical nature of lipid present in the bilayer. Specifically, in the presence of CL, formed oligomers that possessed a significantly higher amount of parallel -sheet than the oligomers grown in the presence of PC. Thus, we can conclude that anionic lipids enhance the -sheet content of early-stage oligomers. Furthermore, the presence of Chol, even at a low molar ratio (5%) in PC, yields oligomers with the highest (66%) -sheet content compared to :CL (58% -sheet), :PC (48% -sheet) and alone (48% -sheet), Figure 9. Based on these results, we can conclude that Chol drastically alters the secondary structure of early-stage oligomers increasing their -sheet content. It is important to emphasize that the amount of parallel -sheet has a direct correlation with the toxicity of aggregates formed at the early and middle stages of protein aggregation. Therefore, one can expect that lipids modulate the toxicity of aggregates by altering their -sheet content. It should be noted that a direct relationship between toxicity and the amount of parallel -sheet was not evident for aggregates formed at the late stages (48h and 120h (5days)) of protein aggregation. As was discussed above, at these stages of protein aggregation, in addition to the oligomers AFM imaging revealed presence of fibrils. Previously reported results by our and other research groups demonstrated that oligomers and fibrils exerted drastically different cell toxicities [72–74]. Thus, two factors determine toxicity of protein aggregates formed at 48h and 5 days: (i) oligomer vs fibril ratio and (ii) the amount of parallel -sheet. Therefore, no direct relationship could be observed between toxicity and the amount of parallel -sheet for such heterogeneous, from perspective of protein aggregates, samples.
Our results also show that in addition to the structural changes induced in early-stage oligomers, lipids uniquely alter the aggregation rates of . Specifically, we found that CL strongly accelerates protein aggregation compared to the effects exerted by PC and Chol:PC. These findings are in good agreement with the results reported by Chauhan and co-workers.[75] Specifically, the researchers found that anionic phospholipids accelerated the rate of aggregation more strongly than zwitterionic lipids. Matveyenka and co-workers previously investigated the effect of PC and CL on the rate of insulin aggregation.[61] It was found that CL accelerated protein aggregation, whereas PC strongly inhibited insulin fibril formation. At the same time, our ThT results show that PC cause no inhibition of . Instead, these zwitterionic lipids accelerated aggregation. This difference could be attributed to the differences in the conformational changes induced by PC on insulin and . Highly likely, PC stabilizes monomeric insulin,[61] which drastically lowers its aggregation properties, whereas conformational changes induced by PC in , on the opposite, favor its oligomerization and fibril formation. The observed difference in the effect of PC on insulin and aggregation is also evident for insulin and oligomers and fibrils. Specifically, PC drastically reduced the toxicity of insulin oligomers, whereas oligomers that were grown in the presence of PC exerted higher toxicity than oligomers formed in the lipid-free environment. AFM-IR analysis of insulin oligomers revealed the dominance of unordered proteins in their secondary structure. At the same time, nearly half of :PC oligomers are occupied by parallel -sheet. These results further support the direct relationship between the amount of parallel -sheet and the toxicity of amyloid aggregates. Finally, experimental results reported in this work show that lipids are present in the aggregates that were formed in the presence of CL, PC, and Chol:PC. One can expect that presence of lipids in the structure of oligomers and fibrils can drastically alter their hydrophobicity making them more permeable for lipid bilayers. Thus, the presence of lipids in the aggregates can be caused the increase in their toxicity compared to the lipid-free oligomers and fibrils.
These results are in a good agreement with the findings of Matveyenka and co-workers which demonstrated that toxicity of insulin and lysozyme aggregates could be uniquely altered by lipids [61,76–80]. Specifically it was found that presence of PC at 1:1 molar ratios with insulin and lysozyme resulted in formation of small oligomers that exerted nearly three times lower cell toxicity compared to proteins fibrils grown in the lipid-free environment [76–78]. Furthermore, these studies demonstrate that lipids also altered rates of insulin and lysozyme aggregation [76–78]. Matveyenka and co-workers recently demonstrated that such protein:lipid oligomers and fibrils were endocytosed by cells [78]. Next, these aggregates damage endosomal membranes leaking into the cytosol. In parallel, protein:lipid oligomers and fibrils activate unfolded protein response, which indicates substantial damage of endoplasmic reticulum (ER), an important cell organelle used for calcium storage, protein synthesis and folding [77]. This leads to the subsequent damage of cell mitochondria and overall enhancement of ROS levels in the cell [76–80].
Conclusions:
Our experimental results show that PC, CL, and Chol alter the rate of aggregation. Anionic CL showed the strongest acceleration of aggregation compared to zwitterionic PC and uncharged Chol. We also found that PC, CL, and Chol uniquely altered the secondary structure of oligomers observed at the early-, middle- and late-stage aggregation. Specifically, CL and Chol drastically increased the amount of parallel -sheet in oligomers. This caused an increase in toxicity of these protein species compared to the toxicity of oligomers grown in the presence of PC. Thus, we can conclude lipids modulate the toxicity of oligomers by altering their -sheet content.
Materials and Methods:
Large unilamellar vesicles (LUVs) preparation:
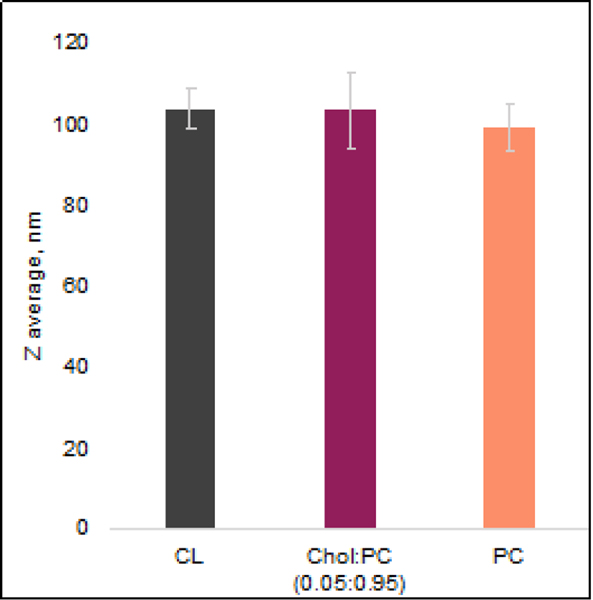
14:0 DMPC (PC) (Cat.N. 850345), 18:00 cardiolipin (CL) (Cat.N. 710334), and cholesterol (Chol) (Cat.N. 700100) were purchased at Avanti Polar Lipids. PC and CL were dissolved in 20 mM phosphate buffer, pH 7.4 to reach the final concentration of 400 μM. For 5 mol% cholesterol and 95 mol% of PC (Chol:PC), both PC and Chol were first mixed in chloroform at the corresponding molar ratio. After chloroform was evaporated by the stream, a lipid film was dissolved in 20 mM phosphate buffer, pH 7.4. All lipid samples were exposed to 5 freeze-thaw cycles in liquid nitrogen and a water bath to make LUVs. Finally, lipid solutions were passed through the extruded (Avanti Polar Lipids, Cat.N. 610000) equipped with a 100 nm membrane (Avanti Polar Lipids, Cat.N. 610005) to reach LUVs with ~100 nm dimeter, Figure 10.
Figure 10.
LUVs (large unilamellar vesicles) radii determined using DLS. Error bars represent Standard Deviation, n-value - 10.
Dynamic Light Scattering (DLS):
LUV diameter was determined by DLS using a Zetasizer Nano S. For each measurement, a solution of lipids was placed in a quartz cuvette with a 3 mm path length.
Protein aggregation:
1 mg of recombinant human (Gene script Cat.No RP10017) was dissolved in 1 ml of HFIP (Across organics, code 445820500); after all peptide was fully dissolved, HFIP was evaporated under the stream. The resulted protein film was dissolved in 6 M guanidine chloride at 4 °C. Next, 6 M guanidine chloride was replaced with 20 mM phosphate buffer, pH 7.4 using a PD-10 desalting column (Cytiva, Cat. No 17085101). Buffer exchange was performed at 4 °C to suppress peptide aggregation. Final samples contained 60 uM of and 240 uM of LUVs; the samples were incubated at 25 ºC under quiescent conditions.
Kinetic measurements:
Protein aggregation was monitored using a thioflavin T (ThT) fluorescence assay. For this, samples were mixed with ThT at a final concentration of 25 uM. Measurements were performed in 96 wells plate under a quiescent condition at 25 ºC using a Multimode microplate reader Tecan Spark, with excitation of 450 nm; the emission signal was collected at 495 nm. Measurements were performed every 5 minutes. T-test was used to determine significance level of , , and .
AFM and AFM-IR:
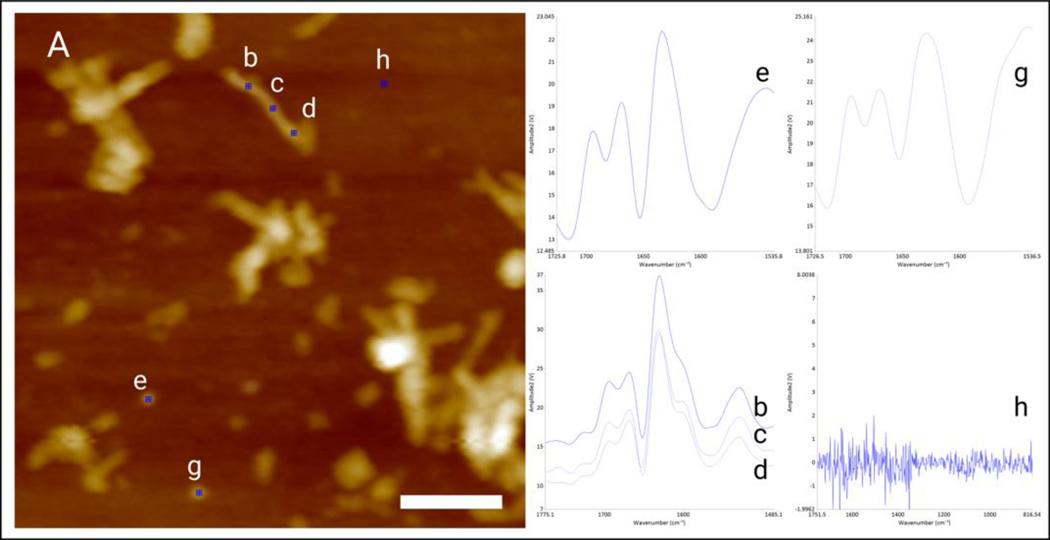
Solutions of protein aggregates were exposed to silicon wafers for 3 min. Next, the excess of the solution has removed; samples were rinsed with DI water and dried at room temperature. AFM and AFM-IR imaging were conducted using a Nano-IR3 system (Bruker, Santa Barbara, CA, USA) equipped with a QCL laser. Contact-mode AFM tips (ContGB-G AFM probe, NanoAndMore) were used to obtain all images, spectra, and IR maps. It should be noted that the sample background had no IR signal (Figure 11). All raw spectra were treated by 10 points smoothing filter in Analysis Studio v3.15 and normalized by average area. Spectral fitting was performed in GRAMS/AI 7.0 (Thermo Galactic, Salem, NH). Amide I region (1600–1700 cm−1) was fitted with 3 or 4 peaks centered at 1616 and 1636 cm−1 (parallel -sheet), 1667 cm−1 (unordered protein) and 1694 cm−1 (anti-parallel -sheet). Peak area for each secondary structure was normalized relative to the total peak area of the amide I region. Corresponding percentages of the amide I band region for each secondary structure was reported in this study. We also performed ANOVA and Tukey’s HSD Post Hoc T-test on all spectral classes discussed in this work. Results of ANOVA and Tukey’s HSD Post Hoc T-test are summarized in Supporting Tables 1, 2 and 4 (Table S1, S2 and S4).
Figure 11.
AFM picture of single (amyloid ) aggregates at 48 hour time points (A) and single spectra of short (e,g), long (b-d) Ab42 aggregates and background spectra (h).
Circular Dichroism (CD):
CD spectra were collected from all samples at 25 ºC using a J-1000 CD spectrometer (Jasco, Easton, MD, USA). For each sample, three spectra were collected within 205–250 nm.
Attenuated total reflectance Fourier-transform infrared (ATR-FTIR) spectroscopy:
Sample aliquots were placed onto ATR crystal and dried at room temperature. Spectra were measured using Spectrum 100 FTIR spectrometer (PerkinElmer, Waltham, MA, USA). Three spectra were collected from each sample.
Cell toxicity assays:
Mice midbrain N27 cells were grown in RPMI 1640 Medium (Thermo Fisher Scientific, Waltham, MA, USA) with 10% fetal bovine serum (FBS) (Invitrogen, Waltham, MA, USA) in 96 well-plate (5,000 cells per well) at 37 °C under 5% . After 24 hours, the cells were found to fully adhere to the wells reaching ~70% confluency. Next, 100 μL of the cell culture was replaced with 100 μL RPMI 1640 Medium with 5% FBS containing protein samples. Concentration of FBS was decreased to lower the baseline absorbance level of the control, as required by the LDH assay. After 48 hours of incubation, a lactate dehydrogenase (LDH) assay was performed on the cell medium using CytoTox 96 non-radioactive cytotoxicity assay (G1781, Promega, Madison, WI, USA). LDH is a cytosolic enzyme that is released into the surrounding cell culture medium upon damage of the plasma membrane. Concentration of LDH can be quantified by measurement of the conversion of lactate to pyruvate via NAD+ reduction to NADH, which in turn is used to reduce a tetrazolium salt into a red formazan product that can be measured at 490 nm. Consequently, the level of formazan is directly proportional to the amount of LDH, which, in turns, represents toxicity of certain type of protein aggregates to N27 cells. In our experiments, absorption measurements were made in a plate reader (Tecan, Männedorf, Switzerland) at 490 nm. Every well was measured 25 times in different locations. All measurements were done in triplicates. We performed ANOVA and Tukey’s HSD Post Hoc T-test on all classes of samples. Results of ANOVA and Tukey’s HSD Post Hoc T-test are summarized in Supporting Tables 3 (Table S3).
Supplementary Material
Table S1. One-way ANOVA of significant differences for all testing groups. Tukey’s HSD Post Hoc was performed for multiple comparison procedures and the statistical test, showed the following difference between tested groups.
Table S2. One-way ANOVA of significant differences for all testing groups of fibrils. Tukey’s HSD Post Hoc was performed for multiple comparison procedures and the statistical test, showed the following difference between tested groups.
Table S3. One-way ANOVA of significant differences for all testing groups of samples accordingly to LDH test. Tukey’s HSD Post Hoc was performed for multiple comparison procedures and the statistical test, showed the following difference between tested groups.
Table S4. One-way ANOVA of significant differences for all testing groups of oligomers. Tukey’s HSD Post Hoc was performed for multiple comparison procedures and the statistical test, showed the following difference between tested groups.
Acknowledgement:
We are grateful to the National Institute of Health for the provided financial support (R35GM142869).
Abbreviations:
- Aβ
amyloid
- PC
phosphatidylcholine
- CL
cardiolipin
- Chol
cholesterol
- LDH
lactate dehydrogenase
- AFM-IR
atomic force microscopy Infrared spectroscopy
- ThT
thioflavin T
- LUVs
large unilamellar vesicles
Footnotes
Conflicts of Interest: The authors declare no competing financial interests.
Data availability statement:
All data described in this manuscript are contained within the manuscript
References:
- [1].Holtzman DM, Morris JC and Goate AM (2011). Alzheimer’s disease: the challenge of the second century. Sci. Transl. Med 3, 77sr1. [DOI] [PMC free article] [PubMed] [Google Scholar]
- [2].Breijyeh Z. and Karaman R. (2020). Comprehensive Review on Alzheimer’s Disease: Causes and Treatment. Molecules 25, 5789. [DOI] [PMC free article] [PubMed] [Google Scholar]
- [3].Knopman DS, Amieva H, Petersen RC, Chetelat G, Holtzman DM, Hyman BT, Nixon RA and Jones DT (2021). Alzheimer disease. Nat. Rev. Dis. Primers 7, 33. [DOI] [PMC free article] [PubMed] [Google Scholar]
- [4].(2021). 2021. Alzheimer’s disease facts and figures. Alzheimers Dement. 17, 327–406. [DOI] [PubMed] [Google Scholar]
- [5].Long JM and Holtzman DM (2019). Alzheimer Disease: An Update on Pathobiology and Treatment Strategies. Cell 179, 312–339. [DOI] [PMC free article] [PubMed] [Google Scholar]
- [6].Chiti F. and Dobson CM (2017). Protein Misfolding, Amyloid Formation, and Human Disease: A Summary of Progress Over the Last Decade. Annu. Rev. Biochem 86, 27–68. [DOI] [PubMed] [Google Scholar]
- [7].Wesén E, Jeffries GDM, Dzebo MM and Esbjörner EK (2017). Endocytic uptake of monomeric amyloid-β peptides is clathrin- and dynamin-independent and results in selective accumulation of (1–42) compared to (1–40). Sci. Rep 7, 2021. [DOI] [PMC free article] [PubMed] [Google Scholar]
- [8].Kollmer M. et al. (2019). Cryo-EM structure and polymorphism of Abeta amyloid fibrils purified from Alzheimer’s brain tissue. Nat. Commun 10, 4760. [DOI] [PMC free article] [PubMed] [Google Scholar]
- [9].Gremer L. et al. (2017). Fibril structure of amyloid-beta(1–42) by cryo-electron microscopy. Science 358, 116–119. [DOI] [PMC free article] [PubMed] [Google Scholar]
- [10].Paravastu AK, Qahwash I, Leapman RD, Meredith SC and Tycko R. (2009). Seeded growth of beta-amyloid fibrils from Alzheimer’s brain-derived fibrils produces a distinct fibril structure. Proc. Natl. Acad. Sci. U. S. A 106, 7443–8. [DOI] [PMC free article] [PubMed] [Google Scholar]
- [11].Tycko R. (2011). Solid-state NMR studies of amyloid fibril structure. Annu. Rev. Phys. Chem 62, 279–99. [DOI] [PMC free article] [PubMed] [Google Scholar]
- [12].Ghosh U, Thurber KR, Yau WM and Tycko R. (2021). Molecular structure of a prevalent amyloid-beta fibril polymorph from Alzheimer’s disease brain tissue. Proc. Natl. Acad. Sci. U. S. A 118 [DOI] [PMC free article] [PubMed] [Google Scholar]
- [13].Ghosh U, Yau WM, Collinge J. and Tycko R. (2021). Structural differences in amyloid-beta fibrils from brains of nondemented elderly individuals and Alzheimer’s disease patients. Proc Natl Acad Sci U S A 118, e2023089118. [DOI] [PMC free article] [PubMed] [Google Scholar]
- [14].Lee M, Ghosh U, Thurber KR, Kato M. and Tycko R. (2020). Molecular structure and interactions within amyloid-like fibrils formed by a low-complexity protein sequence from FUS. Nat. Commun 11, 5735. [DOI] [PMC free article] [PubMed] [Google Scholar]
- [15].Kurouski D, Dukor RK, Lu X, Nafie LA and Lednev IK (2012). Normal and reversed supramolecular chirality of insulin fibrils probed by vibrational circular dichroism at the protofilament level of fibril structure. Biophys. J 103, 522–31. [DOI] [PMC free article] [PubMed] [Google Scholar]
- [16].Kurouski D, Dukor RK, Lu X, Nafie LA and Lednev IK (2012). Spontaneous inter-conversion of insulin fibril chirality. Chem. Commun 48, 2837–9. [DOI] [PMC free article] [PubMed] [Google Scholar]
- [17].Kurouski D, Lombardi RA, Dukor RK, Lednev IK and Nafie LA (2010). Direct observation and pH control of reversed supramolecular chirality in insulin fibrils by vibrational circular dichroism. Chem. Commun 46, 7154–6. [DOI] [PubMed] [Google Scholar]
- [18].Sandberg A. et al. (2010). Stabilization of neurotoxic Alzheimer amyloid-beta oligomers by protein engineering. Proc. Natl. Acad. Sci. U. S. A 107, 15595–600. [DOI] [PMC free article] [PubMed] [Google Scholar]
- [19].Vosough F. and Barth A. (2021). Characterization of Homogeneous and Heterogeneous Amyloid-beta42 Oligomer Preparations with Biochemical Methods and Infrared Spectroscopy Reveals a Correlation between Infrared Spectrum and Oligomer Size. ACS Chem. Neurosci 12, 473–488. [DOI] [PMC free article] [PubMed] [Google Scholar]
- [20].De Simone A. et al. (2019). Investigating in Vitro Amyloid Peptide 1–42 Aggregation: Impact of Higher Molecular Weight Stable Adducts. ACS Omega 4, 12308–12318. [DOI] [PMC free article] [PubMed] [Google Scholar]
- [21].Lipiec E, Perez-Guaita D, Kaderli J, Wood BR and Zenobi R. (2018). Direct Nanospectroscopic Verification of the Amyloid Aggregation Pathway. Angew. Chem. Int. Ed. Engl 57, 8519–8524. [DOI] [PubMed] [Google Scholar]
- [22].Krasnoslobodtsev AV, Deckert-Gaudig T, Zhang Y, Deckert V. and Lyubchenko YL (2016). Polymorphism of amyloid fibrils formed by a peptide from the yeast prion protein Sup35: AFM and Tip-Enhanced Raman Scattering studies. Ultramicroscopy 165, 26–33. [DOI] [PMC free article] [PubMed] [Google Scholar]
- [23].Ramer G, Ruggeri FS, Levin A, Knowles TPJ and Centrone A. (2018). Determination of Polypeptide Conformation with Nanoscale Resolution in Water. ACS Nano 12, 6612–6619. [DOI] [PMC free article] [PubMed] [Google Scholar]
- [24].Ruggeri FS, Benedetti F, Knowles TPJ, Lashuel HA, Sekatskii S. and Dietler G. (2018). Identification and nanomechanical characterization of the fundamental single-strand protofilaments of amyloid alpha-synuclein fibrils. Proc. Natl. Acad. Sci. U. S. A 115, 7230–7235. [DOI] [PMC free article] [PubMed] [Google Scholar]
- [25].Ruggeri FS, Mannini B, Schmid R, Vendruscolo M. and Knowles TPJ (2020). Single molecule secondary structure determination of proteins through infrared absorption nanospectroscopy. Nat. Commun 11, 2945. [DOI] [PMC free article] [PubMed] [Google Scholar]
- [26].Kurouski D, Deckert-Gaudig T, Deckert V. and Lednev IK (2014). Surface characterization of insulin protofilaments and fibril polymorphs using tip-enhanced Raman spectroscopy (TERS). Biophys. J 106, 263–71. [DOI] [PMC free article] [PubMed] [Google Scholar]
- [27].Ruggeri FS, Vieweg S, Cendrowska U, Longo G, Chiki A, Lashuel HA and Dietler G. (2016). Nanoscale studies link amyloid maturity with polyglutamine diseases onset. Sci. Rep 6, 31155. [DOI] [PMC free article] [PubMed] [Google Scholar]
- [28].Sonntag MD et al. (2012). Single Molecule Tip Enhanced Raman Spectroscopy. J. Phys. Chem C 116, 478–483. [Google Scholar]
- [29].Kurouski D, Dazzi A, Zenobi R. and Centrone A. (2020). Infrared and Raman chemical imaging and spectroscopy at the nanoscale. Chem. Soc. Rev 49, 3315–3347. [DOI] [PMC free article] [PubMed] [Google Scholar]
- [30].Dazzi A. and Prater CB (2017). AFM-IR: Technology and Applications in Nanoscale Infrared Spectroscopy and Chemical Imaging. Chem. Rev 117, 5146–5173. [DOI] [PubMed] [Google Scholar]
- [31].Centrone A. (2015). Infrared imaging and spectroscopy beyond the diffraction limit. Annu. Rev. Anal. Chem 8, 101–126. [DOI] [PubMed] [Google Scholar]
- [32].Chae J. et al. (2017). Nanophotonic Atomic Force Microscope Transducers Enable Chemical Composition and Thermal Conductivity Measurements at the Nanoscale. Nano Lett. 17, 5587–5594. [DOI] [PMC free article] [PubMed] [Google Scholar]
- [33].Ramer G, Aksyuk VA and Centrone A. (2017). Quantitative Chemical Analysis at the Nanoscale Using the Photothermal Induced Resonance Technique. Anal. Chem 89, 13524–13531. [DOI] [PMC free article] [PubMed] [Google Scholar]
- [34].Zhou L. and Kurouski D. (2020). Structural Characterization of Individual alpha-Synuclein Oligomers Formed at Different Stages of Protein Aggregation by Atomic Force Microscopy-Infrared Spectroscopy. Anal. Chem 92, 6806–6810. [DOI] [PubMed] [Google Scholar]
- [35].Herzberg M, Szunyogh D, Thulstrup PW, Hassenkam T. and Hemmingsen L. (2020). Probing the Secondary Structure of Individual Abeta40 Amorphous Aggregates and Fibrils by AFM-IR Spectroscopy. Chembiochem 21, 3521–3524. [DOI] [PubMed] [Google Scholar]
- [36].Banerjee S. and Ghosh A. (2021). Structurally Distinct Polymorphs of Tau Aggregates Revealed by Nanoscale Infrared Spectroscopy. J. Phys. Chem. Lett 12, 11035–11041. [DOI] [PMC free article] [PubMed] [Google Scholar]
- [37].Peralvarez-Marin A, Barth A. and Graslund A. (2008). Time-resolved infrared spectroscopy of pH-induced aggregation of the Alzheimer Abeta(1–28) peptide. J. Mol. Biol 379, 589–96. [DOI] [PubMed] [Google Scholar]
- [38].Cerf E. et al. (2009). Antiparallel beta-sheet: a signature structure of the oligomeric amyloid beta-peptide. Biochem. J 421, 415–23. [DOI] [PubMed] [Google Scholar]
- [39].Sarroukh R, Goormaghtigh E, Ruysschaert JM and Raussens V. (2013). ATR-FTIR: a “rejuvenated” tool to investigate amyloid proteins. Biochim. Biophys. Acta 1828, 2328–38. [DOI] [PubMed] [Google Scholar]
- [40].Lomont JP, Rich KL, Maj M, Ho JJ, Ostrander JS and Zanni MT (2018). Spectroscopic Signature for Stable beta-Amyloid Fibrils versus beta-Sheet-Rich Oligomers. J. Phys. Chem. B 122, 144–153. [DOI] [PMC free article] [PubMed] [Google Scholar]
- [41].Petty SA and Decatur SM (2005). Experimental evidence for the reorganization of beta-strands within aggregates of the Abeta(16–22) peptide. J. Am. Chem. Soc 127, 13488–9. [DOI] [PubMed] [Google Scholar]
- [42].Petty SA and Decatur SM (2005). Intersheet rearrangement of polypeptides during nucleation of {beta}-sheet aggregates. Proc. Natl. Acad. Sci. U. S. A 102, 14272–7. [DOI] [PMC free article] [PubMed] [Google Scholar]
- [43].Popova LA, Kodali R, Wetzel R. and Lednev IK (2010). Structural variations in the cross-beta core of amyloid beta fibrils revealed by deep UV resonance Raman spectroscopy. J. Am. Chem. Soc 132, 6324–8. [DOI] [PubMed] [Google Scholar]
- [44].Tempra C, Scollo F, Pannuzzo M, Lolicato F. and La Rosa C. (2022). A unifying framework for amyloid-mediated membrane damage: The lipid-chaperone hypothesis. Biochim. Biophys. Acta Proteins Proteom 1870, 140767. [DOI] [PubMed] [Google Scholar]
- [45].Viennet T. et al. (2018). Structural insights from lipid-bilayer nanodiscs link alpha-Synuclein membrane-binding modes to amyloid fibril formation. Commun. Biol 1, 44. [DOI] [PMC free article] [PubMed] [Google Scholar]
- [46].Dou T, Zhou L. and Kurouski D. (2021). Unravelling the Structural Organization of Individual alpha-Synuclein Oligomers Grown in the Presence of Phospholipids. J. Phys. Chem. Lett 12, 4407–4414. [DOI] [PubMed] [Google Scholar]
- [47].Rizevsky S, Matveyenka M. and Kurouski D. (2022). Nanoscale Structural Analysis of a Lipid-Driven Aggregation of Insulin. J. Phys. Chem. Lett 13, 2467–2473. [DOI] [PMC free article] [PubMed] [Google Scholar]
- [48].Zhang X, St Clair JR, London E. and Raleigh DP (2017). Islet Amyloid Polypeptide Membrane Interactions: Effects of Membrane Composition. Biochemistry 56, 376–390. [DOI] [PMC free article] [PubMed] [Google Scholar]
- [49].Rice AC, Ladd AC and Bennett JP Jr. (2015). Postmortem Alzheimer’s Disease Hippocampi Show Oxidative Phosphorylation Gene Expression Opposite that of Isolated Pyramidal Neurons. J. Alzheimers Dis 45, 1051–9. [DOI] [PubMed] [Google Scholar]
- [50].Letellier T, Heinrich R, Malgat M. and Mazat JP (1994). The kinetic basis of threshold effects observed in mitochondrial diseases: a systemic approach. Biochem. J 302 ( Pt 1), 171–4. [DOI] [PMC free article] [PubMed] [Google Scholar]
- [51].Barrientos A. and Moraes CT (1999). Titrating the effects of mitochondrial complex I impairment in the cell physiology. J. Biol. Chem 274, 16188–97. [DOI] [PubMed] [Google Scholar]
- [52].Iijima-Ando K, Hearn SA, Shenton C, Gatt A, Zhao L. and Iijima K. (2009). Mitochondrial mislocalization underlies Abeta42-induced neuronal dysfunction in a Drosophila model of Alzheimer’s disease. PLoS One 4, e8310. [DOI] [PMC free article] [PubMed] [Google Scholar]
- [53].Trushina E. et al. (2012). Defects in mitochondrial dynamics and metabolomic signatures of evolving energetic stress in mouse models of familial Alzheimer’s disease. PLoS One 7, e32737. [DOI] [PMC free article] [PubMed] [Google Scholar]
- [54].Qin W, Haroutunian V, Katsel P, Cardozo CP, Ho L, Buxbaum JD and Pasinetti GM (2009). PGC-1alpha expression decreases in the Alzheimer disease brain as a function of dementia. Arch. Neurol 66, 352–61. [DOI] [PMC free article] [PubMed] [Google Scholar]
- [55].Wang W, Zhao F, Ma X, Perry G. and Zhu X. (2020). Mitochondria dysfunction in the pathogenesis of Alzheimer’s disease: recent advances. Mol Neurodegener 15, 30. [DOI] [PMC free article] [PubMed] [Google Scholar]
- [56].Stace CL and Ktistakis NT (2006). Phosphatidic acid- and phosphatidylserine-binding proteins. Biochim. Biophys. Acta 1761, 913–926. [DOI] [PubMed] [Google Scholar]
- [57].Pope S, Land JM and Heales SJ (2008). Oxidative stress and mitochondrial dysfunction in neurodegeneration; cardiolipin a critical target? Biochim. Biophys. Acta 1777, 794–9. [DOI] [PubMed] [Google Scholar]
- [58].Falabella M, Vernon HJ, Hanna MG, Claypool SM and Pitceathly RDS (2021). Cardiolipin, Mitochondria, and Neurological Disease. Trends Endocrinol. Metab 32, 224–237. [DOI] [PMC free article] [PubMed] [Google Scholar]
- [59].Fitzner D. et al. (2020). Cell-Type- and Brain-Region-Resolved Mouse Brain Lipidome. Cell Rep. 32, 108132. [DOI] [PubMed] [Google Scholar]
- [60].Michaelson DM, Barkai G. and Barenholz Y. (1983). Asymmetry of lipid organization in cholinergic synaptic vesicle membranes. Biochem. J 211, 155–62. [DOI] [PMC free article] [PubMed] [Google Scholar]
- [61].Matveyenka M, Rizevsky S. and Kurouski D. (2022). Unsaturation in the Fatty Acids of Phospholipids Drastically Alters the Structure and Toxicity of Insulin Aggregates Grown in Their Presence. J. Phys. Chem Lett., 4563–4569. [DOI] [PMC free article] [PubMed] [Google Scholar]
- [62].Rizevsky S, Zhaliazka M, Dou T. and Matveyenka M. (2022). Characterization of Substrates and Surface-Enhancement in Atomic Force Microscopy Infrared (AFM-IR) Analysis of Amyloid Aggregates. J. Phys. Chem C 126, 4157–4162. [DOI] [PMC free article] [PubMed] [Google Scholar]
- [63].Coles M, Bicknell W, Watson AA, Fairlie DP and Craik DJ (1998). Solution structure of amyloid beta-peptide(1–40) in a water-micelle environment. Is the membrane-spanning domain where we think it is? Biochemistry 37, 11064–77. [DOI] [PubMed] [Google Scholar]
- [64].Bera S, Korshavn KJ, Kar RK, Lim MH, Ramamoorthy A. and Bhunia A. (2016). Biophysical insights into the membrane interaction of the core amyloid-forming Abeta40 fragment K16-K28 and its role in the pathogenesis of Alzheimer’s disease. Phys. Chem. Chem. Phys 18, 16890–901. [DOI] [PubMed] [Google Scholar]
- [65].Kochan K, Perez-Guaita D, Pissang J, Jiang JH, Peleg AY, McNaughton D, Heraud P. and Wood BR (2018). In vivo atomic force microscopy-infrared spectroscopy of bacteria. J. Royal Soc. Interface 15, 20180115. [DOI] [PMC free article] [PubMed] [Google Scholar]
- [66].Williams TL, Johnson BR, Urbanc B, Jenkins AT, Connell SD and Serpell LC (2011). Abeta42 oligomers, but not fibrils, simultaneously bind to and cause damage to ganglioside-containing lipid membranes. Biochem. J 439, 67–77. [DOI] [PubMed] [Google Scholar]
- [67].Williams TL and Serpell LC (2011). Membrane and surface interactions of Alzheimer’s Abeta peptide--insights into the mechanism of cytotoxicity. FEBS J. 278, 3905–17. [DOI] [PubMed] [Google Scholar]
- [68].Ege C. and Lee KY (2004). Insertion of Alzheimer’s A beta 40 peptide into lipid monolayers. Biophys. J 87, 1732–40. [DOI] [PMC free article] [PubMed] [Google Scholar]
- [69].Chi EY, Ege C, Winans A, Majewski J, Wu G, Kjaer K. and Lee KY (2008). Lipid membrane templates the ordering and induces the fibrillogenesis of Alzheimer’s disease amyloid-beta peptide. Proteins 72, 1–24. [DOI] [PubMed] [Google Scholar]
- [70].Arispe N, Pollard HB and Rojas E. (1996). Zn2+ interaction with Alzheimer amyloid beta protein calcium channels. Proc. Natl. Acad. Sci. U. S. A 93, 1710–5. [DOI] [PMC free article] [PubMed] [Google Scholar]
- [71].Lin H, Bhatia R. and Lal R. (2001). Amyloid beta protein forms ion channels: implications for Alzheimer’s disease pathophysiology. FASEB J. 15, 2433–44. [DOI] [PubMed] [Google Scholar]
- [72].Zhaliazka K. and Kurouski D. (2022). Nanoscale Characterization of Parallel and Antiparallel beta-Sheet Amyloid Beta 1–42 Aggregates. ACS Chem. Neurosci 13, 2813–2820. [DOI] [PMC free article] [PubMed] [Google Scholar]
- [73].Cataldi R. et al. (2021). A dopamine metabolite stabilizes neurotoxic amyloid-beta oligomers. Commun. Biol 4, 19. [DOI] [PMC free article] [PubMed] [Google Scholar]
- [74].Jan A, Adolfsson O, Allaman I, Buccarello AL, Magistretti PJ, Pfeifer A, Muhs A. and Lashuel HA (2011). Abeta42 neurotoxicity is mediated by ongoing nucleated polymerization process rather than by discrete Abeta42 species. J. Biol. Chem 286, 8585–8596. [DOI] [PMC free article] [PubMed] [Google Scholar]
- [75].Chauhan A, Ray I. and Chauhan VP (2000). Interaction of amyloid beta-protein with anionic phospholipids: possible involvement of Lys28 and C-terminus aliphatic amino acids. Neurochem. Res 25, 423–9. [DOI] [PubMed] [Google Scholar]
- [76].Matveyenka M, Zhaliazka K, Rizevsky S. and Kurouski D. (2022). Lipids uniquely alter secondary structure and toxicity of lysozyme aggregates. FASEB J. 36, e22543. [DOI] [PMC free article] [PubMed] [Google Scholar]
- [77].Matveyenka M, Rizevsky S. and Kurouski D. (2022). Amyloid aggregates exert cell toxicity causing irreversible damages in the endoplasmic reticulum. Biochim. Biophys. Acta Mol. Basis. Dis 1868, 166485. [DOI] [PMC free article] [PubMed] [Google Scholar]
- [78].Matveyenka M, Rizevsky S, Pellois JP and Kurouski D. (2023). Lipids uniquely alter rates of insulin aggregation and lower toxicity of amyloid aggregates. Biochim. Biophys. Acta Mol. Cell Biol. Lipids. 1868, 159247. [DOI] [PMC free article] [PubMed] [Google Scholar]
- [79].Matveyenka M, Rizevsky S. and Kurouski D. (2022). The degree of unsaturation of fatty acids in phosphatidylserine alters the rate of insulin aggregation and the structure and toxicity of amyloid aggregates. FEBS Lett. 596, 1424–1433. [DOI] [PMC free article] [PubMed] [Google Scholar]
- [80].Matveyenka M, Rizevsky S. and Kurouski D. (2022). Length and Unsaturation of Fatty Acids of Phosphatidic Acid Determines the Aggregation Rate of Insulin and Modifies the Structure and Toxicity of Insulin Aggregates. ACS Chem. Neurosci 13, 2483–2489. [DOI] [PubMed] [Google Scholar]
Associated Data
This section collects any data citations, data availability statements, or supplementary materials included in this article.
Supplementary Materials
Table S1. One-way ANOVA of significant differences for all testing groups. Tukey’s HSD Post Hoc was performed for multiple comparison procedures and the statistical test, showed the following difference between tested groups.
Table S2. One-way ANOVA of significant differences for all testing groups of fibrils. Tukey’s HSD Post Hoc was performed for multiple comparison procedures and the statistical test, showed the following difference between tested groups.
Table S3. One-way ANOVA of significant differences for all testing groups of samples accordingly to LDH test. Tukey’s HSD Post Hoc was performed for multiple comparison procedures and the statistical test, showed the following difference between tested groups.
Table S4. One-way ANOVA of significant differences for all testing groups of oligomers. Tukey’s HSD Post Hoc was performed for multiple comparison procedures and the statistical test, showed the following difference between tested groups.
Data Availability Statement
All data described in this manuscript are contained within the manuscript


