Summary
Inorganic phosphate (Pi) is one of the most essential molecules for life. However, little is known about intracellular Pi metabolism and signaling in animal tissues1. Intrigued by the observation that chronic Pi starvation causes hyperproliferation in the digestive epithelium of Drosophila melanogaster, we probed further and found that Pi starvation triggers the down-regulation of PXo, a Pi transporter. Consistent with Pi starvation, PXo deficiency causes midgut hyperproliferation. Our immunostaining and ultrastructural analysis revealed that PXo specifically marks non-canonical multilamellar organelles (PXo bodies). By Pi imaging with a Förster resonance energy transfer (FRET)-based Pi sensor2, we demonstrate that PXo restricts cytosolic Pi levels. PXo bodies require PXo for biogenesis and undergo degradation following Pi starvation. Proteomic and lipidomic characterization of PXo bodies unveil their distinct feature as an intracellular Pi reserve. Therefore, Pi starvation triggers PXo down-regulation and PXo body degradation as a compensatory mechanism to increase cytosolic Pi. Furthermore, we identified Connector of kinase to AP-1 (Cka), a component of the STRIPAK complex and JNK signaling3, as the mediator of PXo knockdown- or Pi starvation-induced hyperproliferation. Altogether, our study uncovers PXo bodies as a critical regulator of cytosolic Pi levels and unveils a Pi-dependent PXo-Cka-JNK signaling cascade controlling tissue homeostasis.
Inorganic phosphate (Pi) is consumed by use in post-translational modifications and the synthesis of essential metabolites. Despite its universal importance for life, Pi metabolism has been mostly studied in bacteria, yeast, and plants. In bacteria, Pi is stored in polyphosphate granules4 while in yeast and plant cells, Pi is mainly stored in vacuoles5. It has also been proposed that Pi-containing biomolecules such as polyphosphate (in bacteria and fungi)6 and membrane phospholipids (in plants)7 might serve as a Pi reserve. In animals, while much has been learned about the hormonal regulation of circulating Pi8, little is known about intracellular Pi metabolism and signaling.
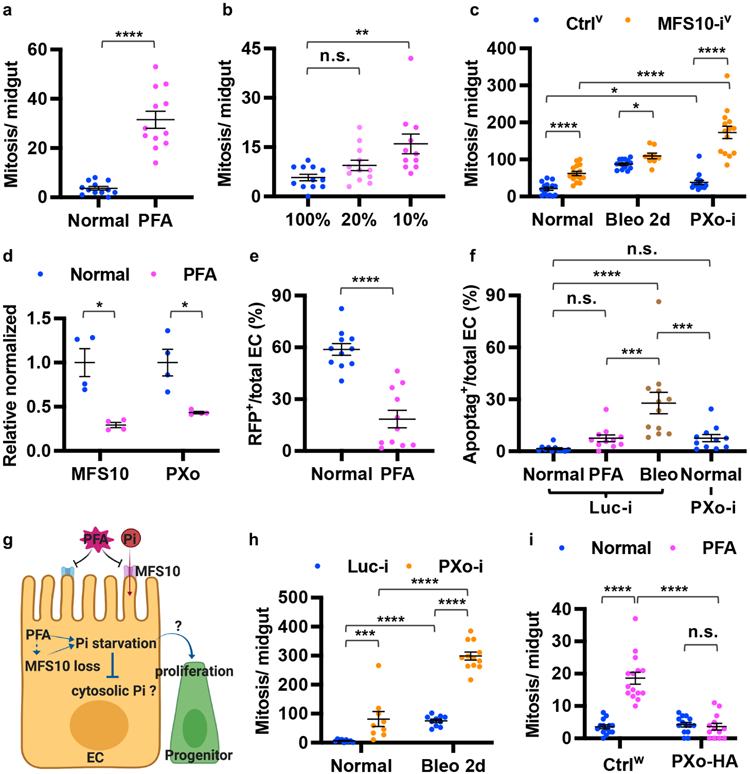
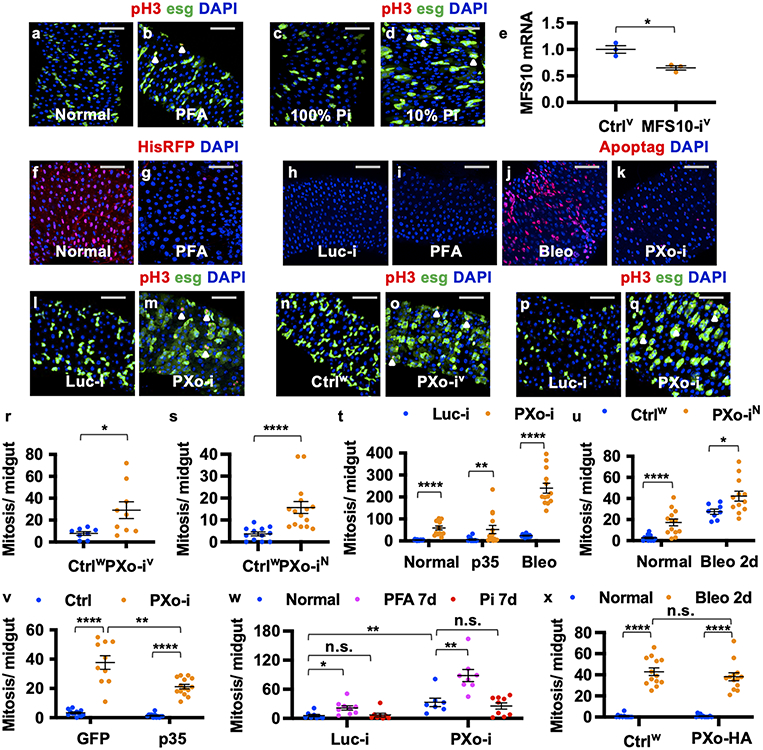
The epithelium of adult Drosophila midgut is composed of large enterocytes (ECs), hormone-secretary enteroendocrine cells (EEs), esg+ progenitors including intestinal stem cells (ISCs) and post-mitotic enteroblasts (EBs)9. ECs are the major cell type in the midgut and a prominent site of nutrient absorption. ISCs and EBs can adjust proliferation and differentiation activity and produce ECs or EEs in response to fluctuating environmental stimuli to meet the demand of tissue regeneration10. To evaluate how Pi impacts midgut tissue homeostasis, we fed flies phosphonoformic acid (PFA), an inorganic pyrophosphate analogue and potent inhibitor of cellular Pi uptake8. A significant increase in midgut mitosis (indicated by anti-phospho-histone3 (pH3) staining) was observed following chronic Pi starvation (Fig. 1a, Extended Data Fig. 1a, b). To verify our finding, we fed flies chemically defined food (CDF) and found that reducing dietary Pi to 10% of standard levels could also induce midgut mitosis (Fig. 1b, Extended Data Fig. 1c, d). Furthermore, we genetically recapitulated Pi starvation using knockdown of the Pi uptake transporter MFS108 in ECs. In agreement with our experiments using PFA and CDF, we observed an increase in midgut proliferation following MFS10 knockdown under normal or bleomycin (Bleo)-induced tissue damage conditions (Fig. 1c, knockdown confirmed in Extended Data Fig. 1e). Contrary to the idea that Pi starvation might induce compensatory Pi uptake through MFS10, PFA feeding decreases midgut MFS10 expression (Fig. 1d). Moreover, cell loss assay for ECs labeled with H2B-RFP shows accelerated EC turnover following Pi starvation (Fig. 1e, Extended Data Fig. 1f, g), suggesting that Pi starvation-induced ISC hyperproliferation is regenerative. However, whereas EC apoptosis triggers regenerative ISC proliferation under tissue damage conditions10, Pi starvation does not induce massive apoptosis in the midgut (Fig. 1f, Extended Data Fig. 1h-j). Collectively, these data raise the question of how the midgut can maintain essential Pi levels and accelerate proliferation in response to restricted Pi uptake (Fig. 1g).
Figure 1. Pi deprivation or PXo deficiency induces midgut hyperproliferation.
a, Mitosis of midguts fed 8d normal or PFA food. N=12 per group. P=7.40E-7. b, Mitosis of midguts fed 9d CDF containing 100% (N=12), 20% (N=12, P=0.377), or 10% Pi (N=11, P=1.74E-3). c, Mitosis of MFS10 knockdown in ECs & control under normal (N=15 & 15), Bleo feeding (N=9 & 13), and PXo RNAi co-expression (N=14 & 15) conditions. P values from bottom to top: 3.65E-6, 0.0105, 0.0337, 1.81E-7, 6.45E-8. d, RT-qPCR of MFS10 (P=0.0192) and PXo (P1 primers, P=0.0323) in midguts fed 6d normal or PFA food. N=4 biological replicates per group. e, H2B-RFP-marked EC percentage after 9d normal or PFA feeding. N=11 per group. P=5.67E-6. f, Apoptag+ percentage of ECs expressing 7d Luc RNAi or PXo RNAi, fed normal food, PFA, or last 2d Bleo. N=11 (Luc-i Normal, PFA, or PXo-i) or 12 (Luc-i Bleo). P values from bottom to top: 2.76E-4, 7.37E-4, 0.763, 1.78E-5, 0.747. g, Pi starvation responses and questions for this study. The diagram was created using BioRender. h, Mitosis of midguts expressing 7d Luc RNAi or PXo RNAi in ECs, with or without 2d Bleo. From left to right: N=9, 9, 10, 12; P=2.88E-4, 2.17E-5, 4.76E-5, 3.09E-6. i, Mitosis of midguts expressing PXo-HA in ECs for 8d, fed normal or PFA food. From left to right: N=14, 15, 14, 13; P=2.58E-8, 1.34E-7, 0.376. Data are mean ± SEM. P values (n.s. ≥ 0.05, * <0.05, ** <0.01, *** <1E-3, **** <1E-4) are from two-tailed Mann-Whitney u test (a, c, e, f, h, i), two-tailed Welch’s t test (d), or one-way ANOVA with Bonferroni’s multiple comparison test in (b) and for comparison to Luc-i Normal in (f).
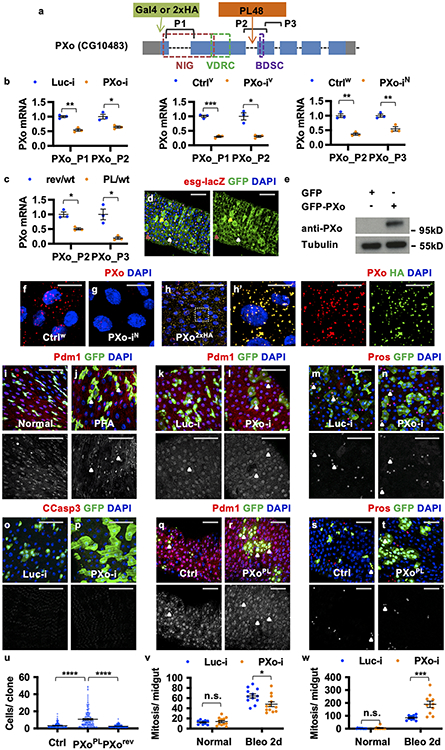
By examining transporters or putative Pi-sensing receptors amongst progenitor activity regulators identified in our previous in vivo RNAi screen11, we identified a candidate gene, CG10483, whose knockdown induces similar levels of midgut hyperproliferation as Pi starvation. CG10483, which we renamed Pi-sensitive XPR1 ortholog (PXo), is the ortholog of mammalian xenotropic and polytropic retrovirus receptor 1 (XPR1) and encodes an eight-transmembrane protein with a SYG1/Pho81/XPR1 (SPX) domain that senses Pi-derived inositol polyphosphate (InsPs)12 and an EXS domain that is required for Pi transport13. RT-qPCR reveals that PXo expression is down-regulated in the midgut following Pi starvation (Fig. 1d). Expression of three different PXo RNAi lines (target regions in Extended Data Fig. 2a, knockdown confirmed in Extended Data Fig. 2b) in either ECs or progenitors induces mitosis under both normal feeding and tissue damage conditions (Fig. 1h, Extended Data Fig. 1l-u). Like Pi starvation, PXo knockdown in ECs does not cause significant apoptosis (Fig. 1f, Extended Data Fig. 1k). Moreover, the anti-apoptotic gene p35 cannot block midgut hyperproliferation when co-expressed with PXo RNAi in either progenitors or ECs (Extended Data Fig. 1t, v). Lineage tracing of esg+ progenitors with the EGT F/O system reveals more active Pdm1+ EC differentiation (Extended Data Fig. 2i-n) and no apoptosis (Extended Data Fig. 2o, p) under Pi starvation or PXo knockdown conditions. Consistent with PXo knockdown, homozygous PXoPL48 mutant clones are significantly larger and contain more ECs than wild type clones (Extended Data Fig. 2q-u, disruption of PXo expression by PXoPL48 mutation is confirmed in Extended Data Fig. 2c). Whereas Pi restriction and PXo knockdown have synergistic effects in stimulating midgut proliferation (Fig. 1c, Extended Data Fig. 1w), feeding flies with extra Pi cannot rescue PXo knockdown-induced hyperproliferation (Extended Data Fig. 1w). In contrast, PXo overexpression in ECs inhibits Pi starvation-induced hyperproliferation (Fig. 1i), despite having no impact on Bleo-induced hyperproliferation (Extended Data Fig. 1x). Therefore, in response to Pi restriction, suppression of PXo triggers progenitor proliferation and EC production.
To examine endogenous PXo expression, we generated a PXoGal4 line by CRISPR/Cas9-mediated knock-in, revealing stronger expression in ECs than in progenitors (Extended Data Fig. 2a, d). In addition, we raised an antibody against the C-terminal of PXo (Extended Data Fig. 2e), whose staining appears as puncta in ECs and diminishes following PXo knockdown (Extended Data Fig. 2f, g). Further, we inserted a hemagglutinin (HA)-based tag at the N-terminal of endogenous PXo and observed the same HA staining pattern with anti-PXo (Extended Data Fig. 2a, h, h’). Although strong endogenous PXo expression is also detected in EEs14 (Extended Data Fig. 2d), PXo knockdown in EEs does not induce proliferation (Extended Data Fig. 2v). Moreover, PXo knockdown under the control of DlGal4ts, whose expression is restricted to ISCs during homeostasis15, does not affect proliferation when flies are on normal food (Extended Data Fig. 2w). However, when the midgut is damaged by Bleo, which is known to accelerate ISC-EB-EC differentiation10, DlGal4ts-driven PXo knockdown promotes Bleo-induced proliferation (Extended Data Fig. 2w), suggesting that PXo is required in progenitors when they are actively differentiating. Therefore, PXo is required in ECs and differentiating progenitors to suppress midgut proliferation.
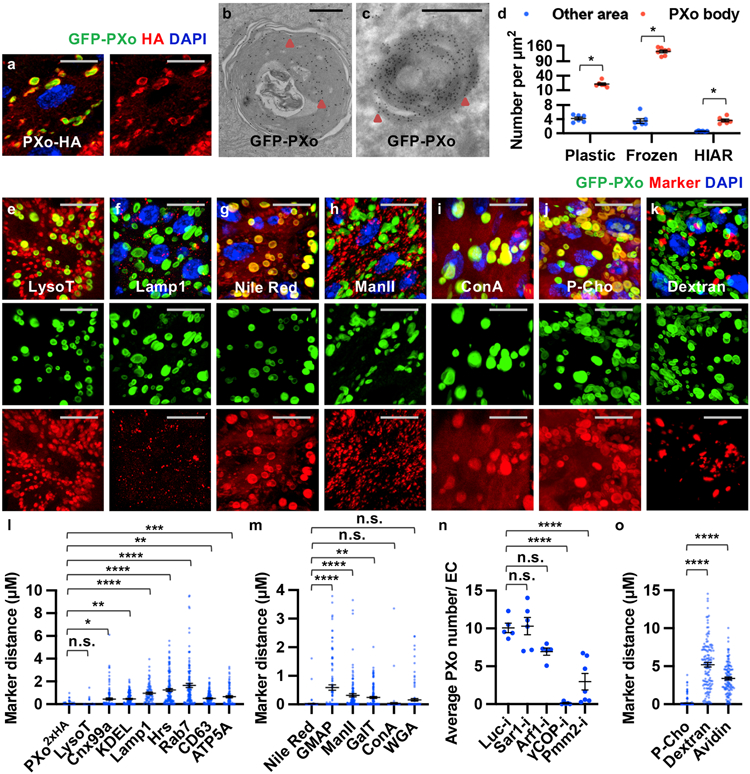
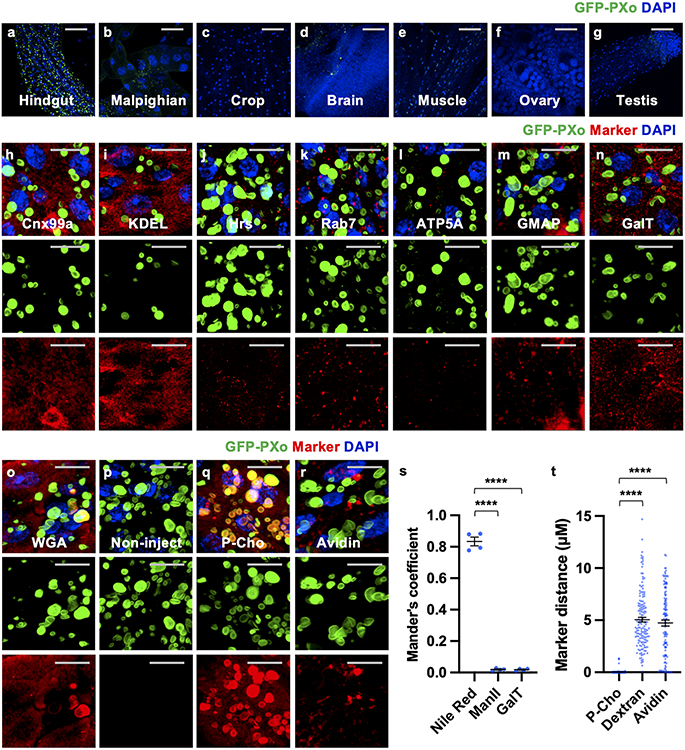
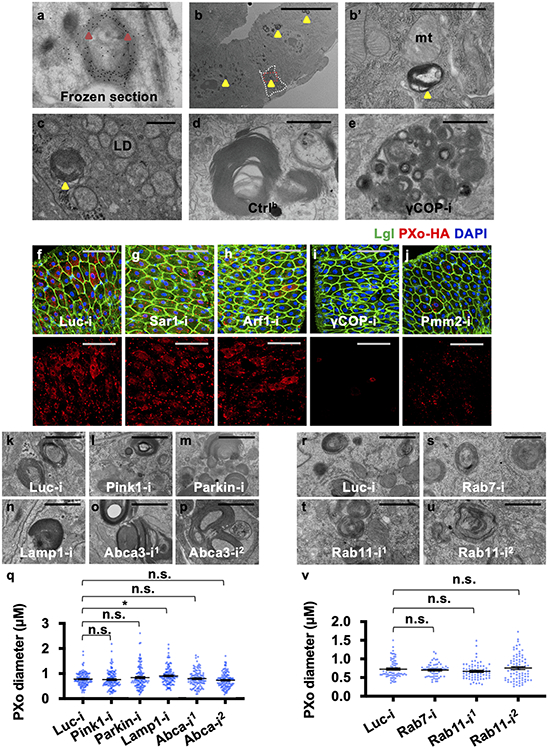
In some plants, epitope-tagged PXo ortholog localizes to the Golgi network and uncharacterized vesicles, whose exocytosis has been proposed as a mechanism of Pi export16. Interestingly, both N-terminal tagged GFP-PXo and C-terminal tagged PXo-HA are markers of oval shape structures in the fly midgut (Fig. 2a), which are enriched with endogenous PXo (Fig. 2l) and referred to as PXo bodies. In addition to the midgut, PXo bodies are found in the hindgut (Extended Data Fig. 3a) but rarely observed in other organs and tissues we examined, including the Malpighian tubules, crop, brain, muscle, and germlines (Extended Data Fig. 3b-g). Ultrastructural analysis by electron microscopy (EM) with immunogold labeling in both plastic and frozen midgut sections reveals GFP-PXo as a membrane marker for multilamellar organelles (Fig. 2b-d, Extended Data Fig. 4a). Further, with heat-induced antigen retrieval (HIAR), immunolabeling EM detects the enrichment of endogenous PXo in these multilamellar structures in wild type midguts (Fig. 2d). Thus, in EM sections of midguts without epitope-tagged PXo expression, PXo bodies can be recognized in both ECs and progenitors by their distinct ultrastructural morphology unlike canonical organelles17 (Extended Data Fig. 4b, b’). Characterization of PXo bodies by co-staining reveals that they are acidic (Fig. 2e, l) but do not co-localize with markers for the endoplasmic reticulum (ER) (Fig. 2l, Extended Data Fig. 3h, i, often in proximity and occasionally in direct contacts), lysosome (Fig. 2f, l), endosome (Fig. 2l, Extended Data Fig. 3j, k), exosome (Fig. 2l), or mitochondria (Fig. 2l, Extended Data Fig. 3l). Whereas PXo bodies are one type of subcellular structures stained positive for the lipid dye, Nile Red (Fig. 2g, m), their ultrastructural morphology differs from lipid droplets17 (Extended Data Fig. 4c). Interestingly, PXo bodies are in proximity but do not co-localize with the cis-, medial-, and trans-cisternae markers (GMAP, ManII, and GalT) for the Golgi body (Fig. 2h, m, Extended Data Fig. 3m, n, s). Moreover, co-stainings of GFP-PXo with lectins Concanavalin A (ConA) and Wheat germ agglutinin (WGA) demonstrate PXo body glycosylation (Fig. 2i, m, Extended Data Fig. 3o), which is likely mediated by the Golgi.
Figure 2. PXo localizes to PXo bodies, a type of multilamellar organelles.
a, 3D view of GFP-PXo and PXo-HA co-expressed in ECs. b, Midgut EM (plastic section) with immunogold labeling of ubiquitously expressed GFP-PXo. c, Midgut EM (frozen section) with immunogold labeling of GFP-PXo expressed in ECs. Arrowheads highlight labeled GFP-PXo examples. d, Immunogold labeling density of GFP-PXo or endogenous (with HIAR) PXo. N=6 (plastic, P=0.0312), 7 (frozen, P=0.0156), 6 (HIAR, P=0.0312) per group. e, f, g, h, i, j, k, Midguts expressing GFP-PXo ubiquitously are stained for acidic dye LysotrackerRed (LysoT), lysosome marker Lamp1, lipid dye Nile Red, Golgi marker ManII-TagRFP, glycosylation probe ConA, phospholipid tracer P-Cho (10min post injection), or endocytosis marker dextran. The 3D view is presented along with separate green and red channels below. l, m, Shortest distance between each labeled PXo body and endogenous PXo or other markers. From left to right: N=125, 108, 105, 85, 71, 126, 116, 107, 85, 130, 104, 121, 121, 130, 121 PXo bodies from 3 midguts were analyzed; P values are 1.00, 0.0170, 1.68E-3, 7.00E-9, <1E-14, <1E-14, 3.94E-3, 1.17E-4, <1E-14, 3.28E-5, 3.59E-3, 1.00, 0.178. n, Average number of PXo-HA-labeled PXo bodies in ECs expressing Luc RNAi (N=5), Sar1 RNAi (N=6, P=1.00 comparing to Luc-i), Arf1 RNAi (N=5, P=0.109), γCOP RNAi (N=5, P=5.40E-7), or Pmm2 RNAi (N=7, P=2.88E-5) for 7d. o, Shortest distance between each labeled PXo body and P-Cho, dextran (p<1E-14), or avidin (p<1E-14). N=232 (P-Cho), 127 (dextran), 113 (avidin) PXo bodies from 4 midguts were analyzed per group. Data are mean ± SEM. P values are calculated from two-tailed Wilcoxon signed rank test (d) or one-way ANOVA with Bonferroni’s multiple comparison test (l, m, n, o). Scale bars, 10 μm (a, e, f, g, h, i, j, k), 1 μm (b, c).
To further investigate PXo body biogenesis, we examined whether disruption of canonical organelles could affect PXo bodies. Knockdown of Sar1 or Arf1, the canonical GTPase that mediates anterograde or retrograde ER-Golgi vesicle trafficking18 and maintains the normal morphology of the ER, Golgi body19, or lipid droplets20, has no significant impact on the morphology and density of PXo-HA labeled PXo bodies in ECs (Fig. 2n, Extended Data Fig. 4f-h). In contrast, knockdown of γCOP21, which is essential for protein transport from the Golgi bodies, or knockdown of Pmm222, the critical enzyme for N-glycosylation, dramatically diminishes PXo bodies (Fig. 2n, Extended Data Fig. 4i, j). Consistent with immunostaining, EMs of midguts with γCOP knockdown exhibit fragmented and depleted PXo bodies (Extended Data Fig. 4d, e). Moreover, Lamp1 knockdown, which inhibits lysosomal maturation23, results in a modest increase of the average PXo body size (Extended Data Fig. 4k, n, q), whereas no apparent impact on PXo bodies was observed following the expression of validated RNAi reagents to knockdown components required for mitochondria fission and fusion (Pink1, Parkin)24, endosome formation (Rab7)25, endosome recycling or exosome secretion (Rab11)26 (Extended Data Fig. 4k-m, q-v). To further explore the origin of PXo bodies, we traced two main sources of the endomembrane system, i.e. membrane synthesis and endocytosis. Following the injection of a choline analog, propargylcholine (P-Cho), we could visualize phospholipids newly synthesized from the ER, which strongly co-stain with GFP-PXo at 10min or 2h post injection (Fig. 2j, o, Extended Data Fig. 3p, q, t). In contrast, endocytosis vesicles visualized by Texas Red-labeled dextran or avidin do not co-localize with GFP-PXo (Fig. 2k, o, Extended Data Fig. 3r, t). Therefore, the PXo body is an active deposit of newly synthesized phospholipids and a distinct compartment of the endomembrane system that depends on Golgi protein transport and glycosylation for its biogenesis.
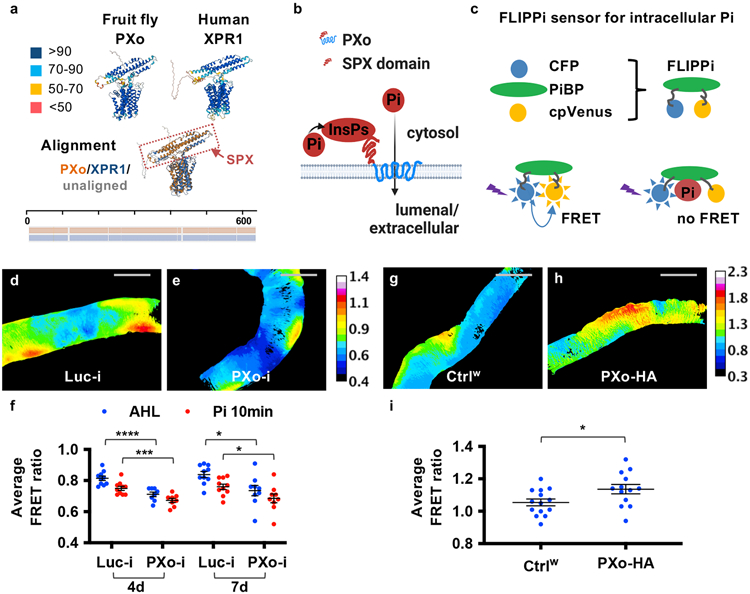
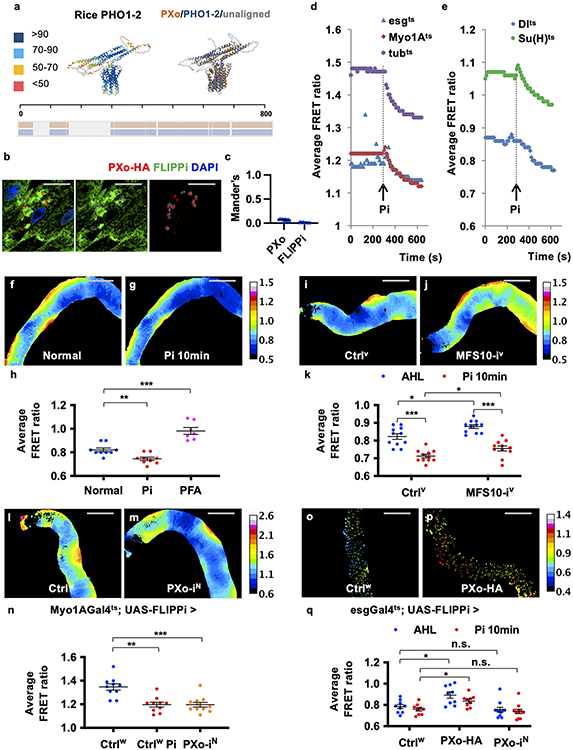
PXo is highly conserved with orthologs across species from yeast to human. Based on AlphaFold structure prediction27 and previous literature12 (Fig. 3a), PXo contains 8-pass transmembrane α-helical barrels (EXS domain) which likely form the pore for Pi trafficking, and a N-terminal SPX domain which faces the cytosol and confers a gating mechanism on intracellular Pi levels by undergoing conformational change upon binding with Pi-derived InsPs. The PXo structure is remarkably similar to AlphaFold predicted structures of human ortholog XPR1 (Fig. 3a) and rice ortholog PHO1-2 (Extended Data Fig. 5a), both previously demonstrated to mediate Pi efflux away from the cytosol in radiolabeled Pi tracing28 or patch clamp29 experiments. Inferred from the activity of these orthologs, PXo is expected to mediate Pi transport from the cytosol into PXo bodies (Fig. 3b), given its predominant localization to the membranes of PXo bodies (Fig. 2b, c). To confirm the physiological relevance of PXo in Pi regulation, we examined cytosolic Pi levels with a FRET-based Pi sensor, cpFLIPPi-6.4 (FLIPPi)2. FLIPPi is expressed in the cytosol and not present within PXo bodies (Extended Data Fig. 5b, c). The FRET ratio of FLIPPi is taken as a fluorescence ratio of cpVenus versus CFP, which inversely correlates with cytosolic Pi levels (Fig. 3c). We dissected midguts expressing FLIPPi and measured the FRET ratios in live tissues. As a proof of principle, 30mM Pi addition into the imaging buffer decreases FRET ratios in the whole midgut, in progenitor cells, or in ECs (Extended Data Fig. 5d-h, Supplementary Video 1, different Gal4 lines were used to drive FLIPPi expression); whereas PFA feeding increases FRET ratios (Extended Data Fig. 5h). Moreover, MFS10 knockdown increases FRET ratios in ECs (Extended Data Fig. 5i-k), which is expected because MFS10 mediates Pi uptake8. Strikingly, PXo knockdown decreases FRET ratios in ECs (Fig. 3d-f, Extended Data Fig. 5l-n, two different RNAi lines examined), whereas both the ECs and the progenitors with PXo overexpression exhibit increased FRET ratios (Fig. 3g-i, Extended Data Fig. 5o-q). PXo knockdown in progenitors does not affect FRET ratios (Extended Data Fig. 5q), which might be due to the relative low abundance of PXo (Extended Data Fig. 2d) and PXo bodies (Extended Data Fig. 4b) in progenitors. In conclusion, PXo transports cytosolic Pi into PXo bodies, which is critical to restrict cytosolic Pi levels in ECs.
Figure 3. PXo regulates cytosolic Pi levels.
a, AlphaFold structure prediction of fly PXo and its human ortholog XPR1, with color-scaled visualization of the prediction confidence score (0-100). The pairwise structure alignment was shown below, with aligned regions superposed on one another and highlighted in color. The summary of amino acid sequence alignment was shown at the bottom, with aligned regions highlighted in color. The Pi-sensing SPX domain is highlighted by the dashed circled box. b, Mechanism of action model for PXo in Pi transport. The diagram was created using BioRender. c, Binding of Pi to the Pi-binding protein (PiBP) domain causes conformational changes of the chimeric FLIPPi reporter, increasing the distance between donor and acceptor fluorescent proteins and hence reducing FRET ratios. d, e, Color-scaled FRET ratio visualization of ECs expressing FLIPPi together with Luc RNAi or PXo RNAi for 4d. f, FRET ratio quantification of midguts expressing FLIPPi together with Luc RNAi or PXo RNAi in ECs for 4d or 7d, with or without Pi addition in the imaging buffer. AHL: adult hemolymph-like buffer. N=10 (Luc-i 4d, Luc-i 7d), 8 (PXo-i 4d), 9 (PXo-i 7d) midguts were analyzed per group. P values from left to right: 4.57E-5, 4.34E-4, 0.0121, 0.0405. g, h, i, FRET ratio visualization and quantification of ECs expressing FLIPPi alone (N=14) or FLIPPi together with PXo-HA (N=13) for 7d. P=0.0278. Data are mean ± SEM. P values are from two-tailed Mann-Whitney u test (f, i). Scale bars, 200 μm (d, e, g, h).
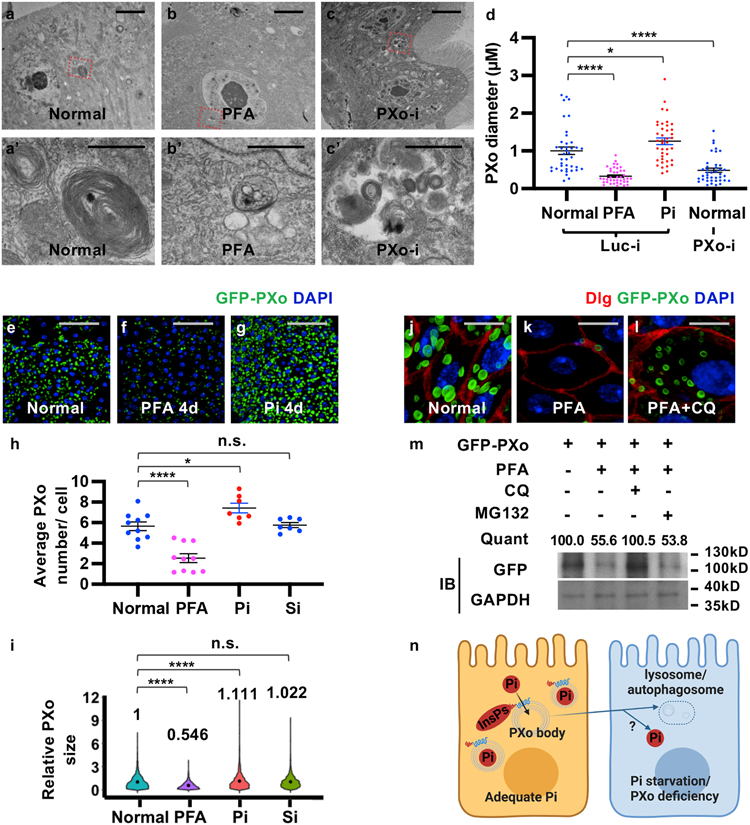
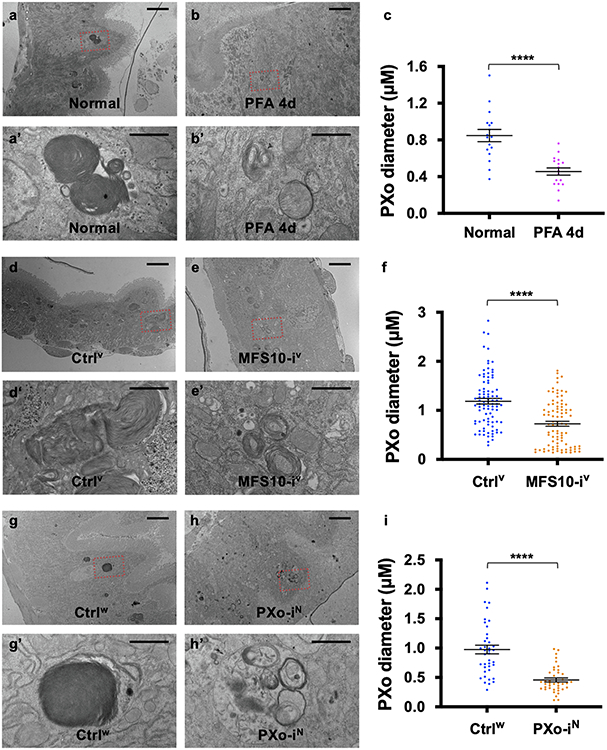
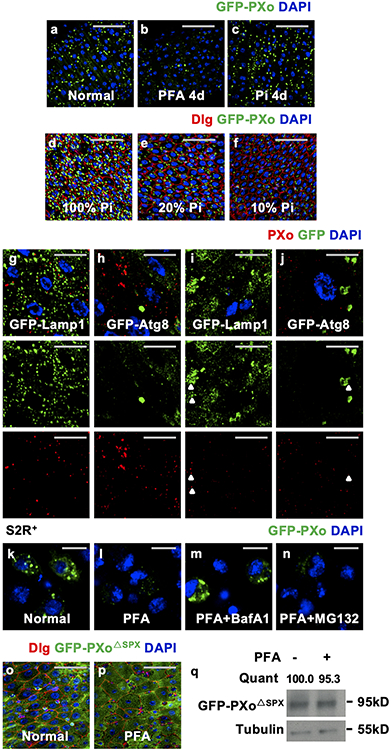
To explore how PXo bodies are affected by Pi availability and PXo expression, we examined their morphology and abundance in response to Pi starvation or other challenges. Strikingly, whereas unlabeled PXo bodies are mostly 0.15-3 μm in diameter in the EM sections of a healthy midgut, they are significantly smaller following PFA-induced or MFS10 knockdown-induced Pi starvation (Fig. 4a, a’, b, b’, d, Extended Data Fig. 6a-f) and larger when flies are fed with extra Pi (Fig. 4d). Moreover, PXo bodies are smaller and often engulfed by lysosomes in midguts with PXo knockdown (Fig. 4c, c’, d, Extended Data Fig. 6g-i, two different RNAi lines examined). Consistent with EM observation, GFP-PXo labeled PXo bodies increase in number and size when flies are fed with excessive Pi but diminish when the flies are fed with PFA (Fig. 4e-i, Extended Data Fig. 7a-c). In addition, by feeding flies with CDF, we confirmed that PXo bodies diminish progressively as we lower the dietary Pi to 20% and 10% of standard levels (Extended Data Fig. 7d-f). Following Pi starvation, endogenous PXo mRNA levels and protein staining decrease (Fig. 1d, Extended Data Fig. 7g-j), whereas the residual endogenous PXo puncta are often engulfed by enlarged lysosomes and induced autophagosomes (Extended Data Fig. 7i, j). Further, PFA-induced degradation of GFP-PXo and PXo bodies can be rescued by the lysosome/autophagosome inhibitors Bafilomycin A1 (BafA1) and chloroquine (CQ) but not the proteasome inhibitor MG132, as demonstrated in S2R+ cells in vitro (Extended Data Fig. 7k-n) or in the midgut in vivo (Fig. 4j-m). Because the SPX domain can adopt different conformations depending on cytosolic Pi levels12, we asked whether it confers the Pi sensitivity of PXo expression. Interestingly, the expression and staining pattern of a SPX-truncated version of PXo in the midgut, despite being more diffuse than the full length PXo, are not affected by PFA (Extended Data Fig. 7o-q). Therefore, PXo bodies depend on Pi and PXo expression for biogenesis or maintenance and undergo SPX-dependent lysosomal/autophagosomal degradation following Pi starvation (Fig. 4n).
Figure 4. PXo bodies are sensitive to Pi availability.
a, b, c, EM of midguts ubiquitously expressing Luc RNAi or PXo RNAi for 5d, with or without last 4d on PFA. Magnified views show highlighted regions in (a’, b’, c’). d, PXo body diameters in EM of midguts ubiquitously expressing 5d Luc RNAi (with normal food, 4d PFA, or 4d Pi) or PXo RNAi. N=40 per group. P values from bottom to top: 3.00E-9, 0.0465, 4.34E-6. e, f, g, Midguts with 7d ubiquitously GFP-PXo expression, on normal food, 4d PFA, or 4d Pi. Average PXo body number per cell is quantified in (h). Relative PXo size is presented as violin plots with mean values (i). Sodium sulfate (Si) group was added to control for Pi food anion concentrations. N=10 (Normal), 10 (PFA), 7 (Pi), 7 (Si) midguts were analyzed. P values from bottom to top (h): 9.88E-6, 0.0183, 1.00. N=2289 (Normal), 1113 (PFA), 2082 (Pi), 1975 (Si) PXo bodies were analyzed. P values from bottom to top (i): <1E-14, 3.88E-5, 1.00. j, k, l, Midguts expressing GFP-PXo ubiquitously were fed normal food, 2d PFA, or 2d PFA+CQ. m, Immunoblot (IB) of lysates from midguts expressing GFP-PXo and fed normal food, 2d PFA, 2d PFA+CQ, or 2d PFA+MG132. GAPDH was the loading control. Relative normalized anti-GFP IB intensity is quantified. Gel source data are in Supplementary Fig. 1a. n, How PXo bodies transport Pi and respond to Pi starvation or PXo knockdown. The diagram was created using BioRender. Quantitative data (except violin plots and western blots) are mean ± SEM. P values are from one-way ANOVA with Bonferroni’s multiple comparison test (d, h, i). Scale bars, 4 μm (a, b, c), 1 μm (a’, b’, c’), 50 μm (e, f, g), 10 μm (j, k, l).
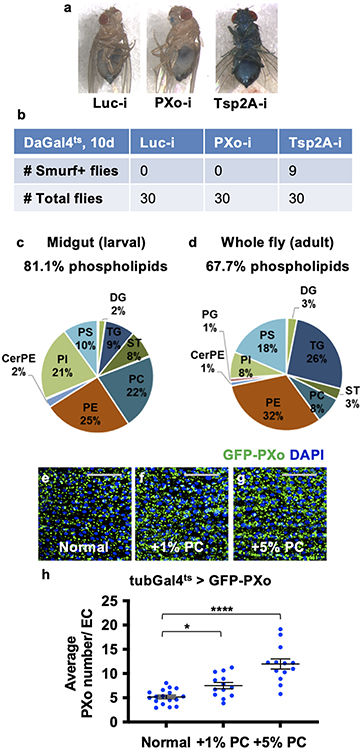
Morphologically similar multilamellar organelles have been reported as lamellar bodies (LBs) in various mammalian cell types including lung alveolar type II cells30 and keratinocytes31. LBs are secretory lysosomes that require the Golgi apparatus for biogenesis32,33 and contribute to the lipid-rich protective barriers covering the alveolar/gastric lining or the skin surface33,34. In the mammalian lung, the lysosome associated membrane protein LAMP335 and the lipid transporter ATP-binding cassette transporter A3 (ABCA3)36 are essential for LB biogenesis. However, based on the ‘Smurf’ assay, intestinal barrier integrity appears normal in flies with prolonged ubiquitous expression of PXo RNAi (Extended Data Fig. 8a, b), whereas expression of validated RNAi reagents for Drosophila Lamp1 (LAMP3 ortholog) or Abca3 does not impair PXo body morphology (Extended Data Fig. 4n-q). Therefore, the PXo body appears to differ from previously characterized LBs in its biogenesis and function.
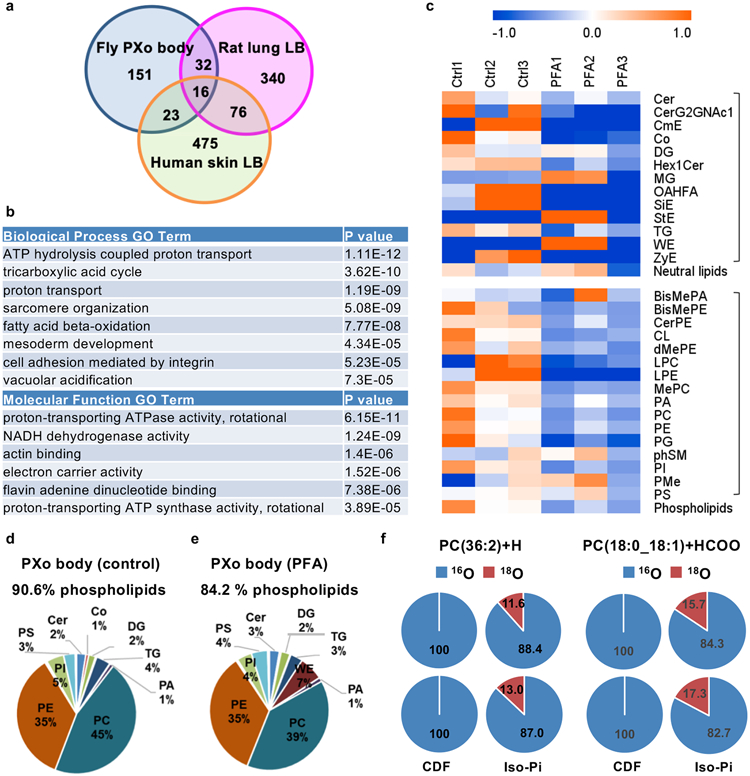
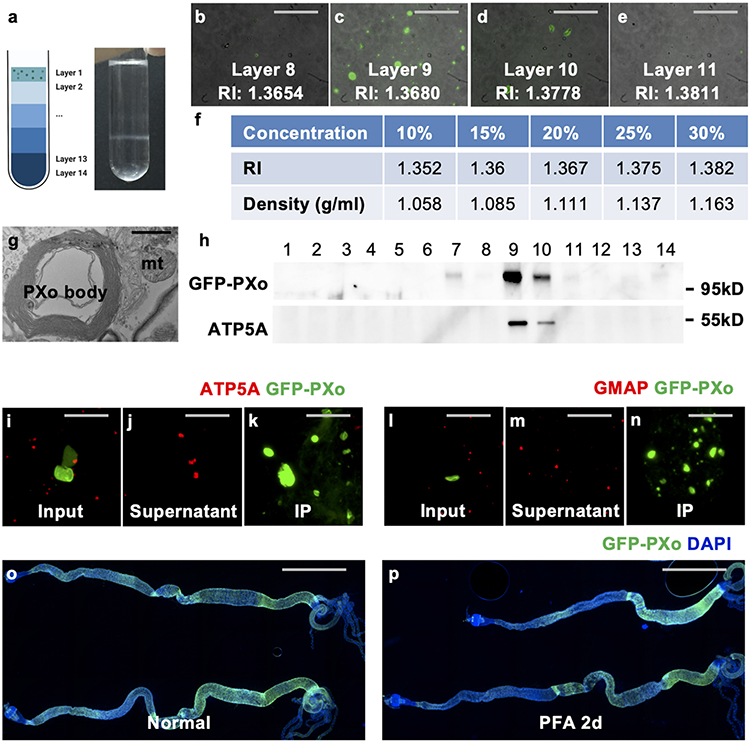
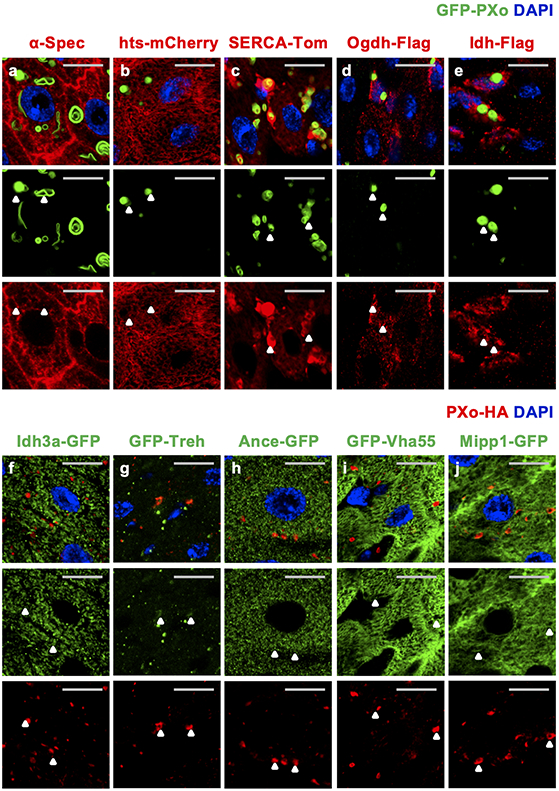
For systematic profiling of the molecular and biochemical properties of PXo bodies, we developed a protocol to extract them from fly guts. After ultracentrifugation of midgut homogenates with an OptiPrep floating gradient, GFP-PXo labeled PXo bodies are enriched in fractions with a density of ~1.11-1.14 g/ml (Extended Data Fig. 9a-f), heavier than the previously reported ~1.059-1.070 g/ml density of mammalian LBs37. Although the dissociated PXo bodies appear intact based on ultrastructural analysis, they cannot be separated by gradient fractionation from the mitochondria and other organelles in the endomembrane system due to their similar densities (Extended Data Fig. 9g, h). Thus, we adapted an immunoprecipitation (IP) protocol to specifically pull down GFP-PXo labeled PXo bodies using Chromotek-GFP-Trap agarose beads (Extended Data Fig. 9i-n). Proteomic analysis of purified PXo bodies with high-resolution tandem mass spectrometry (LC-MS/MS) uncovered 248 unique proteins, whose 222 mammalian orthologs overlap very little with proteins previously identified in LBs from the rat lung38,39 or human epidermis40 (Fig. 5a). Neither lung LBs nor epidermal LBs contain the mammalian ortholog of PXo. Conversely, the Drosophila midgut PXo body proteome does not include the orthologs of general LB markers (CAV1, FLOT1, FLOT2, LAMPs)35,40,41, lung LB marker (ABCA3)38, or epidermal LB marker (DMKN)40 (Supplementary Table 1). Assuming that GFP-PXo labeling does not affect the basic composition of PXo bodies, our data suggest that the PXo body proteome are different from those of previously reported LBs. By co-immunostaining, we confirmed the localization of many identified candidates at PXo bodies as well as other subcellular compartments which they are previously known to be associated (Extended Data Fig. 10a-f, i). In addition, we confirmed the localization of several metabolic enzymes in PXo bodies (Treh, Ance, Mipp1, Extended Data Fig. 10g, h, j). Gene ontology analysis of PXo body proteome unveils distinct features with three major enriched categories (Fig. 5b): 1. proton pump/vacuolar acidification (multiple V-type ATPases), which explains the acidity of PXo bodies; 2. cytoskeleton-binding and actin motor proteins, which might regulate the shape and distribution of PXo bodies; 3. citric acid and fatty acid metabolism, which might provide the metabolic intermediate and energy for PXo body biogenesis.
Figure 5. Proteomic and lipidomic characterization of PXo bodies.
a, Venn diagram illustrating the difference and commonality between the proteomes of PXo bodies and mammalian LBs. 248 identified PXo body proteins are mapped to 222 unique mammalian orthologs (9 without predicted orthologs), of which 151 have not been found in mammalian LBs in previous studies. b, Top enriched “Biological Process” and “Molecular Function” GO terms of PXo body proteome are listed by the rank of P values based on DAVID gene ontology (GO) analysis. c, Heatmap of the total ion intensity (indicative of molar quantity) of major lipid classes identified in PXo bodies from flies fed normal food or PFA for 2d, with 3 biological replicates per condition. The scaled colors are presented as the log2 fold change to the average of each row. The abbreviated names of neutral lipids and phospholipids are marked with the upper and lower brackets respectively, with their sums listed below each bracket. The full name and content of each lipid class can be found in Supplementary Table 2. d, e, Average values of 3 biological replicates were used to calculate the representation of different lipid categories in PXo bodies from flies fed with normal food or PFA for 2d. Lipid categories that take up 1% or more of the total molar quantity are labeled in the Pie charts. It should be noted that lipid classification here is more general than in (c) for convenient comparison with previously published lipidomic analyses (check Supplementary Table 2 for details). f. Percentage of 16O-only or 18O-labeled PCs detected in midgut PXo bodies from control or isotopic Pi-traced flies (2 biological replicates per condition, check “Peak Area” in Supplementary Table 2c for details).
To better understand the biochemical properties of PXo bodies, the lipidome of purified PXo bodies was analyzed using semi-quantitative label-free high-resolution LC-MS/MS. 576 lipid species were detected representing 29 classes in PXo bodies (Fig. 5c, Supplementary Table 2). The molar ratio of phospholipids to total lipids is 90.6% in PXo bodies (Fig. 5d), much greater than reported measurement of the whole midgut or fly body42,43 (Extended Data Fig. 8c, d). The most enriched class of lipids in PXo bodies is phosphatidylcholine (PC) (Fig. 5d). In contrast, phosphatidylethanolamine (PE) is the prominent phospholipid in Drosophila membranes in general43, whereas the most abundant lipids in mammalian lung and epidermal LBs are dipalmitoyl PC (DPPC)34 and free sterols (STs)44, respectively. Interestingly, flies fed with excessive PC contain larger and a greater number of PXo bodies (Extended Data Fig. 8e-h), suggesting that PXo bodies might be a major intracellular deposit for phospholipids, especially PCs. Strikingly, following short-term Pi starvation and before apparent PXo body degradation (Extended Data Fig. 9o, p), the PXo body lipidome changes dramatically, with a decrease in total phospholipids but not neutral lipids (Fig 5c). Notably, PC representation in the PXo body lipidome drops from 45% to 39% after PFA feeding for 2d (Fig 5d, e). Moreover, when we fed flies with CDF containing 18O isotope-labeled Pi, 18O incorporation into the PC lipids were detected by stable isotopic tracing high resolution LC-MS/MS analysis of purified PXo bodies (Fig. 5f). Therefore, Pi consumed by the PXo body can be converted and stored in the form of phospholipids, whereas the PXo body has a prominent phospholipid composition that undergoes remodeling following Pi starvation.
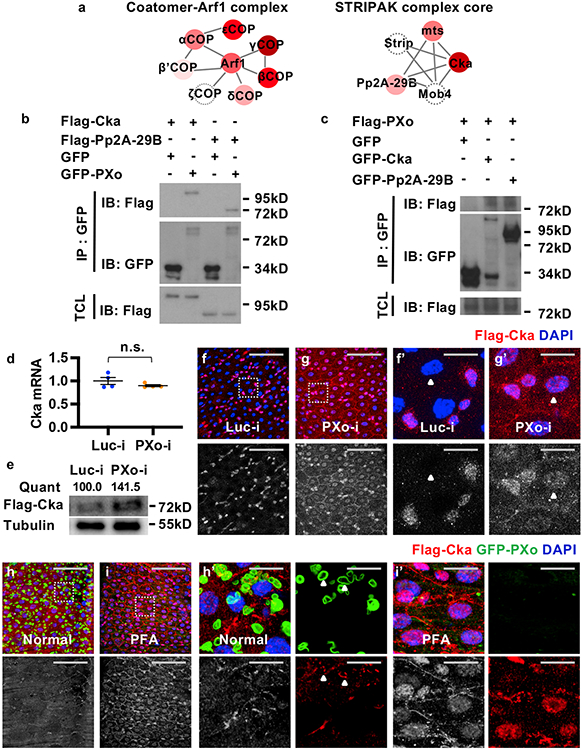
To unravel the signaling mechanism of Pi starvation and PXo knockdown, we performed affinity purification (AP) and LC-MS/MS analysis of PXo-interacting proteins. Consistent with our immunostaining and proteomic profiling of PXo bodies, the top candidates interacting with GFP-PXo (Fig. 6a, Supplementary Table 3) are proteins related to the Golgi apparatus (e.g. γCOP, εCOP, βCOP), vacuolar acidification (e.g. Vha68-2, Vha55, Vha26), and phospholipid metabolism (e.g. Ost48, Vap33, Inos). In addition, our candidate PXo-interacting proteins (Fig. 6a) include multiple components of the Striatin-interacting phosphatase and kinase (STRIPAK) complex, such as Cka, microtubule star (mts), and Protein phosphatase 2A at 29B (Pp2A-29B). Interestingly, two Drosophila STRIPAK core components, Cka and MOB kinase activator 4 (Mob4), scored as top PXo-interactors in a previous high-throughput yeast two-hybrid study45.
Figure 6. PXo interacts with STRIPAK core components and suppresses Cka in ECs.
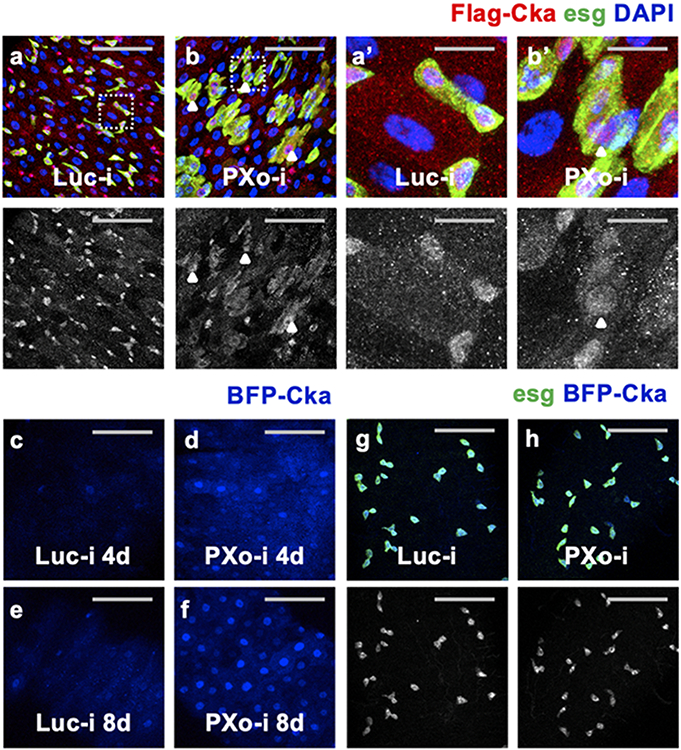
a, Top complexes enriched for PXo-interacting proteins identified by AP LC-MS/MS. Edges represent interactions among complex members. Node colors reflect the ratios of identified peptide number (PN) between experimental (GFP-PXo) and control (GFP) groups, with the darkness of red indicating (PN(GFP-PXo)+1)/ (PN(GFP)+1). Gray circled nodes indicate proteins not captured by LC-MS/MS. b, c, S2R+ cell extracts expressing GFP or GFP-tagged PXo, Cka, or Pp2A-29B are subjected to immunoprecipitation (IP) with GFP-Trap beads. TCL: total cell lysate. Gel source data in Supplementary Fig. 1b, c. d, RT-qPCR measurement of Cka mRNA in midguts with 5d ubiquitous expression of Luc RNAi or PXo RNAi. N=4 biological replicates per group. Data are mean ± SEM. P value (0.276) is from two-tailed Welch’s t test. e, IB for midguts with ubiquitous expression of Flag-Cka along with Luc RNAi or PXo RNAi for 5d. Same-volume samples in parallel wells of the same gel were blotted for Tubulin as control. Relative normalized anti-Flag IB intensity is quantified. Gel source data in Supplementary Fig. 1d. f, g, Flag-Cka staining of midguts expressing Luc RNAi or PXo RNAi in ECs for 4d. Magnified views of squared regions and examples of ECs highlighted by arrowheads are presented in (f’, g’). h, i, Flag-Cka and GFP-PXo co-staining of midguts fed with normal or PFA food for 7d. Magnified views of highlighted regions are in (h’, i’), with a single Z-stack of separate channels shown on the right and arrowheads highlighting co-localization. The anti-Flag staining red channels are shown in grayscale below merged images in (f-i, f’-i’). Scale bars, 50 μm (f, g, h, i), 10 μm (f’, g’, h’, i’).
STRIPAK is an evolutionary conserved protein complex that regulates vesicular transport, endomembrane organization, and a variety of signaling pathways3. In Drosophila, core components of STRIPAK include Cka (scaffold protein, the only Striatin in Drosophila), mts, Pp2A-29B, Mob4, and Striatin-interacting protein (Strip). We first validated direct PXo:Cka and PXo:Pp2A-29B interactions by co-immunoprecipitation (Co-IP) (Fig. 6b, c). Strikingly, whereas PXo knockdown in ECs does not affect Cka expression at the mRNA levels (Fig. 6d), it increases the protein levels of Flag-tagged Cka expressed under the control of a ubiquitous promoter (tub-Flag-Cka), as measured by Western blot (Fig. 6e). As revealed by immunostaining, whereas Flag-Cka is normally expressed at very low levels in ECs (Fig. 6f, f’, Extended Data Fig. 11a, a’, note that ECs are polyploid and have large nuclei size), it exhibits increased expression and nuclear accumulation in ECs (Fig. 6f, g, f’, g’) and in progenitors that are differentiating towards ECs (Extended Data Fig. 11a, b, a’, b’) following PXo knockdown. Consistent with our results using tub-Flag-Cka, EC-specific expression of BFP-tagged Cka (BFP-Cka) is barely detectable unless PXo is down-regulated by RNAi (Extended Data Fig. 11c-f); whereas progenitor-specific BFP-Cka expression can accumulate and localize to the nucleus (Extended Data Fig. 11g, h). Moreover, Flag-Cka often co-localizes with GFP-PXo and even gets encased by PXo bodies in ECs (Fig. 6h, h’). Like after PXo knockdown, Flag-Cka staining dramatically increases and accumulates in the nucleus when PXo bodies degenerate following Pi starvation (Fig. 6i, i’). Altogether, our results suggest that PXo interacts with Cka and antagonizes Cka expression via post-translational sequestering in ECs.
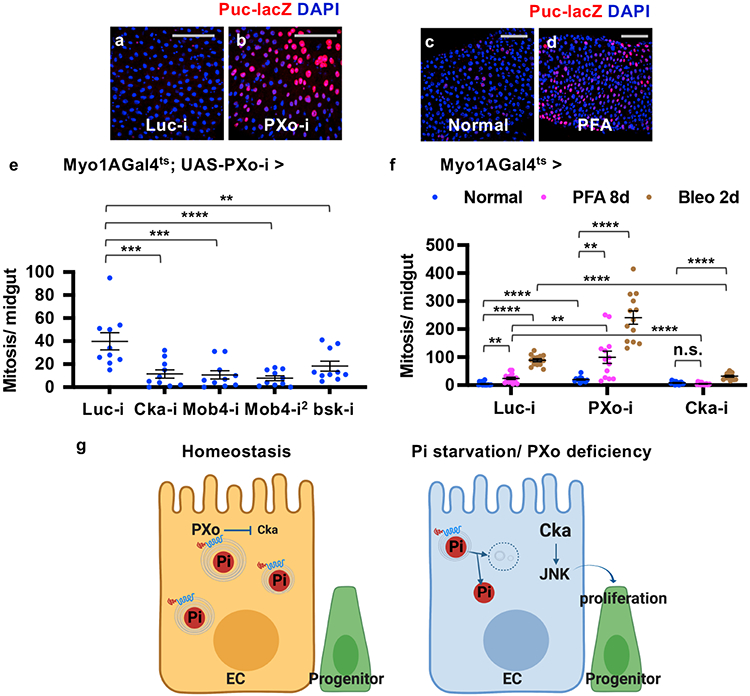
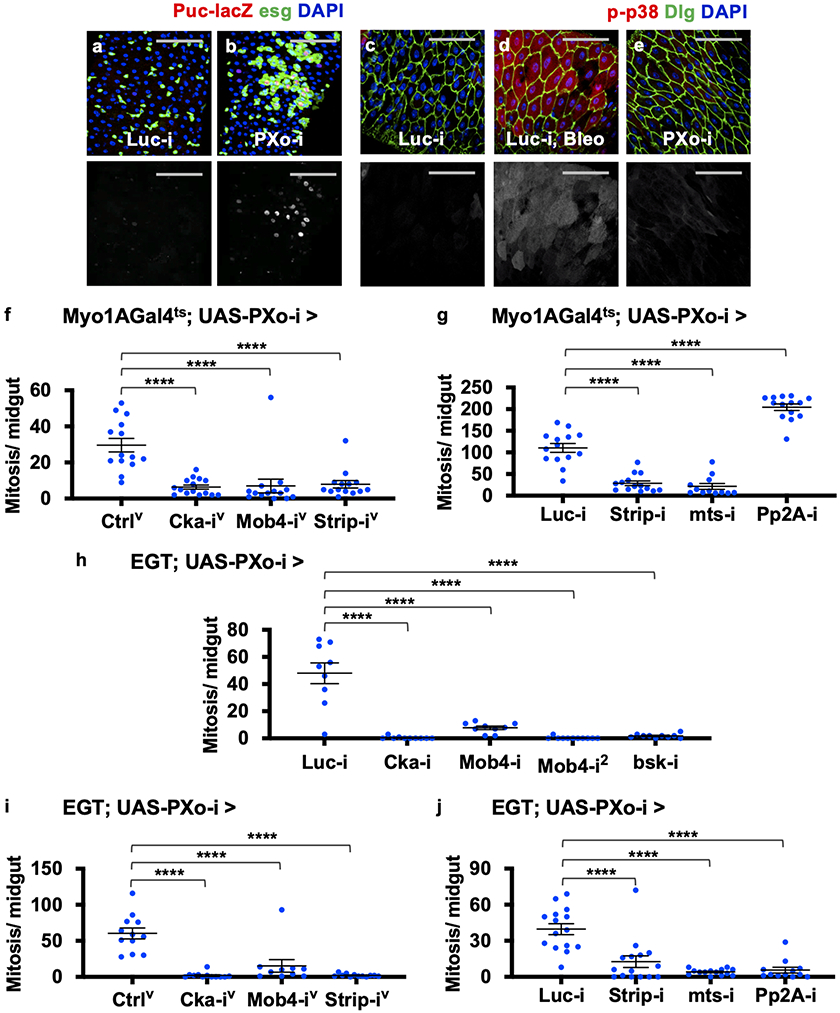
Cka can recruit JNK pathway components to facilitate the activation of JNK3, which is a stress-related mitogen-activated protein kinase (MAPK) known to act in ECs non-autonomously to induce progenitor proliferation46. Using the JNK reporter Puc-lacZ47, we observed dramatic JNK induction in ECs and progenitors that are proliferating and differentiating towards ECs following PXo knockdown (Fig. 7a, b, Extended Data Fig. 12a, b) or Pi starvation (Fig. 7c, d). In contrast, p38, another stress-related MAPK in the midgut48, is not induced by PXo knockdown (Extended Data Fig. 12c-e). Furthermore, RNAi lines targeting Cka, the JNK pathway kinase bsk, or several other core STRIPAK genes (Mob4, Strip, mts) all rescue the hyperproliferation induced by PXo knockdown in ECs (Fig. 7e, Extended Data Fig. 12f, g) and in progenitors (Extended Data Fig. 12h-j). In contrast, Pp2A-29B knockdown in ECs enhances PXo knockdown-induced hyperproliferation (Extended Data Fig. 12g), which could be due to promiscuous Pp2A functions such as a role in JNK inhibition49. Finally, midguts with Cka knockdown in ECs do not undergo hyperproliferation following Pi starvation, despite maintaining a dampened proliferative response to tissue damage (Fig. 7f). Altogether, our data suggest that Pi starvation or PXo knockdown triggers downstream Cka-JNK signaling to induce midgut hyperproliferation.
Figure 7. STRIPAK/Cka-JNK signaling mediates the hyperproliferation induced by Pi starvation or PXo knockdown.
a, b, Puc-lacZ staining of midguts expressing Luc RNAi or PXo RNAi in ECs for 7d. ECs have large nuclei identified by DAPI staining. c, d, Puc-lacZ staining of midguts from flies fed normal or PFA food for 7d. e, Mitosis quantification of midguts expressing PXo RNAi together with Luc RNAi, Cka RNAi, Mob4 RNAi (2 different lines), or bsk RNAi in ECs for 8d. N=10 midguts per group. P values from bottom to top: 3.12E-4, 2.10E-4, 4.87E-5, 7.53E-3. f, Mitosis quantification of midguts expressing Luc RNAi, PXo RNAi, or Cka RNAi in ECs for 8d and fed with normal food (N=14, 13, 13), PFA (N=15, 13, 14) or the last 2d Bleo (N=13, 13, 13). P values from bottom to top: 0.101, 1.70E-3, 3.83E-5, 2.10E-3, <1E-14, 1.70E-5, 1.92E-7, 2.87E-8, 9.83E-3, 1.18E-9. g, A schematic summary of the connections between Pi storage, PXo, and Pi signaling. PXo transports Pi into PXo bodies and antagonizes Cka/JNK. The coupling of both roles in PXo, whose conformation and activity are sensitive to cytosolic Pi levels, activates mitogenic JNK signaling under pathological conditions of Pi starvation or PXo deficiency. The diagram was created using BioRender. Data are mean ± SEM. P values are from one-way ANOVA with Bonferroni’s multiple comparison test in (e) and within the same genotype in (f), or two-tailed Mann-Whitney u test between different genotypes in (f). Scale bars, 50 μm (a, b, c, d).
In summary, our study identifies the PXo body as pivotal for maintaining cytosolic Pi levels and connecting Pi regulation to tissue homeostasis (Fig. 7g). With adequate Pi uptake, cytosolic Pi is transported via PXo into PXo bodies and likely consumed for phospholipid synthesis. Conversely, with Pi starvation, PXo expression is down-regulated at both the mRNA and protein levels, PXo bodies disassemble and decrease in phospholipid contents, releasing Pi back into the cytosol. In addition to its function as a Pi transporter, PXo antagonizes the STRIPAK complex protein Cka. Thus, when Pi starvation causes the degradation of PXo bodies, Cka-JNK signaling is activated to induce regenerative activities (Fig. 7g).
In unicellular organisms, Pi is indicative of environmental nutrient abundance and generally supports cell growth and division1. In metazoans, however, Pi availability is affected by nutrient uptake, systemic metabolism, and local Pi usage, and thus implicates more complex Pi signaling50. In this study, we demonstrated that Pi starvation or PXo deficiency induces hyperproliferation and EC differentiation in the epithelium of the Drosophila midgut, which might be a compensatory mechanism to produce more ECs capable of Pi absorption. Given the scarcity of knowledge about cytosolic Pi regulation in animal cells, our findings might have broad implications and open new avenues for studying Pi metabolism and signaling.
Methods (On-line only)
Drosophila stocks
The following strains were obtained from the Bloomington Drosophila Stock Center (BDSC): y v; attP2 (Ctrlb, landing site only, BL36303), UAS-Luc-i (BL31603), UAS-PXo-i (BL34551), UAS-p35 (BL507351), y,w; nos-Cas9/CyO (BL78781), esg-lacZ (BL10359), hsp70-Mos1-Cre (BL1092), 20xUAS-6xGFP (BL52261), PXoPL48 FRT2A FRT82B (BL19366), FRT2A FRT82B (BL8218), hsp70-piggyBac (BL8284), UAS-RFP-KDEL (BL30910), UAS-ManII-TagRFP (BL65249), UAS-GalT-TagRFP (BL65251), UAS-Sar1-i (BL3236452), UAS-Arf1-i (BL6617453), UAS-γCOP-i (BL28890), UAS-Pmm2-i (BL42956), UAS-Pink1-i (BL31170), UAS-Parkin-i (BL37509), UAS-Lamp1-i (BL38335), UAS-ABCA-i1 (BL3832954), UAS-ABCA-i2 (BL3835355), UAS-Rab7-i (BL27051), UAS-Rab11-i1 (BL27730), UAS-Rab11-i2 (BL42709), UAS-GFP-LAMP1 (BL42714), UAS-Atg8a-GFP (BL52005), UAS-Tsp2A-i (BL40899), UAS-hts-mCherry (BL66171), UAS-SERCA-tdTomato (BL58971), UAS-Ogdh-Flag (BL77505), UAS-Idh-Flag (BL56201), Idh3a-GFP (BL82434), Treh-GFP (BL59825), Ance-GFP (BL59828), UAS-Mipp1-GFP (BL78062), UAS-Cka-i (BL28927), UAS-Mob4-i (BL65236), UAS-Mob4-i2 (BL36488), UAS-bsk-i (BL31323), UAS-Strip-i (BL34657), UAS-mts-i (BL38337), UAS-Pp2A-29B-i (BL29384). Stocks from Vienna Drosophila RNAi Center (VDRC, with superscript label “v”): y w; attP (Ctrlv, landing site only, v60100), UAS-PXo-iv (v100151), UAS-MFS10-iv (v108045), UAS-Cka-iv (v35234), UAS-Mob4-iv (v40442), UAS-Strip-iv (v16211). Stock from National Institute of Genetics (NIG, with superscript label “N”): UAS-PXo-iN (10483R-3). EGT; UAS-Flp, Act>Stop>Gal4 (EGT F/O56) was from Bruce Edgar. UAS-H2B-RFP was from Nicolas Buchon. tubGal80ts; DlGal4 (DlGal4ts) and tubGal80ts; Su(H)Gal4 (Su(H)ts) were from Steve Hou. UAS-CD63-GFP was from Clive Wilson. UAS-Vha55-GFP was from Francesca Pignoni. tub-Flag-Cka was from Duojia Pan. UAS-BFP-Cka was from Tom Hays. The fly stock for MARCM analysis, yw hs-FLP tub-GAL4 UAS-nls-GFP; FRT2A tub-GAL80, was from Huaqi Jiang. Stocks from Perrimon lab: w1118, OreR, UAS-GFP, esgGFP, tubGal80ts; Myo1AGal4 (Myo1Ats), tubGal80ts; tubGal4 (tubts), esgGal4 UAS-GFP tubGal80ts (EGT), tubGal80ts; esgGal4 (esgts), tubGal80ts; DaGal4 (Dats), tubGal80ts; ProsGal4 (ProsGal4ts, made with ProsGal4 from Allison Bardin), PXoGal4, PXo2xHA. The following stocks were generated in this study: PXoGal4, PXorev FRT2A FRT82B, UAS-GFP-PXo, UAS-GFP-PXoΔSPX, PXo2xHA, UAS-PXo-HA, UAS-FLIPPi. A complete list of fly genotypes used in this study is presented in Supplementary Table 4.
PXorev FRT2A FRT82B was generated by crossing PXoPL48 FRT2A FRT82B to flies that express the piggyBac transposase (hsp70-piggyBac)57. Because the transposon carries the eye-specific 3xP3-EYFP fluorescent marker, the loss of eye fluorescence was used to screen for revertant flies. Note that whereas PXoPL48 is homozygous lethal, PXorev is homozygous viable.
Sequence-verified PXo cDNA coding sequence (CDS) was cloned from GH26628 (Drosophila Genomics Resource Center (DGRC)) into the pEntr/D-Topo vector (Invitrogen K240020), and then into pTGW (using CDS with stop codon) or pTWH (using CDS without stop codon) expression vectors (the Drosophila Gateway Vector collection) with the Gateway™ LR Clonase™ II kit (Invitrogen #11791020) to generate plasmids injected for UAS-GFP-PXo or UAS-PXo-HA transgenic flies. To generate the UAS-GFP-PXoΔSPX transgenic flies for expression of a truncated allele of PXo lacking the SPX domain (1aa-193aa), the UAS-GFP-PXo plasmid was digested by SacII (NEB, R0157) and KpnI (NEB, R0142), and then circularized by Gibson assembly (NEB, E2611) to obtain the plasmid for injection. Red eye color was used to screen for transgenic flies because the expression vectors carry the w+ marker.
Sequence-verified FLIPPi was cloned from pLR364-cpFLIPPi-6.4 into pEntr/D-Topo with a pair of primers (CACCGGTAGAAAAAGACCGGG and CGAATGCTAAGCTTTTACTCGATG), and then into pTW expression vector to generate the plasmid for UAS-FLIPPi transgenic flies. Red eye color was used to screen for transgenic flies.
CRISPR/Cas-mediated genomic editing
PXoGal4 was generated by sgRNA/Cas9-mediated genome editing. We cloned the pCFD3-U6-PXo-sgRNA plasmid by inserting sgRNA that targets PXo translational start site (seed sequence: GCGAACTTCATCTCGGGAATTGG) into the pCFD3 vector (Addgene, #49410) and generated a Gal4 version of the pHD-DsRed donor plasmid with ~1kb sequence-verified homology arms on each end. After injection of 1:1 mixture of sgRNA and donor plasmids in injection buffer (5 mM KCl, 100 μM sodium phosphate buffer with pH 6.8) into fly embryos expressing Cas9 (genotype: nanos-Cas9/CyO). The loxP-flanked 3xP3-dsRed fluorescent marker in the donor vector was used to screen for knock-in flies in parental and F1 generations, and subsequently removed by crossing to flies that express the Cre recombinase (hsp70-Mos1-Cre). PXoGal4 knock-in stocks were confirmed by genotyping PCR using two pairs of primers (forward and reverse): gtPCR1 (GATGAAGCCCATGTCCAAGT and AGCGGAGACCTTTTGGTTTT) and gtPCR2 (CACAACCAATTGCCTCCTCT and GTGGGACTTCGACCAAAGAA).
To obtain PXo2xHA flies, we cloned the homology arm upstream of the endogenous PXo start codon with the primer pair of TTGTGCAGGCGACTCTTCGG & CTCGGGAATTGGGGGGATCTCACAAC, and the downstream homology arm with the primer pair of ATGAAGTTCGCCGAGCACCT and CGATCTCCTCCCTCGATGTCC. The two arms were inserted into the pScarlessHD-2xHA-DsRed vector (Addgene, #80822) via Gibson assembly to generate the donor plasmid, pScarlessHD-PXo-N-2xHA-DsRed, which was subsequently mixed with the pCFD3-U6-PXo-sgRNA plasmid for injection into fly embryos expressing Cas9. The edited flies were selected by DsRed fluorescence, confirmed by genotyping PCR with gtPCR3 (CGAGAGGCGTTTTCATTTGT and CAGACCGATAAAACACATGCGTCA) and gtPCR4 (TCCTAAATGCACAGCGACGGATTCG and AGAGGCATTCGATGATGAGG) primer pairs, and crossed to flies expressing the piggyBac transposase to remove the DsRed cassette. The resulting PXo2xHA flies were identified by the loss of DsRed fluorescence, genotyped with gtPCR5 primers (TGGCCCAGTTGTGATGTTTA and ATTTTCGGCACTCACCTCAT), and verified by sequencing the genotyping PCR product.
Drosophila culture and drug treatment
Flies were reared on standard corn meal/ agar medium (fly food). We kept a consistent number of adult flies (usually ~15 females and 5 males) into each vial and replaced their food every other day to keep the vials clean. For conditional expression using tubGal80ts, flies were grown at 18°C until eclosion, maintained at 18°C for an additional 3-5d to allow post-eclosion midgut development, and then shifted to 29°C to induce expression. For cell loss assay, young adult flies with 2d induction of EC-specific expression of H2B-RFP were shifted back and kept at 18°C for 11d, with the last 9d on normal or PFA food. For MARCM58 experiments, flies were maintained at 18°C until 3-5d after eclosion, heat-shocked at 37°C for 1 hr, and then maintained back at 18°C before dissection and analysis.
To induce midgut damage, fly food was melted and mixed with a final concentration of 25 μg/ml Bleo (Calbiochem #203408). For Pi starvation, we dissolved PFA (Sigma-Aldrich #P6801) in water to make 180 mM stocks and mix with melted fly food at a final concentration of 20 mM. We used a slightly higher dose of 30 mM PFA food to accelerate PXo body degradation (for observation with 2d feeding) in the rescue experiments (Fig. 4k, l, m), which include food mixed with PFA alone, PFA together with 10 mg/ml CQ (Sigma-Aldrich C6628) or PFA together with 20 μM MG132 (Calbiochem #474791). The concentration of CQ and MG132 were based on previous characterization59. For extra Pi feeding, we prepared a concentrated stock of 900 mM Na2HPO4/NaH2PO4 (adjusted to pH 7) and mixed with melted fly food at 30 mM final concentration. Fly food containing the same concentration of Na2SO4 (pH 7) was included to control for salt concentration changes in Pi food. In addition to the sodium salts used throughout this study, we also made consistent observation with potassium salts. For extra phospholipid feeding, we mixed phosphatidylcholine (PC) (Sigma-Aldrich #1535733) with melted fly food at 1% or 5% by weight. We added the same amount of water to melted fly food in order to make normal food as the control for drug stocks prepared in water solutions. Moreover, we weighed the food before and after melting in order to measure the volume of extra water required in each group to compensate for evaporation.
The S2R+ cell line was obtained from the Drosophila RNAi Screening Center/Transgenic RNAi Project Functional Genomics Resources and Drosophila Research & Screening Center-Biomedical Technology Research Resource at Harvard Medical School. It has distinct morphology that can be relied on for quality control in routine passages. Moreover, it has been molecularly validated by transposable elements DNA sequencing60. S2R+ cells were cultured in Schneider’s Insect Medium (Sigma-Aldrich S0146) in 25°C tissue culture incubator. PXo CDS (from DGRC GH26628) was cloned into the pAGW expression vector (the Drosophila Gateway Vector collection) and transfected into S2R+ cells with Effectene transfection reagent (Qiagen #301427). For drug treatment, transfected S2R+ cells were seeded on cover slides in the culture dish, and incubated with 30 mM PFA, 30 mM PFA together with 100 nM BafA1, or 30 mM PFA together with 20 μM MG132 for 24 hrs before fixation and staining.
Drosophila chemically-defined food (CDF)
CDF was prepared as previously described61 with slight modifications. First, we prepared the base buffer, which contains 30 g/L KH2PO4 (Sigma P9791, dissolved in H2O unless noted otherwise), 10 g/L NaHCO3 (Sigma S8875), and 30 mL/L glacial acetic acid (Millipore AX0074). For 20% Pi and 10% Pi CDF, 6 g/L and 3 g/L KH2PO4 were used, respectively, with an appropriate amount of K2SO4 (Sigma P0772) added to maintain the potassium ion concentration. For isotopic Pi tracing, we used 18O-labeled KH2PO4 (Cambridge Isotope Laboratories, OLM-7493-PK).
Second, we prepared the vitamin solution, which contains 0.1 g/L thiamine (Sigma T4625), 0.05 g/L riboflavin (Sigma R4500), 0.6 g/L nicotinic acid (Sigma N4126), 0.775 g/L calcium pantothenate (Sigma P21210), 0.125 g/L pyridoxine (Sigma P9755), and 0.01 g/L biotin (Sigma B4501). Third, we prepared the nutrient supplement, which contains 6.25 g/L choline chloride (MP Biomedicals 194639), 0.63 g/L myo-inositol (Sigma I7508), 8.13 g/L inosine (Sigma I4125), 7.5 g/L uridine (Sigma U3003). Per 1 L final volume of CDF, we prepared CDF-fraction A, which includes 100 mL base buffer, 21 mL vitamin solution, 8 mL nutrient supplement, 10 mL 163 g/L arginine HCl (Amresco 0877), 10 mL 34 g/L cysteine (Sigma 30089, in 1N HCl), 10 mL 152 g/L glutamic acid monosodium salt monohydrate (Alfa Aesar A12919), 10 mL 77 g/L glycine (Alfa Aesar A13816), 10 mL 137 g/L lysine HCl (Amresco 0437), 10 mL 98 g/L proline (Sigma, P5607), 10 mL 138 g/L serine (Sigma S4311), 50 mL 22 g/L alanine (Sigma A7469), 50 mL 20.6 g/L asparagine (Amresco 94341), 50 mL 23.4 g/L aspartic acid (Alfa Aesar A13520, in 0.5 N NaOH), 50 mL 22.4 g/L glutamine (Amresco 0374), 50 mL 40.6 g/L leucine (Sigma L8912, dissolved in 0.2 N HCl), 50 mL 6.4 g/L tryptophan (Amresco E800), 1 mL 0.5 g/L folic acid (Sigma F8758, in 0.004N NaOH), 6 mL propionic acid (Sigma P5561), 15 mL 100 g/L methyl 4-hydroxybenzoate (Sigma H3647, in 95% ethanol).
Next, per 1L final volume of CDF, we prepared CDF-fraction B, which contains 50 mL 13 g/L histidine stock solution (Amresco 1B1164), 50 mL 22.4 g/L isoleucine (Amresco E803), 50 mL 12 g/L methionine (Amresco E801), 50 mL 20.2 g/L phenylalanine (Sigma P5482), 50 mL 22.2 g/L threonine (Sigma T8441), 50 mL 24 g/L valine (Amresco 1B1102), 0.93 g tyrosine (Sigma T8566), 15 mL 20 mg/mL cholesterol (Sigma C8667, dissolved in ethanol), 1 mL 250 g/L CaCl2·6H2O (Sigma 21108), 1 mL 2.5 g/L CuSO4·5H2O (Sigma C7631), 1 mL 25 g/L FeSO4·7H2O (Sigma F7002), 1 mL 250 g/L MgSO4 (Sigma M7506), 1 mL 1 g/L MnCl2·4H2O (Sigma M3634), 1 mL 25 g/L ZnSO4·7H2O (Sigma Z0251), 25 g sucrose (Sigma S7903), 158 mL H2O (milliQ), and 10 g agar (Fisher Scientific DF1040-07-4). CDF-fraction B was mixed well in a 1 L bottle with a magnetic stirrer and autoclaved at 120°C for 15 min. After autoclaving, the hot CDF-fraction B is combined and mixed well with CDF-fraction A, and aliquoted into ~5 mL/vial. After cooling and solidification, the CDF vials were covered with cotton plugs, covered with plastic wrap, and stored at 4°C for use within 1 month.
mRNA quantification
Total RNA was extracted from 15-20 midguts using TRIZOL reagent (Thermo Fisher), treated with DNase I, purified using the QIAGEN RNeasy kit, and converted to cDNA using the iScript cDNA Synthesis kit (Bio-Rad). cDNAs were analyzed by quantitative PCR (qPCR) using the SYBR Green kit (Bio-Rad) and Bio-Rad CFX Manager software. rp49 was used as the internal control in (Fig. 1a). Both GAPDH and rp49 were used as internal controls for other RT-qPCR experiments. Each RT-qPCR was performed with three technical replicates. Data from 4 biological replicates were quantified in (Fig. 1d, 6d). Data from a representative biological replicate were presented in (Extended Data Fig. 1e, Extended Data Fig. 2b-c). qPCR primer pairs (forward & reverse) are shown below:
GAPDH: CCAATGTCTCCGTTGTGGA & TCGGTGTAGCCCAGGATT
rp49: ATCGGTTACGGATCGAACAA & GACAATCTCCTTGCGCTTCT
PXo_P1: CACCTGACGGCCCACATAAC & AGGGCGATTGTTCGATGGC
PXo_P2: CTTTGGTCGAAGTCCCACAT & GACCAGATGCGGAAATGACT
PXo_P3: AGTCATTTCCGCATCTGGTC & CATGTGTAGGCGTAGCAGGA
MFS10: GACGAACGGGAGGCGTTTT & AGGAAGCCCATGAATCCGAAA
Cka: TCAACGCTGGTGGACAGAAC & ATGCCCGGTATTGTGTATTGG
Anti-PXo antibody
The polyclonal anti-PXo antibody was generated following an established protocol62. A short peptide (KKNKQEQRLLLQGESIEDLAS) was chosen as the antigen based on predicted immunogenicity and specificity. The original cysteine residue at the C-terminal sequences of PXo (KKNKQEQRLLLQGESIEDLCS) was replaced with alanine because cysteine is prone to oxidation and erroneous downstream processing. The antigen was synthesized by GenScript, KLH-conjugated, and used to immunize rabbits for antibody production at Cocalico Biologicals (one initial inoculation followed by several booster injections). The serum was collected from immunized rabbits ~70-90 day after the initial inoculation.
Immunostaining and imaging analysis
Drosophila midguts (from female adults) or S2R+ cells were fixed in 4% paraformaldehyde in Phosphate-buffered saline (PBS) at room temperature for 1 hr, incubated for 1-2 hrs in Blocking Buffer (5% Normal Donkey Serum, 0.3% Triton X-100, 0.1% Bovine serum albumin (BSA) in PBS), and stained with primary antibodies overnight at 4°C in PBST (0.3% Triton X-100, 0.1% BSA in PBS). The primary antibodies and their dilutions we used are: rabbit anti-pH3 (Millipore #06-570; 1:3000), mouse anti-GFP (Invitrogen A11120; 1:300), rabbit anti-GFP (Invitrogen A6455; 1:500), rabbit anti-RFP (Life Technologies R10367; 1:500), rabbit anti-β-galactosidase (Cappel #0855976; 1:6000), rabbit anti-Pdm1 (from Xiaohang Yang; 1:500), mouse anti-Pros (DSHB #MR1A; 1:50), mouse anti-HA (BioLegend #901514 or Thermo Scientific A-21287; 1:1000), rat anti-HA (Sigma-Aldrich 3F10; 1:1000), rabbit anti-PXo (this study; 1: 2000), rabbit anti-cleaved caspase3 (Cell Signaling 9661S; 1:500), goat anti-GMAP (DSHB #GMAP; 1:1000), mouse anti-Cnx99A (DSHB #Cnx99A 6-2-1; 1:10), rabbit anti-Lgl (Santa Cruz sc-98260; 1:300), mouse anti-ATP5A (Abcam ab14748; 1:500), mouse anti-Hrs (DSHB #Hrs 27-4; 1:40), mouse anti-Rab7 (DSHB #Rab7; 1:40), rabbit anti-Lamp1 (Abcam ab30687; 1:500), mouse anti-Dlg (DSHB #4F3; 1:50), mouse anti-α-Spec (DSHB #3A9; 1:50), rabbit anti-mCherry (Takara #632496; 1:300), rabbit anti-Flag (Sigma-Aldrich F7425; 1:2000), and rabbit anti-phospho-p38 MAPK (Cell Signaling #9211; 1:400). After primary antibody incubation, the midguts or S2R+ cells were washed 3 times with PBST, stained with 4′,6-diamidino-2-phenylindole (DAPI) (1:2000 dilution) and Alexa Fluor-conjugated donkey-anti-mouse, donkey-anti-rabbit, donkey-anti-goat, or donkey-anti-rat secondary antibodies (Molecular Probes/Invitrogen; 1:1000) in PBST at 22°C for 2 hrs, washed 3 times with PBST, and mounted in Vectashield medium.
For mitosis quantification, the number of pH3+ cells in the entire midgut was counted with an epi-fluorescence microscope. Unless noted otherwise, all images of the posterior midgut or S2R+ cells that are presented in this study are confocal images captured with a Zeiss LSM780 confocal microscope. A z-stack series of 10-20 images (or higher number for thicker organs) covering one layer of the epithelium from the apical to the basal side were obtained, adjusted, and assembled using NIH Fiji version 1.0, and shown as a maximum projection unless noted otherwise. For MARCM analysis, we quantified ~15 clones per gut. For quantification of GFP-labeled PXo body density, we counted the PXo body number and cell number by applying Fiji “Process-Find Maxima” function to GFP and DAPI channel, respectively. For quantification of GFP-labeled PXo body size (Fig. 4i), we analyzed the GFP channel with a Fiji Macro “PXo_body_area” and plotted the normalized PXo body area size with R studio version 1.1.463 using our customized codes “PXo_size_violin”. A z-stack series of confocal images were analyzed with the Imaris software (x64 version 9.5.1) for 3D visualization (Fig. 2a, e-k, Extended Data Fig. 3h-r), Mander’s coefficient co-localization analysis (Extended Data Fig. 3s, Extended Data Fig. 5c), surface rendering and shortest distance calculation for quantification of the subcellular localization of PXo bodies in relation to other markers (Fig. 2l, m, o, Extended Data Fig. 3t). For quantification of immunogold labeling (Fig. 2d), the numbers of gold particles were counted in the multilamellar structures (PXo bodies) or other areas and normalized to the size of corresponding areas using NIH Fiji version 1.0. All quantification data except the violin plot were visualized with the GraphPad Prism software version 9.4.0.
ApopTag cell death stainings were performed with the ApopTag Red In Situ Apoptosis Detection Kit (Millipore S7165) as previously described63. Midguts were dissected in PBS and fixed in 4% paraformaldehyde at room temperature for 1 hr, rinsed in PBS for 3 times (5 min each time), and rinsed in 75 μL/gut equilibration buffer for 10 min. The midguts were then submerged in 55 μL/gut reaction mix with working strength TdT enzyme (ratio 7:3). After incubation at 37°C for 1 hr, the TdT reaction mix was replaced with 1 mL stop/wash buffer (diluted 1:34 in dH2O) for a 10 min incubation at room temperature. Samples were then washed 3 times in PBS and incubated in 65 μl/gut anti-digoxigenin-rhodamine solution (diluted 31:34 in ApopTag kit blocking solution) in a dark and moist chamber at room temperature for 30 min, rinsed 4 times in PBS and mounted in Vectashield medium with DAPI.
Lysotracker staining in live tissue was performed as previously described64. Midguts were dissected in PBS, incubated in 0.5 μM LysotrackerRed (DND-99, Invitrogen L-7528) in PBS for 3 min, rinsed and then transferred to PBS on microscopic slides, and photographed immediately.
For lipid staining, midguts were fixed in 4% paraformaldehyde in PBS at room temperature for 30 min, washed 3 times with PBS, incubated for 15 min in 2 μg/mL Nile Red (Sigma-Aldrich N3013) in PBS, and mounted in Vectashield medium with DAPI.
Lectin stainings were performed according to the instruction manual (EY Laboratories). Specifically, midguts with induced ubiquitous expression of GFP-PXo for 3d were dissected and fixed in 4% paraformaldehyde for 1 hr, rinsed and permeabilized with PBS containing 0.5% Triton X-100 for 1 hr, rinsed with lectin staining buffer (LSB, 0.05 M Tris solution containing 0.15M NaCl and 0.004M CaCl2, pH adjusted to 7.0-7.2), stained with LSB containing DAPI and ~100 μg/mL Texas Red Conjugated WGA (EY Laboratories T-2101-2) or Texas Red Conjugated ConA (EY Laboratories T-1104-5) in a moist chamber on an orbital shaker at room temperature for 1 hr, rinsed with LSB for three times, and mounted in Vectashield medium.
Tracing of newly synthesized or internalized membranes
P-Cho staining was adapted from previous studies in mice65. Specifically, adult flies with induced ubiquitous expression of GFP-PXo for 3d were injected with ~0.5 μL 1 mg/mL DMSO solution of propargylcholine (P-Cho, Aobious AOBT7378) in the abdomen using the CellTram 4r Oil microinjector (Eppendorf). The glass injection needles (Sutter Instrument Q100-70-7.5) were pulled to the desired thickness and opening diameter using program P0 on a micropipette puller (Sutter Instrument P-2000). After different post-injection time points, the midguts were dissected and stained using the Click-&-Go™ Plus 594 Imaging Kit (Click Chemistry Tools #1319) following the manufacturer’s protocol. In brief, the dissected midguts were fixed in 4% paraformaldehyde for 1 hr, washed 3 times in PBS (5 min each time), permeabilized in PBS containing 0.5% Triton X-100 for 15 mins, incubated in the Click-&-Go Imaging kit reaction cocktail in a moist chamber on an orbital shaker at room temperature for 30 min, rinsed once in Click-&-Go Imaging kit wash buffer (Component E), rinsed once in PBS, and mounted in Vectashield medium with DAPI.
Dextran and avidin uptake assays (Fig. 2k, o, Extended Data Fig. 3r) were based on previous description66,67. In brief, dissected midguts were incubated ex vivo with 2 mg/mL Texas Red-conjugated 10kD dextran (Invitrogen D1828) or 80 μg/mL Texas Red-conjugated avidin (Thermo Fisher Scientific A820) diluted in Schneider's medium (Thermo Fisher Scientific #21720-024) at room temperature for 30 min, rinsed 3 times in PBS, fixed in 4% paraformaldehyde, and stained following a standard protocol. In addition to the established protocols of ex vivo incubation, we have also tried an alternative delivery approach by feeding flies with 5% sucrose solution containing 2 mg/mL Texas Red-conjugated dextran or 80 μg/mL Texas Red-conjugated avidin for 1 hr and made consistent observations (Extended Data Fig. 3t).
Protein structure prediction and analysis
The predicted protein structures of Drosophila PXo (UniProt ID: Q9VRR2), human XPR1 (UniProt ID: Q9UBH6), and rice PHO1-2 (UniProt ID: Q6K991) are found in the AlphaFold Protein Structure Database68 and visualized with its 3D viewer (http://alphafold.ebi.ac.uk). The prediction model and data are authorized to use in publications under a CC-BY-4.0 licence. We downloaded their corresponding PDB files and conducted pairwise structure alignment with “jFATCAT (rigid)” parameters69 on the RCSB PDB protein data bank server (http://www.rcsb.org/alignment).
PXo body extraction, density gradient ultracentrifugation fractionation, and purification
Following induced GFP-PXo labeling at 29°C for 4d, 20 adult midguts (genotype: tubGal4ts UAS-GFP-PXo) per group were dissected and placed in Eppendorf tubes containing 100μL freshly prepared extraction buffer (2x protease and phosphatase inhibitor (Pierce #78440), 2mM trypsin inhibitor benzamidine (Sigma-Aldrich #434760) in 1xPBS). After briefly breaking up the midguts with Kimble Kontes pellet pestles (Millipore Z359947), the lysate was transferred into a 1mL tight-type Dounce homogenizer on ice. An additional 900μL extraction buffer was used to rinse the tube and transferred to the same homogenizer. After homogenization with ~25 strokes on ice, the homogenate was centrifuged at 500 x g for 3 min at 4°C, filtered through a 40 μm cell strainer (Falcon) to remove the cell debris and intact cells, and then used for density gradient ultracentrifugation or PXo body purification.
To measure the density of PXo bodies, we prepared iodixanol fractions by diluting OptiPrep (Sigma D1556, 60% iodixanol) with extraction buffer to the following concentrations: 36%, 20%, 10%, and 5%. 200 μL midgut homogenate was mixed with 1 ml 36% iodixanol at the bottom of a 5 mL centrifugation tube (Bechman, 344057), resulting in a final concentration of 30% iodixanol. 1 mL each of the 20%, 10%, and 5% fractions were gently and sequentially placed on top of the heavier fractions. The step-gradient was then centrifuged in a swing-bucket rotor (Beckman MLS-50) at 200,000 x g for 3 hrs at 4°C, and manually separated by slowly aspirating from the top of the tube with a pipet into ~300 μL fractions. 20 μL liquid per fraction was spread on a microscopic slide and imaged under an epifluorescence microscope to identify the fractions most enriched for PXo bodies (Extended Data Fig. 9b-e). The RI of each fraction was measured on an Accurate analogue Abbe refractometer (A.KRÜSS AR4). The density of each fraction was acquired by looking up the data table in the OptiPrep Application Sheet C01. For calibration, we measured the RI of 10%-30% iodixanol solutions diluted with extraction buffer (Extended Data Fig. 9f). ~100 μL liquid per fraction was used for western blot. 100 μL fraction 9 and 100 μL fraction 10 were combined, incubated with regular EM fixative, and subjected to EM analysis.
To purify PXo bodies, we adapted a previously established immunoprecipitation (IP) protocol for tagged lysosomes70. In brief, the filtered homogenate was centrifugated at 3,000 x g for 5 min at 4°C. Afterwards, the supernatant was discarded, whereas PXo bodies at the bottom and side of the tubes were rinsed and resuspended with 500 μL extraction buffer to a new tube. The steps of centrifugation and rinsing were repeated three times to enrich for PXo bodies and to remove GFP-PXo that are not assembled into PXo bodies. 25 μL Chromotek-GFP-Trap agarose beads (Bulldog Biotechnology gta-20) was added to the final round of resuspended homogenate. After 5 hrs of incubation on a rotator at 4°C, we precipitated the beads, discarded the supernatant, and washed three times with the extraction buffer. Finally, the PXo body-bound beads were resuspended in ~20 μL extraction buffer and subjected to in-gel staining, proteomic analysis, or lipidomic analysis. For in-gel staining, a small aliquot of melted 2% low melting point agarose (Invitrogen # 16520100) was mixed in a 55°C heat block with an equal volume of rinsed homogenate (input), supernatant after Chromotek-GFP-Trap incubation, or PXo body-bound beads. The resulting mixture was quickly spread on a microscopic slide, solidified with cooling, encircled with a PAP pen, fixed with 4% paraformaldehyde for 30min, and stained in a humidified chamber.
Western blot and Co-IP
PXo is predicted to be highly hydrophobic. In our pilot experiments using the conventional methods of sample boiling (data not shown), IB signals for GFP- or Flag-tagged PXo (no matter N-terminal or C-terminal) would stick around the loading position and fail to migrate down the protein gels, suggesting that PXo might form large aggregates at boiling temperature. Through optimization of the sample preparation protocol, we found that 37°C incubation for at least 1 hr, instead of boiling, guarantees that PXo stays soluble.
For western blot with the anti-PXo antibody, pAGW-PXo or pAWH-GFP (GFP cloned into the pAWH expression vector) was transfected into S2R+ cells, incubated for 3d, and lysed with lysis buffer (Pierce #87788) containing 2x protease and phosphatase inhibitor (Pierce #78440), incubated in 2x SDS sample buffer (Thermo Scientific #39001) containing 5% 2-Mercaptoethanol at 37°C for 1 hr, ran on a 4%-20% polyacrylamide gel (Bio-Rad #4561096), and transferred to an Immobilon-P polyvinylidene fluoride (PVDF) membrane (Millipore IPVH00010). The membrane was blocked by 5% BSA in 1x Tris-buffered saline (TBS) containing 0.1% Tween-20 (TBST) at room temperature for 1 hr, probed with rabbit anti-PXo (this study; 1:5000) or mouse anti-Tubulin (Sigma-Aldrich T5168; 1:5000) overnight at 4°C in 1x TBST with 5% BSA, washed with TBST and probed by HRP-conjugated secondary antibody. The HRP signal was detected with enhanced chemiluminescence (ECL) reagents (Amersham RPN2209; Pierce #34095).
For GFP-PXo, GFP-PXoΔSPX, and tub-Flag-Cka western blots (Fig. 4m, Extended Data Fig. 7q, Fig. 6e), 3 female adult midguts per group were dissected in PBS, placed in 100 μl lysis buffer (Pierce #87788) with 2x protease and phosphatase inhibitor (Pierce #78440) and 2 mM benzamidine (Sigma-Aldrich #434760), and homogenized using Kimble Kontes pellet pestles (Millipore Z359947). The protein lysates were incubated in 2x SDS sample buffer containing 5% 2-Mercaptoethanol at 37°C for at least 1 hr, and processed for western blot as described above, with rabbit anti-GFP (Invitrogen A6455; 1:10000), mouse anti-Flag (Sigma F3040; 1:5000), rabbit anti-GAPDH (GeneTex GTX100118; 1:10000), or mouse anti-Tubulin (Sigma T5168; 1:5000) as the primary antibody. The blots were imaged with ChemiDoc MP (Bio-Rad #17001402), and the total signal intensity of each band was measured with NIH Fiji version 1.0 for quantification of relative expression normalized to the internal control of GAPDH or Tubulin.
For western blot with the midgut homogenate after density gradient ultracentrifugation, each fraction was incubated in 2x SDS sample buffer containing 5% 2-Mercaptoethanol at 37°C for at least 1 hr, and processed for western blot as described above, with 5 μl sample loaded in gel for each fraction and rabbit anti-GFP (Invitrogen A6455; 1:10000) or mouse anti-ATP5a (Abcam ab14748; 1:1000) used as the primary antibody.
For Co-IP experiments, CDSs for PXo, Cka (from DGRC LD41760), and Pp2A-29B (from DGRC LD41760) were cloned into the pEntr/D-Topo and then pAGW or pAFW expression vectors (the Drosophila Gateway Vector collection). Note that whereas Cka and Pp2A-29B have multiple annotated isoforms, LD41760 and LD41760 harbors the CDSs for isoforms predicted to be the ones prominently expressed in the midgut, i.e. Cka-RA/RB/RC/RD and Pp2A-29B-RA/RB/RC. We sequence-verified the clones and corrected a C/− mutation in Pp2A-29B CDS found at position 1229 of LD41760. The mixtures of expression plasmids or the negative control of pAWH-GFP were transfected into S2R+ cells in a 10 cm plate. After 3d of incubation, cells were lysed with lysis buffer (Pierce #87788) with 2x protease and phosphatase inhibitor (Pierce #78440). Lysate was incubated with Chromotek-GFP-Trap (Bulldog Biotechnology gta-20) for at least 2 hrs at 4°C to precipitate the protein complexes. Beads were washed 3-4 times with 1 mL lysis buffer and incubated in 2x SDS sample buffer containing 5% 2-Mercaptoethanol at 37°C for at least 1 hr. The eluted samples were loaded on a 4%-20% polyacrylamide gel for western blot. We used rabbit anti-GFP (Invitrogen A6455; 1:10000) or mouse anti-Flag (Sigma-Aldrich F3165; 1:5000) as primary antibodies.
Proteomic and lipidomic analysis of purified PXo bodies
In addition to the GFP-PXo-labeled experiment groups, we included Chromotek-GFP-Trap IP of midgut expressing GFP (genotype: tubGal4ts UAS-GFP) as the negative control. For proteomic analysis with LC-MS/MS, the resuspended PXo body-bound or GFP-bound Chromotek-GFP-Trap beads were mixed well with a final concentration of 2x SDS sample buffer and 5% 2-Mercaptoethanol, incubated at 37°C for at least 1 hr, loaded on a 4%-20% polyacrylamide gel. The gel was stained with coomassie brilliant blue (Bio-Rad) and cut in small pieces for in-gel trypsin digestion and subjected to label-free quantitative mass spectrometry with a high resolution Thermo QExactive HF Orbitrap mass spectrometer. Proteins and tryptic digested peptides were identified using the Mascot 2.7 search engine vs the Drosophila protein database (UniProt) followed by analysis with Scaffold Q+S 5.1 software (Proteome Software). Gene ontology analysis was performed using DAVID (https://david.ncifcrf.gov/)71,72. DIOPT Ortholog Finder (https://www.flyrnai.org/cgi-bin/DRSC_orthologs.pl) was used to identify the mammalian orthologs for Drosophila proteins73.
The lipidomics analysis was performed as previously described74. In brief, 20 μL of the resuspended PXo body-bound or GFP-bound beads were mixed with 150 μL HPLC grade methanol and vortexed for 1 min. The mixture was added with 500 μL MTBE (methyl tert-butyl ether, Sigma-Aldrich 34875), incubated in a shaker at room temperature for 1 h, added with 120 μL H2O, and vortexed again for 1 min. The mixture was then centrifuged at 1,000 x g at room temperature for 10 min, after which we collected the upper MTBE liquid phase containing the non-polar lipids, mixed the lower liquid phase with 2 volume parts of MTBE/ methanol/ water (with a volume ratio of 10/ 3/ 2.5) for a repeated 1,000 x g centrifugation for 10 min to re-extract other lipids in the upper MTBE liquid phase. The combined MTBE phases were dried in a SpeedVac and analyzed with untargeted high-resolution LC-MS/MS on a Thermo QExactive Plus Orbitrap mass spectrometer. LipidSearch version 4.2 (Thermo Scientific) was used to identify lipid molecules, with the quantification of ion intensity by measuring the area size of identified peaks.
The 18O isotopic lipidomic tracing of purified PXo bodies followed the same procedures of lipid extraction and LC-MS/MS as described above. The data was analyzed with a modified version of the IsoSearch protocol75. In brief, the RAW files of unlabeled samples were processed with Scaffold Elements (Proteome Software, https://proteomesoftware.com/) and LipidSearch to obtain the pooled reference peak list with lipid m/z and RT information. All RAW files were converted to mzXML format using the “Peak Picking” filter with MSConvertGUI (https://proteowizard.sourceforge.io/), and processed with the R package enviPick (https://rdrr.io/cran/enviPick/) to create MS1 peak lists. We used the following eniPick parameters: MSlevel = c(1), dmzgap = 41, dmzdens = 20, drtgap = 300, drtsmall = 20, drtdens = 60, drtfill = 10, drttotal = 300, minpeak = 3, recurs = 3, weight = 1, SB = 1, SN = 3, minint = 1E3, maxint = 1E7, ended = 1, ion_mode = positive/negative. The M peak lists were then compared against the pooled reference peak list using an in-house R program IsoSearch. We used the following IsoSearch parameters: mass shift = 2.0042449933, rt_dist <= 2, mz_dist <= 10, Score = 0.6.
AP LC-MS/MS analysis of PXo-interacting proteins
pAGW-PXo or pAWH-GFP (negative control) was transfected into S2R+ cells for 3d of expression, after which the cells were lysed with lysis buffer (Pierce #87788) with 2x protease and phosphatase inhibitor (Pierce #78440). Lysate was incubated with Chromotek-GFP-Trap (Bulldog Biotechnology gta-20) for at least 2 hrs at 4°C to precipitate the protein complexes. Beads were washed 3-4 times with 1 mL lysis buffer and incubated in 2xSDS sample buffer (Thermo Scientific #39001) containing 5% 2-Mercaptoethanol at 37°C for at least 1 hr. The eluted samples were loaded on a 4%-20% polyacrylamide gel, digested in-gel with trypsin, and subjected to label-free quantitative tandem mass spectrometry using a Thermo QExactive HF Orbitrap mass spectrometer. Proteins and tryptic digested peptides were identified using the Mascot search engine vs the Drosophila protein database (UniProt). We performed complex enrichment analysis of the LC-MS/MS data using the protein Complex Enrichment Analysis Tool (COMPLEAT, https://flyrnai.org/compleat/)76 with updated annotation for STRIPAK complex77 and intra-complex interactions (https://fgrtools.hms.harvard.edu/MIST/)78. For COMPLEAT analysis, the enrichment ratios were used as input values; whereas the full list of protein-coding genes expressed in S2R+ cells79 was used as the background.
Ultrastructural analysis
For EM, posterior midguts or midgut homogenate fractions were incubated in the regular fixative (2.5% Glutaraldehyde 1.25% Paraformaldehyde and 0.03% picric acid in 0.1 M sodium cacodylate buffer, pH 7.4) for at least 2 hrs at room temperature, washed in 0.1 M cacodylate buffer and post-fixed with 1% osmium tetroxide and 1.5% potassium ferrocyanide for 1 hr, washed twice in H2O, once in Maleate buffer (MB), and incubated in 1% uranyl acetate in MB for 1 hr followed by 2 washes in H2O and dehydration in serial concentrations of ethanol (50%, 70%, 90%, 100%, 100%; 10min each). The samples were then put in propyleneoxide for 30 minutes and infiltrated overnight in a 1:1 mixture of propyleneoxide and TAAB Epon (TAAB Laboratories Equipment Ltd). The following day the samples were embedded in TAAB Epon and polymerized at 60°C for 48 hrs. Ultrathin plastic sections (~60 nm) were cut on a Reichert Ultracut-S microtome, picked up onto copper grids, and contrasted with 0.3% lead citrate. Grids with the sections were imaged using a JEOL 1200-EX transmission EM scope operating at 80 kV with an AMT 2k CCD camera. For quantification of unlabeled PXo body diameter, the long axis of oval-shaped multilamellar structures was measured with NIH Fiji version 1.0.
For EM with immunogold labeling, posterior midguts were fixed for 2 hrs in 0.1 M sodium phosphate buffer (pH 7.4) containing fresh 4% paraformaldehyde and 0.2% glutaraldehyde, rinsed in PBS, and then either processed with osmium fixation and plastic embedding (as described for regular EM) or processed with 2.3 M sucrose cryo-protection and liquid nitrogen freezing. Plastic-embedded or frozen samples were cut into ~80 nm sections using a Reichert Ultracut S microtome and transferred to formvar-carbon coated copper grids. Unless specified otherwise, staining was performed at 22°C. Frozen sections were blocked in 1% BSA PBS solution for 10 min, incubated with anti-GFP antibody (Abcam 6556; 1:30 dilution) in 1% BSA PBS solution for 1 hr, washed 4 times in PBS, incubated with protein A-conjugated 15 nm gold particles (University Medical Center, Utrecht, the Netherlands) for 20 min, washed twice in PBS and 4 times in H2O, and incubated in a mixture of 0.3% uranyl acetate and 2% methyl cellulose for 5 min for contrasting and embedding. Plastic sections were etched in saturated sodium m-periodate (Sigma-Aldrich #71859) for 3 min, washed 3 times in H2O, blocked in PBT buffer (0.1% Triton X-100, 1% BSA in PBS) for 30 min, incubated with rabbit anti-GFP (Abcam #6556; 1:50) antibody in PBT at 4°C overnight, washed 4 times in PBS, incubated with protein A-conjugated gold particles for 20 min, washed twice in PBS and 4 times in H2O, and stained with lead citrate for contrasting. Note that plastic sections preserve membrane morphology better whereas frozen sections improve labeling efficiency. For immunogold labeling with HIAR for the anti-PXo antibody, posterior midguts were fixed in 0.1 M sodium phosphate buffer (pH 7.4) containing fresh 4% paraformaldehyde for 2 hrs and processed with osmium fixation and plastic embedding. ~80 nm ultrathin sections were picked up on uncoated 300 mesh Nickel grids, etched in saturated sodium m-periodate for 5 min, washed 3 times in H2O, incubated with HIAR buffer (0.5 M Tris–HCl, pH 9.0) at 90° C for 45min, blocked in TBT buffer (0.1% Triton X-100, 1% BSA in 10 mM Tris, 150 mM NaCl, pH 7.4) for 30 min, incubated with anti-PXo (this study; 1:50) in TBT at 4°C overnight, washed 4 times in TBS (10 mM Tris, 150 mM NaCl, pH 7.4), incubated with protein A-conjugated gold particles for 30 min- 1h, washed 4 times with TBS followed by 3 times with H2O, and stained with uranyl acetate and lead citrate for contrasting. Grids with immunogold-labeled frozen or plastic sections were imaged the same way as regular EM.
Live imaging for intracellular Pi levels
Female adult midguts expressing FLIPPi were dissected and handled in adult hemolymph-like (AHL) buffer (2 mM CaCl2, 5 mM KCl, 5 mM HEPES, 8.2 mM MgCl2, 108 mM NaCl, 4 mM NaHCO3, 1 mM NaH2PO4, 10 mM Sucrose, 5 mM Trehalose, adjusted with NaOH to pH 7.5). 1-2 intact midguts were placed in single wells of 8-well clear bottom cell culture chamber slides, gently oriented with Nylon mesh on top, and immersed in 200 μL AHL buffer for imaging. FRET imaging and analysis were based on previously described intramolecular FRET protocols80. In brief, the images or videos of the posterior midguts and blank regions were acquired on a widefield fluorescent microscope (MicRoN Oscar) with multiband dichroic and excitation filter for CFP/YFP (Chroma #59217) and the Plan Fluor 10x/0.30 Air DIC L/N1 objective. The acquisition parameters (i.e. excitation filter and exposure time) were adjusted for each experiment to obtain optimal signal dynamic ranges and comparable signal intensity for CFP and cpVenus (YFP) channels. For extra Pi supplementation, we added 100 μL freshly prepared AHL solution containing 90 mM Na2HPO4/NaH2PO4 (diluted from 900 mM pH 7 stocks). In addition to sodium phosphate used in this study, we made consistent observation with potassium phosphate (K2HPO4/KH2PO4). FRET calculation was performed on Fiji with “Process-Image Calculator” function. We first subtracted from the CFP and YFP channels their corresponding blank signals (using images of blank regions acquired in the same experiment), extracted the midgut regions that are in focus by image thresholding, and divided the corrected cpVenus image by the corrected CFP image to obtain the image presenting FRET ratios in the midgut. For time-lapse analysis of average FRET ratios, we used the Fiji Macro “FRET_ratios_movie”.
Statistics and Reproducibility
For western blots, imaging, and RT-qPCR experiments, a representative result of 3 independent replicates were presented, unless the biological replicates were noted as being more than 3. Statistical analyses were performed using GraphPad Prism. For comparison of any two data groups of different samples, P values were calculated by two-tail Mann-Whitney U Test. For comparison of multiple parallel data groups, P values were calculated by one-way ANOVA with Bonferroni’s multiple comparisons test. For comparison of two paired data groups using the same samples in EM (PXo immunogold labeling enrichment analysis) or Pi imaging (before and after Pi addition), P values were calculated by Wilcoxon signed rank test. RT-qPCR data were analyzed by two-tailed Welch’s t test. Single asterisk (*) indicates a P value that is more than 0.01 but less than 0.05. Double asterisks (**) label a P value that is more than 0.001 but less than 0.01. Triple asterisks (***) label a P value that is more than 0.0001 but less than 0.001. Quadruple asterisks (****) label a P value that is less than 0.0001. The P value of 0.05 or more is labeled as “not significant” (n.s.). No particular method was used to determine whether the data met assumptions of the statistical approach. Sample sizes, determined empirically, are listed in the figure legends.
Extended Data
Extended Data Figure 1. Related to Figure 1. Characterization of Pi starvation and PXo knockdown.
a, b, pH3 staining of midguts fed 7d normal or PFA food. c, d, pH3 staining of midguts fed 9d CDF containing standard (100%) or 10% Pi. e, RT-qPCR measurement of MFS10 knockdown in the midgut when RNAi (VDRC line) is expressed 5d ubiquitously. The representative results with N=3 technical replicates are presented. p=0.0217. f, g, Midguts with 2d induced H2B-RFP expression in ECs, followed by 9d on normal or PFA food. h, i, j, k, Apoptag staining of midguts expressing Luc RNAi or PXo RNAi in ECs for 7d, with normal food (h, k), PFA, or the last 2d on Bleo. l, m, pH3 staining of midguts expressing Luc RNAi or PXo RNAi in ECs for 7d. n, o, pH3 staining and r, mitosis quantification of midguts with PXo RNAi (VDRC line) expression in ECs for 7d. N=8 (Ctrlw), 9 (PXo-iv). P=0.0193. p, q, pH3 staining of midguts expressing Luc RNAi or PXo RNAi in progenitors for 8d. s, Mitosis of midguts with PXo RNAi (NIG) expression in ECs for 9d. N=12 (Ctrlw), 15 (PXo-iN). P=7.94E-6. t, Mitosis of midguts expressing Luc RNAi or PXo RNAi alone, or together with p35 in progenitors for 9d, with or without the last 2d on Bleo. N=14 (Luc-i Normal, Luc-i p35, PXo-i p35), 13 (PXo-i Normal, Luc-i Bleo, PXo-i Bleo). P values from left to right: 9.97E-8, 3.00E-3, 1.92E-7. u, Mitosis of midguts with or without PXo RNAi (NIG) expression in progenitors for 8d, fed normal food (P=5.78E-5) or 2d Bleo (P=0.0237). From left to right: N=14, 13, 8, 12. v, Mitosis of midguts expressing GFP or p35 alone, or together with PXo RNAi in ECs for 9d. From left to right: N=12, 10, 12, 14; P=3.09E-6, 5.05E-3, 2.07E-7. w, Mitosis of midguts expressing Luc RNAi or PXo RNAi in progenitors, and fed normal, PFA, or Pi food for 7d. From left to right: N=8, 9, 8, 7, 8, 9; P=0.0132, 1.00, 1.40E-3, 1.18E-3, 1.00. x, Mitosis of midguts with or without PXo-HA expression in ECs for 8d, fed normal food or 2d Bleo. From left to right: N=12, 12, 13, 13; P=3.85E-7, 0.456, 3.85E-7. Data are mean ± SEM. P values are from two-tailed Welch’s t test (e), two-tailed Mann-Whitney u test (r, s, t, u, v, x, between Luc-i and PXo-i Normal in w) or one-way ANOVA with Bonferroni’s multiple comparison test (w). Arrowheads highlight pH3+ examples (a-d, l-q). Scale bars, 50 μm.
Extended Data Figure 2. Related to Figure 1. Characterization of PXo expression and phenotype in ISC/EB lineage.
a, PXo genomic locus and target regions of reagents in this study, including 3 RNAi lines (from NIG, VDRC, or BDSC, as labeled by dashed squares) and 3 pairs of RT-qPCR primers (P1, P2, P3), a Gal4 knock-in allele, a 2xHA tag knock-in, and an insertional mutation (PL48). b, RT-qPCR measurement of PXo knockdown efficiency of three PXo RNAi lines expressed ubiquitously in the midgut for 5d. Luc RNAi was the control for PXo RNAi from BDSC, Ctrlv was the control for PXo RNAi (VDRC), Ctrlw was the control for PXo RNAi (NIG). The representative results with N=3 technical replicates are presented. P values from left to right: 1.52E-3, 0.0305, 2.52E-4, 0.0236, 2.61E-3, 9.74E-3. c, RT-qPCR measurement of PXo expression in heterozygous midguts carrying one PXoPL48 mutant allele or its wild type revertant allele PXorev. The representative results with N=3 technical replicates are presented. P values from left to right: 0.0162, 0.0405. d, PXoGal4-driven GFP co-staining with esg-lacZ. The single GFP channel is presented on the right. Red, yellow, white arrowheads mark examples of progenitor, EC, EE, respectively. e, Anti-PXo immunoblot of S2R+ cell lysates expressing GFP or GFP-PXo. Tubulin was the loading control. Gel source data in Supplementary Fig. 1e. f, g, Anti-PXo staining of midguts with or without 5d ubiquitous PXo RNAi (NIG line) expression. h, Midguts with endogenous PXo tagged by 2 copies of HA epitope (PXo2xHA) were co-stained with anti-HA and anti-PXo antibodies. A magnified view of the highlighted region is presented in (h’). The separate channels of PXo and HA stainings are shown on the right. i, j, Midguts expressing GFP in adult ISCs/EBs and their progenies (i.e. the ISC/EB lineage) were fed 10d normal food or PFA and stained for EC marker Pdm1. k, l, m, n, o, p, Midguts expressing Luc RNAi or PXo RNAi in the ISC/EB lineage (labeled by GFP expression) for 10d were stained for Pdm1, EE marker Pros, and apoptosis marker cleaved caspase 3 (CCasp3). q, r, s, t, Pdm1 or Pros staining of midguts with GFP+ MARCM clones derived from wild type (N=135 clones) or PXoPL48 mutant progenitors (N=150) 10d after clone induction (dpi). Cell number per clone is quantified in (u). The PXorev allele generated by PBase-mediated precise excision of the inserted piggyBac transposon from mutant PXoPL48 allele was used as an additional control (N=134). P<1E-14 comparing PXoPL48 mutant versus Ctrl or PXorev wild type groups. v, Mitosis quantification of midguts expressing 8d Luc RNAi versus PXo RNAi in EEs, with normal food (P=0.686) or 2d Bleo (P=0.0179). N=10 (Luc-i Normal), 12 (other groups). w, Mitosis of midguts expressing Luc RNAi or PXo RNAi in ISCs for 9d, with normal food (P=0.771) or 2d Bleo (P=6.50E-4). N=10 per group. Data are mean ± SEM. P values are calculated from two-tailed Welch’s t test (b, c) or two-tailed Mann-Whitney u test (u, v, w). The single red channels are presented in grayscale below merged images (i-t). White arrowheads highlight examples of traced cell differentiation. Scale bars, 50 μm (d, h, i-t), 10 μm (f, g, h’).
Extended Data Figure 3. Related to Figure 2. Further analysis of PXo localization.
a, b, c, d, e, f, g, GFP staining of different organs from adult flies with ubiquitous expression of GFP-PXo for 5d. h, i, j, k, l, m, n, o, Co-staining of ubiquitously expressed GFP-PXo with various markers in the midgut, including Cnx99a (ER), RFP-KDEL (ER lumen), Hrs (early endosome), Rab7 (late endosome), ATP5A (mitochondria), GMAP (cis-Golgi), GalT-TagRFP (trans-Golgi), and WGA (glycans). 3D view is presented. p, q, P-Cho staining of midguts with ubiquitously expression of GFP-PXo for 5d and collected 2h post P-Cho injection. A non-injection group was included as the negative control. 3D view of confocal image is presented. r, Co-staining of ubiquitously expressed GFP-PXo with Avidin (ex vivo incubation). 3D view of confocal image is presented. s, Co-localization analysis with the quantification of Mander’s coefficient between GFP-PXo and Nile Red, ManII-TagRFP, or GalT-TagRFP. N=4 midguts per group. P values from bottom to top: 1.16E-10, 1.14E-10. t, Shortest distance between each labeled PXo body and P-Cho (2h post injection), dextran (feeding), or avidin (feeding). N=185 (P-Cho group), 149 (dextran), 122 (avidin) PXo bodies from 4 midguts were analyzed. P<1E-14. Data are mean ± SEM. P values are from one-way ANOVA with Bonferroni’s multiple comparison test (s, t). Separate green and red channels are presented below merged images (h-r). Scale bars, 50 μm (a-g), 10 μm (h-r).
Extended Data Figure 4. Related to Figure 2. Analysis of the dependency of PXo bodies on other canonical organelles.
a, EM of midgut frozen section with immunogold-labeled GFP-PXo (examples highlighted with arrowheads) expressed in progenitors. b, Midgut EM shows unlabeled PXo bodies mainly in ECs (examples highlighted with arrowheads). A progenitor cell, as circled out by dashed line, can be distinguished from ECs, based on its basal localization, high electron density, lack of microvilli, and lack of mitochondria (“mt”) cristae. A magnified view of the squared region, as presented in (b’), shows a PXo body in the progenitor. c, Midgut EM distinguishes the membranous PXo bodies (highlighted with arrowhead) from lipid droplets (“LD”). d, e, EM shows PXo body fragmentation in midguts with ubiquitous γCOP knockdown for 7d. f, g, h, i, j, HA staining of midguts expressing PXo-HA together with Luc RNAi, Sar1 RNAi, Arf1 RNAi, γCOP RNAi, or Pmm2 RNAi in ECs for 7d. Lethal giant larvae (Lgl) marks cell border. k, l, m, n, o, p, EM showing PXo bodies in ECs expressing Luc RNAi, Pink RNAi, Parkin RNAi, Lamp1 RNAi, or Abca RNAi for 7d, with PXo body size quantification in (q). N=110 (Abca-i1) or 120 (other groups). P values from bottom to top: 1.00, 0.747, 0.0162, 1.00, 1.00. r, s, t, u, EM showing PXo bodies in ECs expressing Luc RNAi (N=70), Rab7 RNAi (N=60), or Rab11 RNAi (line #1: N=70; line #2: N=80) for 3d, with quantification in (v). P values from bottom to top: 1.00, 0.490, 1.00. Data are mean ± SEM. P values are calculated from one-way ANOVA with Bonferroni’s multiple comparison test. Scale bars, 1 μm (a, b’, c-e, k-p, r-u), 10 μm (b), 50 μm (f-j).
Extended Data Figure 5. Related to Figure 3. PXo structure and live imaging for cytosolic Pi.
a, AlphaFold structure prediction of rice PHO1-2, with color-scaled visualization of the prediction confidence score. The pairwise structure alignment between PXo and PHO1-2 was shown on the right, with aligned regions superposed on one another and highlighted in color. The summary of amino acid sequence alignment was shown at the bottom, with aligned regions highlighted in color. b, A single Z-stack of confocal image of midguts expressing PXo-HA and FLIPPi together in the ECs for 7d. Separate channels of HA and YFP (FLIPPi) stainings are presented on the right of merged images. c, Co-localization analysis with the quantification of the PXo-FLIPPi and FLIPPi-PXo Mander’s coefficients. N=9 per group. d, e, Kinetics of the average FRET ratio (cpVenus/CFP) in the midguts expressing FLIPPi ubiquitously (tubts) or specifically in ECs (Myo1Ats), progenitors (esgts), ISCs (Dlts) or EBs (Su(H)ts) for 3-7 days. The imaging videos were captured for ~10 min. The time points adding an extra final concentration of 30 mM Pi (~300s, using sodium phosphate or potassium phosphate) to the AHL imaging buffer is indicated by black arrows. Note that a new steady cytosolic Pi level is reached ~5 min after the addition of extra Pi. f, Color-scaled visualization of FRET ratios in the posterior midgut with ubiquitous FLIPPi expression for 7d. The same area was imaged again 10 min after the addition of 30 mM Pi (g). h, FRET ratio quantification of midguts with ubiquitous FLIPPi expression for 7d on normal food before or after 30 mM Pi addition to the imaging buffer (N=9), or with the last 4d on PFA food (N=7). P values from bottom to top: 3.91E-3, 3.50E-4. i, j, k, FRET ratio visualization and quantification of ECs expressing FLIPPi alone or FLIPPi together with MFS10 RNAi for 7d, before or 10 min after 30 mM Pi addition. N=11 per group. P values from bottom to top: 9.77E-4, 9.77E-4, 0.0173, 0.0192. l, m, n, FRET ratio visualization and quantification of midguts expressing FLIPPi alone (by crossing to Ctrlw, N=10) or FLIPPi together with PXo RNAi (NIG line, N=11) in ECs for 6d. P values from bottom to top: 1.95E-3, 4.03E-4. o, p, FRET ratios visualization of progenitors expressing FLIPPi alone or together with PXo-HA for 7d. q, FRET ratio quantification of midguts expressing FLIPPi alone (N=9), FLIPPi together with PXo-HA (N=9), or FLIPPi together with PXo RNAi (NIG line, N=11) for 7d, before or after Pi addition. P values from bottom to top: 0.0210, 0.936, 0.0114, 0.778. Data are mean ± SEM. P values are from Wilcoxon signed rank test for same sample comparison before and after Pi addition in (h, k, n), two-tailed Mann-Whitney u test between different samples (h, k, n) or one-way ANOVA with Bonferroni’s multiple comparison test (q). Scale bars, 10 μm (b), 200 μm (f, g, i, j, l, m, o, p).
Extended Data Figure 6. Related to Figure 4. EM analysis for the dependency of PXo bodies on Pi availability and PXo expression.
a, b, EM of wild type (genotype: OreR) midguts with or without PFA feeding for 4d, along with magnified views of highlighted regions in (a’, b’) and PXo body size quantification in (c). N=17 PXo bodies were analyzed per group. P=1.28E-5. d, e, EM of midguts with or without ubiquitous MFS10 RNAi expression for 5d, along with a magnified view of highlighted regions in (d’, e’) and PXo body size quantification in (f). N=91 (Ctrlv), 89 (MFS10-iv). P=1.38E-8. g, h, EM of midguts with or without ubiquitous PXo RNAi (NIG line) expression for 5d, along with magnified views of highlighted regions in (g’, h’) and PXo body size quantification in (i). N=40 PXo bodies per group. P=1.30E-9. Data are mean ± SEM. P values are from two-tailed Mann-Whitney u test (c, f, i). Scale bars, 4 μm (a, b, d, e, g, h), 1 μm (a’, b’, d’, e’, g’, h’).
Extended Data Figure 7. Related to Figure 4. Mechanistic analysis of Pi-sensitivity for PXo and PXo bodies.
a, b, c, Midguts with GFP-PXo expression in ECs (driven by Myo1AGal4), with the last 4d on normal, PFA, or Pi food before dissection. d, e, f, Midguts with ubiquitous GFP-PXo expression for 7d, with the last 4d on CDF containing standard (100%), 20%, or 10% Pi. The staining for junctional protein Discs large (Dlg) marks cell borders. g, h, i, j, Anti-PXo staining of midguts with ubiquitous expression of GFP-Lamp1 or GFP-Atg8 (autophagosome marker) under normal feeding (g, h) or 4d PFA feeding conditions (i, j). A single Z-stack of confocal image is presented. Separate green and red channels are presented below merged images. Arrowheads highlight examples of co-localization. k, l, m, n, S2R+ cells expressing GFP-PXo with or without 24 hrs treatment of PFA, PFA together with BafA1, or PFA together with MG132. o, p, Midguts ubiquitously expressing GFP-PXoΔSPX for 7d, with the last 4d on normal or PFA food, were stained for GFP and Dlg. q, Immunoblot of midgut lysates with ubiquitous expression of GFP-PXoΔSPX for 7d, with or without the last 4d on PFA. Tubulin was the loading control. Quantification of relative normalized anti-GFP IB intensity is presented. Gel source data in Supplementary Fig. 1f. Scale bars, 50 μm (a-f, o, p), 10 μm (g-n).
Extended Data Figure 8. Related to Figure 5. Further examination of PXo’s relevance to intestinal barrier integrity or lipid metabolism.
a, b, Smurf assay to evaluate the barrier function of midguts expressing Luc RNAi, PXo RNAi ubiquitously for 10 days. Prolonged Tsp2A RNAi expression was used as a positive control. c, d, Representation of different lipid categories in the previously characterized lipidomes of Drosophila larval midguts or adult whole bodies. e, f, g, h, GFP staining and PXo density quantification of midguts with ubiquitous GFP-PXo expression for 7d, with the last 3d on normal food (N=17), or food containing additional 1% (N=13, P=0.0393) or 5% PC (N=13, P=3.40E-8). Data are mean ± SEM. P values are from one-way ANOVA with Bonferroni’s multiple comparison test. Scale bars, 50 μm.
Extended Data Figure 9. Related to Figure 5. PXo body extraction and purification methods.
a, A centrifugation tube with midgut lysate OptiPrep gradient after ultracentrifugation, alongside with the cartoon created from Biorender depicting 14 gradient layers (fractions). b, c, d, e, Merged bright field and GFP fluorescent images of microscopic slides prepared from 15 μl aliquots of separated Layers 8-11. The refraction index (RI) for each Layer is also measured. f, RI measurement of 10%-30% serial concentrations of OptiPrep solutions, along with their calculated density. g, EM of a dissociated PXo body alongside a mitochondria (mt) from combined Layers 9-10. h, IB of the same volume of lysates from 14 separate Layers for GFP-PXo and ATP5A. Gel source data in Supplementary Fig. 1g. i, j, k, l, m, n, ATP5A and GMAP staining of midgut homogenate before (Input) and after immunoprecipitation (IP) of nanobody-conjugated Chromotek-GFP-Trap agarose beads, along with the flowthrough (Supernatant). o, p, Whole midguts with ubiquitous GFP-PXo expression for 5d, with the last 2d on normal food or PFA food. Scale bars, 50 μm (b, c, d, e), 1 μm (g), 10 μm (i, j, k, l, m, n), 1 mm (o, p).
Extended Data Figure 10. Related to Figure 5. Validation of identified PXo body proteins.
a, α-Spec staining of midguts with ubiquitous expression of GFP-PXo. A single Z-stack of confocal image is presented, with separate green and red channels presented below merged images and white arrowheads highlighting examples of co-localization. b, c, d, e, Co-staining of GFP-PXo with hts-mCherry, SERCA-Tomato, Ogdh-Flag, or Idh-Flag ubiquitously expressed in the midgut. A single Z-stack of confocal image is presented, with separate green and red channels presented below merged images and white arrowheads highlighting examples of co-localization. f, g, h, Co-staining of EC-expressed PXo-HA with Idh3a-GFP expressed in a fosmid (f), or endogenously tagged GFP-Treh (g) or Ance-GFP (h). A single Z-stack of confocal image is presented, with separate green and red channels presented below merged images and white arrowheads highlighting examples of co-localization. i, j, Co-staining of PXo-HA and GFP-Vha55 or Mipp1-GFP expressed in ECs. A single Z-stack of confocal image is presented, with separate green and red channels presented below merged images and white arrowheads highlighting examples of co-localization. Scale bars, 10 μm.
Extended Data Figure 11. Related to Figure 6. Comparison of how PXo affects Cka expression in ECs and in progenitors.
a, b, Flag-Cka staining of midguts expressing Luc RNAi or PXo RNAi in progenitors for 9d. A magnified view of regions highlighted with white dashed squares is presented in (a’, b’). The red channel images of anti-Flag staining are in grayscale below the merged images. White arrowheads highlight examples of progenitors that are differentiating towards ECs, as judged by their extended morphology, and enlarged nuclei size (b, b’). c, d, e, f, Midguts expressing BFP-Cka together with Luc RNAi or PXo RNAi in ECs for 4d or 8d. g, h, Midguts expressing BFP-Cka together with Luc RNAi or PXo RNAi in progenitors for 5d. The single-channel images of BFP-Cka fluorescence are presented in grayscale below merged images. Scale bars, 50 μm (a, b, c, d, e, f, g, h), 10 μm (a’, b’).
Extended Data Figure 12. Related to Figure 7. STRIPAK and JNK signaling mediate the hyperproliferation phenotype caused by PXo knockdown in ECs and in progenitors.
a, b, Puc-lacZ staining of midguts expressing Luc RNAi or PXo RNAi in progenitors for 7d. c, d, e, Midguts expressing Luc RNAi or PXo RNAi in ECs for 7d were stained for phosphorylated p38 (p-p38) and the cell border marker Dlg. Midguts fed with Bleo food for 2d were included as a positive control. f, Mitosis of midguts expressing PXo RNAi alone (N=14) or PXo RNAi together with Cka RNAi (VDRC line, N=15), Mob4 RNAi (VDRC, N=14), or Strip RNAi (VDRC, N=14) in ECs for 8d. P values from bottom to top: 1.50E-6, 3.60E-6, 8.08E-6. g, Mitosis of midguts expressing PXo RNAi together with Luc RNAi (N=14), Strip RNAi (BDSC line, N=14), mts RNAi (BDSC, N=12), or Pp2A-29B RNAi (BDSC, N=14) in ECs for 8d. P values from bottom to top: 1.86E-9, 5.40E-10, 3.69E-11. h, Mitosis of midguts expressing PXo RNAi together with Luc RNAi, Cka RNAi (BDSC), Mob4 RNAi (2 different BDSC lines), or bsk RNAi in progenitors for 9d. From left to right: N=9, 10, 9, 11, 10; P=1.07E-12, 3,33E-10, 4.93E-13, 2,72E-12. i, Mitosis of midguts expressing PXo RNAi alone (N=12), or PXo RNAi together with Cka RNAi (VDRC line, N=12), Mob4 RNAi (VDRC, N=10), or Strip RNAi (VDRC, N=12) in progenitors for 9d. P values from bottom to top: 4.57E-9, 3.72E-6, 4.57E-9. j, Mitosis of midguts expressing PXo RNAi together with Luc RNAi (N=15), Strip RNAi (BDSC, N=15), mts RNAi (BDSC, N=14), or Pp2A-29B RNAi (BDSC, N=12) in progenitors for 9d. P values from bottom to top: 6.29E-6, 2.07E-8, 1.72E-7. Data are mean ± SEM. P values are from one-way ANOVA with Bonferroni’s multiple comparison test. Scale bars, 50 μm.
Supplementary Material
Acknowledgements
We thank Luis Rene Garcia for sharing the pLR364-cpFlippi-6.4 plasmid; Paula Montero Llopis and the Microscopy Resources on the North Quad core (MicRoN) at Harvard Medical School for imaging support; Electron Microscopy Facility at Harvard Medical School for EM support; Mass Spectrometry Core at Beth Israel Deaconess Medical Center for mass spectrometry support; Rich Binari, Patrick Jouandin, Li He, Justin Bosch, and Christians Villalta for technical assistance; Afroditi Petsakou, Li He, Bernard Mathey-Prevot, and Stephanie Ellis for comments on the manuscript. We thank Nicolas Buchon, Huaqi Jiang, Bruce Edgar, Steve Hou, Allison Bardin, Clive Wilson, Francesca Pignoni, Duojia Pan, and Tom Hays for sharing fly stocks; Xiaohang Yang and Cai Yu for sharing the Pdm1 antibody; Xi He and Maorong Chen for suggestions on biochemical experiments with PXo; He Huang and Fengsheng Li for advice on 18O stable isotope tracing analysis; Marina Schernthanner and Anita Gola for instructions on Imaris analysis. Susan Shao, Tom Rapoport, Sever Navdar, Jialing Wang, Corey Allard, and Nicholas Bellono for discussion. This work is supported by the National Institute of General Medical Sciences (GM067761), NIH 5P01CA120964-09, the STARR consortium, and HHMI. C.X. is supported by C. H. Li memorial fellowship, National Cancer Center fellowship, and Charles Revson fellowship. H.-W.T. is supported by the Human Frontier Science Program. N.P. Is an investigator of the HHMI.
Footnotes
Ethics declarations. The authors declare no competing interests.
Schematics
Schematics were prepared using Office 365 (Microsoft), BioRender (www.biorender.com) with publication permissions.
Data availability.
All data supporting the findings of this study are available within the Article and its Supplementary Information.
Code Availability
“PXo_body_area”: https://github.com/charles-xu-ru/image-analysis/blob/master/PXo_body_area
“PXo_size_violin”: https://github.com/charles-xu-ru/image-analysis/blob/master/PXo_size_violin
“FRET_ratios_movie”: https://github.com/charles-xu-ru/image-analysis/blob/master/FRET_ratios_movie
References
- 1.Qi W, Baldwin SA, Muench SP & Baker A Pi sensing and signalling: from prokaryotic to eukaryotic cells. Biochem Soc Trans 44, 766–773, doi: 10.1042/BST20160026 (2016). [DOI] [PubMed] [Google Scholar]
- 2.Banerjee S, Versaw WK & Garcia LR Imaging Cellular Inorganic Phosphate in Caenorhabditis elegans Using a Genetically Encoded FRET-Based Biosensor. PLoS One 10, e0141128, doi: 10.1371/journal.pone.0141128 (2015). [DOI] [PMC free article] [PubMed] [Google Scholar]
- 3.Hwang J & Pallas DC STRIPAK complexes: structure, biological function, and involvement in human diseases. Int J Biochem Cell Biol 47, 118–148, doi: 10.1016/j.biocel.2013.11.021 (2014). [DOI] [PMC free article] [PubMed] [Google Scholar]
- 4.Brown MR & Kornberg A Inorganic polyphosphate in the origin and survival of species. Proc Natl Acad Sci U S A 101, 16085–16087, doi: 10.1073/pnas.0406909101 (2004). [DOI] [PMC free article] [PubMed] [Google Scholar]
- 5.Liu TY et al. Identification of plant vacuolar transporters mediating phosphate storage. Nat Commun 7, 11095, doi: 10.1038/ncomms11095 (2016). [DOI] [PMC free article] [PubMed] [Google Scholar]
- 6.Rao NN, Gomez-Garcia MR & Kornberg A Inorganic polyphosphate: essential for growth and survival. Annu Rev Biochem 78, 605–647, doi: 10.1146/annurev.biochem.77.083007.093039 (2009). [DOI] [PubMed] [Google Scholar]
- 7.Tjellstrom H, Andersson MX, Larsson KE & Sandelius AS Membrane phospholipids as a phosphate reserve: the dynamic nature of phospholipid-to-digalactosyl diacylglycerol exchange in higher plants. Plant Cell Environ 31, 1388–1398, doi: 10.1111/j.1365-3040.2008.01851.x (2008). [DOI] [PubMed] [Google Scholar]
- 8.Bergwitz C et al. Roles of major facilitator superfamily transporters in phosphate response in Drosophila. PLoS One 7, e31730, doi: 10.1371/journal.pone.0031730 (2012). [DOI] [PMC free article] [PubMed] [Google Scholar]
- 9.Micchelli C & Perrimon N Evidence that stem cells reside in the adult Drosophila midgut epithelium. Nature 439, 475–479, doi: 10.1038/nature04371 (2006). [DOI] [PubMed] [Google Scholar]
- 10.Amcheslavsky A, Jiang J & Ip YT Tissue damage-induced intestinal stem cell division in Drosophila. Cell Stem Cell 4, 49–61, doi: 10.1016/j.stem.2008.10.016 (2009). [DOI] [PMC free article] [PubMed] [Google Scholar]
- 11.Xu C et al. An in vivo RNAi screen uncovers the role of AdoR signaling and adenosine deaminase in controlling intestinal stem cell activity. Proc Natl Acad Sci U S A 117, 464–471, doi: 10.1073/pnas.1900103117 (2020). [DOI] [PMC free article] [PubMed] [Google Scholar]
- 12.Wild R et al. Control of eukaryotic phosphate homeostasis by inositol polyphosphate sensor domains. Science 352, 986–990, doi: 10.1126/science.aad9858 (2016). [DOI] [PubMed] [Google Scholar]
- 13.Wege S et al. The EXS Domain of PHO1 Participates in the Response of Shoots to Phosphate Deficiency via a Root-to-Shoot Signal. Plant Physiol 170, 385–400, doi: 10.1104/pp.15.00975 (2016). [DOI] [PMC free article] [PubMed] [Google Scholar]
- 14.Hung RJ et al. A cell atlas of the adult Drosophila midgut. Proc Natl Acad Sci U S A 117, 1514–1523, doi: 10.1073/pnas.1916820117 (2020). [DOI] [PMC free article] [PubMed] [Google Scholar]
- 15.Zeng X, Chauhan C & Hou SX Characterization of midgut stem cell- and enteroblast-specific Gal4 lines in drosophila. Genesis 48, 607–611, doi: 10.1002/dvg.20661 (2010). [DOI] [PMC free article] [PubMed] [Google Scholar]
- 16.Arpat AB et al. Functional expression of PHO1 to the Golgi and trans-Golgi network and its role in export of inorganic phosphate. Plant J 71, 479–491, doi: 10.1111/j.1365-313X.2012.05004.x (2012). [DOI] [PubMed] [Google Scholar]
- 17.Xu C, Ericsson M & Perrimon N Understanding cellular signaling and systems biology with precision: A perspective from ultrastructure and organelle studies in the Drosophila midgut. Curr Opin Syst Biol 11, 24–31, doi: 10.1016/j.coisb.2018.07.003 (2018). [DOI] [PMC free article] [PubMed] [Google Scholar]
- 18.Rodrigues FF & Harris TJC Key roles of Arf small G proteins and biosynthetic trafficking for animal development. Small GTPases 10, 403–410, doi: 10.1080/21541248.2017.1304854 (2019). [DOI] [PMC free article] [PubMed] [Google Scholar]
- 19.Tsarouhas V et al. Sequential pulses of apical epithelial secretion and endocytosis drive airway maturation in Drosophila. Dev Cell 13, 214–225, doi: 10.1016/j.devcel.2007.06.008 (2007). [DOI] [PubMed] [Google Scholar]
- 20.Wilfling F et al. Arf1/COPI machinery acts directly on lipid droplets and enables their connection to the ER for protein targeting. Elife 3, e01607, doi: 10.7554/eLife.01607 (2014). [DOI] [PMC free article] [PubMed] [Google Scholar]
- 21.Jayaram SA et al. COPI vesicle transport is a common requirement for tube expansion in Drosophila. PLoS One 3, e1964, doi: 10.1371/journal.pone.0001964 (2008). [DOI] [PMC free article] [PubMed] [Google Scholar]
- 22.Parkinson WM et al. Synaptic roles for phosphomannomutase type 2 in a new Drosophila congenital disorder of glycosylation disease model. Dis Model Mech 9, 513–527, doi: 10.1242/dmm.022939 (2016). [DOI] [PMC free article] [PubMed] [Google Scholar]
- 23.Ladyzhets S et al. Self-limiting stem-cell niche signaling through degradation of a stem-cell receptor. PLoS Biol 18, e3001003, doi: 10.1371/journal.pbio.3001003 (2020). [DOI] [PMC free article] [PubMed] [Google Scholar]
- 24.Koehler CL, Perkins GA, Ellisman MH & Jones DL Pink1 and Parkin regulate Drosophila intestinal stem cell proliferation during stress and aging. J Cell Biol 216, 2315–2327, doi: 10.1083/jcb.201610036 (2017). [DOI] [PMC free article] [PubMed] [Google Scholar]
- 25.Xu C et al. The Septate Junction Protein Tsp2A Restricts Intestinal Stem Cell Activity via Endocytic Regulation of aPKC and Hippo Signaling. Cell Rep 26, 670–688 e676, doi: 10.1016/j.celrep.2018.12.079 (2019). [DOI] [PMC free article] [PubMed] [Google Scholar]
- 26.Corrigan L et al. BMP-regulated exosomes from Drosophila male reproductive glands reprogram female behavior. J Cell Biol 206, 671–688, doi: 10.1083/jcb.201401072 (2014). [DOI] [PMC free article] [PubMed] [Google Scholar]
- 27.Jumper J et al. Highly accurate protein structure prediction with AlphaFold. Nature 596, 583–589, doi: 10.1038/s41586-021-03819-2 (2021). [DOI] [PMC free article] [PubMed] [Google Scholar]
- 28.Giovannini D, Touhami J, Charnet P, Sitbon M & Battini JL Inorganic phosphate export by the retrovirus receptor XPR1 in metazoans. Cell Rep 3, 1866–1873, doi: 10.1016/j.celrep.2013.05.035 (2013). [DOI] [PubMed] [Google Scholar]
- 29.Ma B et al. A plasma membrane transporter coordinates phosphate reallocation and grain filling in cereals. Nat Genet 53, 906–915, doi: 10.1038/s41588-021-00855-6 (2021). [DOI] [PubMed] [Google Scholar]
- 30.Balis JU & Conen PE The Role of Alveolar Inclusion Bodies in the Developing Lung. Lab Invest 13, 1215–1229 (1964). [PubMed] [Google Scholar]
- 31.Suzuki H & Kurosumi K Lamellar granules and keratohyalin granules in the epidermal keratinocytes, with special reference to their origin, fate and function. J Electron Microsc (Tokyo) 21, 285–292 (1972). [PubMed] [Google Scholar]
- 32.Osanai K et al. Pulmonary surfactant transport in alveolar type II cells. Respirology 11 Suppl, S70–73, doi: 10.1111/j.1440-1843.2006.00813.x (2006). [DOI] [PubMed] [Google Scholar]
- 33.Tarutani M et al. GPHR-dependent functions of the Golgi apparatus are essential for the formation of lamellar granules and the skin barrier. J Invest Dermatol 132, 2019–2025, doi: 10.1038/jid.2012.100 (2012). [DOI] [PubMed] [Google Scholar]
- 34.Schmitz G & Muller G Structure and function of lamellar bodies, lipid-protein complexes involved in storage and secretion of cellular lipids. J Lipid Res 32, 1539–1570 (1991). [PubMed] [Google Scholar]
- 35.Dillard KJ et al. Recessive missense LAMP3 variant associated with defect in lamellar body biogenesis and fatal neonatal interstitial lung disease in dogs. PLoS Genet 16, e1008651, doi: 10.1371/journal.pgen.1008651 (2020). [DOI] [PMC free article] [PubMed] [Google Scholar]
- 36.Cheong N et al. ABCA3 is critical for lamellar body biogenesis in vivo. J Biol Chem 282, 23811–23817, doi: 10.1074/jbc.M703927200 (2007). [DOI] [PubMed] [Google Scholar]
- 37.Gilder H, Haschemeyer RH, Fairclough GF Jr. & Mynarcik DC Isolation and characterization of lamellar body material from rat lung homogenates by continuous linear sucrose gradients. J Lipid Res 22, 1277–1285 (1981). [PubMed] [Google Scholar]
- 38.Ridsdale R, Na CL, Xu Y, Greis KD & Weaver T Comparative proteomic analysis of lung lamellar bodies and lysosome-related organelles. PLoS One 6, e16482, doi: 10.1371/journal.pone.0016482 (2011). [DOI] [PMC free article] [PubMed] [Google Scholar]
- 39.Wang P et al. Proteomic analysis of lamellar bodies isolated from rat lungs. BMC Cell Biol 9, 34, doi: 10.1186/1471-2121-9-34 (2008). [DOI] [PMC free article] [PubMed] [Google Scholar]
- 40.Raymond AA et al. Lamellar bodies of human epidermis: proteomics characterization by high throughput mass spectrometry and possible involvement of CLIP-170 in their trafficking/secretion. Mol Cell Proteomics 7, 2151–2175, doi: 10.1074/mcp.M700334-MCP200 (2008). [DOI] [PubMed] [Google Scholar]
- 41.Chintagari NR et al. Effect of cholesterol depletion on exocytosis of alveolar type II cells. Am J Respir Cell Mol Biol 34, 677–687, doi: 10.1165/rcmb.2005-0418OC (2006). [DOI] [PMC free article] [PubMed] [Google Scholar]
- 42.Carvalho M et al. Effects of diet and development on the Drosophila lipidome. Mol Syst Biol 8, 600, doi: 10.1038/msb.2012.29 (2012). [DOI] [PMC free article] [PubMed] [Google Scholar]
- 43.Guan XL et al. Biochemical membrane lipidomics during Drosophila development. Dev Cell 24, 98–111, doi: 10.1016/j.devcel.2012.11.012 (2013). [DOI] [PubMed] [Google Scholar]
- 44.Grayson S et al. Lamellar body-enriched fractions from neonatal mice: preparative techniques and partial characterization. J Invest Dermatol 85, 289–294, doi: 10.1111/1523-1747.ep12276826 (1985). [DOI] [PubMed] [Google Scholar]
- 45.Giot L et al. A protein interaction map of Drosophila melanogaster. Science 302, 1727–1736, doi: 10.1126/science.1090289 (2003). [DOI] [PubMed] [Google Scholar]
- 46.Jiang H et al. Cytokine/Jak/Stat signaling mediates regeneration and homeostasis in the Drosophila midgut. Cell 137, 1343–1355, doi: 10.1016/j.cell.2009.05.014 (2009). [DOI] [PMC free article] [PubMed] [Google Scholar]
- 47.Martin-Blanco E et al. puckered encodes a phosphatase that mediates a feedback loop regulating JNK activity during dorsal closure in Drosophila. Genes Dev 12, 557–570, doi: 10.1101/gad.12.4.557 (1998). [DOI] [PMC free article] [PubMed] [Google Scholar]
- 48.Patel PH et al. Damage sensing by a Nox-Ask1-MKK3-p38 signaling pathway mediates regeneration in the adult Drosophila midgut. Nat Commun 10, 4365, doi: 10.1038/s41467-019-12336-w (2019). [DOI] [PMC free article] [PubMed] [Google Scholar]
- 49.Eichhorn PJ, Creyghton MP, Wilhelmsen K, van Dam H & Bernards R A RNA interference screen identifies the protein phosphatase 2A subunit PR55gamma as a stress-sensitive inhibitor of c-SRC. PLoS Genet 3, e218, doi: 10.1371/journal.pgen.0030218 (2007). [DOI] [PMC free article] [PubMed] [Google Scholar]
- 50.Michigami T, Kawai M, Yamazaki M & Ozono K Phosphate as a Signaling Molecule and Its Sensing Mechanism. Physiol Rev 98, 2317–2348, doi: 10.1152/physrev.00022.2017 (2018). [DOI] [PubMed] [Google Scholar]
- 51.Hay BA, Wolff T & Rubin GM Expression of baculovirus P35 prevents cell death in Drosophila. Development 120, 2121–2129, doi: 10.1242/dev.120.8.2121 (1994). [DOI] [PubMed] [Google Scholar]
- 52.Cook MS et al. Neutral Competition for Drosophila Follicle and Cyst Stem Cell Niches Requires Vesicle Trafficking Genes. Genetics 206, 1417–1428, doi: 10.1534/genetics.117.201202 (2017). [DOI] [PMC free article] [PubMed] [Google Scholar]
- 53.Lee DM, Rodrigues FF, Yu CG, Swan M & Harris TJ PH Domain-Arf G Protein Interactions Localize the Arf-GEF Steppke for Cleavage Furrow Regulation in Drosophila. PLoS One 10, e0142562, doi: 10.1371/journal.pone.0142562 (2015). [DOI] [PMC free article] [PubMed] [Google Scholar]
- 54.Ueoka I et al. Novel genetic link between the ATP-binding cassette subfamily A gene and hippo gene in Drosophila. Exp Cell Res 386, 111733, doi: 10.1016/j.yexcr.2019.111733 (2020). [DOI] [PubMed] [Google Scholar]
- 55.Moulton MJ et al. Neuronal ROS-induced glial lipid droplet formation is altered by loss of Alzheimer's disease-associated genes. Proc Natl Acad Sci U S A 118, doi: 10.1073/pnas.2112095118 (2021). [DOI] [PMC free article] [PubMed] [Google Scholar]
- 56.Jiang H & Edgar BA EGFR signaling regulates the proliferation of Drosophila adult midgut progenitors. Development 136, 483–493, doi: 10.1242/dev.026955 (2009). [DOI] [PMC free article] [PubMed] [Google Scholar]
- 57.Thibault ST et al. A complementary transposon tool kit for Drosophila melanogaster using P and piggyBac. Nat Genet 36, 283–287, doi: 10.1038/ng1314 (2004). [DOI] [PubMed] [Google Scholar]
- 58.Wu JS & Luo L A protocol for mosaic analysis with a repressible cell marker (MARCM) in Drosophila. Nat Protoc 1, 2583–2589, doi: 10.1038/nprot.2006.320 (2006). [DOI] [PubMed] [Google Scholar]
- 59.Tang HW et al. The TORC1-Regulated CPA Complex Rewires an RNA Processing Network to Drive Autophagy and Metabolic Reprogramming. Cell Metab 27, 1040–1054 e1048, doi: 10.1016/j.cmet.2018.02.023 (2018). [DOI] [PMC free article] [PubMed] [Google Scholar]
- 60.Mariyappa D et al. A novel transposable element-based authentication protocol for Drosophila cell lines. G3 (Bethesda) 12, doi: 10.1093/g3journal/jkab403 (2022). [DOI] [PMC free article] [PubMed] [Google Scholar]
- 61.Piper MD et al. A holidic medium for Drosophila melanogaster. Nat Methods 11, 100–105, doi: 10.1038/nmeth.2731 (2014). [DOI] [PMC free article] [PubMed] [Google Scholar]
- 62.Field CM, Oegema K, Zheng Y, Mitchison TJ & Walczak CE Purification of cytoskeletal proteins using peptide antibodies. Methods Enzymol 298, 525–541, doi: 10.1016/s0076-6879(98)98043-0 (1998). [DOI] [PubMed] [Google Scholar]
- 63.Ciesielski HM et al. Erebosis, a new cell death mechanism during homeostatic turnover of gut enterocytes. PLoS Biol 20, e3001586, doi: 10.1371/journal.pbio.3001586 (2022). [DOI] [PMC free article] [PubMed] [Google Scholar]
- 64.Ren C, Finkel SE & Tower J Conditional inhibition of autophagy genes in adult Drosophila impairs immunity without compromising longevity. Exp Gerontol 44, 228–235, doi: 10.1016/j.exger.2008.10.002 (2009). [DOI] [PMC free article] [PubMed] [Google Scholar]
- 65.Jao CY, Roth M, Welti R & Salic A Metabolic labeling and direct imaging of choline phospholipids in vivo. Proc Natl Acad Sci U S A 106, 15332–15337, doi: 10.1073/pnas.0907864106 (2009). [DOI] [PMC free article] [PubMed] [Google Scholar]
- 66.Wilcockson SG & Ashe HL Drosophila Ovarian Germline Stem Cell Cytocensor Projections Dynamically Receive and Attenuate BMP Signaling. Dev Cell 50, 296–312 e295, doi: 10.1016/j.devcel.2019.05.020 (2019). [DOI] [PMC free article] [PubMed] [Google Scholar]
- 67.Shravage BV, Hill JH, Powers CM, Wu L & Baehrecke EH Atg6 is required for multiple vesicle trafficking pathways and hematopoiesis in Drosophila. Development 140, 1321–1329, doi: 10.1242/dev.089490 (2013). [DOI] [PMC free article] [PubMed] [Google Scholar]
- 68.Varadi M et al. AlphaFold Protein Structure Database: massively expanding the structural coverage of protein-sequence space with high-accuracy models. Nucleic Acids Res 50, D439–D444, doi: 10.1093/nar/gkab1061 (2022). [DOI] [PMC free article] [PubMed] [Google Scholar]
- 69.Li Z, Jaroszewski L, Iyer M, Sedova M & Godzik A FATCAT 2.0: towards a better understanding of the structural diversity of proteins. Nucleic Acids Res 48, W60–W64, doi: 10.1093/nar/gkaa443 (2020). [DOI] [PMC free article] [PubMed] [Google Scholar]
- 70.Abu-Remaileh M et al. Lysosomal metabolomics reveals V-ATPase- and mTOR-dependent regulation of amino acid efflux from lysosomes. Science 358, 807–813, doi: 10.1126/science.aan6298 (2017). [DOI] [PMC free article] [PubMed] [Google Scholar]
- 71.Huang da W, Sherman BT & Lempicki RA Systematic and integrative analysis of large gene lists using DAVID bioinformatics resources. Nat Protoc 4, 44–57, doi: 10.1038/nprot.2008.211 (2009). [DOI] [PubMed] [Google Scholar]
- 72.Huang da W, Sherman BT & Lempicki RA Bioinformatics enrichment tools: paths toward the comprehensive functional analysis of large gene lists. Nucleic Acids Res 37, 1–13, doi: 10.1093/nar/gkn923 (2009). [DOI] [PMC free article] [PubMed] [Google Scholar]
- 73.Hu Y et al. An integrative approach to ortholog prediction for disease-focused and other functional studies. BMC Bioinformatics 12, 357, doi: 10.1186/1471-2105-12-357 (2011). [DOI] [PMC free article] [PubMed] [Google Scholar]
- 74.Breitkopf SB et al. A relative quantitative positive/negative ion switching method for untargeted lipidomics via high resolution LC-MS/MS from any biological source. Metabolomics 13, doi: 10.1007/s11306-016-1157-8 (2017). [DOI] [PMC free article] [PubMed] [Google Scholar]
- 75.Huang H, Yuan M, Seitzer P, Ludwigsen S & Asara JM IsoSearch: An Untargeted and Unbiased Metabolite and Lipid Isotopomer Tracing Strategy from HR-LC-MS/MS Datasets. Methods Protoc 3, doi: 10.3390/mps3030054 (2020). [DOI] [PMC free article] [PubMed] [Google Scholar]
- 76.Vinayagam A et al. Protein complex-based analysis framework for high-throughput data sets. Sci Signal 6, rs5, doi: 10.1126/scisignal.2003629 (2013). [DOI] [PMC free article] [PubMed] [Google Scholar]
- 77.Neisch AL, Neufeld TP & Hays TS A STRIPAK complex mediates axonal transport of autophagosomes and dense core vesicles through PP2A regulation. J Cell Biol 216, 441–461, doi: 10.1083/jcb.201606082 (2017). [DOI] [PMC free article] [PubMed] [Google Scholar]
- 78.Hu Y et al. Molecular Interaction Search Tool (MIST): an integrated resource for mining gene and protein interaction data. Nucleic Acids Res 46, D567–D574, doi: 10.1093/nar/gkx1116 (2018). [DOI] [PMC free article] [PubMed] [Google Scholar]
- 79.Hu Y, Comjean A, Perrimon N & Mohr SE The Drosophila Gene Expression Tool (DGET) for expression analyses. BMC Bioinformatics 18, 98, doi: 10.1186/s12859-017-1509-z (2017). [DOI] [PMC free article] [PubMed] [Google Scholar]
- 80.Hodgson L, Shen F & Hahn K Biosensors for characterizing the dynamics of rho family GTPases in living cells. Curr Protoc Cell Biol Chapter 14, Unit 14 11 11–26, doi: 10.1002/0471143030.cb1411s46 (2010). [DOI] [PMC free article] [PubMed] [Google Scholar]
Associated Data
This section collects any data citations, data availability statements, or supplementary materials included in this article.
Supplementary Materials
Data Availability Statement
All data supporting the findings of this study are available within the Article and its Supplementary Information.
“PXo_body_area”: https://github.com/charles-xu-ru/image-analysis/blob/master/PXo_body_area
“PXo_size_violin”: https://github.com/charles-xu-ru/image-analysis/blob/master/PXo_size_violin
“FRET_ratios_movie”: https://github.com/charles-xu-ru/image-analysis/blob/master/FRET_ratios_movie


