

Summary
Transcription factors (TFs) activate enhancers to drive cell-specific gene programs in response to signals, but our understanding of enhancer assembly during signaling events is incomplete. Here, we show that Androgen Receptor (AR) forms condensates through multivalent interactions mediated by its N-terminal intrinsically disordered region (IDR) to orchestrate enhancer assembly in response to androgen signaling. AR IDR can be substituted by IDRs from selective proteins for AR condensation capacity and its function on enhancers. Expansion of the polyQ track within AR IDR results in a higher AR condensation propensity as measured by multiple methods including live-cell single-molecule microscopy. Either weakening or strengthening AR condensation propensity impairs its heterotypic multivalent interactions with other enhancer components and diminishes its transcriptional activity. Our work reveals the requirement of an optimal level of AR condensation in mediating enhancer assembly and suggests that alteration of the fine-tuned multivalent IDR-IDR interactions might underlie AR-related human pathologies.
Keywords: Multivalent interaction, phase separation, condensation, condensate formation, intrinsically disordered region, enhancer, androgen receptor, hormone-induced enhancer assembly
Graphical Abstract
eTOC Blurb
It’s now recognized that multivalent interactions of transcriptional proteins can mediate protein recruitment on enhancers. However, the precise regulation of these interactions remains unclear. By studying androgen-responsive enhancers, Chen et al. show that an optimal level of multivalent interactions of androgen receptor is required for enhancer assembly and activation.
Introduction
Androgen receptor (AR) is a member of the nuclear receptor superfamily that regulates transcription in response to steroid hormones. In the absence of androgens, AR is bound by Heat Shock Protein 90 (HSP90) in the cytosol. Upon binding to androgen, AR undergoes conformational changes and is released from HSP90, resulting in nuclear translocation.1 Once in the nucleus, AR dimers bind to androgen response elements (AREs), which are predominantly located at distal enhancers.2
Enhancers are cis-regulatory elements, which are found mostly in the intergenic and intronic regions, with well-established roles in regulating cell type-specific gene expression.3 Enhancers consist of clusters of transcription factor binding sites (TFBS) and are bound by a wide variety of transcription factors (TFs), coregulators, chromatin structuring and remodeling factors, RNA pol II, and other enzymes upon activation. Through a large-scale protein assembly, the enhancer complex loops over to interact with the target promoter to regulate transcription.4 We have previously revealed dynamic high-order TF-DNA, TF-TF, and TF-cofactor interactions as a mechanism to regulate enhancer assembly under normal conditions and in the contexts of disease progression.5-7 However, the precise mechanisms underlying signal-induced enhancer assembly remain elusive. Activation domains (ADs) of TFs are generally intrinsically disordered in the amino acid sequences and other cofactors including MED1 and BRD4 also contain intrinsically disordered regions (IDRs).8,9 Recently, there has been an explosion of discoveries on how intrinsically disordered proteins (IDPs) undergo multivalent, dynamic but specific interactions and contribute to enhancer function by forming “hubs” or “condensates”, which can develop into phase separation systems under certain conditions.9-18 While these hubs/condensates have been found to allow the IDPs to form strong and specific interactions to achieve enhancer regulation, how IDR-mediated multivalent interactions control signal-induced enhancer assembly is unclear.
Like other nuclear receptors, AR comprises an intrinsically disordered N-terminal domain (NTD) that is the transcriptional activation domain, a central DNA binding domain (DBD) with two zinc finger motifs, and a C-terminal ligand-binding domain (LBD). AR NTD has been recently demonstrated to drive multivalent interactions which can be pharmacologically targeted to treat prostate cancer.19-21 AR recruits a large number of coregulators, including coactivators (e.g., mediator complex), ATP-dependent chromatin remodeling proteins (e.g., SWI/SNF-BRG1), and pioneer factors (e.g., FOXA1) to enhancers in response to androgen signaling.22,23 However, it is not clear how AR assembles active enhancers upon hormone stimulation and whether IDR-mediated multivalent interactions play a role in hormone-induced enhancer assembly.
Within the NTD of human AR, there is a variable region of different length of polyglutamine (polyQ) repeats. The length of polyQ repeats has been reported to negatively correlate with AR transcriptional activity and the risk for prostate cancer.24,25 Expansion of the polyQ tract leads to unfolded protein response and transcriptional dysregulation, which is associated with Kennedy’s disease/spinal and bulbar muscular atrophy (KD/SBMA).26-28 These results suggest the regulation of AR function by the length of polyQ tract, but the underlying mechanism is not well understood.
In this study, we demonstrate that the intrinsically disordered NTD of AR can undergo multivalent interactions and drive AR condensate formation. AR NTD can be functionally substituted by intrinsically disordered regions (IDRs) from selective proteins. AR condensation through its multivalent interactions can be weakened by aromatic mutations or strengthened by extending the polyQ tract within AR NTD, both leading to deficiencies in hormone-induced enhancer assembly and transcriptional activation. Our quantitative LacO array and live-cell single-molecule imaging data further confirmed that these AR mutants failed to maintain normal homotypic AR-AR interaction and heterotypic AR-MED1 interaction. These results suggest that an optimal level of AR multivalent interactions is required for its proper function and that alterations of the fine-tuned AR condensation behavior might underlie human pathologies. Our results provide molecular insights for potential therapeutic strategies to treat prostate cancer and other AR-involved diseases by targeting AR multivalent interactions.
Results
AR requires its NTD to form condensates and to activate transcription in response to hormone stimulation
Phase-separated condensation of enhancer components has emerged as a mechanism of transcriptional regulation.8-10,29 AR N-terminal domain (ARNTD) contains amino acid sequences predictive of an IDR (Figure S1A). We confirmed that ARNTD (amino acids 1-538, interchangeable with IDR throughout the study) drove phase separation using an optogenetic system30 (Figures S1B and S1C). We performed FRAP on ARNTD optoDroplets to assess the liquidity of phase separation systems31 and observed a slow and partial recovery (29 ± 9.3% recovery) (Figure S1D), suggesting that these puncta exhibit partially gel-like character.32 We next purified recombinant GFP-ARNTD protein (Figures S1E and S1F), and performed in vitro droplet formation assays. Purified GFP-ARNTD fusion protein formed spherical droplets in the presence of PEG8000 and the droplet size correlated with protein concentration (Figures 1A and 1B). Together, the live-cell optoDroplet and in vitro droplet formation assays suggest that ARNTD can drive phase separation.
Figure 1. AR requires its NTD to form condensates and to activate transcription in response to hormone stimulation.

(A-B) Representative droplet formation images and phase diagram of purified GFP-ARNTD at indicated conditions. Scale bar: 10 μm.
(C) Representative images of LNCaP cells transiently transfected with GFP-ARwt or GFP-ARΔIDR treated with vehicle or 100 nM DHT. White boxes indicate the zoomed regions shown on the right. NTD deletion (ΔIDR) abolished DHT-induced AR foci formation. Scale bar: 10 μm.
(D) Quantification of LNCaP cells transiently transfected with GFP-ARWT or GFP-ARΔIDR with indicated treatments. Percentages of cells showing AR foci in GFP-positive cells were plotted. Statistics: one-way ANOVA, ***P < 0.001.
(E-H) Heatmaps and aggregate plots of ATAC-seq data of LNCaP cells stably expressing Dox-inducible exogenous ARwt or ARΔIDR and transduced with control or AR shRNA to knock down endogenous AR. Exogenous ARwt, but not ARΔIDR, promoted chromatin opening and rescue the reduced chromatin accessibility caused by shAR.
(I-J) Genome browser view of ATAC-seq signals on the enhancers of AR target genes KLK2 and KLK3 (highlighted in light yellow). IDR deletion abolished the enhancer activation function of AR.
See also Figures S1 and S2.
We next examined AR behaviors in prostate cancer cell line LNCaP by transiently expressing GFP-tagged full-length AR (GFP-ARwt) in the cells. In the absence of DHT, GFP-ARwt was located predominantly in the cytoplasm with a relatively homogeneous distribution (Figure S1G). After 10 minutes of DHT treatment, we started to see GFP-ARwt in the nucleus with a homogenous distribution. After 30 minutes of DHT treatment, GFP-ARwt was found in nuclei of all transfected cells, with about 30% of the cells having GFP-ARwt form numerous discrete assemblies. Here, we refer to the AR assemblies as condensates. Although the term condensate was originally derived from the phenomenon of phase separation, here we use its most recent definition - an entity that is not bound by a membrane, concentrating specific types of biomolecules, and involving non-stoichiometric, multivalent interactions33-35 - without indicating phase separation as the underlying mechanism given the difficulty in rigorously proving phase separation in living cells.36 The percentage of cells with GFP-ARwt foci reached to about 60% at 2 hours and did not further increase at 4 hours after DHT treatment (Figures S1G and S1H). Therefore, we used 2-hour treatments for other in-cell AR condensate analyses. Consistent with the disordered property of AR NTD, GFP-ARΔNTD was located in the nuclei but did not form foci like GFP-ARwt upon DHT treatment (Figures 1C and 1D), indicating the requirement of NTD for AR condensation.
Given that AR condensates formed in response to androgen stimulation, we tested if the ligand binding domain (LBD) of AR was required for AR condensation (Figure S1I). As there is a nuclear export sequence (NES) within the LBD,37 GFP-ARΔLBD was localized in the nucleus independent of DHT treatment. DHT treatment failed to induce condensate formation for GFP-ARΔLBD (Figures S1I and S1J), indicating that multivalent interactions of AR NTD require the structured LBD.
An increasing amount of evidence has shown that IDR-IDR multivalent interactions that lead to TF hub or condensate formation is an important mechanism that drives transactivation.8-10,13,29,38 We next looked for potential correlation between multivalent interactions and AR transcriptional activity by examining the requirement of NTD in AR-mediated enhancer activation and gene expression. To this end, we compared ARwt and ARΔNTD for their effects on chromatin accessibility of AR enhancers with ATAC-seq. 1,158 active AR enhancers were annotated using previously published AR ChIP-seq and H3K27ac ChIP-seq data.39,40 We used shRNA to knockdown endogenous AR expression, followed by induction of exogenous AR expression which was resistant to shRNA due to synonymous mutations (Figures S2A-S2C). In control shRNA groups, DHT stimulation significantly increased ATAC-seq signals on AR enhancers, and the expression of exogenous AR augmented chromatin accessibility in both vehicle and DHT treated cells (Figures 1E and 1F). In shAR groups, DHT treatment had little effect on ATAC-seq signals, but exogenous AR expression was sufficient to restore DHT-induced chromatin opening to some level (Figures 1E and 1F). In contrast, expression of ARΔIDR failed to increase ATAC-seq signals in control shRNA groups or to restore the diminished chromatin accessibility caused by shAR (Figures 1G and 1H), indicating that AR is dependent on its NTD to activate enhancers. As an example, the enhancer regions of the well-established AR target genes KLK2 and KLK3 were presented to show the effects of ARwt and ARΔIDR on enhancer activation (Figures 1I and 1J). The difference in the rescuing effects between ARwt and ARΔIDR was not due to the difference in expression levels, as we confirmed that their expression was comparable (Figures S2B and S2C).
To further evaluate the requirement of NTD for AR transcriptional activity, we performed RT-qPCR to measure AR target gene expression. Consistent with the ATAC-seq results, expressing ARwt in control shRNA groups significantly elevated the mRNA levels of KLK2 and NKX3-1. shAR abolished transcription of KLK2 and NKX3-1, but Dox-induced ARwt was sufficient to partially restore the transcription (Figure S2D). In contrast, expression of ARΔIDR has no effect on target gene transcription in the control shRNA group and failed to restore the reduced transcription caused by shAR (Figure S2E). Taken together, these data indicate that AR NTD is required for both condensate formation behaviors and transcriptional activity of AR.
Disrupting the multivalent interactions of AR compromises AR-mediated transcription
The requirement of NTD (i.e., IDR) for both condensate formation and AR transcriptional activity prompted us to test if disrupting the multivalent IDR-IDR interactions inhibits AR-mediated transcription. We applied 1,6-Hexanediol (1,6-HD), an aliphatic alcohol that has been routinely used to disrupt multivalent hydrophobic protein-protein interactions to disassemble phase-separated droplets,41,42 to LNCaP cells expressing GFP-ARwt. Treating the cells with 1,6-HD for 5 min after 2 hours of DHT treatment was sufficient to significantly reduce the percentage of cells exhibiting GFP-ARwt foci, while no effect was detected when a similar aliphatic alcohol 2,5-Hexanediol (2,5-HD) was applied to the cells (Figures 2A and 2B). Similar results were found in U2OS human osteosarcoma cell line, which expresses AR and exhibits an androgenic response (Figures S3A and S3B). Like in LNCaP cells, GFP-ARwt distributed relatively homogeneously across the cytoplasm in vehicle control and formed discrete condensates in the nucleus upon DHT treatment in U2OS cells. The DHT-induced GFP-ARwt condensates disappeared when the cells were treated with 1,6-HD for 5 min (Figures S3A and S3B).
Figure 2. Disrupting the multivalent interactions of AR compromises AR-mediated transcription.

(A-B) Representative images and quantification of LNCaP cells transiently transfected with GFP-ARwt and treated with indicated treatments. 1,6-HD treatment significantly disrupted DHT-induced AR foci formation. White boxes indicate the zoomed regions shown on the right. Scale bar: 10 μm. Percentages of cells showing AR foci in GFP-positive cells were plotted. Statistics: one-way ANOVA, ns: non-significant, ****P < 0.0001.
(C-D) Heatmaps and aggregate plots of ATAC-seq signal on active AR enhancers derived from LNCaP cells treated with vehicle, DHT, DHT+1,6-HD, or DHT+2,5-HD. DHT treatment increased chromatin accessibility of AR enhancers and 1,6-HD inhibited chromatin opening in response to DHT.
(E) Representative genome browser view of ATAC-seq signals on the enhancers of AR target genes KLK2 and KLK3 (highlighted in light yellow).
(F-G) Heatmaps and aggregate plots of ATAC-seq signal on non-AR enhancers. DHT or 1,6-HD treatment did not affect the chromatin accessibility of non-AR enhancers.
(H) Representative genome browser view of ATAC-seq signals on GAPDH gene locus as a negative control showing 1,6-HD did not affect the chromatin accessibility of a non-AR target gene.
(I-L) Heatmaps and genome browser views of GRO-seq signals around the centers of active AR enhancer regions (I and J) or non-AR enhancer regions (K) or non-AR target gene GAPDH (L). DHT treatment promoted eRNA transcription on AR enhancers and this DHT effect was diminished by 1,6-HD treatment. AR enhancers were highlighted by light yellow color in (J).
See also Figure S3.
We next examined the effect of 1,6-HD on chromatin accessibility of AR enhancers with ATAC-seq. We first confirmed that 1,6-HD treatment did not affect AR mRNA and protein levels in LNCaP cells (Figures S3C and S3D). We observed that DHT treatment dramatically increased the ATAC-seq signals on the 1,158 active AR enhancers (Figures 2C and 2D). This DHT-induced increase in chromatin accessibility was greatly abolished by 1,6-HD, but not 2,5-HD treatment (Figures 2C-2E and S3E). As the negative controls, ATAC-seq signals on 1,500 active non-AR enhancers and GAPDH gene locus did not show obvious changes in response to DHT or 1,6-HD treatment (Figures 2F-2H). The specific impact of 1,6-HD on AR active enhancers is likely attributed to the robust activation of AR-specific enhancers by androgen signaling, which rapidly activates AR enhancers and target genes within minutes. This acute response to hormone stimulation renders AR enhancers more susceptible to the impact of 1,6-HD treatment compared to non-AR enhancers. Therefore, these data suggest that disrupting the multivalent interactions of AR can compromise DHT-induced chromatin “opening” of AR enhancers.
We further performed GRO-seq to determine the impact of 1,6-HD on AR enhancer activity and target gene expression. Enhancer RNA (eRNA) production has been used as a reliable marker for enhancer activity.43,44 We detected increased eRNA synthesis from active AR enhancers upon DHT stimulation. Notably, 1,6-HD, but not 2,5-HD, was sufficient to reduce DHT-induced eRNA transcription from active AR enhancers (Figures 2I, 2J, S3F and S3G). As negative controls, transcription from active non-AR enhancers (Figure 2K) and GAPDH gene locus (Figure 2L) was not significantly affected by 1,6-HD treatment. These support the key role of AR multivalent interactions on regulating enhancer activity and target gene transcription.
Multivalent homotypic interactions and transcriptional activity of AR depend on the aromatic residues within its NTD
Recent studies have shown that aromatic residues in IDRs can function as “stickers” to promote multivalent interactions that underlie phase separation.12,45-48 We substituted all seven phenylalanine residues within NTD with serine amino acids (AR7FS) to evaluate their contribution to the multivalent interaction and phase separation behaviors of AR (Figure S4A). In vitro droplet formation assay showed that GFP-NTD7FS formed droplets in the presence of the crowding agent PEG8000. However, the droplet size was significantly smaller compared to that of GFP-NTDwt droplets at all protein concentrations tested (Figures 3A and 3B). When expressed in LNCaP cells, GFP-AR7FS was homogeneously distributed in the cytoplasm in the absence of DHT and exclusively in nuclei upon DHT treatment. However, the DHT-induced condensate formation was significantly disrupted by the 7FS mutation (Figures 3C and 3D). As two out of the seven F residues are within the FQNLF motif, we questioned whether the defects caused by the 7FS mutation was due to perturbation of the FQNLF motif-mediated NTD-LBD interaction. We therefore generated 2FS and 5FS mutants with the two F residues within the FQNLF motif and the rest five replaced by serine residues respectively (Figure S4A). Both 2FS and 5FS mutations resulted in defects in DHT-induced condensate formation and transactivation activity measured by luciferase assays (Figures S4B-S4D). We compared wildtype AR and AR variants with 2, 5, and 7 F-to-S mutations and found that the severity of defects positively correlated with the number of mutated F residues (Figures S4C and S4D), supporting that all 7 F aromatic residues together contribute to AR multivalent interactions and AR function. We also generated the 4WS mutant by replacing the four W residues within NTD with S residues (Figure S4A). We observed that 4WS mutant displayed defects in condensation and transactivation (Figures S4B-S4D). As mutations of different aromatic residues led to similar perturbations to condensates and functions, these results together indicate that the aromatic residues play a key role in the multivalent homotypic interactions of AR.
Figure 3. Aromatic residue mutation in NTD weakens multivalent AR-AR interactions and disrupts AR transcriptional activity.

(A) Representative droplet formation images of purified GFP-NTDwt and GFP-NTD7FS at indicated protein concentrations. Scale bar: 10 μm.
(B) Quantification of the size of droplets formed by purified GFP-NTDwt and GFP-NTD7FS at indicated protein concentrations. Statistics: one-way ANOVA, ***P < 0.001.
(C-D) Representative images and quantification of LNCaP cells transiently transfected with GFP-ARwt or GFP-AR7FS and treated with vehicle or DHT. Mutating the aromatic residues inhibited DHT-induced AR condensate formation. White boxes indicate the zoomed regions shown on the right. Scale bar: 10 μm. Percentages of cells showing AR foci in GFP-positive cells were plotted. Statistics: one-way ANOVA, ns: non-significant, ****P < 0.0001.
(E) Schematic illustration of the LacO array system to test AR self-interactions. eYFP-AR-LacI is recruited to LacO array through protein-DNA binding and mCherry-AR can be recruited to the LacO array through AR-AR interactions.
(F) Representative images of LacO array-containing U2OS cells co-expressing indicated proteins. Scale bar: 10 μm.
(G) Quantification of mCherry-AR recruitment to the LacO hub through AR-AR self-association. Enrichment of mCherry above relative level of 1 suggests AR-AR self-association. Statistics: one-way ANOVA, ***P < 0.001.
(H-I) Heatmaps and aggregate plots of ATAC-seq signal on active AR enhancers derived from LNCaP cells with indicated treatments. Exogenous expression of AR7FS failed to rescue the reduced chromatin accessibility on AR enhancers caused by shAR.
(J) Genome browser view of ATAC-seq signals on the enhancers of AR target genes (highlighted in light yellow) showing that 7FS mutation abolished the enhancer activation function of AR.
See also Figure S4.
Given the correlation between the multivalent homotypic interactions of AR and its transcriptional activity, we sought to test if such interactions promote its recruitment to chromatin using our previously established cell imaging assay.13,49,50 We co-expressed mCherry-AR and eYFP-AR-LacI in U2OS 2-6-3 cells containing a synthetic Lac operator (LacO) array integrated into the genome.51 Through targeted DNA binding, eYFP-ARwt-LacI molecules were recruited to the LacO array, generating a large, concentrated interaction hub on the chromatin (Figures 3E and 3F). We observed a strong mCherry signal at the array (Figures 3F and 3G), indicating a strong homotypic interaction ability of ARwt. When we performed the LacO assay using ARΔIDR, we observed a much weaker mCherry signal at the array, even though the recruitment of eYFP-ARΔIDR-LacI molecules to LacO array appeared normal (Figures 3F and 3G), consistent with the essential role of IDR in mediating AR homotypic interactions. Notably, the 7FS mutation also significantly reduced AR homotypic interaction to a level similar to ARΔIDR (Figures 3F and 3G). Collectively, these data suggest that aromatic residues in the NTD promote the enrichment of AR to chromatin through its multivalent homotypic interactions.
We next asked how 7FS mutation affected DHT-induced enhancer activation with ATAC-seq. We knocked down endogenous AR expression and expressed exogenous AR7FS (Figure S4E) to see if AR7FS could rescue the defects in chromatin accessibility caused by shAR. Unlike ARwt which was sufficient to restore the ATAC-seq signals (Figure 1), AR7FS was unable to rescue the ATAC-seq phenotype caused by shAR (Figures 3H-3J). Similarly, shAR disrupted AR target gene transcription and expression of AR7FS failed to rescue the defects (Figure S4F). Therefore, the aromatic residues within the NTD are critical for AR multivalent interactions and transcriptional activity.
AR NTD can be functionally substituted by FUS and TAF15 IDRs, but not ERα IDR
Previous studies have shown that in some cases one IDR can functionally substitute for another in ribonucleoprotein (RNP) granule assembly.52,53 We wondered whether other IDRs could functionally substitute for AR NTD. Fused in sarcoma/translocated in liposarcoma (FUS/TLS or FUS) and TAF15 represent two of the most studied examples of proteins that undergo multivalent interactions and phase separation.47,54,55 We replaced AR NTD with the IDR from FUS or TAF15 and examined AR condensate formation in LNCaP cells (Figure 4A). As mentioned above, GFP-ARwt showed a homogeneous distribution in the cytoplasm in vehicle control but localized in the nucleus and became punctate upon DHT treatment. NTD deletion promoted nuclear localization in the absence of DHT and abolished the DHT-induced condensate formation (Figures 4B and 4C). Fusion of FUS IDR or TAF15 IDR to ARΔIDR (GFP-FUSIDR-ARΔIDR or GFP-TAF15IDR-ARΔIDR) fully restored DHT-induced AR condensate formation (Figures 4D, 4E, and 4G). Notably, FUS IDR and TAF15 IDR were able to promote AR condensate formation in some cells even in the absence of DHT (Figures 4D, 4E, and 4G). We further tested if IDR from ERα, another hormone-related transcription factor like AR, could substitute for AR IDR (Figure 4A). ERα has been previously shown to undergo phase separation and to promote enhanceosome assembly.29 Fusion of ERα IDR to ARΔIDR (GFP-ERαIDR-ARΔIDR) did not affect ARΔIDR distribution in the vehicle condition, but partially restored DHT-induced condensate formation. We observed a similar percentage of cells showing puncta in cells expressing GFP-ERαIDR-ARΔIDR after DHT treatment (Figures 4F and 4G). However, these condensates were less distinct from background compared to GFP-ARwt condensates, which was also indicated by the lower fringe visibility (Figure 4G).
Figure 4. AR NTD can be functionally substituted by FUS and TAF15 IDRs, but not ERα IDR.

(A) Schematic illustration of ARwt, ARΔIDR, and swapped AR mutant proteins that were expressed in LNCaP cells for rescue experiments in Figures 4, S5, and S6.
(B-F) Representative images of LNCaP cells transiently transfected with the indicated AR constructs and treated with vehicle or DHT. White boxes indicate the zoomed regions shown on the right. Scale bar: 10 μm.
(G) Quantifications of LNCaP cells with AR condensates (top) and the fringe visibility of AR condensates (bottom). In the top panel, percentages of cells showing AR foci in GFP-positive cells were plotted. In the bottom panel, fringe visibility values of randomly selected AR foci from 6 cells (5 foci/cell) were plotted for each condition. Statistics: one-way ANOVA, ns: non-significant, *P < 0.05, ***P < 0.001, ****P < 0.0001.
(H) Luciferase reporter assay to examine transcriptional activity of the indicated AR proteins and conditions. 293T cells were co-transfected with the luciferase reporter vector containing 3xARE and one of the AR constructs followed by luciferase activity measurement. Statistics: one-way ANOVA, ns: non-significant, ****P < 0.0001.
See also Figures S5 and S6.
We next tested if AR NTD can be replaced for its transcriptional activity using ARE-based luciferase reporter assay. Expression of ARwt significantly increased luciferase activity in response to DHT treatment, while ARΔIDR failed to promote luciferase gene expression (Figure 4H). Remarkably, the fusion proteins FUSIDR-ARΔIDR and TAF15IDR-ARΔIDR were both as efficient as ARwt in promoting luciferase expression in response to DHT. In contrast, ERαIDR-ARΔIDR was insufficient to activate luciferase expression (Figure 4H). We further tested the fusion proteins for their function in regulating AR target gene transcription in LNCaP cells with endogenous AR knocked down (Figures S5A-S5C). RT-qPCR data showed that expression of exogenous FUSIDR-ARΔIDR and TAF15IDR-ARΔIDR was sufficient to promote DHT-induced target gene expression after shAR knockdown (Figures S5D and S5E). Consistent with the results from luciferase reporter assay (Figure 4H), ERαIDR-ARΔIDR behaved like ARΔIDR and was unable to promote target gene expression (Figures S2E and S5F).
We next performed ATAC-seq and observed that DHT stimulation significantly increased ATAC-seq signal on AR enhancers in control shRNA groups, and the expression of exogenous AR variants containing TAF15 IDR or FUS IDR was sufficient to augment chromatin accessibility (Figures S6A-S6F). In shAR groups, DHT treatment had little effect on ATAC-seq signals, but the expression of AR variants with TAF15 IDR or FUS IDR were both sufficient to restore DHT-induced chromatin opening to a level similar to the one resulted from exogenous wildtype AR expression (Figures S6A-S6F), indicating that TAF15 IDR and FUS IDR can functionally substitute for AR IDR to open chromatin at the 1,158 annotated AR enhancer sites. In contrast, ERα IDR failed to functionally replace AR IDR (Figures S6G-S6I), with ERαIDR-ARΔIDR behaving like ARΔIDR. This might be due to the requirement of estrogen signaling for ERα IDR to form functional condensates. These results are consistent with the results of ARE luciferase assays and qRT-PCRs above.
Having shown that AR variants containing FUS IDR or TAF15 IDR reserve AR function on the 1,158 AR enhancers, we further examined if these variants render additional function on additional chromatin sites. Our bioinformatic analyses on all ATAC-seq data revealed that neither FUS IDR nor TAF15 IDR render additional accessible chromatin sites for AR (Figure S6J). This is consistent with the notion that the genome-wide binding specificity of AR is determined by its DNA-binding domain, while the IDR (of AR, FUS or TAF15, but not ERα) regulates transactivation activities by forming multivalent interaction-mediated condensates.
Together, these results indicate that AR IDR can be functionally substituted by selective IDRs. The correlation of condensate formation status and transcriptional activities of these fusion proteins also support that the biophysical properties of AR condensates are critical for its transcriptional activity.
PolyQ track expansion leads to more stable AR condensates and reduces AR transcriptional activity
PolyQ expansion has been recently shown to promote condensate formation.56 There is a polymorphic number of glutamine (Q) repeats in AR NTD and the length of polyQ tract is believed to contribute to individual differences in androgen sensitivity, with shorter polyQ tracts associated with higher AR transcriptional activity.57 Q repeats beyond the normal range (>36Q) is associated with Kennedy’s disease/spinal and bulbar muscular atrophy (KD/SBMA). We thus sought to study the effects of polyQ expansion on AR condensate formation and transcriptional activity. We first performed the in vitro droplet formation assay to compare AR NTD with 69 Q repeats (ARNTDpQ69) to ARNTDwt that contains 23 Q repeats. Similar to GFP-NTDwt, GFP-NTDpQ69 was able to form droplets in the presence of PEG8000 and the droplet size correlated with protein concentration (Figures 5A and 5B). Notably, GFP-NTDpQ69 formed slightly larger droplets compared to GFP-NTDwt at all protein concentrations tested. And the saturation concentration (the lowest concentration at which droplets appear) for GFP-NTDpQ69 was lower than that of GFP-NTDwt (Figures 5A and 5B). At 20 uM protein concentration, some GFP-NTDpQ69 droplets appeared to aggregate into large assemblies with irregular shapes (Figure 5A). We further performed the sedimentation assay, which is commonly used to quantitatively examine protein phase separation by measuring the ratios of proteins partitioned into phase-separated droplet (Figure 5C).58,59 We found that 7FS mutation led to a reduction of AR sedimentation in pellets, while pQ69 showed an increased protein ratio in pellet (Figures 5D and 5E). Together, these results suggest that polyQ expansion might enhance the phase separation propensity of AR.
Figure 5. PolyQ expansion leads to more stable AR condensates.

(A) Representative droplet formation images of purified GFP-NTDwt (pQ23) and GFP-NTDpQ69 at indicated protein concentrations. Scale bar: 10 μm.
(B) Quantification of the size of droplets formed by purified GFP-NTDwt and GFP-NTDpQ69 at indicated protein concentrations. n.d.: non-detectable. Statistics: student’s t-test, *P < 0.05, ***P < 0.001.
(C) Schematic diagram of droplets sedimentation and western-blot assays.
(D) Representative image of the droplet sedimentation and western blot analyses. Supernatant (S) indicates the free proteins. Pellet (P) indicates proteins inside droplets. The top band represents GFP-ARNTD and the lower band represents a truncated GFP-ARNTD fragment.
(E) Quantification of the ratio of protein in pellet. The intensity of the top band in panel (D) was measured using ImageJ and the pellet fraction ratio P/(S + P) was plotted. Statistics: one-way ANOVA, *P < 0.05.
(F-G) Representative images and quantification of LNCaP cells transiently transfected with GFP-ARpQ69 and treated with vehicle, DHT, or DHT+1,6-HD. Scale bar: 10 μm. GFP-ARpQ69 foci were more resistant to 1,6-HD treatment. Statistics: one-way ANOVA, ns: non-significant, ***P < 0.001.
(H-I) Representative images and quantification of Fluorescence Recovery After Photobleaching (FRAP) analyses on GFP-ARwt and GFP-ARpQ69 condensates formed in LNCaP cells in response to DHT treatment. Scale bar: 10 μm. Error bar: standard deviation.
See also Figure S7 and Supplemental Videos 1 and 2.
We next tested if polyQ expansion can affect AR condensate formation in cells. We observed that, like GFP-ARwt, GFP-ARpQ69 underwent DHT-induced nuclear localization and condensate formation. Interestingly, GFP-ARpQ69 condensates were more resistant to 1,6-Hexanediol treatment than GFP-ARwt (Figures 2A, 2B, 5F, and 5G). When we performed FRAP analyses, we found that GFP-ARpQ69 condensates had a slower and far less complete recovery after photobleaching than those of GFP-ARwt (Figures 5H and 5I), suggesting more stable multivalent protein-protein interactions of ARpQ69.
To further understand the impact of polyQ expansion on AR condensate properties, we performed single-molecule imaging experiments to compare the dynamics of multivalent protein-protein interactions for ARwt and ARpQ69 in live cells. For each AR variant, U2OS cells were co-transfected with GFP-tagged full-length AR (GFP-AR) and Halo-tagged AR NTD (Halo-ARNTD-NLS). Upon DHT treatment, GFP-tagged full-length AR formed self-assembled condensates on its bound ARE-containing enhancers in the nuclei (Figures 6A and 6B), while Halo-tagged AR NTD dynamically bound to and dissociated from the condensates. The resident times (RTs) of AR NTD in full-length AR condensates for ARwt and ARpQ69 (Halo-labeled single molecules binding to GFP-labeled puncta) were measured by single-particle tracking (SPT) (Figures 6A and 6B). We observed an average RT of 6.4 ± 1.0 seconds for ARNTDwt, while ARNTDpQ69 exhibited a significantly higher RT of 16.0 ± 4.3 seconds (Figures 6C and S7A; Supplemental Videos 1 and 2). This quantitative analysis provides evidence that ARpQ69 forms significantly more stable homotypic multivalent protein-protein interactions compared to ARwt, thereby explaining the higher phase separation propensity of ARpQ69 over ARwt.
Figure 6. PolyQ length correlates with AR condensation propensity and PolyQ track expansion reduces AR transcriptional activity.

(A) Representative images of U2OS cells transfected with GFP-AR and Halo-ARNTD-NLS. Shown are individual frames from two-color movies of GFP-AR (green) and Halo-ARNTD-NLS labeled with 5 nM Halo ligand PA-JF646 (magenta). A white dashed line outlines the nucleus. Scale bar: 10 μm.
(B) Schematic illustration of the AR proteins used in the single-particle tracking (SPT) analysis. The residence time of ARNTD in the puncta formed by their corresponding full-length variants (ARwt and ARpQ69, respectively) was measured.
(C) The residence times of ARNTDwt and ARNTDpQ69 in the puncta formed by their corresponding full-length variants were plotted. The value for WT protein is averaged from 29 cells and its mutant from 26 cells measured in more than three independent transfection and imaging sessions. Asterisk indicates a significant difference between the two proteins (Wilcoxon rank-sum test).
(D-E) Heatmaps and aggregate plots of ATAC-seq signals around the centers of active AR enhancers under the indicated conditions. ARpQ69 was not able to substitute for ARwt for AR function in activating AR enhancers.
(F) Genome browser view of ATAC-seq signals on the enhancers of AR target genes KLK2 and KLK3 (highlighted by light yellow color) showing that polyQ track expansion abolished the enhancer activation function of AR.
(G) Representative images of LNCaP cells transiently transfected with the indicated AR constructs and treated with vehicle or DHT. White boxes indicate the zoomed regions shown on the right. Scale bar: 10 μm.
(H) Quantifications of LNCaP cells with AR condensates. PolyQ length positively correlates with the percentage of cells with AR condensates at 30 minutes post DHT treatment. Statistics: one-way ANOVA, ns: non-significant, *P < 0.05, **P < 0.01, ***P < 0.001.
(I) Luciferase reporter assay to examine transcriptional activity of the indicated AR variants and conditions in 293T cells. PolyQ length negatively correlates with AR transcriptional activity in 293T cells. LNCaP cells were not used for the luciferase reporter assay due to the high endogenous AR expression level. Statistics: one-way ANOVA, **P < 0.01, ***P < 0.001.
See also Figure S7 and Supplemental Videos 1 and 2.
The effects of polyQ expansion on condensate behaviors prompted us to assess its effect on AR function in enhancer activation with ATAC-seq. We expressed Dox-inducible exogenous ARpQ69 in LNCaP cells with endogenous AR knocked down (Figures S7B and S7C). Unexpectedly, ARpQ69 expression failed to replace endogenous AR to mediate DHT-induced chromatin opening on AR enhancers (Figures 6D-6F). RT-qPCR data also showed that ARpQ69 was insufficient to promote AR target gene transcription (Figure S7D). Therefore, despite the strengthened multivalent interactions for ARpQ69 condensates, ARpQ69 exhibits impaired transcriptional activity.
We next sought to investigate the effect of polyQ length on AR condensation and AR function by comparing AR proteins with different polyQ length (23Q vs 69Q vs 92Q). We found that AR with different polyQ length form condensates in about 60-70% of transfected cells at 2 hours post DHT treatment. Interestingly, at 30 min post DHT treatment, AR with longer polyQ length formed condensates in a higher percentage of cells in LNCaP (Figures 6G and 6H). On the other hand, our luciferase reporter assay revealed a negative correlation between polyQ length and transcriptional activity (Figure 6I). Similar results were found in differentiated human neuroblastoma cell line SH-SY5Y, with pQ92 showing the highest condensation propensity and lowest transcriptional activity (Figures S7E-S7G). Together, these results support the notion that an optimal level of AR-AR multivalent interactions is required for its proper function, consistent with recent findings on other endogenous and synthetic TFs.17,49
An optimal level of AR multivalent interactions is critical for the assembly of AR enhancer complex
The observations above indicate that the biophysical properties of AR condensates influence AR function. To understand the underlying mechanisms, we first tested whether the IDR-mediated condensate formation plays a role in AR binding on AR enhancers. We expressed AR in LNCaP cells with endogenous AR knocked down and performed ChIP-seq using the BirA-BLRP system6 to profile AR occupancy on chromatin (Figure S8A). We observed a much weaker binding strength of ARΔIDR than ARwt on active AR enhancers (Figures 7A and 7B). As ARΔIDR contained an intact DBD, the reduced binding of ARΔIDR suggested that IDR-mediated AR condensate formation can facilitate AR-enhancer interaction. This is consistent with a recent report that IDRs guide TF binding on chromatin by localizing TFs to broad DNA regions surrounding the binding sites.60 Notably, ARpQ69 showed similar binding capacity onto AR enhancers as ARwt (Figures 7A and 7B), exemplified by their binding patterns on KLK2, KLK3, and NKX3-1 enhancers (Figures 7C and S8B).
Figure 7. An optimal level of AR multivalent interactions is critical for the assembly of AR enhancer complex.

(A-B) Heatmaps and aggregate plots of AR ChIP-seq data showing the binding of ARwt, ARΔIDR, and ARpQ69 on active AR enhancers. ChIP-seqs were performed using BirA-BLRP LNCaP stable cell lines with endogenous AR knocked down and doxycycline-induced exogenous expression of BLRP-tagged AR proteins.
(C) Genome browser view of ChIP-seq signals on the enhancers of AR target genes (highlighted by light yellow color) showing that IDR deletion abolished AR binding but polyQ track expansion did not affect AR binding on AR enhancers.
(D) A list of enhancer complex components identified from our BioID analyses using ARwt, ARΔIDR or ARpQ69 as a bait protein. Normalized peptide numbers of each identified protein were listed for each experiment.
(E) Representative images of LacO array-containing U2OS cells co-expressing indicated proteins. Scale bar: 10 μm.
(F) Quantification of mCherry-MED1 recruitment to the LacO hub through AR-MED1 association. Statistics: one-way ANOVA, *P < 0.05, ***P < 0.001.
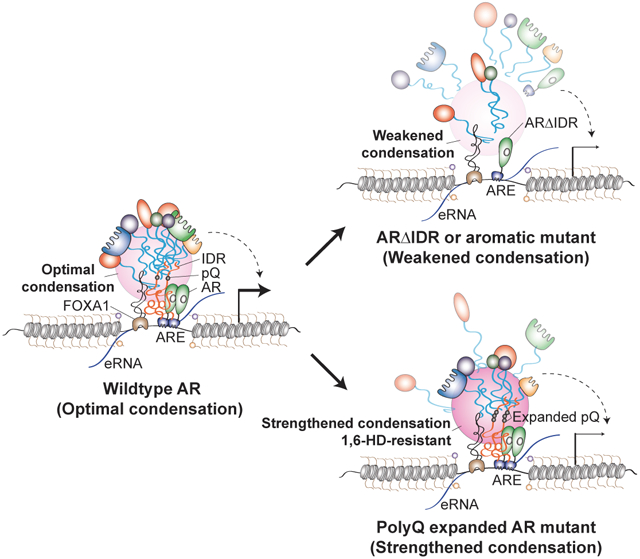
(G) Schematic working model for AR enhancer assembly. An optimal level of AR-AR or AR-cofactor multivalent interactions mediated by wildtype AR IDR promotes the assembly of enhancer complex to activate transcription. Disturbing (e.g., ΔIDR or 7FS mutation) or overly-strengthening AR condensation (e.g., pQ69) leads to defective enhancer assembly and disrupted transcriptional activation.
See also Figure S8.
As ARpQ69 showed normal chromatin occupancy but disrupted AR function, we asked whether ARpQ69 had defects in enhancer assembly. Through the well-established BioID approach5,7,61 with ARwt as the bait protein (endogenous AR was knocked down), we identified a series of enhancer complex components as AR-interacting proteins, including TFs, epigenetic cofactors, and chromatin remodelers (Figures S8C and 7D). In BioID using ARΔIDR as a bait, we detected a lower peptide number of ARΔIDR bait due to the shorter AR protein length and identified the same set of enhancer complex components. However, the peptide numbers of these AR cofactors were dramatically lower compared to ARwt BioID, indicating that IDR is required for AR enhancer complex assembly (Figures S8C and 7D). ARpQ69 BioID also recognized the same set of AR-interacting enhancer components, and their peptide numbers were significantly lower than those in ARwt BioID despite the higher peptide number of the bait protein (Figures S8C and 7D). Gene Ontology enrichment analyses on AR-interacting proteins that showed reduced interaction with ARΔIDR or ARpQ69 compared to ARwt and identified the enrichment of proteins involved in mRNA processing and transcription (Figures S8D and S8E). Therefore, even though polyQ tract expansion does not affect AR binding to enhancers, it might interfere with AR enhancer assembly, leading to reduced transcriptional activity. To further test this possibility, we measured heterotypic interactions between AR and MED1, a transcriptional coactivator in the enhancer complex, using the LacO array system. We co-expressed mCherry-MED1 and eYFP-ARwt-LacI in U2OS cells containing the LacO array and observed strong mCherry enrichment at the array (Figures 7E and 7F), indicating AR-MED1 interaction. When we performed the assay with ARΔIDR or ARpQ69, we observed significantly reduced enrichment of mCherry-MED1 (Figures 7E and 7F), suggesting that deletion of AR IDR or expansion of polyQ tract impaired the heterotypic AR-MED1 interaction. These data collectively support a model that AR needs to undergo multivalent homotypic interactions at an optimal level to enable its recruitment of enhancer components to activate enhancers, and that weakening or overly strengthening AR condensation impairs enhancer assembly, resulting in reduced transcription of AR target genes (Figure 7G).
Discussion
Several recent studies revealed that ligand-activated AR can form transcriptionally active condensates.19-21 However, how the AR condensation behavior is regulated and how condensate properties impact AR function on enhancers remain unclear. Here, we demonstrate that AR forms local high-concentration condensates driven by its IDR-mediated multivalent interactions in response to androgen stimulation and that disturbing AR condensates impairs AR function in enhancer assembly. Furthermore, we find that extending the polyQ repeats within AR IDR can strengthen AR-AR multivalent interactions, also resulting in impaired AR function in enhancer assembly. Our data reveal that AR enhancer assembly requires an optimal level of AR multivalent interactions to mediate cofactor recruitment, and that altering the biophysical properties of AR condensates changes the involved homotypic and heterotypic interactions.
The requirement of structured LBD for AR condensate formation (Figures S1I and S1J) indicates that the structured domains may contribute to hormone-induced multivalent interactions of IDR. AR LBD contains 11 α-helices that form the androgen-binding pocket.62 Upon androgen binding, the LBD changes its conformation to become an activation function domain (AF-2) to recruit coregulators with LXXLL motifs.63 The FQNLF sequence within AR NTD can act similarly as an LXXLL motif.64 Ligand binding induces an intramolecular N/C interaction between LBD and FQNLF, followed by nuclear translocation. Inside the nucleus, AR dimerizes through the intermolecular N/C interaction.65 It’s thus likely that intramolecular interaction between AR NTD and the androgen-bound AR LBD can promote AR intermolecular multivalent interactions and condensate formation. Consistent with this notion, it has been reported that estrogen binds to ERα LBD to promote ERα co-separation with MED1.8 Therefore, we propose that the binding of hormone agonists or hormone antagonists at structured LBD may alter IDR behaviors of hormone receptors. Several different androgen antagonists have been developed to target LBD, including bicalutamide, flutamide, nilutamide and enzalutamide. It would be interesting to test if these antagonists regulate the condensate formation behavior of AR and affect AR enhancer assembly through influencing IDR-IDR or IDR-structured domain interactions.
Another interesting observation in the study is that AR IDR can be functionally substituted by FUS and TAF15 IDRs, but not ERαIDR (Figures 4, S5, and S6). Our ATAC-seq data indicate that AR variants containing FUS IDR or TAF15 IDR reserve AR function on AR enhancers without rendering additional function on additional chromatin sites. This is consistent with the notion that the genome-wide binding specificity of AR is determined by its DNA-binding domain, while the IDR (of AR, FUS or TAF15, but not ERα) regulates transactivation activities by forming multivalent interaction-mediated condensates. Indeed, previous structural studies on AR and its cofactors have indicated that the AR NTD is the primary site for coactivator recruitment.66,67
Although the chimeric protein with ERαIDR and ARΔIDR also formed condensates in cells, the condensates were less distinct than the ones of ARwt, as measured by the fringe visibility, and it showed no transcriptional activity. One possible reason for the difference between FUS/TAF15 IDRs and ERαIDR might be their distinct multivalent interaction capacity and different signaling dependency. ERαIDR might require the interaction with estrogen-bound ERαLBD to form strong condensates.8 In contrast, FUS/TAF15 IDRs is able to self-associate to form phase-separated condensates without additional signal stimulations.68 Indeed, chimeric proteins with FUS/TAF15 IDR and ARΔIDR formed condensates in some cells even without DHT treatment (Figure 4). Therefore, despite the common feature of low complexity for all IDRs, different IDRs have distinct multivalent interaction capacities and properties for their functional specificity. These results further support our hypothesis that the behavior of a hormone receptor IDR is specifically regulated by its own LBD and hormone signaling.
Multiple lines of evidence indicate that polyQ expansion strengthens AR-AR multivalent interactions (Figures 5, 6, and S7). These are consistent with a recent report that alanine repeats in HOXD13 protein can elevate phase separation.69 Previous studies reported that the Leu-rich region preceding the polyQ repeats can turn the polyQ tract into an α-helical structure, preventing AR from aggregating.70,71 Our data suggest that ARpQ69 condensates might be more “gel/solid-like”, and this altered material state resulted in reduced interactions between AR and other enhancer components, such as MED1 (Figures 7D and 7E).
In summary, we show here AR condensation or its multivalent interaction ability can be weakened or strengthened through genetic and chemical approaches. As either disruption or elevation of AR condensation led to impaired AR transcriptional activity, we propose that an optimal level of AR multivalent interactions is required for its function (see working model in Figure 7G). Our work using AR as an example provides evidence for the importance of maintaining precise levels of multivalent interactions of signal-dependent IDRs to achieve precise hormone-induced enhancer assembly events. Collectively, our results suggest that disruption of the fine-tuned AR protein multivalent interactions might underlie AR-related human pathologies.
Limitations of the study
When we compared AR proteins with 23Q, 69Q or 92Q, we found that the length of polyQ positively correlated with AR condensation propensity, but negatively correlated with AR transcriptional activity. Therefore, our data suggest that an optimal level of AR multivalent interactions is required for its normal activity. But we cannot precisely quantify the optimal multivalent interaction strength. In addition, we do not address how a specific biophysical status of AR condensates affects its cellular function or why there is a “sweet spot” of AR-AR interaction strength for AR function.
In KD/SBMA, polyQ-AR forms inclusions in various neural and non-neural tissues but it’s unclear whether the inclusions are causal, protective, or unrelated to pathology. It has been proposed that the inclusions might not only cause gain-of-function toxicity but also sequester AR proteins, leading to a loss of normal AR function. Indeed, transcriptional dysregulation is found in cellular and mouse models of KD/SBMA,57 but how polyQ expansion regulates AR function in transcription is unclear. Our data suggest that polyQ expansion leads to more “gel/solid-like” AR condensates, resulting in reduced interactions between AR and other enhancer components. Similar effects of polyQ expansion on enhancing condensate propensity and decreasing AR transactivity were observed in differentiated SH-SY5Y neuroblastoma cells and in LNCaP cells (Figures 6 and S7). Our study thus revealed a potential mechanism by which polyQ expansion reduces AR transcriptional activity in KD/SBMA. However, it remains to be tested if this enhancer mechanism can be applied to neural and non-neural cells in vivo.
STAR METHODS
RESOURCE AVAILABILITY
Lead contact
Further information and requests for resources and reagents should be directed to and will be fulfilled by the Lead Contact, Zhijie Liu (LiuZ7@uthscsa.edu).
Materials availability
All unique materials generated in this study, including plasmids and cell lines, will be shared by the lead contact upon request.
Data and code availability
The deep sequencing data reported in this paper is deposited to GEO under GSE215163 and is publicly available as of the date of publication. Additional data reported in this paper are available from the lead author upon request.
This paper does not report original code.
Any additional information required to reanalyze the data reported in this paper is available from the lead contact upon request.
EXPERIMENTAL MODEL AND STUDY PARTICIPANT DETAILS
Cell lines and their culture
LNCaP, U2OS, SH-SY5Y, and 293T cell lines were obtained from ATCC. LNCaP cells were cultured in Roswell Park Memorial Institute (RPMI) 1640 Medium supplemented with 10% FBS and penicillin/streptomycin. U2OS and 293T cells were cultured in Dulbecco's Modified Eagle's Medium (DMEM) supplemented with 10% FBS and penicillin/streptomycin. SH-SY5Y cells were cultured in a 1:1 mixture of DMEM medium and F12 medium supplemented with 10% FBS and penicillin/streptomycin. To induce differentiation of SH-SY5Y cells into neurons, we utilized DMEM supplemented with 3% FBS, 10 mM all-trans-retinoic acid (Sigma), and penicillin/streptomycin as the differentiation medium. All cell lines were grown in a humidified incubator with 5% CO2. For DHT stimulation, cells were hormone stripped for 3 days in phenol red-free media with 5% charcoal-stripped FBS before receiving 100 nM DHT (Sigma) or ethanol vehicle control treatment for 2 hours for androgen signaling induction. We used 1,6-Hexanediol (Sigma) to chemically disrupt phase separation in cells and 2,5-Hexanediol (Sigma) was used as control. 1,6-Hexanediol (1,6-HD) and 2,5-Hexanediol (2,5-HD) were used at 2.5% in the medium for LNCaP or U2OS cells for different treatment timing for different experiments (5 minutes for immunofluorescence imaging and 2 hours for western blot/RT-qPCR/ATAC-seq/GRO-seq). To investigate the interactions of AR-AR and AR-MED1 on the chromatin, we employed the U2OS 2-6-3 cell line, which contains a stable insertion of 200 copies of the p3216PECMS2beta plasmid at a specific genomic locus.13,51 Each copy of p3216PECMS2beta plasmid contains 256 copies of Lac O. Thus, the total Lac O copies in U2OS 2-6-3 line should be 200 x 256 = ~50,000. The culture condition of the U2OS 2-6-3 line is the same as the regular U2OS line that was described above in addition to using 100 ug/ml hygromycin for stable selection. All cell lines were routinely tested to ensure they are free of mycoplasma contamination (VenorTMGeM Mycoplasma Detection Kit, Sigma-Aldrich).
METHOD DETAILS
Protein purification and in vitro droplet formation assays
Protein purification was performed as previously described9 with some modifications. Constructs used for protein purification were generated through gateway LR recombination between entry clones containing AR cDNA and destination vector modified from pET-His-GFP-MED1 (gift from Richard Young Lab). E. coli Rosetta (DE3) competent cells were used as the host strain for protein expression. The cells were transformed with various AR plasmids and protein expression was induced with 0.1 mM IPTG in Luria Broth (LB) containing 1% glucose, 1X Kanamycin, and 0.5X chloramphenicol. The culture was grown overnight at 18°C and pelleted at 3,000 rpm for 10 minutes and either proceeded fresh to lysis or stored at −80°C. The cells were lysed in a Buffer A (50 mM Tris-HCl, pH 7.5, 500 mM NaCl, 10 mM imidazole, protease inhibitor cocktail (Roche)) and subjected to sonication. The total cell lysate was centrifuged at 20,000 rpm for 30 minutes at 4 °C, and the soluble fraction was loaded onto a Ni-NTA agarose resin column (Qiagen) that was pre-equilibrated with Buffer A. The resin-bound protein was washed successively with Buffer A and finally eluted with the elution buffer containing a gradient increase in the concentration of Imidazole (50 mM Tris-HCL, pH 7.5, 500 mM NaCl and 50 mM/100 mM/250 mM Imidazole). The eluted proteins were confirmed by running on a 12% SDS Gel, and the proteins were pooled together and subjected to overnight dialysis (50 mM Tris pH 7.5, 125 mM NaCl, 10% glycerol and 1 mM DTT) at 4°C. The dialyzed proteins were concentrated using the 3K centricon (Millipore, Sigma) and either proceeded fresh for the droplet formation assays or aliquoted and flash frozen in liquid nitrogen and stored at −80°C.
The purified protein was diluted to 40 μM, 20 μM, 10 μM and 5 μM using the dialysis buffer (50 mM Tris pH 7.5, 125 mM NaCl, 10% glycerol and 1 mM DTT). The protein was mixed in a 1:1 ratio with droplet formation buffer (50 mM Tris pH 7.5, 125 mM NaCl, 10% glycerol, 1 mM DTT, with 20% or 40% PEG8000) and 5 μl of the suspension was loaded onto a hand-made cassette with a clean glass slide, spacers, and a coverslip. The droplets were immediately observed under an upright confocal microscope (Zeiss LSM780) using a 100x/1.4 oil objective. ZEN black edition version 2.3 was used for acquisition. Droplet size quantification was done using the “analyze particles” tool of FIJI with the threshold set as the medium area of all particles detected in each image.
Droplet sedimentation assays
Following a previous publication,58 in vitro droplet formation was achieved by mixing 40 μM of GFP-ARNTD recombinant proteins (wt, 7FS, and pQ69) in 1:1 ratio with droplet formation buffer (50mM Tris pH 7.5, 125mM NaCl, 10% glycerol, 1mM DTT, with 40% PEG8000). For droplet sedimentation, samples were centrifuged for 10 minutes at 14,000 rpm, 4 °C. The fraction of supernatant and pellet was used for western blot analyses (1:20 dilution). Anti-AR antibody (Santa Cruz sc-7305) was used for detecting AR protein.
Fluorescence imaging, OptoDroplet assays, and Fluorescence Recovery After Photobleaching (FRAP)
To visualize wildtype and mutant AR proteins in androgen-responsive cells (LNCaP, U2OS, or SH-SY5Y), we transfected them with different GFP-AR plasmids. The backbone plasmid was modified from pEGFP-C3 (Clonetech) by including a gateway cassette to generate a destination vector that is compatible with the gateway cloning system. The GFP-AR constructs used for transfections were generated through gateway LR recombination between entry clones containing AR cDNA and destination vector pEGFP-C3-gw. Cells cultured on coverslips and expressing GFP-tagged AR proteins (stripping for 3 days before vehicle or DHT treatment) were fixed using 4% paraformaldehyde (Sigma) and mounted onto slides using Antifade Mountant with DAPI (Life Technologies, Carlsbad, CA). Images were acquired at Zeiss LSM780 confocal microscope with a 100x/1.4 oil objective. For quantification, we typically counted the number of cells showing GFP-AR foci in every 20 (or 15) GFP-positive cells and plotted the percentage. Puncta fringe visibility was measured as amplitude/average, i.e. (maximal intensity – minimal intensity)/mean intensity. The intensity was measured using ImageJ by drawing a line crossing the center of a puncta followed by line measurement. The line length was approximately twice of the diameter of the puncta. 5 representative puncta were selected from each cell and a total of 30 puncta were measured.
OptoDroplet assay was performed as previously described32 with some modifications. OptoDroplet constructs used in this study were derived from the pCRY2PHR-mCherryN1 plasmid (Addgene #26866). The plasmid was modified by including a gateway cassette to generate pCRY2PHR-mCherry-gw that is compatible with the gateway cloning system. 48 hours after the transfection of CRY2 fusion constructs into 293T cells that were cultured on coated glass coverslips, cells were transferred to a culture chamber for live cell imaging using a 63x/1.4 oil objective on Zeiss LSM780 microscope. Cells were imaged by using 561 nm of laser for mCherry signal before and after CRY2 activation, which was done using 2% power of 488 nm laser for 30 seconds.
Fluorescence Recovery After Photobleaching (FRAP) was done using Zeiss LSM780 confocal microscope. For CRY2 puncta, blue light-induced puncta were bleached using 100% power of 560 nm laser, and their fluorescence recovery was monitored. For DHT-induced GFP-AR puncta, LNCaP cells were cultured on coated glass coverslips and transferred to a culture chamber for live imaging. FRAP was done using 100% of 488 nm laser power. Fluorescence intensity was measured using FIJI. Background intensity was subtracted, and the relative intensity was normalized to pre-bleaching intensity.
AR-AR and AR-MED1 interaction assays with LacO array in U2OS 2-6-3 cell line
Human U2OS 2-6-3 cells containing a LacO array with ~50,000 LacO elements in the genome51 were used to study AR-AR homotypic and AR-MED1 heterotypic interactions on chromatin. eYFP-AR-LacI plasmids (wt, ΔIDR, 7FS, and pQ69), mCherry-AR plasmids (wt, ΔIDR, and 7FS), and mCherry-MED1 plasmid were constructed by the gateway system with our previously constructed eYFP-gw-LacI and mCherry-gw plasmids. For imaging sample preparation, cells were plated on 70% ethanol-pretreated 18 mm circular No. 1 micro cover glasses (Electron Microscopy Sciences) on 12-Well TC Treated Plates (Genesee), and were transfected with the target constructs by using Lipofectamine 3000 Transfection Reagent (Invitrogen™ L3000015) for 24 hours, followed by fixation with 4% paraformaldehyde for 15 minutes.
Fluorescence images were acquired on a Zeiss LSM 980 laser scanning confocal microscope operated by the Biological Imaging Facility of the Beckman Institute at Caltech, using a 63X, NA 1.4 Plan-Apochromat objective. The pinhole size of the mCherry channel was set to 2.00 AU and EYFP channel was set to 1.00 AU, as the resolution was set to 512 x 512 with a digital zoom of 3.0X and line averaging of 2. Excitation laser sources and emission ranges were 514 nm/508-561 nm (EYFP λmax=513 nm, λem=530 nm, shown as green), and 594 nm/561-693 nm (mCherry λmax=587 nm, λem=610 nm, shown as magenta). Each image was collected as a 3D stack of 25-40 images with a spacing of 0.24 μm in the z-direction between slices. Before acquiring the 2-color fluorescence images, we carefully tuned the emission filters to make sure that no bleed-through existed between the two channels and adjusted laser intensity and microscope detector gains to ensure that no pixel in the images was saturated.
We quantified protein-protein interactions from the 2-color images using the following steps. First, we selected the slice (#N) in the EYFP channel z stack where a LacO-associated punctum has the highest fluorescence intensity, located the central pixel of the LacO array, and obtained the radial profiles of fluorescence intensity centering the pixel in both EYFP and mCherry channels. Second, we extracted the EYFP intensity radial profile and estimated the radius of the punctum as the distance from the central pixel at which the derivative of fluorescence intensity to distance first drops to zero. Next, we measured the maximum and peripheral mCherry intensities of the punctum. To average out the intensity noise at the single-pixel level, convolution was applied to image slice #N of the mCherry channel using a 5x5 convolution kernel J5 (all-ones matrix). The intensities of four convoluted pixels surrounding the peak intensity pixel were averaged as Ipeak. Two values on the mCherry intensity radial profile at locations immediately outside the punctum periphery were averaged as Iperiphery. Finally, we calculated the intensity ratio Ipeak/Iperiphery as a measure of the mCherry enrichment at the LacO array. A ratio above 1 suggests protein-protein interactions.
Single-particle tracking (SPT) to investigate the dynamics of AR multivalent interactions at single-molecule level in live cells
Human U2OS cells were transfected with the EGFP-tagged full-length AR (pEGFP-C3-ARwt) or its pQ69 mutant (pEGFP-C3-ARpQ69) and Halo-tagged ARNTDwt (pHalo-ARNTDwt-NLS) or ARNTDpQ69 (pHalo-ARNTDpQ69-NLS) plasmids using Lipofectamine 3000 Transfection Reagent. After ~24 hours of transfection, cells were stained with 5 nM PA-JF646 Halo ligand72 and imaged using the microscope mentioned below. We maintained 100 nM DHT in the cell medium throughout the Halo ligand staining and the imaging experiments to promote translocation of AR from cytoplasm to nucleus and puncta formation.
SPT of Halo-ARNTDwt and Halo-ARNTDpQ69 were performed on a Nikon Eclipse Ti2 TIRF microscope with a 100x/NA 1.49 oil-immersion objective (Nikon, CFI SR HP Apochromat TIRF 100xAC Oil) under highly inclined and laminated optical sheet (HILO) illumination.73 PA-JF646 was activated by a 405 nm laser and excited by a 640 nm laser while EGFP was excited by a 488 nm laser line. The incubation chamber was held humidified at 37°C with 5% CO2 and the objective was also heated to 37°C using an objective heating collar. The fluorescence signals from EGFP and PA-JF646 were split using a 488 long-pass dichroic and then recorded by two EM-CCD cameras. Droplet-like puncta were visualized in the EGFP channel, while individual molecules detected in the PA-JF646 channel were tracked in real time. A low 405 nm activation power was used to ensure sufficiently sparse activation of PA-JF646 labeled proteins and allow for SPT. We used a long camera exposure time (500 ms per frame) so that fast diffusing molecules were blurred out and only bound molecules were detected. We took 3000 frames for each SPT movie. In the EGFP channel, time-lapse images (one frame acquired every 10 s with a frame acquisition time of 500 ms) were taken to track the location of droplet-like puncta during the entire acquisition with minimized levels of photobleaching.
The analysis was performed following previously published work13 and is briefly described below. Single-molecule data from the PA-JF646 channel was analyzed using SLIMfast,74 a GUI based on a MATLAB implementation of the MTT algorithm,75 and is available in the supplemental materials of a previous publication.76 Single-molecule trajectories were extracted using the following parameters: localization error: 10−6; deflation loops: 3; maximum number of competitors: 5; maximal expected diffusion constant (μm2/s): 0.1.
Binary masks of the droplet-like puncta were generated from the EGFP channel using a published ImageJ Macros script.13 Using a published MATLAB code,13 single-molecule trajectories were then sorted into in-puncta and out-of-puncta trajectories based on the fraction of time a molecule spent in the punctum, F. We considered a trajectory with F > 50% to be in-puncta and only focused on the in-puncta trajectories for downstream analyses.
A survival probability curve (binding probability as a function of time) was then generated from the in-puncta trajectories. For similar SPT experiments in previous reports, this curve was often fitted with a two-component exponential decay function where one component represents non-specific binding and the other represents specific binding. However, our data does not fit well with the two-component exponential function because of a significant contribution from aberrantly long trajectories (significantly longer than the photobleaching time of PA-JF646, , measured using H2B as described below). Therefore, we used the following three-component exponential model (Equation-1) to fit the survival probability curve.
| Equation-1 |
with , , and corresponding to nonspecific binding residence time, specific binding residence time, and aberrantly long residence time, respectively.
To characterize the aberrantly long binding events, we measured the photon counts from each detected fluorescent spot used to generate the in-puncta trajectories for both Halo-ARNTDwt and Halo-ARNTDpQ69. We further classified the trajectories into two groups: shorter trajectories () and longer trajectories () and then generated photon count histogram of the detected spots belonging to each group. For both Halo-ARNTDwt and Halo-ARNTDpQ69, the photon counts histogram from the shorter trajectories shows a single peak while the counter one from the longer trajectories shows an additional peak at higher photon counts. This clearly indicates that the longer trajectories are due to multiple molecule binding at the same location. Therefore, to focus on binding of single molecules, we used the specific binding residence time, , extracted using Equation-1 for downstream analyses.
In order to correct for the contribution of photobleaching to , we performed SPT of PA-JF646-labeled Halo-H2B stably expressed in U2OS cells using the illumination and acquisition parameters identical to those used to image Halo-ARNTDwt and Halo-ARNTDpQ69. Since H2B is largely immobile on the chromatin, it is commonly used to measure photobleaching rates.77 Unlike Halo-ARNTDwt and Halo-ARNTDpQ69, the survival probability curves were generated accounting all trajectories of Halo-H2B rather than doing the in-puncta and out-of-puncta classification and fitted to the following two-component exponential model (Equation-2).
| Equation-2 |
with and as the residence times for nonspecific and specific binding respectively.
The corrected specific binding residence times () of Halo-ARNTDwt or Halo-ARNTDpQ69 within EGFP-ARwt or EGFP-ARpQ69 puncta were calculated using the following equation (Equation-3).
| Equation-3 |
Independent transfection and imaging experiments were performed for more than three times, each time on a different day, for SPT of both Halo-ARNTDwt and Halo-ARNTDpQ69. In each imaging session, multiple movies (>8) of either variant, each movie acquired from a different cell, were taken along with more than three movies of Halo-H2B for the correction of photobleaching rate on that specific day. In Figure 6C, we reported the mean corrected residence times.
shRNA lentivirus package and infection
Mission shRNA lentiviral plasmid targeting AR (TRCN0000003718) and control shRNA (SHC002 or SHC202) were purchased from Sigma. Knockdown experiments with shRNA lentiviruses were conducted according to the standard lentivirus package and transduction protocols from Addgene. These pLKO-based lentiviral shRNA plasmids were co-transfected with packaging plasmids (psPAX2 and pMD2.G from Addgene) into 293T cells. Lentiviruses were harvested and used for LNCaP cell infection in the rescue experiments below.
AR rescue experiments in LNCaP cells
To set up the doxycycline-inducible AR-overexpressing LNCaP cell lines, AR cDNAs for wildtype and different mutants synthesized by GenScript (see the details for these cDNAs in the following section) were individually cloned into pCR8/GW/TOPO and then transferred to the pInducer20 destination vector (pInducer20 was a gift from Stephen Elledge; Addgene #44012) using the Gateway system (Life Technologies), followed by co-transfection with packaging plasmids (psPAX2 and pMD2.G from Addgene) into 293T cells to produce lentiviruses. After lentivirus infection, LNCaP cells were selected by 600 μg/ml G418 (Invitrogen) to set up doxycycline-inducible stable cell lines. For the rescue purpose, all AR cDNAs synthesized by GenScript are resistant to AR shRNA TRCN0000003718 because the shRNA target sequence “CACCAATGTCAACTCCAGGAT” inside the 3’ end of AR cDNA was mutated to “TACAAACGTAAATAGTCGAAT” (the protein sequence was maintained the same). For the rescue experiments, doxycycline-inducible AR-overexpressing LNCaP cell lines were infected by either control or AR shRNA lentivirus and selected with 1 μg/ml puromycin and collected for experiments within 5 days (first two days in regular medium and last three days in stripping media before hormone treatment). 20 ng/ml doxycycline was added to the overexpressing samples for 2 days before the 2 hours of vehicle or DHT treatment and collection for experiments including RT-qPCR, Western Blots, and ATAC-seq.
AR cDNAs for wildtype and mutants
The full-length human AR cDNA or protein sequences for wildtype and mutants used in this study are below (all synthesized by GenScript) and all are resistant to AR shRNA TRCN0000003718:
ARwt (wildtype): The cDNA sequence for wildtype AR is from NM_000044, the AR protein sequence has 920 amino acids and it matches with UniProt P10275-1.
ARΔLBD mutant: we deleted the 672-920Aa region from the AR wildtype to get the ARΔLBD mutant (with TGA stop code at the end of the cDNA).
ARΔIDR mutant: we deleted the 1-538Aa region from the AR wildtype to get the ARΔIDR mutant. We have added the ATG start code to the cDNA of ARΔIDR for all expression experiments.
AR7FS mutant: For this mutant, we have replaced all 7 phenylalanine (F) amino acids in AR 1-538Aa region with serine (S). The locations of these 7 phenylalanine (F) amino acids are F23, F27, F171, F312, F367, F439, and F497.
AR2FS mutant: For this mutant, we have replaced 2 phenylalanine (F) amino acids in AR 1-538Aa region with serine (S). The locations of these 2 phenylalanine (F) amino acids are F23 and F27.
AR5FS mutant: For this mutant, we have replaced 5 phenylalanine (F) amino acids in AR 1-538Aa region with serine (S). The locations of these 5 phenylalanine (F) amino acids are F171, F312, F367, F439, and F497.
AR4WS mutant: For this mutant, we have replaced 4 tryptophan (W) amino acids in AR 1-538Aa region with serine (S). The locations of these 4 tryptophan (W) amino acids are W399, W435, W503, and W527.
ARpQ69 mutant: For this polyQ expansion mutation, we have added additional 46 glutamine (Q) right after the wildtype’s original 23 polyQ track (58-80Aa location) to get a pQ69 mutant.
ARpQ92 mutant: For this polyQ expansion mutation, we have added additional 69 glutamine (Q) right after the wildtype’s original 23 polyQ track (58-80Aa location) to get a pQ92 mutant.
ERαIDR-ARΔIDR mutant: For this swapping mutant, we replaced the AR 1-538Aa IDR region with the IDR region (1-185Aa) from ERα protein (UniProt P03372-1).
FUSIDR-ARΔIDR mutant: For this swapping mutant, we replaced the AR 1-538Aa IDR region with the IDR region (1-214Aa) from FUS protein (UniProt P35637-1).
TAF15IDR-ARΔIDR mutant: For this swapping mutant, we replaced the AR 1-538Aa IDR region with the IDR region (1-205Aa) from TAF15 protein (UniProt Q92804-1).
Western blotting assays
Whole cell lysates or nuclear fractions were extracted for Western blotting assays. Cells or nuclei were lysed in RIPA lysis buffer (50 mM Tris-Cl pH 8.0, 150 mM NaCl, NP-40, 0.5% sodium deoxycholate, 0.1% SDS) supplemented with 1 mM DTT, 1 mM PMSF, and 1x protease inhibitor cocktail (Roche). Protein concentrations were quantified with the BioRad protein assay kit. Western blotting was performed as previously described.6 Briefly, 30 μg of protein extracts were loaded and separated by SDS-PAGE gels. Blotting was performed with standard protocols using PVDF membrane (BioRad). Membranes were blocked for 1 hour in blocking buffer (5% Non-fat milk in PBST) and probed with primary antibodies at 4°C overnight. After three washes with PBST, the membranes were incubated with HRP-conjugated secondary antibody. Signals were visualized with Clarity Western ECL Substrate (BioRad) as described by the manufacturer. The antibodies used in this assay were: anti-AR (sc-815 for recognizing the C-terminus of AR and sc-7305 for recognizing the N-terminus of AR, Santa Cruz), anti-ERα (sc-8005 for recognizing 2-185Aa region of N-terminal of ERα, Santa Cruz), anti-FUS (sc-373698 for recognizing 2-27Aa region of N-terminal of FUS, Santa Cruz), anti-TAF15 (PA5-84610 for recognizing 55-105Aa region of N-terminal of TAF15, Invitrogen), anti-Histone H3 (A01502, GenScript), anti-Flag (F1804, Sigma), anti-Myc (2276S, Cell Signaling Technology), and anti-GAPDH (sc-25778, Santa Cruz). For the BioID system, the in vivo proximity biotinylation events mediated by BioID-tagged AR can be detected by Western blot using streptavidin-HRP (016-030-084, Jackson ImmunoResearch).
RNA isolation and quantitative RT-PCR
Total RNA was isolated with RNeasy Mini Kit (Qiagen) according to the manufacturer’s protocol and 1μg RNA was used to convert to cDNA using iScript Select cDNA Synthesis Kit (BioRAD) in the presence of both oligo (dT) and random primers. qPCR was conducted with SsoAdvanced Universal SYBR Green Supermix (BioRAD) using CFX384 Real-Time PCR Detection System (BioRAD) according to the manufacturer’s instructions. We performed qPCR to test DHT-induced gene activation from gene bodies and also for enhancer activation by testing the levels of eRNAs that are transcribed from enhancer regions. Relative expression of RNAs was determined by the ΔΔCT method using GAPDH as an internal control for quantification analyses of gene targets. Primer sets used in qPCR are as follows: GAPDH: F: ACATCATCCCTGCCTCTACTGG, R: GTTTTTCTAGACGGCAGGTCAGG; AR: F: TGTCCATCTTGTCGTCTTCG, R: GCTTCTGGGTTGTCTCCTCA; KLK2: F: AGCCTGCCAAGATCACAGAT, R: GCAAGAACTCCTCTGGTTCG; NKX3-1: F: GCCAAGAACCTCAAGCTCAC, R: AGAAGGCCTCCTCTTTCAGG; TMPRSS2: F: CTGGTGGCTGATAGGGGAT, R: GTCTGCCCTCATTTGTCGAT; NKX3-1 enhancer: F: ACGTAGAAGCCTCTGCTCTAAA, R: GCAATCTTTGGGCCCTGTAATA; TMPRSS2 enhancer: F: GATGATGAGGTCGTCACAGG, R: CTTCCACGTGCATCTCACAC.
Luciferase assays
293T or SH-SY5Y cells were seeded at 20,000 cells per well to 96-well white plate with a transparent bottom (Corning) that had been pre-coated with Poly-D-lysine (Sigma). After overnight, cells were transfected using lipofectamine 2000 (Life Technologies). A DNA mixture was prepared with 600 ng of pEGFP-C3-AR, 200 ng of pCMV-Renilla-3XARE-TATA-luciferase (this construct was generated through gateway LR recombination between entry clone containing 3xARE sequence cloned from Addgene #132360 and destination vector Addgene #101139) and diluted with 100 ul Opti-MEM (Gibco) for transfection of 8 wells of 96-well plate. At the same time, 2 ul of Lipofectamine 2000 was diluted in 100 ul Opti-MEM for transfection of 8 wells of the 96-well plate. After 5 minutes, the diluted Lipofectamine 2000 was mixed with the DNA mixture. During the 20-minute incubation of DNA-lipo transfection mix, cells were washed twice with 100 ul DPBS (Gibco) and incubated with 50 ul of DMEM stripping media. Past the incubation time, 25 ul of the transfection mix was added to each well of the 96-well plate seeded with 293T or SH-SY5Y cells (8 wells for each AR transfection) and incubated for 24 hours. Then cells had the transfection media removed and were treated in quadruplicates with 100 nM EtOH and 100 nM DHT for 24 hours. 48 hours past transfection, firefly and renilla signals were quantified using the Dual-Glo assay kit (Promega) according to its instructions and measured by Cytation 5 machine. The ratio of FLuc/RLuc for each well was calculated and plotted by the average of treatments.
BioID system setup and pulldown experiments
The BioID system has been described in our previous publications.5,7 The AR cDNAs (wt, ΔIDR, and pQ69) were cloned into pRetroX-mycBioID-MCS at the Not I and Mlu I sites by Gibson reaction (NEB) to get pRetroX-mycBioID-AR. pRetroX-mycBioID-AR for wt, ΔIDR, and pQ69 were co-transfected with pCL-Ampho packaging plasmid into 293T cell line to produce retroviruses. Retroviruses were used to transduce a parental LNCaP stable line that was engineered to stably express a Tet Repressor using a retroviral vector. G418 (300 μg/ml) and puromycin (0.3 μg/ml) were used for stable selection. Multiple stable cell lines for each BioID transduction were isolated, treated with doxycycline, and screened for BioID-tagged protein expression that was similar to the levels of the respective endogenous genes as revealed by immunoblotting with AR antibody.
The established BioID stable lines were transduced with AR shRNA TRCN0000003718 to knock down the endogenous AR expression level, which will prevent the homodimerization between endogenous wildtype AR protein with overexpressed AR mutants (for a background negative control, we used the LNCaP TetR parental stable line and transduced it with control shRNA to confirm the knockdown efficiency of other lines). All BioID stable cell lines that originally grew in regular medium were washed with PBS three times and started stripping three days before DHT stimulation. To induce mycBioID-AR protein expression, 2 μg/ml doxycycline was added into stripping culture media approximately 24 hours before DHT treatment for 1 hour, followed by incubation with 50mM Biotin for another 24 hours to label all proteins in the proximity of AR before collection.
To identify AR-associated cofactors on chromatin, we purified nuclear fraction for analyses of biotin-labeled proteins. Cytoplasmic and nuclear lysates were isolated as previously described with slight modification.78 Briefly, cells were scraped from 15 cm dish plates and washed with cold PBS. For every 70 mg of cells, 1 mL of cold Hypotonic Lysis Buffer (HLB) (10 mM Tris-HCl pH 7.5, 3 mM MgCl2, 10 mM NaCl, 0.3% NP-40, 10% glycerol, and 1x protease inhibitor) was used to resuspend the cells followed by the incubation on ice for 10 minutes. Cells were then centrifuged at 800 g for 8 minutes at 4°C. The supernatant was collected as cytoplasmic lysate fraction. The precipitated nuclei were washed 4 times with HLB by pipetting and centrifuging at 200 g for 2 minutes at 4 °C. After HLB washes, the nuclei were resuspended in 0.5 mL of ice-cold Modified RIPA buffer (MRB) (50 mM Tris-HCl pH 7.4, 0.1% SDS, 0.5% sodium deoxycholate, 1% NP-40, 6 mM MgCl2, 150 mM NaCl, 1 mM EDTA, 1 mM DTT, and 1x protease inhibitor). The nuclei pellet in MRB was sonicated till the solution turned clear. 25 U/ml Benzonase and 4 U/ml DNase I were added to the solution and incubated at RT for 30 minutes to digest the chromatin. The solution was then centrifuged at 18,000 g for 15 minutes at 4°C to pellet insoluble protein and other components. The supernatant was collected as the nuclear lysate fraction for the pulldown experiments. For each sample, a small aliquot for each fraction was kept for fractioning result testing using GAPDH and Histone H3 western blots before proceeding with BioID pulldown experiments below.
For BioID pulldown, each nuclear lysate fraction was incubated with 200 μl PBS-washed MyOne Streptavidin T1 Dynabeads (Life Technologies) with overnight rotation at 4°C to pull down all biotinylated proteins in the nuclear lysate. On Day two, the beads were washed 5 times with RIPA buffer (50 mM Tris PH 7.4, 0.4% SDS, 0.1% Triton X-100, 1% NP-40, 300 mM NaCl, 1 mM EDTA, 0.5% sodium deoxycholate, 1 mM DTT) with 10 minutes rotation for each wash (Note: only the first two washes need to use the buffer containing protease inhibitor and be incubated at 4°C. The last three washes can be done at RT without protease inhibitor). After 5X washes with RIPA, the beads were then washed twice more with stringent RIPA buffer containing 5% SDS and then 4X washes with PBS to get rid of SDS residue that might affect trypsin digestion during mass spectrometry. For the 4th wash, only 200 μl PBS was used. 10% (20 μl) PBS with beads was transferred to another tube for western blot tests. 90% (180 μl) PBS with beads was kept in the original tube for mass spectrometry. Both tubes were placed on a magnetic stand for 3 minutes, and then all PBS was removed. For western blot tests, the beads were boiled 10 minutes in 2x protein loading buffer with 5% β-Me to release proteins. For mass spectrometry, beads were stored at −80°C before shipping to the Proteomics Core at Sanford-Burnham-Prebys Medical Discovery Institute.
Mass spectrometry for BioID pulldown beads
Following immunoprecipitation and washes, proteins were digested directly on the beads. Proteins bound to the beads were resuspended with 8 M urea, 50 mM ammonium bicarbonate, and cysteine disulfide bonds were reduced with 5 mM tris(2-carboxyethyl)phosphine (TCEP) at 30°C for 60 minutes followed by cysteine alkylation with 15 mM iodoacetamide (IAA) in the dark at RT for 30 minutes. Following alkylation, urea was diluted to 1 M using 50 mM ammonium bicarbonate, and proteins were finally subjected to overnight digestion with mass spec grade Trypsin/Lys-C mix (Promega). Finally, beads were pulled down and the solution with peptides was collected into a fresh tube. The beads were then washed once with 50 mM ammonium bicarbonate to increase peptide recovery. Following overnight digestion, samples were acidified with formic acid (FA) and subsequently desalted using AssayMap C18 cartridges mounted on an Agilent AssayMap BRAVO liquid handling system. C18 cartridges were first conditioned with 100% acetonitrile (ACN), followed by 0.1% FA. Samples were then loaded onto the conditioned C18 cartridge, washed with 0.1% FA, and eluted with 60% CAN and 0.1% FA. Finally, the organic solvent was removed in a SpeedVac concentrator prior to LC-MS/MS analysis. Before injecting in the LC-MS, total sample peptide amount was determined by Pierce Quantitative Colorimetric Peptide Assay (ThermoFisher).
Dried samples were reconstituted with 2% acetonitrile and 0.1% formic acid and then analyzed by LC-MS/MS using a Proxeon EASY nanoLC system (ThermoFisher) coupled to Elite mass spectrometer (ThermoFisher). Peptides were separated using an analytical C18 Acclaim PepMap column 75 μm x 500 mm, 2 μm particles (ThermoFisher) in 121 minutes at a flow rate of 300 nL/minute: 1% to 6% B in 1 minute, 6% to 23% B in 56 minutes, 23% to 34% B in 37 minutes, 34% to 48% B in 26 minutes, and 48% to 98% B in 1 minute (A = Formic acid 0.1%; B = 80% ACN: 0.1% Formic acid).
The mass spectrometer was operated in positive data-dependent acquisition mode. MS1 spectra were measured in the Orbitrap with a resolution of 60,000 (AGC target of 1e6, and a mass range from 350 to 1450 m/z). Up to 10 MS2 spectra per duty cycle were triggered, CID-fragmented, and acquired in the linear ion trap (AGC target of 1e4, isolation window of 2 m/z, and a normalized collision energy of 35). Dynamic exclusion was enabled with a duration of 30 seconds.
MS raw files were analyzed by MaxQuant79 software with most default settings, and Andromeda80 search engine was used to search against the human Uniprot database. The false discovery rate was set to 0.01 for proteins and peptides with a minimum length of seven amino acids. Variable modifications were set to methionine oxidation and N-terminal acetylation, while fixed modification was set to carbamidomethylation. For label-free protein quantification,81 the minimum ratio count was set to two and peptides for quantification was set to unique and razor. Statistical analysis was performed by Perseus.82 Proteins identified only by site, reverse hits or potential contaminants were removed before downstream analysis. LFQ intensities were log2 transformed, and the matrix was then grouped based on different genetic conditions. The proteins were then filtered by requiring at least two valid values in at least one cell line. Missing values were imputed based on a normal distribution. All the proteins with reduced MS/MS counts in both replicates of ARΔIDR or ARpQ69 compared to ARwt were uploaded to Enrichr for gene ontology enrichment analyses.83
ATAC-seq
ATAC-seq library prep was performed as previously described.84 Briefly, 50,000 cells were washed three times with cold PBS, collected by centrifugation then lysed in lysis buffer (10 mM Tris-HCl, pH 7.4, 10 mM NaCl, 3 mM MgCl2, 0.1% NP-40). After purification of nuclei, transposition was performed with Tn5 transposase from Nextera DNA Library Prep Kit (Illumina, catalog # FC-121-1030). Purified DNA was then ligated with adapters, amplified and size selected for sequencing. Libraries were sequenced with Illumina HiSeq3000 or Illumina NovaSeq6000.
Global run-on sequencing (GRO-seq)
To investigate the effect of chemical disruption of AR condensation on androgen-induced transcription, we performed GRO-seq in LNCaP. LNCaP cells were cultured in stripping media for 3 days and then treated with ethanol vehicle control, 100 nM DHT, 100 nM DHT+2.5% 1,6-HD, or 100 nM DHT+2.5% 2,5-HD for 2 hours before collection for GRO-seq. GRO-seq experiments were performed as previously reported.6 Briefly, ~5-10 million LNCaP cells treated with four different conditions (vehicle, DHT, DHT+1,6-HD, DHT+2,5-HD) were washed 3 times with cold PBS and then sequentially swelled in swelling buffer (10 mM Tris-HCl pH7.5, 2 mM MgCl2, 3 mM CaCl2) for 10 minutes on ice, harvested, and lysed in lysis buffer (swelling buffer plus 0.5% NP-40, 20 units of SUPERase-In, and 10% glycerol). The resultant nuclei were washed two more times with 10 ml lysis buffer and finally re-suspended in 100 μl of freezing buffer (50 mM Tris-HCl pH8.3, 40% glycerol, 5 mM MgCl2, 0.1 mM EDTA). For the run-on assay, re-suspended nuclei were mixed with an equal volume of reaction buffer (10 mM Tris-HCl pH 8.0, 5 mM MgCl2, 1 mM DTT, 300 mM KCl, 20 units of SUPERase-In, 1% sarkosyl, 500 μM ATP, GTP, and Br-UTP, 2 μM CTP) and incubated for 5 minutes at 30°C. The resultant nuclear-run-on RNA (NRO-RNA) was then extracted with TRIzol LS reagent (Life Technologies) following the manufacturer’s instructions. NRO-RNA was fragmented to ~300-500 nt by alkaline base hydrolysis on ice for 30 minutes followed by treatment with DNase I and antarctic phosphatase. At this step, only a small portion of all the RNA species was Br-UTP-labeled. To purify the Br-UTP labeled nascent RNA, the fragmented NRO-RNA was immunoprecipitated with anti-BrdU agarose beads (Santa Cruz Biotechnology) in binding buffer (0.5xSSPE, 1 mM EDTA, 0.05% tween) for 1-3 hours at 4°C with rotation. Subsequently, T4 PNK was used to repair the ends of the immunoprecipitated Br-UTP labeled nascent RNA at 37°C for 1 hour. The RNA was extracted and precipitated using acidic phenol-chloroform.
The RNA fragments were subjected to poly-A tailing reaction by poly-A polymerase (NEB) for 30 minutes at 37°C. Subsequently, reverse transcription was performed using oNTI223 primer and SuperScript III RT kit (Life Technologies). The cDNA products were separated on a 10% polyacrylamide TBE-urea gel, and only those fragments migrating between 100-500 bp were excised and recovered by gel extraction. Next, the first-strand cDNA was circularized by CircLigase (Epicentre) and re-linearized by APE1 (NEB). Re-linearized single-stranded cDNA (sscDNA) was separated on a 10% polyacrylamide TBE gel and the appropriately sized product (~120-320 bp) was excised and gel-extracted. Finally, the sscDNA template was amplified by PCR using the Phusion High-Fidelity enzyme (NEB) according to the manufacturer’s instructions. The oligonucleotide primers oNTI200 and oNTI201 were used to generate DNA libraries for deep sequencing with Illumina HiSeq3000 or Illumina NovaSeq6000. The sequences for primers oNTI223, oNTI200, and oNTI201 are as follows: oNTI223-TruSeqLT: /5Phos/AGATCGGAAGAGCGTCGTGTA/idSp/CAGACGTGTGCTCTTCCGATC TTTT TTT TTT TTT TTT TTT TVN oNTI201-TruseqLT: 5’AATGATACGGCGACCACCGAGATCTACACTCTTTCCCTACACGACGCTCTTCCGATCT 3’ oNTI200-TruSeqID1: 5'CAAGCAGAAGACGGCATACGAGAT CGTGAT GTGACTGGAGTT CAGACGTGTGCTCTT CCGATC 3'
Establishing stable cell lines expressing BLRP-Tagged AR and biotin ChIP-seq
To study genome-wide binding patterns for wildtype and mutants of AR, we have established a parental LNCaP stable cell line that expressed BirA enzyme and Tet-Repressor similar to what we have done previously in MCF7 cells.6 We then used this parental cell line to establish doxycycline-inducible stable cell lines expressing BLRP-tagged wildtype or mutant AR proteins (the cDNAs are resistant to AR shRNA TRCN0000003718) at close to endogenous levels as our previous reports.6,7 For each line, we have prepared two different cell samples for biotin ChIP: the control one was transduced with control shRNA and not treated with doxycycline; the experimental sample was transduced with AR shRNA TRCN0000003718 and treated by 2 μg/ml doxycycline for 24 hours. Both cell samples were hormone-stripped in phenol red-free RPMI1640 medium plus 5% charcoal-treated FBS for 3 days, followed by treatment with 100 nM DHT for 2 hours before collection for biotin ChIP experiments. Biotin ChIP experiments for BLRP-tagged wildtype or mutant AR were performed with our previously published protocol.6 Briefly, cross-linked protein-DNA complexes were pulled down by Nanolink Streptavidin Magnetic beads (Solulink) and the washing was performed under much more stringent conditions that included 4 washes with 1% SDS in TE (20 minutes each) and two washes with 1% Triton X-100 in TE. The washed streptavidin beads were then subjected to AcTEV protease (Life Technologies) digestion twice for tagged protein-DNA complex elution before de-crosslinking at 65°C overnight. After de-crosslinking overnight at 65°C, the final ChIP DNA was extracted and purified using QIAquick spin columns (Qiagen). BLRP-tagged AR inducible cell lines without doxycycline induction were used as ChIP-seq control for background detection. The ChIP-seq libraries were constructed using KAPA’s HyperPrep kit (KK8504), followed by deep sequencing with Illumina’s HiSeq 3000 system according to the manufacturer’s instructions.
QUANTIFICATION AND STATISTICAL ANALYSIS
Statistical analysis
Each experiment was repeated at least twice to make sure that the results are reproducible. Results are representative of at least three biological replicates and reported as mean ± SEM or mean ± SD. Data were analyzed and statistics were performed using unpaired two-tailed Student’s t-tests or one-way ANOVA (Prism 5 GraphPad). Significant differences between two groups were noted by asterisks (* P<0.05, ** P<0.01, *** P<0.001).
ChIP-seq data analysis
We retrieved publicly available AR and H3K27ac ChIP-seq data from GSE83860 and GSE51621 respectively. Reads were aligned to the human genome (hg19) using bowtie with “--best --strata –m 1” parameters.85 Duplicated reads were eliminated for subsequent analysis. MACS2 was employed to call peaks comparing immunoprecipitated chromatin with input chromatin using standard parameters and a q-value cutoff of 1e-5.86 The peaks overlapping with the blacklist regions from UCSC were removed. The H3K27ac peaks located 10kb away from transcriptional start sites of annotated genes were defined as enhancers, and those co-localized with AR peaks were defined as AR-bound enhancers. Since the most active AR-bound enhancer regions usually generate strong eRNA signals upon DHT treatment, we further derived 1,158 active AR enhancers based on the induction of eRNA from GRO-seq data comparing DHT with vehicle conditions. 1,500 randomly selected non-AR bound enhancers were used as control.
For Biotin ChIP-seq results, reads were aligned to the human genome (hg19) using bowtie v1.1.2 with “--best --strata –m 1” parameters.85 Only uniquely mapped and without-duplication reads were selected for subsequent analysis. MACS2 was employed to call peaks by comparing immunoprecipitated chromatin with input chromatin using standard parameters and a q-value cutoff of 1e-5.86 The peaks overlapping with the blacklist regions downloaded from UCSC were removed. ChIPseeker was used to annotate the peaks.87
For all the aggregation plots, the signal fold change (FC) was calculated as the ratio of average tag density. The library-size normalized tag density within a 1 kb region around the peak center (+/− 500 bp) from each condition was used for calculation. P-value was determined by Wilcoxon signed-rank test.
ATAC-seq data analysis
ATAC-seq reads were adapter trimmed using cutadapt 1.11, and aligned to the human genome (hg19) using bowtie with parameters “--best --strata –m 1 –v 2”.88 Aligned reads with the same genomic position and orientation were collapsed to a single read. The reads were extended to 200bp and normalized to a sequencing depth of ten million reads for each library.
In Figure S6J, we merged all called peaks in ARwt, ARΔIDR, ERαIDR-ARΔIDR, FUSIDR-ARΔIDR, and TAF15IDR-ARΔIDR rescue conditions (under shAR+Dox+DHT treatment) into a pool. We then calculated the number of reads overlapped with a 400 bp window centered on those pool-peaks. The next step involved normalizing the values based on the sequencing depth of each sample. The normalized value for each peak represented its degree of chromatin accessibility. Finally, we compared the overall change in chromatin accessibility between ARwt and each IDR replacement mutant and ARΔIDR.
GRO-seq data analysis
GRO-seq reads were aligned to the human genome (hg19) using bowtie with “--best --strata –m 1 –v 2” parameters. Duplicated reads were eliminated for subsequent analysis. To balance the clonal amplification bias and total useful reads, only three reads at most were allowed for each unique genomic position. When measuring the expression level of genes, mapped reads from the first 30 kb of the gene body were counted, excluding promoter-proximal region (transcription start site (TSS) to 1000 bp downstream of TSS; if the length of a gene is shorter than 10kb, then the reads mapped to first 10%*length regions were excluded). If the length of a gene is shorter than 30kb, then mapped reads from the whole gene were counted, excluding promoter-proximal region and gene end (500 bp upstream of transcription termination site (TTS) to TTS).
Data visualization
All ChIP-seq, ATAC-seq, and GRO-seq data was visualized in Integrative Genomics Viewer (IGV).89 For GRO-seq, the reads were separated by strand and extended to a length of 100 nt in the 5’-to’3’ direction; for ChIP-seq and ATAC-seq, the reads were extended to 200 nt in the 5’-to-3’ direction. All data were normalized to 10 million uniquely mapped reads per experiment. A customized R script was used to generate heatmap and line plots for ChIP-seq, ATAC-seq, and GRO-seq data.
The GEO accession number for all deep sequencing data reported in this paper is GSE215163, which includes the ChIP-seq data set (GSE215161), ATAC-seq data set (GSE215160), and GRO-seq data set (GSE215162).
We also used some published ChIP-seq data from the Gene Expression Omnibus database for AR and H3K27ac under accession number GSE8386039 and GSE5162140 respectively.
Supplementary Material
Supplemental Video 1. SPT reveals increased residence time of AR condensates resulted from polyQ expansion. Related to Figures 5 and 6.
A two-color real-time movie showcasing individual molecules of Halo-ARNTDwt labeled with 5 nM PA-JF646 (magenta) binding to the puncta of GFP-ARwt (green) in U2OS cells. The average residence time of Halo-ARNTDwt within the puncta is 6.4 ± 1.0 seconds.
Supplemental Video 2. SPT reveals increased residence time of AR condensates resulted from polyQ expansion. Related to Figures 5 and 6.
A two-color real-time movie displaying individual molecules of Halo-ARNTDpQ69 labeled with 5 nM PA-JF646 (magenta) binding to the puncta of GFP-ARpQ69 (green) in U2OS cells. The average residence time of Halo-ARNTDpQ69 within the puncta is 16.0 ± 4.3 seconds.
Key resources table
| REAGENT or RESOURCE | SOURCE | IDENTIFIER |
|---|---|---|
| Antibodies | ||
| Mouse monoclonal anti-AR | Santa Cruz Biotechnology | Cat# sc-7305; RRID: AB_626671 |
| Rabbit polyclonal anti-AR | Santa Cruz Biotechnology | Cat# sc-815; RRID: AB_630864 |
| Mouse monoclonal anti-ERα | Santa Cruz Biotechnology | Cat# sc-8005; RRID: AB_627556 |
| Mouse monoclonal anti-FUS | Santa Cruz Biotechnology | Cat# sc-373698; RRID: AB_10917550 |
| Mouse monoclonal anti-TAF15 | Invitrogen | Cat# PA5-84610; RRID: AB_2791761 |
| Rabbit polyclonal anti-Histone H3 | GenScript | Cat# A01502; RRID: AB_1968828 |
| Mouse monoclonal anti-FLAG M2 | Sigma-Aldrich | Cat# F1804; RRID: AB_262044 |
| Mouse monoclonal anti-Myc | Cell Signaling Technology | Cat# 2276S; RRID: AB_331783 |
| Rabbit polyclonal anti-GAPDH | Santa Cruz Biotechnology | Cat# sc-25778; RRID: AB_10167668 |
| Streptavidin-HRP | Jackson ImmunoResearch Laboratories | Cat# 016-030-084; RRID: AB_2337238 |
| Bacterial and Virus Strains | ||
| DH5α Chemically Competent E. coli. | New England Biolabs | Cat# C2987I |
| Rosetta (DE3) E. coli. | Sigma-Aldrich | Cat# 70954 |
| DB3.1 E. coli | Invitrogen | Cat# 11782-018 |
| STBL3 Chemically Competent E. coli. | Life Technologies | Cat# C737303 |
| Chemicals, Peptides, and Recombinant Proteins | ||
| 5α-Dihydrotestosterone (DHT) | Sigma-Aldrich | Cat# D-073 |
| 1,6-Hexanediol (1,6-HD) | Sigma-Aldrich | Cat# 240117 |
| 2,5-Hexanediol (2,5-HD) | Sigma-Aldrich | Cat# H11904 |
| Puromycin | Sigma-Aldrich | Cat# P9620 |
| Hygromycin B | Life Technologies | Cat# 10687010 |
| G418 | Life Technologies | Cat# 10131027 |
| Biotin | Sigma-Aldrich | Cat# B4501 |
| Polybrene | Sigma-Aldrich | Cat# H9268 |
| cOmplete™ Protease Inhibitor Cocktail | Roche | Cat# 11836145001 |
| Ni-NTA Agarose | Qiagen | Cat# 30210 |
| Lipofectamine™ 2000 | Life Technologies | Cat# 11668019 |
| Lipofectamine™ 3000 | Life Technologies | Cat# L3000015 |
| Poly-D-lysine | Sigma-Aldrich | Cat# P7280 |
| Formaldehyde | Sigma-Aldrich | Cat# F8775 |
| Paraformaldehyde | Sigma-Aldrich | Cat# P6148 |
| PA-JF646 Halo ligand | Gift from Dr. Luke Lavis lab | N/A |
| Doxycycline | Clontech | Cat# 631311 |
| Trypsin/Lys-C Mix, Mass Spec Grade | Promega | Cat# V5071 |
| SUPERase-In™ RNase Inhibitor | Life Technologies | Cat# AM2696 |
| N-Lauroylsarcosine sodium salt solution (Sarkosyl) | Sigma-Aldrich | Cat# L7414 |
| 5-Bromouridine 5′-triphosphate sodium salt (BrUTP) | Sigma-Aldrich | Cat# B7166 |
| Antarctic phosphatase | New England BioLabs | Cat# M0289S |
| anti-BrdU agarose beads | Santa Cruz Biotechnology | Cat# sc-32323 AC |
| poly-A polymerase | New England BioLabs | Cat# M0276S |
| SuperScript™ III RT kit | Life Technologies | Cat# 18080-051 |
| CircLigase™ ssDNA Ligase | Epicentre | Cat# CL4111K |
| Ape1 | New England BioLabs | Cat# M0282S |
| Phusion® High-Fidelity DNA Polymerase | New England BioLabs | Cat# M0530L |
| Gibson Assembly® Master Mix | New England BioLabs | Cat# E2611L |
| Proteinase K, recombinant, PCR Grade | Roche | Cat# 3115879001 |
| RNase | Sigma-Aldrich | Cat# R6513 |
| TRIzol™ LS Reagent | Life Technologies | Cat# 10296028 |
| T4 PNK | New England BioLabs | Cat# M0201S |
| DNase I | Life Technologies | Cat# AM2222 |
| Benzonase® Nuclease | EMD Millipore | Cat# 70746 |
| MyOne™ Streptavidin T1 Dynabeads™ | Life Technologies | Cat# 65602 |
| Nanolink® Streptavidin Magnetic beads | Solulink | Cat# M-1002-010 |
| AcTEV™ Protease | Life Technologies | Cat# 12575015 |
| PEG8000 | Sigma-Aldrich | Cat# 89510 |
| BioRad protein assay | BioRAD | Cat# 5000001 |
| Critical Commercial Assays | ||
| pCR™8/GW/TOPO™ TA Cloning Kit | Life Technologies | Cat# K250020 |
| Gateway™ LR Clonase™ II Enzyme mix | Life Technologies | Cat# 11791100 |
| Dual-Glo® Luciferase Assay System | Promega | Cat# E2940 |
| Antifade mountant with DAPI | Life Technologies | Cat# P36931 |
| RNeasy Mini Kit | Qiagen | Cat# 74106 |
| iScript™ Select cDNA Synthesis Kit | BioRAD | Cat# 1708897 |
| SsoAdvanced™ Universal SYBR® Green Supermix | BioRAD | Cat# 1725275 |
| QIAquick spin columns | Qiagen | Cat# 28115 |
| KAPA Hyper Prep kit | Kapa Biosystems | Cat# KK8504 |
| Nextera DNA Library Prep Kit | Illumina | Cat# FC-121-1030 |
| Deposited Data | ||
| Raw and processed sequencing data for ChIP-seq | This paper | GEO: GSE215161 |
| Raw and processed sequencing data for ATAC-seq | This paper | GEO: GSE215160 |
| Raw and processed sequencing data for GRO-seq | This paper | GEO: GSE215162 |
| AR ChIP-seq | Malinen et al.39 | GEO: GSE83860 |
| H3K27ac ChIP-seq | Hazelett et al.40 | GEO: GSE51621 |
| Experimental Models: Cell Lines | ||
| Human: LNCaP | ATCC | Cat# CRL-1740 |
| Human: U2OS | ATCC | Cat# HTB-96 |
| Human: SH-SY5Y | ATCC | Cat# CRL-2266 |
| Human: HEK293T | ATCC | Cat# CRL-3216 |
| Human: U2OS 2-6-3 | Janicki et al.51 | N/A |
| Human: LNCaP-pInducer20-AR stable lines for wildtype and mutants | This paper | N/A |
| Human: LNCaP-TetR stable line | This paper | N/A |
| Human: LNCaP-TetR-BioID-AR stable lines for wt, ΔIDR, and pQ69 | This paper | N/A |
| Human: LNCaP-BirA-TetR stable line | This paper | N/A |
| Human: LNCaP-BirA-TetR-BLRP-AR stable lines for wt, ΔIDR, and pQ69 | This paper | N/A |
| Oligonucleotides | ||
| Primers or oligos for qPCR and GRO-seq see METHOD DETAILS | This paper | N/A |
| Recombinant DNA | ||
| shAR | Sigma-Aldrich | TRCN0000003718 |
| shControl | Sigma-Aldrich | SHC002 |
| shControl | Sigma-Aldrich | SHC202 |
| pET-His-GFP-gw | This paper | N/A |
| pET-His-GFP-ARNTD for wildtype and mutants | This paper | N/A |
| pEGFP-C3-gw | This paper | N/A |
| pEGFP-C3-AR for wildtype and mutants | This paper | N/A |
| pCRY2PHR-mCherryN1 | Addgene | Plasmid ID: #26866 |
| pCRY2PHR-mCherry-gw | This paper | N/A |
| pCRY2PHR-mCherry-AR for NTD and ΔIDR | This paper | N/A |
| eYFP-gw-LacI | This paper | N/A |
| eYFP-AR-LacI for wt, ΔIDR, 7FS, and pQ69 | This paper | N/A |
| mCherry-gw | This paper | N/A |
| mCherry-AR for wt, ΔIDR, and 7FS | This paper | N/A |
| mCherry-MED1 | This paper | N/A |
| pHalo-gw-NLS | This paper | N/A |
| pHalo-ARNTDwt-NLS | This paper | N/A |
| pHalo-ARNTDpQ69-NLS | This paper | N/A |
| pInducer20 | Addgene | Plasmid ID: #44012 |
| pInducer20-AR for wildtype and mutants | This paper | N/A |
| pCMV-Renilla-3XARE-TATA-luciferase | This paper | N/A |
| pRetroX-mycBioID-MCS | This paper | N/A |
| pRetroX-mycBioID-AR for wt, ΔIDR, and pQ69 | This paper | N/A |
| pRetroX-BLRP-MCS | This paper | N/A |
| pRetroX-BLRP-AR for wt, ΔIDR, and pQ69 | This paper | N/A |
| pCL-Ampho | Novus Biologicals | Cat# NBP2-29541 |
| pMD2.G | Addgene | Plasmid ID: #12259 |
| psPAX2 | Addgene | Plasmid ID: #12260 |
| Software and Algorithms | ||
| SLIMfast | Teves et al.76 | https://doi.org/10.7554/eLife.22280.022 |
| ImageJ Macros script and MATLAB code for quantifying protein binding residence times from SPT data | Chong et al.13 | http://doi.org/10.5281/zenodo.8292534 |
| Bowtie v1.1.2 | Langmead et al.85 | http://bowtie-bio.sourceforge.net/index.shtml |
| MACS2 v2.1.1.20160309 | Zhang et al.86 | https://github.com/taoliu/MACS |
| ChIPseeker v1.10.3 | Yu et al.87 | https://bioconductor.org/packages/release/bioc/html/ChIPseeker.html |
| Integrative Genomics Viewer (IGV) | Robinson et al.89 | https://software.broadinstitute.org/software/igv/ |
| MaxQuant software v1.5.5.1 | Max-Planck-Institute of Biochemistry | https://www.biochem.mpg.de/227318/MaxQuant |
| Prism 5 | GraphPad | https://graphpad-prism.software.informer.com/5.0/ |
| ImageJ | NIH | https://imagej.nih.gov/ij/ |
Highlights.
Androgen-induced AR condensation depends on its disordered NTD and structured LBD.
AR IDR can be substituted by selective IDRs for condensation and transactivation.
PolyQ expansion in AR IDR enhances condensation but impairs enhancer assembly.
An optimal level of AR multivalent interactions ensures AR enhancer regulation.
ACKNOWLEDGEMENTS
Z.L. is a CPRIT Scholar in Cancer Research. This work was supported by funds from CPRIT RR160017 to Z.L., V Foundation V2016-017 to Z.L., V Foundation DVP2019-018 to Z.L., Voelcker Fund Young Investigator Award to Z.L., UT Rising STARs Award to Z.L., Susan G. Komen CCR Award CCR17483391 to Z.L., NCI U54 CA217297/PRJ001 to Z.L., the Mary Kay Foundation Cancer Research Grant to Z.L., Voelcker Fund Young Investigator Award to L.C., NIA R01AG070214 to L.C., and NIA R01AG071591 to L.C., Pew-Stewart Scholar Award to S.C., Searle Scholar Award to S.C., the Shurl and Kay Curci Foundation Research Grant to S.C., Merkin Innovation Seed Grant for S.C., and the National Science Foundation Graduate Research Fellowship Grant No. DGE-1745301 to S.R.Y.. Research reported in this publication was also supported by the NIGMS of the NIH under Award Number R01GM137009 to Z. Liu. The content is solely the responsibility of the authors and does not necessarily represent the official views of the NIH. S.C. is also supported by the NIH/NCI under award number P30CA016042. We would like to thank all the members of Liu and Chen labs for technical assistance and helpful discussion, especially Dr. Meina Wang for her help with Western blots associated with droplet sedimentation assays, Dr. Mingjun Bi for his technical support on ATAC-seq and ChIP-seq, and Dr. Jian Gao for his help with imaging and 1,6 HD treatment work. We also thank Dr. Luke Lavis for providing the fluorescent Halo ligand PA-JF646 for SPT and the Caltech Biological Imaging Facility for providing access to confocal fluorescence microscopes.
INCLUSION AND DIVERSITY
We support inclusive, diverse, and equitable conduct of research.
Footnotes
Publisher's Disclaimer: This is a PDF file of an unedited manuscript that has been accepted for publication. As a service to our customers we are providing this early version of the manuscript. The manuscript will undergo copyediting, typesetting, and review of the resulting proof before it is published in its final form. Please note that during the production process errors may be discovered which could affect the content, and all legal disclaimers that apply to the journal pertain.
SUPPLEMENTAL INFORMATION
Supplemental information includes eight figures (S1 to S8) and their figure legends, and two videos and their legends.
DECLARATION OF INTERESTS
The authors declare no competing interests.
REFERENCES
- 1.Tan MH, Li J, Xu HE, Melcher K, and Yong EL (2015). Androgen receptor: structure, role in prostate cancer and drug discovery. Acta Pharmacol Sin 36, 3–23. 10.1038/aps.2014.18. [DOI] [PMC free article] [PubMed] [Google Scholar]
- 2.Stelloo S, Bergman AM, and Zwart W (2019). Androgen receptor enhancer usage and the chromatin regulatory landscape in human prostate cancers. Endocr Relat Cancer 26, R267–R285. 10.1530/ERC-19-0032. [DOI] [PubMed] [Google Scholar]
- 3.Plank JL, and Dean A (2014). Enhancer function: mechanistic and genome-wide insights come together. Molecular cell 55, 5–14. 10.1016/j.molcel.2014.06.015. [DOI] [PMC free article] [PubMed] [Google Scholar]
- 4.Panigrahi A, and O'Malley BW (2021). Mechanisms of enhancer action: the known and the unknown. Genome Biol 22, 108. 10.1186/s13059-021-02322-1. [DOI] [PMC free article] [PubMed] [Google Scholar]
- 5.Bi M, Zhang Z, Jiang YZ, Xue P, Wang H, Lai Z, Fu X, De Angelis C, Gong Y, Gao Z, et al. (2020). Enhancer reprogramming driven by high-order assemblies of transcription factors promotes phenotypic plasticity and breast cancer endocrine resistance. Nat Cell Biol 22, 701–715. 10.1038/s41556-020-0514-z. [DOI] [PMC free article] [PubMed] [Google Scholar]
- 6.Liu Z, Merkurjev D, Yang F, Li W, Oh S, Friedman MJ, Song X, Zhang F, Ma Q, Ohgi KA, et al. (2014). Enhancer activation requires trans-recruitment of a mega transcription factor complex. Cell 159, 358–373. 10.1016/j.cell.2014.08.027. [DOI] [PMC free article] [PubMed] [Google Scholar]
- 7.Zhu C, Li L, Zhang Z, Bi M, Wang H, Su W, Hernandez K, Liu P, Chen J, Chen M, et al. (2019). A Non-canonical Role of YAP/TEAD Is Required for Activation of Estrogen-Regulated Enhancers in Breast Cancer. Mol Cell 75, 791–806 e798. 10.1016/j.molcel.2019.06.010. [DOI] [PMC free article] [PubMed] [Google Scholar]
- 8.Boija A, Klein IA, Sabari BR, Dall'Agnese A, Coffey EL, Zamudio AV, Li CH, Shrinivas K, Manteiga JC, Hannett NM, et al. (2018). Transcription Factors Activate Genes through the Phase-Separation Capacity of Their Activation Domains. Cell 175, 1842–1855 e1816. 10.1016/j.cell.2018.10.042. [DOI] [PMC free article] [PubMed] [Google Scholar]
- 9.Sabari BR, Dall'Agnese A, Boija A, Klein IA, Coffey EL, Shrinivas K, Abraham BJ, Hannett NM, Zamudio AV, Manteiga JC, et al. (2018). Coactivator condensation at super-enhancers links phase separation and gene control. Science 361. 10.1126/science.aar3958. [DOI] [PMC free article] [PubMed] [Google Scholar]
- 10.Cho WK, Spille JH, Hecht M, Lee C, Li C, Grube V, and Cisse II (2018). Mediator and RNA polymerase II clusters associate in transcription-dependent condensates. Science 361, 412–415. 10.1126/science.aar4199. [DOI] [PMC free article] [PubMed] [Google Scholar]
- 11.Lu H, Yu D, Hansen AS, Ganguly S, Liu R, Heckert A, Darzacq X, and Zhou Q (2018). Phase-separation mechanism for C-terminal hyperphosphorylation of RNA polymerase II. Nature 558, 318–323. 10.1038/s41586-018-0174-3. [DOI] [PMC free article] [PubMed] [Google Scholar]
- 12.Kwon I, Kato M, Xiang S, Wu L, Theodoropoulos P, Mirzaei H, Han T, Xie S, Corden JL, and McKnight SL (2013). Phosphorylation-regulated binding of RNA polymerase II to fibrous polymers of low-complexity domains. Cell 155, 1049–1060. 10.1016/j.cell.2013.10.033. [DOI] [PMC free article] [PubMed] [Google Scholar]
- 13.Chong S, Dugast-Darzacq C, Liu Z, Dong P, Dailey GM, Cattoglio C, Heckert A, Banala S, Lavis L, Darzacq X, and Tjian R (2018). Imaging dynamic and selective low-complexity domain interactions that control gene transcription. Science 361. 10.1126/science.aar2555. [DOI] [PMC free article] [PubMed] [Google Scholar]
- 14.Boehning M, Dugast-Darzacq C, Rankovic M, Hansen AS, Yu T, Marie-Nelly H, McSwiggen DT, Kokic G, Dailey GM, Cramer P, et al. (2018). RNA polymerase II clustering through carboxy-terminal domain phase separation. Nat Struct Mol Biol 25, 833–840. 10.1038/s41594-018-0112-y. [DOI] [PubMed] [Google Scholar]
- 15.Powers SK, Holehouse AS, Korasick DA, Schreiber KH, Clark NM, Jing H, Emenecker R, Han S, Tycksen E, Hwang I, et al. (2019). Nucleo-cytoplasmic Partitioning of ARF Proteins Controls Auxin Responses in Arabidopsis thaliana. Mol Cell 76, 177–190 e175. 10.1016/j.molcel.2019.06.044. [DOI] [PMC free article] [PubMed] [Google Scholar]
- 16.Shi B, Li W, Song Y, Wang Z, Ju R, Ulman A, Hu J, Palomba F, Zhao Y, Le JP, et al. (2021). UTX condensation underlies its tumour-suppressive activity. Nature 597, 726–731. 10.1038/s41586-021-03903-7. [DOI] [PMC free article] [PubMed] [Google Scholar]
- 17.Trojanowski J, Frank L, Rademacher A, Mucke N, Grigaitis P, and Rippe K (2022). Transcription activation is enhanced by multivalent interactions independent of phase separation. Mol Cell 82, 1878–1893 e1810. 10.1016/j.molcel.2022.04.017. [DOI] [PubMed] [Google Scholar]
- 18.Larson AG, Elnatan D, Keenen MM, Trnka MJ, Johnston JB, Burlingame AL, Agard DA, Redding S, and Narlikar GJ (2017). Liquid droplet formation by HP1alpha suggests a role for phase separation in heterochromatin. Nature 547, 236–240. 10.1038/nature22822. [DOI] [PMC free article] [PubMed] [Google Scholar]
- 19.Xie J, He H, Kong W, Li Z, Gao Z, Xie D, Sun L, Fan X, Jiang X, Zheng Q, et al. (2022). Targeting androgen receptor phase separation to overcome antiandrogen resistance. Nat Chem Biol 18, 1341–1350. 10.1038/s41589-022-01151-y. [DOI] [PubMed] [Google Scholar]
- 20.Thiyagarajan T, Ponnusamy S, Hwang DJ, He Y, Asemota S, Young KL, Johnson DL, Bocharova V, Zhou W, Jain AK, et al. (2023). Inhibiting androgen receptor splice variants with cysteine-selective irreversible covalent inhibitors to treat prostate cancer. Proc Natl Acad Sci U S A 120, e2211832120. 10.1073/pnas.2211832120. [DOI] [PMC free article] [PubMed] [Google Scholar]
- 21.Zhang F, Biswas M, Massah S, Lee J, Lingadahalli S, Wong S, Wells C, Foo J, Khan N, Morin H, et al. (2023). Dynamic phase separation of the androgen receptor and its coactivators key to regulate gene expression. Nucleic Acids Res 51, 99–116. 10.1093/nar/gkac1158. [DOI] [PMC free article] [PubMed] [Google Scholar]
- 22.Stelloo S, Nevedomskaya E, Kim Y, Hoekman L, Bleijerveld OB, Mirza T, Wessels LFA, van Weerden WM, Altelaar AFM, Bergman AM, and Zwart W (2018). Endogenous androgen receptor proteomic profiling reveals genomic subcomplex involved in prostate tumorigenesis. Oncogene 37, 313–322. 10.1038/onc.2017.330. [DOI] [PubMed] [Google Scholar]
- 23.Russo JW, Nouri M, and Balk SP (2019). Androgen Receptor Interaction with Mediator Complex Is Enhanced in Castration-Resistant Prostate Cancer by CDK7 Phosphorylation of MED1. Cancer Discov 9, 1490–1492. 10.1158/2159-8290.CD-19-1028. [DOI] [PMC free article] [PubMed] [Google Scholar]
- 24.Clark PE, Irvine RA, and Coetzee GA (2003). The androgen receptor CAG repeat and prostate cancer risk. Methods Mol Med 81, 255–266. 10.1385/1-59259-372-0:255. [DOI] [PubMed] [Google Scholar]
- 25.Stanford JL, Just JJ, Gibbs M, Wicklund KG, Neal CL, Blumenstein BA, and Ostrander EA (1997). Polymorphic repeats in the androgen receptor gene: molecular markers of prostate cancer risk. Cancer Res 57, 1194–1198. [PubMed] [Google Scholar]
- 26.Thomas M, Yu Z, Dadgar N, Varambally S, Yu J, Chinnaiyan AM, and Lieberman AP (2005). The unfolded protein response modulates toxicity of the expanded glutamine androgen receptor. J Biol Chem 280, 21264–21271. 10.1074/jbc.M500144200. [DOI] [PubMed] [Google Scholar]
- 27.McCampbell A, Taye AA, Whitty L, Penney E, Steffan JS, and Fischbeck KH (2001). Histone deacetylase inhibitors reduce polyglutamine toxicity. Proc Natl Acad Sci U S A 98, 15179–15184. 10.1073/pnas.261400698. [DOI] [PMC free article] [PubMed] [Google Scholar]
- 28.McCampbell A, Taylor JP, Taye AA, Robitschek J, Li M, Walcott J, Merry D, Chai Y, Paulson H, Sobue G, and Fischbeck KH (2000). CREB-binding protein sequestration by expanded polyglutamine. Hum Mol Genet 9, 2197–2202. 10.1093/hmg/9.14.2197. [DOI] [PubMed] [Google Scholar]
- 29.Nair SJ, Yang L, Meluzzi D, Oh S, Yang F, Friedman MJ, Wang S, Suter T, Alshareedah I, Gamliel A, et al. (2019). Phase separation of ligand-activated enhancers licenses cooperative chromosomal enhancer assembly. Nat Struct Mol Biol 26, 193–203. 10.1038/s41594-019-0190-5. [DOI] [PMC free article] [PubMed] [Google Scholar]
- 30.Bugaj LJ, Choksi AT, Mesuda CK, Kane RS, and Schaffer DV (2013). Optogenetic protein clustering and signaling activation in mammalian cells. Nat Methods 10, 249–252. 10.1038/nmeth.2360. [DOI] [PubMed] [Google Scholar]
- 31.Alberti S, Gladfelter A, and Mittag T (2019). Considerations and Challenges in Studying Liquid-Liquid Phase Separation and Biomolecular Condensates. Cell 176, 419–434. 10.1016/j.cell.2018.12.035. [DOI] [PMC free article] [PubMed] [Google Scholar]
- 32.Shin Y, Berry J, Pannucci N, Haataja MP, Toettcher JE, and Brangwynne CP (2017). Spatiotemporal Control of Intracellular Phase Transitions Using Light-Activated optoDroplets. Cell 168, 159–171 e114. 10.1016/j.cell.2016.11.054. [DOI] [PMC free article] [PubMed] [Google Scholar]
- 33.Banani SF, Lee HO, Hyman AA, and Rosen MK (2017). Biomolecular condensates: organizers of cellular biochemistry. Nat Rev Mol Cell Biol 18, 285–298. 10.1038/nrm.2017.7. [DOI] [PMC free article] [PubMed] [Google Scholar]
- 34.Choi JM, Holehouse AS, and Pappu RV (2020). Physical Principles Underlying the Complex Biology of Intracellular Phase Transitions. Annu Rev Biophys 49, 107–133. 10.1146/annurev-biophys-121219-081629. [DOI] [PMC free article] [PubMed] [Google Scholar]
- 35.Mittag T, and Pappu RV (2022). A conceptual framework for understanding phase separation and addressing open questions and challenges. Mol Cell 82, 2201–2214. 10.1016/j.molcel.2022.05.018. [DOI] [PMC free article] [PubMed] [Google Scholar]
- 36.McSwiggen DT, Mir M, Darzacq X, and Tjian R (2019). Evaluating phase separation in live cells: diagnosis, caveats, and functional consequences. Genes Dev 33, 1619–1634. 10.1101/gad.331520.119. [DOI] [PMC free article] [PubMed] [Google Scholar]
- 37.Saporita AJ, Zhang Q, Navai N, Dincer Z, Hahn J, Cai X, and Wang Z (2003). Identification and characterization of a ligand-regulated nuclear export signal in androgen receptor. J Biol Chem 278, 41998–42005. 10.1074/jbc.M302460200. [DOI] [PubMed] [Google Scholar]
- 38.Hnisz D, Shrinivas K, Young RA, Chakraborty AK, and Sharp PA (2017). A Phase Separation Model for Transcriptional Control. Cell 169, 13–23. 10.1016/j.cell.2017.02.007. [DOI] [PMC free article] [PubMed] [Google Scholar]
- 39.Malinen M, Niskanen EA, Kaikkonen MU, and Palvimo JJ (2017). Crosstalk between androgen and pro-inflammatory signaling remodels androgen receptor and NF-kappaB cistrome to reprogram the prostate cancer cell transcriptome. Nucleic Acids Res 45, 619–630. 10.1093/nar/gkw855. [DOI] [PMC free article] [PubMed] [Google Scholar]
- 40.Hazelett DJ, Rhie SK, Gaddis M, Yan C, Lakeland DL, Coetzee SG, Ellipse, G.-O.N.c., Practical, c., Henderson BE, Noushmehr H, et al. (2014). Comprehensive functional annotation of 77 prostate cancer risk loci. PLoS Genet 10, e1004102. 10.1371/journal.pgen.1004102. [DOI] [PMC free article] [PubMed] [Google Scholar]
- 41.Kato M, and McKnight SL (2018). A Solid-State Conceptualization of Information Transfer from Gene to Message to Protein. Annu Rev Biochem 87, 351–390. 10.1146/annurev-biochem-061516-044700. [DOI] [PubMed] [Google Scholar]
- 42.Lin Y, Mori E, Kato M, Xiang S, Wu L, Kwon I, and McKnight SL (2016). Toxic PR Poly-Dipeptides Encoded by the C9orf72 Repeat Expansion Target LC Domain Polymers. Cell 167, 789–802 e712. 10.1016/j.cell.2016.10.003. [DOI] [PMC free article] [PubMed] [Google Scholar]
- 43.Lam MT, Li W, Rosenfeld MG, and Glass CK (2014). Enhancer RNAs and regulated transcriptional programs. Trends Biochem Sci 39, 170–182. 10.1016/j.tibs.2014.02.007. [DOI] [PMC free article] [PubMed] [Google Scholar]
- 44.Hah N, Murakami S, Nagari A, Danko CG, and Kraus WL (2013). Enhancer transcripts mark active estrogen receptor binding sites. Genome Res 23, 1210–1223. 10.1101/gr.152306.112. [DOI] [PMC free article] [PubMed] [Google Scholar]
- 45.Lin Y, Currie SL, and Rosen MK (2017). Intrinsically disordered sequences enable modulation of protein phase separation through distributed tyrosine motifs. J Biol Chem 292, 19110–19120. 10.1074/jbc.M117.800466. [DOI] [PMC free article] [PubMed] [Google Scholar]
- 46.Li HR, Chiang WC, Chou PC, Wang WJ, and Huang JR (2018). TAR DNA-binding protein 43 (TDP-43) liquid-liquid phase separation is mediated by just a few aromatic residues. J Biol Chem 293, 6090–6098. 10.1074/jbc.AC117.001037. [DOI] [PMC free article] [PubMed] [Google Scholar]
- 47.Wang J, Choi JM, Holehouse AS, Lee HO, Zhang X, Jahnel M, Maharana S, Lemaitre R, Pozniakovsky A, Drechsel D, et al. (2018). A Molecular Grammar Governing the Driving Forces for Phase Separation of Prion-like RNA Binding Proteins. Cell 174, 688–699 e616. 10.1016/j.cell.2018.06.006. [DOI] [PMC free article] [PubMed] [Google Scholar]
- 48.Ho WL, and Huang JR (2022). The return of the rings: Evolutionary convergence of aromatic residues in the intrinsically disordered regions of RNA-binding proteins for liquid-liquid phase separation. Protein Sci 31, e4317. 10.1002/pro.4317. [DOI] [PMC free article] [PubMed] [Google Scholar]
- 49.Chong S, Graham TGW, Dugast-Darzacq C, Dailey GM, Darzacq X, and Tjian R (2022). Tuning levels of low-complexity domain interactions to modulate endogenous oncogenic transcription. Mol Cell 82, 2084–2097 e2085. 10.1016/j.molcel.2022.04.007. [DOI] [PubMed] [Google Scholar]
- 50.Wan L, Chong S, Xuan F, Liang A, Cui X, Gates L, Carroll TS, Li Y, Feng L, Chen G, et al. (2020). Impaired cell fate through gain-of-function mutations in a chromatin reader. Nature 577, 121–126. 10.1038/s41586-019-1842-7. [DOI] [PMC free article] [PubMed] [Google Scholar]
- 51.Janicki SM, Tsukamoto T, Salghetti SE, Tansey WP, Sachidanandam R, Prasanth KV, Ried T, Shav-Tal Y, Bertrand E, Singer RH, and Spector DL (2004). From silencing to gene expression: real-time analysis in single cells. Cell 116, 683–698. 10.1016/s0092-8674(04)00171-0. [DOI] [PMC free article] [PubMed] [Google Scholar]
- 52.Decker CJ, Teixeira D, and Parker R (2007). Edc3p and a glutamine/asparagine-rich domain of Lsm4p function in processing body assembly in Saccharomyces cerevisiae. J Cell Biol 179, 437–449. 10.1083/jcb.200704147. [DOI] [PMC free article] [PubMed] [Google Scholar]
- 53.Gilks N, Kedersha N, Ayodele M, Shen L, Stoecklin G, Dember LM, and Anderson P (2004). Stress granule assembly is mediated by prion-like aggregation of TIA-1. Mol Biol Cell 15, 5383–5398. 10.1091/mbc.e04-08-0715. [DOI] [PMC free article] [PubMed] [Google Scholar]
- 54.Portz B, Lee BL, and Shorter J (2021). FUS and TDP-43 Phases in Health and Disease. Trends Biochem Sci 46, 550–563. 10.1016/j.tibs.2020.12.005. [DOI] [PMC free article] [PubMed] [Google Scholar]
- 55.Wei MT, Chang YC, Shimobayashi SF, Shin Y, Strom AR, and Brangwynne CP (2020). Nucleated transcriptional condensates amplify gene expression. Nat Cell Biol 22, 1187–1196. 10.1038/s41556-020-00578-6. [DOI] [PubMed] [Google Scholar]
- 56.Peskett TR, Rau F, O'Driscoll J, Patani R, Lowe AR, and Saibil HR (2018). A Liquid to Solid Phase Transition Underlying Pathological Huntingtin Exon1 Aggregation. Mol Cell 70, 588–601 e586. 10.1016/j.molcel.2018.04.007. [DOI] [PMC free article] [PubMed] [Google Scholar]
- 57.Monks DA, Johansen JA, Mo K, Rao P, Eagleson B, Yu Z, Lieberman AP, Breedlove SM, and Jordan CL (2007). Overexpression of wild-type androgen receptor in muscle recapitulates polyglutamine disease. Proc Natl Acad Sci U S A 104, 18259–18264. 10.1073/pnas.0705501104. [DOI] [PMC free article] [PubMed] [Google Scholar]
- 58.Zeng M, Shang Y, Araki Y, Guo T, Huganir RL, and Zhang M (2016). Phase Transition in Postsynaptic Densities Underlies Formation of Synaptic Complexes and Synaptic Plasticity. Cell 166, 1163–1175 e1112. 10.1016/j.cell.2016.07.008. [DOI] [PMC free article] [PubMed] [Google Scholar]
- 59.Shao W, Bi X, Pan Y, Gao B, Wu J, Yin Y, Liu Z, Peng M, Zhang W, Jiang X, et al. (2022). Phase separation of RNA-binding protein promotes polymerase binding and transcription. Nat Chem Biol 18, 70–80. 10.1038/s41589-021-00904-5. [DOI] [PubMed] [Google Scholar]
- 60.Brodsky S, Jana T, Mittelman K, Chapal M, Kumar DK, Carmi M, and Barkai N (2020). Intrinsically Disordered Regions Direct Transcription Factor In Vivo Binding Specificity. Mol Cell 79, 459–471 e454. 10.1016/j.molcel.2020.05.032. [DOI] [PubMed] [Google Scholar]
- 61.Roux KJ, Kim DI, Raida M, and Burke B (2012). A promiscuous biotin ligase fusion protein identifies proximal and interacting proteins in mammalian cells. The Journal of cell biology 196, 801–810. 10.1083/jcb.201112098. [DOI] [PMC free article] [PubMed] [Google Scholar]
- 62.Matias PM, Donner P, Coelho R, Thomaz M, Peixoto C, Macedo S, Otto N, Joschko S, Scholz P, Wegg A, et al. (2000). Structural evidence for ligand specificity in the binding domain of the human androgen receptor. Implications for pathogenic gene mutations. J Biol Chem 275, 26164–26171. 10.1074/jbc.M004571200. [DOI] [PubMed] [Google Scholar]
- 63.Heery DM, Hoare S, Hussain S, Parker MG, and Sheppard H (2001). Core LXXLL motif sequences in CREB-binding protein, SRC1, and RIP140 define affinity and selectivity for steroid and retinoid receptors. J Biol Chem 276, 6695–6702. 10.1074/jbc.M009404200. [DOI] [PubMed] [Google Scholar]
- 64.He B, Gampe RT Jr., Kole AJ, Hnat AT, Stanley TB, An G, Stewart EL, Kalman RI, Minges JT, and Wilson EM (2004). Structural basis for androgen receptor interdomain and coactivator interactions suggests a transition in nuclear receptor activation function dominance. Mol Cell 16, 425–438. 10.1016/j.molcel.2004.09.036. [DOI] [PubMed] [Google Scholar]
- 65.van Royen ME, Cunha SM, Brink MC, Mattern KA, Nigg AL, Dubbink HJ, Verschure PJ, Trapman J, and Houtsmuller AB (2007). Compartmentalization of androgen receptor protein-protein interactions in living cells. J Cell Biol 177, 63–72. 10.1083/jcb.200609178. [DOI] [PMC free article] [PubMed] [Google Scholar]
- 66.Yu X, Yi P, Hamilton RA, Shen H, Chen M, Foulds CE, Mancini MA, Ludtke SJ, Wang Z, and O'Malley BW (2020). Structural Insights of Transcriptionally Active, Full-Length Androgen Receptor Coactivator Complexes. Mol Cell 79, 812–823 e814. 10.1016/j.molcel.2020.06.031. [DOI] [PMC free article] [PubMed] [Google Scholar]
- 67.Wasmuth EV, Broeck AV, LaClair JR, Hoover EA, Lawrence KE, Paknejad N, Pappas K, Matthies D, Wang B, Feng W, et al. (2022). Allosteric interactions prime androgen receptor dimerization and activation. Mol Cell 82, 2021–2031 e2025. 10.1016/j.molcel.2022.03.035. [DOI] [PMC free article] [PubMed] [Google Scholar]
- 68.Kato M, and McKnight SL (2021). The low-complexity domain of the FUS RNA binding protein self-assembles via the mutually exclusive use of two distinct cross-beta cores. Proc Natl Acad Sci U S A 118. 10.1073/pnas.2114412118. [DOI] [PMC free article] [PubMed] [Google Scholar]
- 69.Basu S, Mackowiak SD, Niskanen H, Knezevic D, Asimi V, Grosswendt S, Geertsema H, Ali S, Jerkovic I, Ewers H, et al. (2020). Unblending of Transcriptional Condensates in Human Repeat Expansion Disease. Cell 181, 1062–1079 e1030. 10.1016/j.cell.2020.04.018. [DOI] [PMC free article] [PubMed] [Google Scholar]
- 70.Escobedo A, Topal B, Kunze MBA, Aranda J, Chiesa G, Mungianu D, Bernardo-Seisdedos G, Eftekharzadeh B, Gairi M, Pierattelli R, et al. (2019). Side chain to main chain hydrogen bonds stabilize a polyglutamine helix in a transcription factor. Nat Commun 10, 2034. 10.1038/s41467-019-09923-2. [DOI] [PMC free article] [PubMed] [Google Scholar]
- 71.Eftekharzadeh B, Piai A, Chiesa G, Mungianu D, Garcia J, Pierattelli R, Felli IC, and Salvatella X (2016). Sequence Context Influences the Structure and Aggregation Behavior of a PolyQ Tract. Biophys J 110, 2361–2366. 10.1016/j.bpj.2016.04.022. [DOI] [PMC free article] [PubMed] [Google Scholar]
- 72.Grimm JB, English BP, Choi H, Muthusamy AK, Mehl BP, Dong P, Brown TA, Lippincott-Schwartz J, Liu Z, Lionnet T, and Lavis LD (2016). Bright photoactivatable fluorophores for single-molecule imaging. Nat Methods 13, 985–988. 10.1038/nmeth.4034. [DOI] [PubMed] [Google Scholar]
- 73.Tokunaga M, Imamoto N, and Sakata-Sogawa K (2008). Highly inclined thin illumination enables clear single-molecule imaging in cells. Nat Methods 5, 159–161. 10.1038/nmeth1171. [DOI] [PubMed] [Google Scholar]
- 74.Normanno D, Boudarene L, Dugast-Darzacq C, Chen J, Richter C, Proux F, Benichou O, Voituriez R, Darzacq X, and Dahan M (2015). Probing the target search of DNA-binding proteins in mammalian cells using TetR as model searcher. Nat Commun 6, 7357. 10.1038/ncomms8357. [DOI] [PMC free article] [PubMed] [Google Scholar]
- 75.Serge A, Bertaux N, Rigneault H, and Marguet D (2008). Dynamic multiple-target tracing to probe spatiotemporal cartography of cell membranes. Nat Methods 5, 687–694. 10.1038/nmeth.1233. [DOI] [PubMed] [Google Scholar]
- 76.Teves SS, An L, Hansen AS, Xie L, Darzacq X, and Tjian R (2016). A dynamic mode of mitotic bookmarking by transcription factors. Elife 5. 10.7554/eLife.22280. [DOI] [PMC free article] [PubMed] [Google Scholar]
- 77.Hansen AS, Pustova I, Cattoglio C, Tjian R, and Darzacq X (2017). CTCF and cohesin regulate chromatin loop stability with distinct dynamics. Elife 6. 10.7554/eLife.25776. [DOI] [PMC free article] [PubMed] [Google Scholar]
- 78.Gagnon KT, Li L, Janowski BA, and Corey DR (2014). Analysis of nuclear RNA interference in human cells by subcellular fractionation and Argonaute loading. Nat Protoc 9, 2045–2060. 10.1038/nprot.2014.135. [DOI] [PMC free article] [PubMed] [Google Scholar]
- 79.Cox J, and Mann M (2008). MaxQuant enables high peptide identification rates, individualized p.p.b.-range mass accuracies and proteome-wide protein quantification. Nat Biotechnol 26, 1367–1372. 10.1038/nbt.1511. [DOI] [PubMed] [Google Scholar]
- 80.Cox J, Neuhauser N, Michalski A, Scheltema RA, Olsen JV, and Mann M (2011). Andromeda: a peptide search engine integrated into the MaxQuant environment. J Proteome Res 10, 1794–1805. 10.1021/pr101065j. [DOI] [PubMed] [Google Scholar]
- 81.Cox J, Hein MY, Luber CA, Paron I, Nagaraj N, and Mann M (2014). Accurate proteome-wide label-free quantification by delayed normalization and maximal peptide ratio extraction, termed MaxLFQ. Mol Cell Proteomics 13, 2513–2526. 10.1074/mcp.M113.031591. [DOI] [PMC free article] [PubMed] [Google Scholar]
- 82.Tyanova S, Temu T, Sinitcyn P, Carlson A, Hein MY, Geiger T, Mann M, and Cox J (2016). The Perseus computational platform for comprehensive analysis of (prote)omics data. Nat Methods 13, 731–740. 10.1038/nmeth.3901. [DOI] [PubMed] [Google Scholar]
- 83.Xie Z, Bailey A, Kuleshov MV, Clarke DJB, Evangelista JE, Jenkins SL, Lachmann A, Wojciechowicz ML, Kropiwnicki E, Jagodnik KM, et al. (2021). Gene Set Knowledge Discovery with Enrichr. Curr Protoc 1, e90. 10.1002/cpz1.90. [DOI] [PMC free article] [PubMed] [Google Scholar]
- 84.Buenrostro JD, Wu B, Chang HY, and Greenleaf WJ (2015). ATAC-seq: A Method for Assaying Chromatin Accessibility Genome-Wide. Curr Protoc Mol Biol 109, 21 29 21–29. 10.1002/0471142727.mb2129s109. [DOI] [PMC free article] [PubMed] [Google Scholar]
- 85.Langmead B, Trapnell C, Pop M, and Salzberg SL (2009). Ultrafast and memory-efficient alignment of short DNA sequences to the human genome. Genome Biol 10, R25. 10.1186/gb-2009-10-3-r25. [DOI] [PMC free article] [PubMed] [Google Scholar]
- 86.Zhang Y, Liu T, Meyer CA, Eeckhoute J, Johnson DS, Bernstein BE, Nusbaum C, Myers RM, Brown M, Li W, and Liu XS (2008). Model-based analysis of ChIP-Seq (MACS). Genome Biol 9, R137. 10.1186/gb-2008-9-9-r137. [DOI] [PMC free article] [PubMed] [Google Scholar]
- 87.Yu G, Wang LG, and He QY (2015). ChIPseeker: an R/Bioconductor package for ChIP peak annotation, comparison and visualization. Bioinformatics 31, 2382–2383. 10.1093/bioinformatics/btv145. [DOI] [PubMed] [Google Scholar]
- 88.Martin M (2010). Cutadapt removes adapter sequences from high-throughput sequencing reads. EMBnet 17, 10–12. [Google Scholar]
- 89.Robinson JT, Thorvaldsdottir H, Winckler W, Guttman M, Lander ES, Getz G, and Mesirov JP (2011). Integrative genomics viewer. Nat Biotechnol 29, 24–26. 10.1038/nbt.1754. [DOI] [PMC free article] [PubMed] [Google Scholar]
Associated Data
This section collects any data citations, data availability statements, or supplementary materials included in this article.
Supplementary Materials
Supplemental Video 1. SPT reveals increased residence time of AR condensates resulted from polyQ expansion. Related to Figures 5 and 6.
A two-color real-time movie showcasing individual molecules of Halo-ARNTDwt labeled with 5 nM PA-JF646 (magenta) binding to the puncta of GFP-ARwt (green) in U2OS cells. The average residence time of Halo-ARNTDwt within the puncta is 6.4 ± 1.0 seconds.
Supplemental Video 2. SPT reveals increased residence time of AR condensates resulted from polyQ expansion. Related to Figures 5 and 6.
A two-color real-time movie displaying individual molecules of Halo-ARNTDpQ69 labeled with 5 nM PA-JF646 (magenta) binding to the puncta of GFP-ARpQ69 (green) in U2OS cells. The average residence time of Halo-ARNTDpQ69 within the puncta is 16.0 ± 4.3 seconds.
Data Availability Statement
The deep sequencing data reported in this paper is deposited to GEO under GSE215163 and is publicly available as of the date of publication. Additional data reported in this paper are available from the lead author upon request.
This paper does not report original code.
Any additional information required to reanalyze the data reported in this paper is available from the lead contact upon request.