Abstract
Rheumatoid arthritis is a prototypical autoimmune disease that causes joint inflammation and destruction1. There is currently no cure for rheumatoid arthritis, and the effectiveness of treatments varies across patients, suggesting an undefined pathogenic diversity1,2. Here, to deconstruct the cell states and pathways that characterize this pathogenic heterogeneity, we profiled the full spectrum of cells in inflamed synovium from patients with rheumatoid arthritis. We used multi-modal single-cell RNA-sequencing and surface protein data coupled with histology of synovial tissue from 79 donors to build single-cell atlas of rheumatoid arthritis synovial tissue that includes more than 314,000 cells. We stratified tissues into six groups, referred to as cell-type abundance phenotypes (CTAPs), each characterized by selectively enriched cell states. These CTAPs demonstrate the diversity of synovial inflammation in rheumatoid arthritis, ranging from samples enriched for T and B cells to those largely lacking lymphocytes. Disease-relevant cell states, cytokines, risk genes, histology and serology metrics are associated with particular CTAPs. CTAPs are dynamic and can predict treatment response, highlighting the clinical utility of classifying rheumatoid arthritis synovial phenotypes. This comprehensive atlas and molecular, tissue-based stratification of rheumatoid arthritis synovial tissue reveal new insights into rheumatoid arthritis pathology and heterogeneity that could inform novel targeted treatments.
Subject terms: Translational immunology, Rheumatoid arthritis
Single-cell transcriptomic and proteomic data from synovial tissue from individuals with rheumatoid arthritis classify patients into groups based on abundance of cell states that can provide insights into pathology and predict individual treatment responses.
Main
Rheumatoid arthritis is a systemic autoimmune disease that affects up to 1% of the population3. It is characterized by inflammation of synovial joint tissue and extra-articular manifestations that lead to pain, joint damage and disability1. The clinical course of rheumatoid arthritis has been transformed by targeted therapies, including those aimed at TNF, IL-6, B cells, T cell co-stimulation and the JAK–STAT pathway1. However, many patients are refractory to these therapies and do not achieve remission2. Thus, there is a clinical need for new treatment targets and for predictors of patient-specific responses to treatment. Genetic diversity and variable responses to targeted therapies suggest that rheumatoid arthritis is a heterogeneous disease4. However, genetic and clinical differences in disease duration or activity do not reliably predict the treatment response or druggable targets1,5.
A more granular understanding of cell states and synovial phenotypes in inflamed joints could inform prognosis and therapeutic targets. Encouragingly, clinical trials using histologic or bulk RNA-sequencing (RNA-seq) analysis of synovial tissue suggest that treatment response may depend on synovial cellular composition6,7. Previous studies have identified effector cell states in rheumatoid arthritis pathophysiology that represent promising treatment targets, including HBEGF+IL1B+ macrophages, SLAMF7+ super-activated macrophages, MERTK+ macrophages, CD11c+ autoimmune-associated B cells (ABCs), PD-1hi T peripheral helper (TPH) cells, granzyme K+CD8+ T cells and NOTCH3+ synovial fibroblasts8–16. To determine whether some states are enriched only in specific subsets of patients, we analysed cell-state composition in a clinically diverse set of patients with active rheumatoid arthritis. As rheumatoid arthritis shares disease-associated tissue cell states and genetic risk loci with other autoimmune diseases17,18, these analyses may offer insights into other diseases that feature tissue inflammation.
Recruitment and multi-modal analysis of tissue
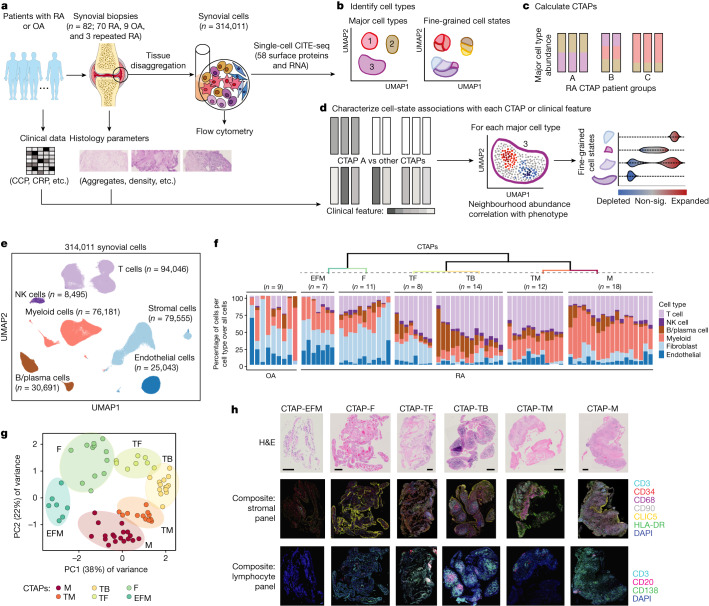
We obtained a total of 82 synovial tissue samples from patients exhibiting moderate to high disease activity (clinical disease activity index (CDAI) ≥ 10). To capture a clinical spectrum of rheumatoid arthritis, we collected biopsies from treatment-naive patients (n = 28) early in their disease course, methotrexate (MTX)-inadequate responders (n = 27), and anti-TNF agent-inadequate responders (n = 15) as well as from patients with osteoarthritis (n = 9) (Fig. 1a–d, Supplementary Table 1).
Fig. 1. Overview of the multi-modal single-cell synovial tissue pipeline and cell-type abundance analysis that reveals distinct rheumatoid arthritis CTAPs.
a–d, Description (a) of the patient recruitment, clinical and histologic metrics, synovial sample processing pipeline and computational analysis strategy, including identification of major cell types and fine-grained cell states (b), definition of distinct rheumatoid arthritis CTAPs (c), and cell neighbourhood associations with each CTAP or with clinical or histologic parameters for each major cell type (d). OA, osteoarthritis; RA, rheumatoid arthritis; sig., significant. e, Integrative uniform manifold approximation and projection (UMAP) based on mRNA and protein discriminated major cell types, f, Hierarchical clustering of cell-type abundances captures six rheumatoid arthritis subgroups, referred to as CTAPs. The nine osteoarthritis samples are shown as a comparison. Each bar represents one synovial sample, coloured by the proportion of each major cell type. g, PCA of major cell-type abundances. Each dot represents a sample, plotted based on its PC1 and PC2 projections and coloured by CTAPs. h, Representative synovial tissue fragments from each of the CTAPs. Top row, haematoxylin and eosin (H&E) staining. Middle row, immunofluorescence microscopy for CD3, CD34, CD68, CD90, CLIC5 and HLA-DR. Bottom row, immunofluorescence microscopy for CD3, CD20 and CD138. Scale bars: 100 μm (CTAP-EFM) and 250 μm (all other images). Single-colour images are presented in Supplementary Fig. 4. A total of 150 fragments from 36 donors were stained in batches and analysed as a single cohort. Parts of Fig. 1a were generated using Servier Medical Art, provided by Servier, licensed under a Creative Commons Attribution 3.0 unported license.
We simultaneously characterized the transcriptome and surface expression of 58 proteins (Supplementary Table 2) in a total of 314,011 cells (more than 3,800 cells per sample) after quality control (Supplementary Fig. 1). We integrated surface marker and RNA data using canonical correlation analysis, corrected batch effects and defined six major cell types: T, B and plasma (B/plasma), natural killer (NK), myeloid, stromal and endothelial cells (Fig. 1e, Extended Data Fig. 1a, Supplementary Fig. 2 and Supplementary Table 3).
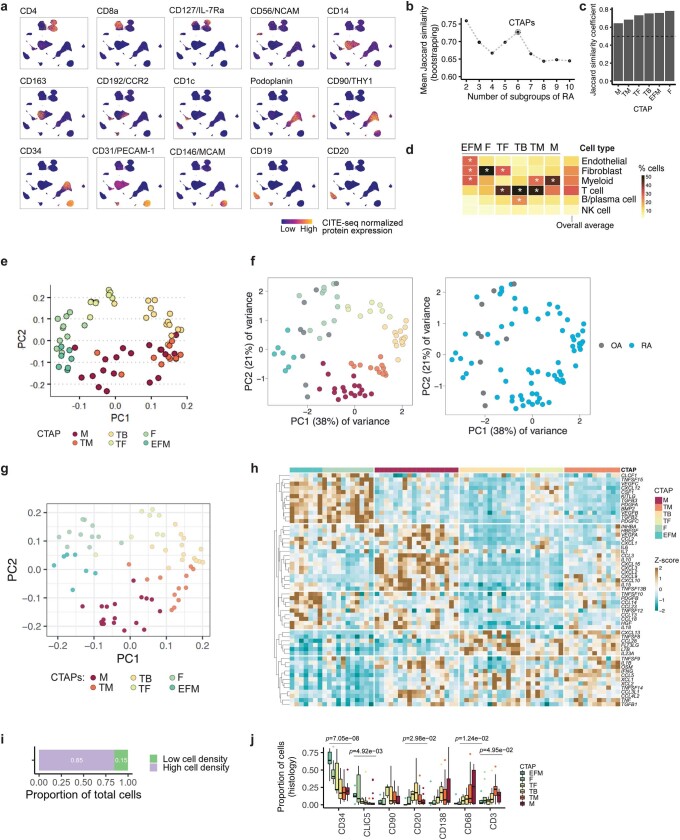
Extended Data Fig. 1. Robust CTAP definition and quantitative cellular histology analysis.
a, UMAPs of CITE-seq antibody-based expression of cell-type lineage protein markers. Cells are colored based on expression from blue (low) to yellow (high). b, Mean Jaccard similarity coefficient to test CTAP stability by bootstrapping 10,000 times for each tested number of patient subgroups ranging from 2 to 10. c, Mean Jaccard similarity coefficient for each CTAP, comparing full clustering and 10,000 bootstrapped datasets. d, Average proportions of each major cell type among samples in each CTAP. Overall average proportions across all the samples are shown as a comparator. Asterisk represents the proportion that is greater than the overall average for that cell type, e, PCA of samples based on cell-type abundances, adjusting for disease duration and treatment. Each dot represents a sample, plotted based on its PC1 and PC2 projections and colored by CTAPs. f, Projection of OA samples onto PCA of samples based on cell-type abundances from Fig. 1j. OA samples are marked with gray points; RA samples are colored based on CTAP (left) or in blue (right). g, PCA of samples based on pseudo-bulk gene expression of 55 soluble immune mediators. Each dot represents a sample, plotted based on its PC1 and PC2 projections and colored by CTAPs. h, Heatmap of pseudo-bulk gene expression of soluble immune mediators across samples, grouped by CTAP. Boxes are colored based on the gene’s scaled pseudo-bulk expression across samples. i, Bar graph of the proportion of total cells located in high-density and low-density fragments, as captured by histology imaging. Quantitation of total cellular composition demonstrated that fragments with highest cell density (top 50%) contained 86% of total cells and are therefore likely the primary drivers of CTAP classification. j, Box plots of the proportion of cells in high-density fragments (N = 76) expressing each marker in histology imaging, stratified by CTAP. Points represent outlier samples (> 1.5 * IQR from median). Box plots show median (vertical bar), 25th and 75th percentiles (lower and upper bounds of the box, respectively) and 1.5 x IQR (or minimum/maximum values; end of whiskers). P-values are calculated with one-way ANOVA tests with Bonferroni correction.
Stratifying synovium by cell-type abundance
To define potentially distinct tissue inflammatory phenotypes, we hierarchically clustered synovial samples on the basis of the frequency of the six major cell lineages (Fig. 1f,g). On the basis of in-group similarity with bootstrapping, we arrived at six different categories that we call CTAPs, which are largely robust to adjustment for treatment and disease duration (Extended Data Fig. 1b–e). We named the CTAPs on the basis of relatively enriched cell type(s): (1) endothelial, fibroblast and myeloid cells (EFM); (2) fibroblasts (F); (3) T cells and fibroblasts (TF); (4) T and B cells (TB); (5) T and myeloid cells (TM); and (6) myeloid cells (M) (Extended Data Fig. 1d and Supplementary Table 4). Alternative clustering schemes using highly variable genes, all transcriptional states, or separating plasma cells from non-plasma B cells led to similar results (Supplementary Fig. 3). Post hoc mapping of the osteoarthritis samples demonstrates that they most resemble CTAP-EFM and CTAP-F (Extended Data Fig. 1f). Categorization by effector functions using pseudo-bulk expression of 55 cytokines, chemokines and growth factors was similar to the cell lineage-based CTAP categorization (Extended Data Fig. 1g,h).
CTAP patterns are consistent across fragments
To examine the robustness of CTAPs across paired biopsy fragments from the same joint, we performed immunofluorescence microscopy staining on synovial tissue fragments from a subset of patients (n = 36) (Fig. 1h and Supplementary Fig. 4). We compared cell-type proportions in individual high-density biopsy fragments with the disaggregated cellular indexing of transcriptomes and epitopes (CITE-seq)-based cell frequencies (Extended Data Fig. 1i,j). The proportions of cell types followed the patterns predicted by the CITE-seq-based CTAP assignment. For example, CD20+ (that is, non-plasma) B cells were most frequent in CTAP-TB, whereas CD68+ myeloid cells were most frequent in CTAP-M and CTAP-TM. As the histology analysis was performed on synovial tissue fragments separate from those used for CITE-seq, these findings support the consistency of CTAP assignments across a joint.
A rheumatoid arthritis synovial cell-state atlas
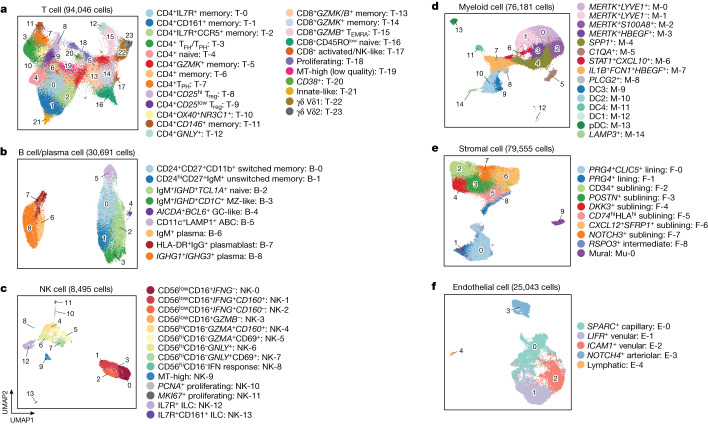
We defined finer-grained cell states and quantified cluster abundances within cell types (Fig. 2 and Extended Data Fig. 2) using canonical variates from canonical correlation analysis reflecting both RNA and protein for T and B cells and mRNA principal components for myeloid, stromal and endothelial cell states (Supplementary Figs. 5 and 6 and Supplementary Table 3). In total we defined 77 cell states: 24 T cell clusters (n = 94,046 cells), 9 B/plasma cell clusters (n = 30,691), 14 NK clusters (n = 8,495), 15 myeloid clusters (n = 76,181), 5 endothelial clusters (n = 25,043) and 10 stromal clusters (n = 79,555) (Fig. 2 and Supplementary Table 5). Cell states associated with rheumatoid arthritis versus osteoarthritis in a previous study of more than 5,000 synovial cells were also associated with rheumatoid arthritis in this dataset (Supplementary Fig. 7 and Supplementary Table 6).
Fig. 2. Cell-type-specific single-cell analysis captures 77 distinct cell states in rheumatoid arthritis synovium.
a–f, Cell-type-specific reference UMAPs for T cells (a) B/plasma cells (b), NK cells (c), myeloid cells (d), stromal cells (e) and endothelial cells (f), coloured by fine-grained cell-state clusters. MT, mitochondrial; MZ, marginal zone; pDC, plasmacytoid dendritic cell.
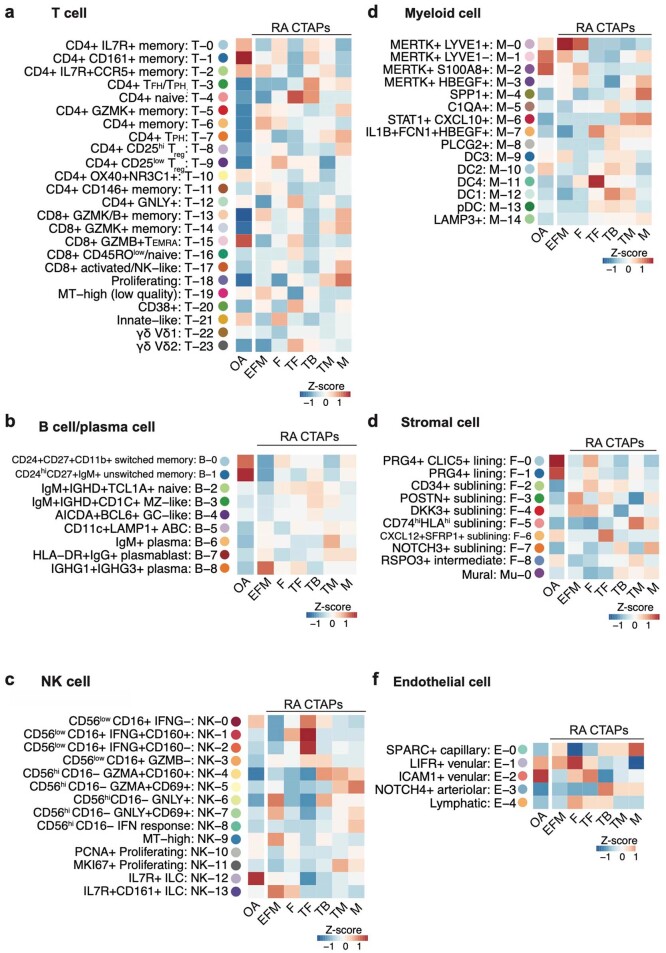
Extended Data Fig. 2. Relative enrichment of fine-grain cell clusters across CTAPs and OA.
a-f, Heatmaps show the average proportions of each cluster in the given cell type across patient samples in each RA CTAP and OA, scaled within each cluster.
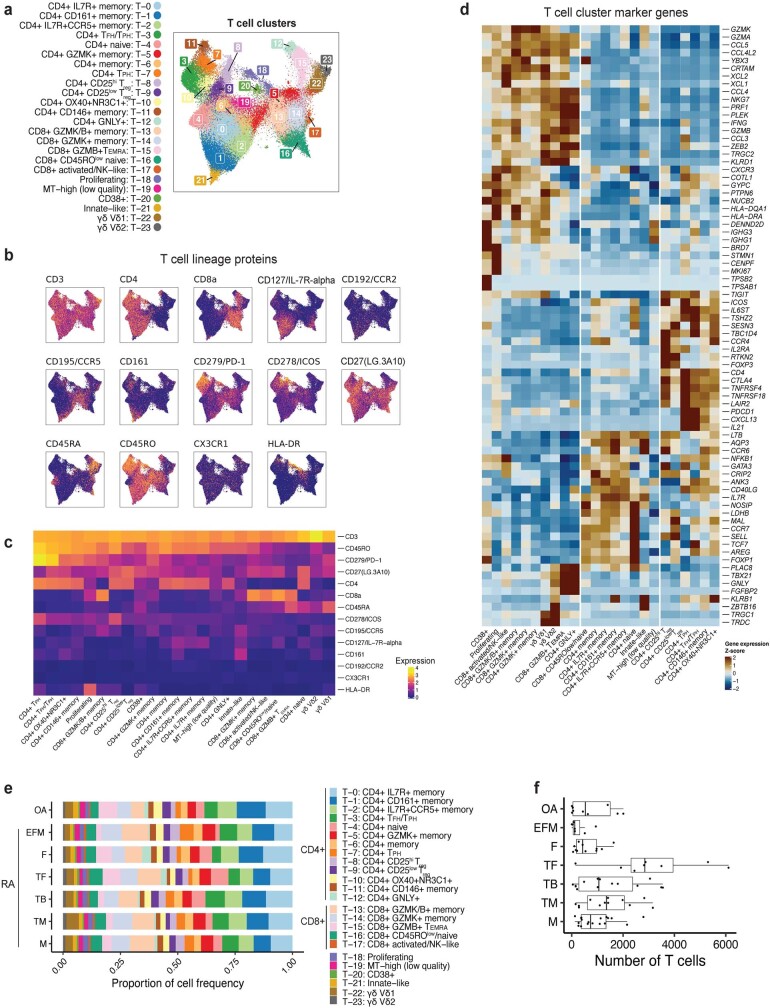
The 24 T cell clusters spanned innate-like states and CD4+ and CD8+ adaptive lineages, including states implicated in autoimmunity, such as regulatory CD4+ T cells (Treg) (T-8 and T-9) and CXCL13- and IL21-expressing T follicular helper (TFH) and TPH cells17,19 (T-3 and T-7) (Fig. 2a and Extended Data Figs. 2 and 3). T-7 exclusively comprised TPH cells and expressed more ICOS, IFNG and GZMA, whereas T-3 contained TFH and TPH (TFH/TPH) cells expressing the lymphoid homing marker gene CCR7. CD8+ subsets expressed different combinations of GZMB and GZMK, reflecting differential cytotoxic potential. Using cell surface protein data, we resolved T cell clusters that were not observed in our earlier study8, including CD4+GNLY+ (T-12), double-negative (CD4−CD8−) γδ T cells expressing TRDC (T-22 and T-23) and double-negative and CD8+ T cells expressing ZBTB16 (which encodes PLZF) that resemble NK T cells and mucosal-associated innate T (MAIT) cells (T-21).
Extended Data Fig. 3. T cell-specific analysis.
a, T cell UMAP colored by fine-grained cell-state clusters, b, Expression of selected surface proteins among T cells. Cells are colored from blue (low) to yellow (high), c, Heatmap of surface protein expression in T cell clusters colored according to the average normalized expression across cells in the cluster, d, Heatmap of gene expression in T cell clusters colored according to the average normalized expression across cells in the cluster, scaled for each gene across clusters, e, Distribution of T cells across clusters, stratified by CTAP. The size of each segment of each bar corresponds to the average proportion of cells in that cluster across donors from that CTAP. f, Number of T cells per individual, stratified by CTAP. Points represent individuals (N = 82); OA (N = 9), (EFM (N = 7), F (N = 11), TF (N = 8), TB (N = 14), TM (n = 12), M (N = 18). Box plots show median (vertical bar), 25th and 75th percentiles (lower and upper bounds of the box, respectively) and 1.5 x IQR (or minimum/maximum values; end of whiskers).
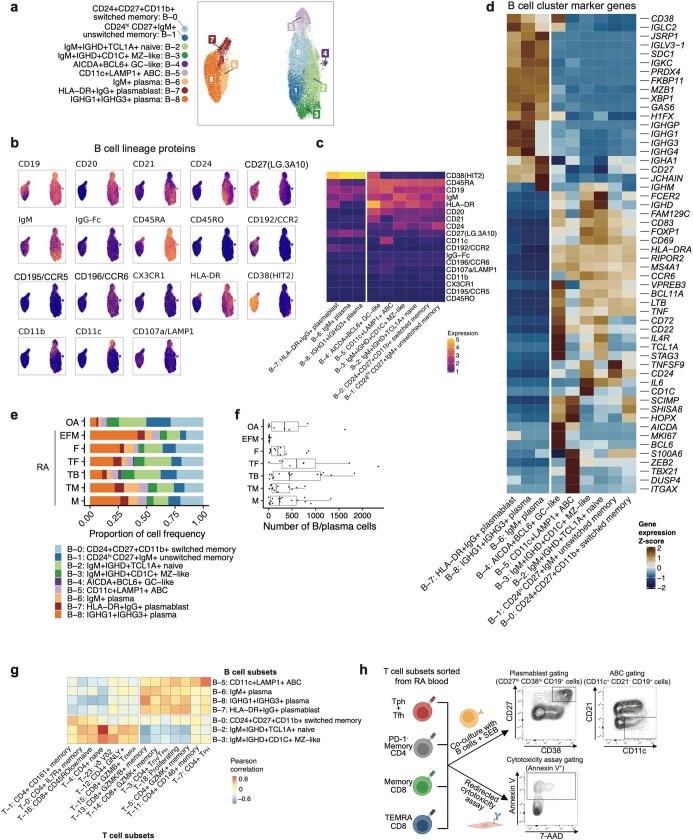
CD20 (encoded by MS4A1)-expressing B cells comprised six clusters, including IgM+IGHD+TCL1A+ naive (B-2), CD24hiCD27+IgM+ unswitched memory (B-1) and CD24+CD27+CD11b+ (CD11b is also known as ITGAM) switched memory (B-0) B cells (Fig. 2b and Extended Data Figs. 2 and 4). CD11c+CXCR5low (CD11c is also known as ITGAX) ABCs (B-5) expressed LAMP1, HLA-DR and CIITA, indicating B cell antigen presentation20–22. Unexpectedly, we observed CD1C+ B cells (B-3) with CD27 and IGHD expression, consistent with recirculating extrasplenic marginal zone B cells. These and other non-plasma B cells expressed IL6 and TNF (Extended Data Fig. 4d). We identified AICDA+BCL6+ germinal centre-like B cells (B-4), consistent with ectopic germinal centre formation in synovium23. Plasma cell populations included HLA-DR+IgG+ plasmablasts (B-7) expressing MKI67, IgM+ plasma cells (B-6) and mature IGHG1+IGHG3+ plasma cells (B-8), possibly reflecting both in situ generation and recruitment from the circulation.
Extended Data Fig. 4. B/plasma cell-specific analysis.
a, B/plasma cell UMAP colored by fine-grained cell state clusters, b Expression of selected surface proteins among B/plasma cells. Cells are colored from blue (low) to yellow (high), c, Heatmap of surface protein expression in B/plasma cell clusters colored according to the average normalized expression across cells in the cluster, d, Heatmap of gene expression in B/plasma cell clusters colored according to the average normalized expression across cells in the cluster, scaled for each gene across clusters, e, Distribution of B/plasma cells across clusters, stratified by CTAP. The size of each segment of each bar corresponds to the average proportion of cells in that cluster across donors from that CTAP. f, Number of B/plasma cells per individual, stratified by CTAP. Points represent individuals (N = 82); OA (N = 9), EFM (N = 7), F (N = 11), TF (N = 8), TB (N = 14), TM (N = 12), M (N = 18). Box plots show median (vertical bar), 25th and 75th percentiles (lower and upper bounds of the box, respectively) and 1.5 x IQR (or minimum/maximum values; end of whiskers). g, Heatmap of correlations between select T and B cell subsets, colored by Pearson correlation between per-donor proportions. h, Schematic representation of the experimental design of the T cell functional assays and representative flow cytometry plots showing gating of plasmablasts (CD27hi CD38hi CD19+ cells), ABC B cells (CD11c+ CD21− CD19+ cells) and dead target cells (Annexin V+). Parts of this schematic were created using BioRender.
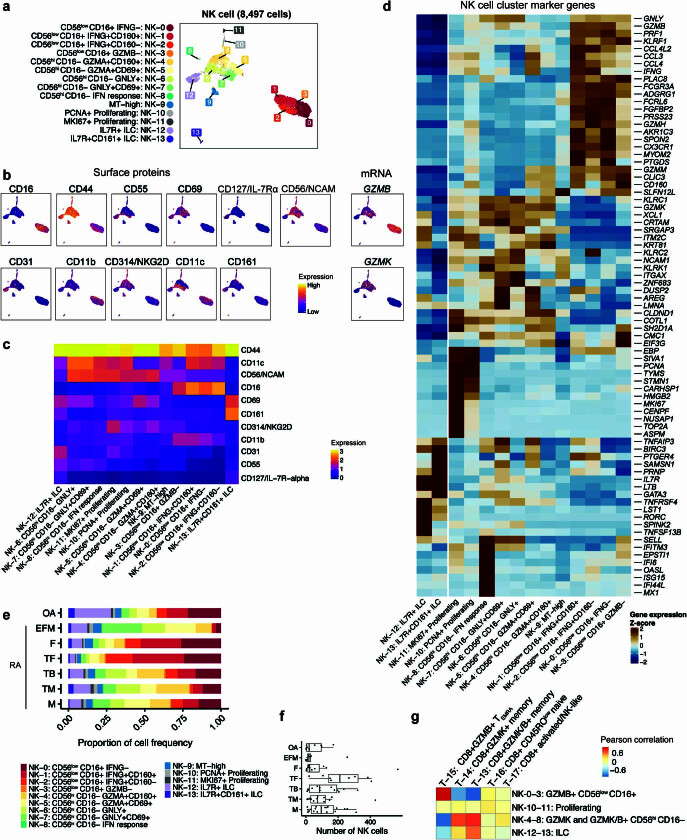
We also captured innate lymphocytes, including CD56hiCD16− NK (eight clusters), CD56lowCD16+ NK (four clusters) and CD56lowCD16−IL7R+ innate lymphoid cells (ILCs) (two clusters) (Fig. 2c and Extended Data Figs. 2 and 5). CD56hiCD16− NK cells were more abundant (mean 48% per donor) than CD56lowCD16+ NK cells (36%) and ILCs (13%). CD56hiCD16− NK clusters expressed GZMK, with variable expression of cytotoxicity genes such as GZMB and GNLY. CD56lowCD16+ NK cells exhibited universally high expression of GZMB, GNLY and PRF1. Several NK cell clusters highly expressed IFNG (Extended Data Fig. 5d). ILCs, identified by the absence of CD56 and CD16 with high CD127 (also known as IL-7Rα) protein, included group 3 ILCs (RORC+ NK-12) and group 2 ILCs24 (CD161+GATA3+ NK-13).
Extended Data Fig. 5. NK cell-specific analysis.
a, NK cell UMAP colored by fine-grained cell state clusters, b, Expression of selected surface proteins or mRNA transcripts among NK cells colored from blue (low) to yellow (high), c, Heatmap of surface protein expression in NK cell clusters colored according to the average normalized expression across cells in the cluster, d, Heatmap of gene expression in NK cell clusters colored according to the average normalized expression across cells in the cluster, scaled for each gene across clusters, e, Distribution of NK cells across clusters, stratified by CTAP. The size of each segment of each bar corresponds to the average proportion of cells in that cluster across donors from that CTAP. f, Number of NK cells per individual, stratified by CTAP. Points represent individuals (N = 82); OA (N = 9), EFM (N = 7), F (N = 11), TF (N = 8), TB (N = 14), TM (N = 12), M (N = 18). Box plots show median (vertical bar), 25th and 75th percentiles (lower and upper bounds of the box, respectively) and 1.5 x IQR (or minimum/maximum values; end of whiskers). g, Heatmap colored by Pearson correlation between per-donor CD8+ T cell and NK cell cluster abundances.
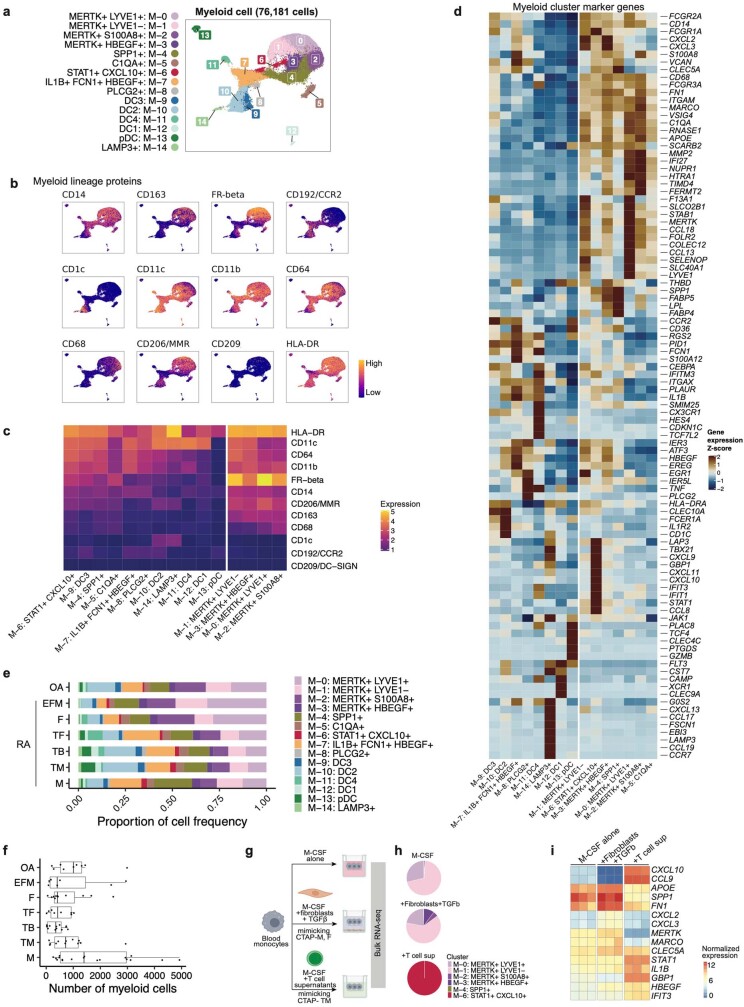
We identified 15 myeloid clusters (Fig. 2d). CD68 and CCR2 discriminated tissue macrophages from infiltrating monocytes (Extended Data Figs. 2 and 6). Three tissue macrophage clusters (M-0, M-1 and M-2) were abundant in both osteoarthritis and rheumatoid arthritis synovium and expressed the phagocytic factors CD206 (also known as macrophage mannose receptor (MMR)) and CD163 and MERTK (Extended Data Fig. 6b–d), suggesting a homeostatic debris-clearing function25,26. LYVE1 expression (M-0) is likely to indicate a perivascular function12,27. Infiltrating monocytes included a previously described IL1B+FCN1+HBEGF+ pro-inflammatory subset (M-7), probably derived from classical CD14hi monocytes8,12 and a STAT1+CXCL10+ subset (M-6) that expresses interferon-response genes. MERTK+HBEGF+ (M-3) and SPP1+ (M-4) subsets expressed SPP1 (osteopontin) and other factors consistent with wound-healing responses28,29. Four dendritic cell (DC) populations corresponded to subsets described by Villani et al.30. CLEC10Ahi DC2 and DC3 (M-9 and M-10) and CLEC9A+THBD+ DC1 (M-12) are likely to activate CD4+ and CD8+ T cells, respectively, whereas DC4 (M-11) expressed CD16+ monocyte factors and an interferon signature (Extended Data Fig. 6d). A fifth DC subset (M-14) highly expressed the endosomal marker LAMP331.
Extended Data Fig. 6. Myeloid cell-specific analysis.
a, Myeloid cell UMAP colored by fine-grained cell state clusters, b, Expression of selected surface proteins among myeloid cells colored from blue (low) to yellow (high), c, Heatmap of surface protein expression in myeloid cell clusters colored according to the average normalized expression across cells in the cluster, d, Heatmap of gene expression in myeloid cell clusters colored according to the average normalized expression across cells in the cluster, scaled for each gene across clusters, e, Distribution of myeloid cells across clusters, stratified by CTAP. The size of each segment of each bar corresponds to the average proportion of cells in that cluster across donors from that CTAP. f, Number of myeloid cells per individual, stratified by CTAP. Points represent individuals (N = 82); OA (N = 9), EFM (N = 7), F (N = 11), TF (N = 8), TB (N = 14), TM (N = 12), M (N = 18). Box plots show median (vertical bar), 25th and 75th percentiles (lower and upper bounds of the box, respectively) and 1.5 x IQR (or minimum/maximum values; end of whiskers). g, Schematic representation of the experimental design of the myeloid cell assays. Parts of this schematic were created using BioRender. h, Linear discriminant analysis classification of bulk RNA-seq obtained from myeloid cells cultured in the indicated conditions. Each condition was performed with three biological replicates, and cluster proportions in each pie chart were calculated from the mean of the posterior probability values across replicates. i, Heatmap showing expression of selected CTAP-relevant genes in bulk RNA-seq of blood monocytes cultured in the indicated conditions. Columns correspond to three biological replicates for each condition, and boxes are colored by normalized gene expression.
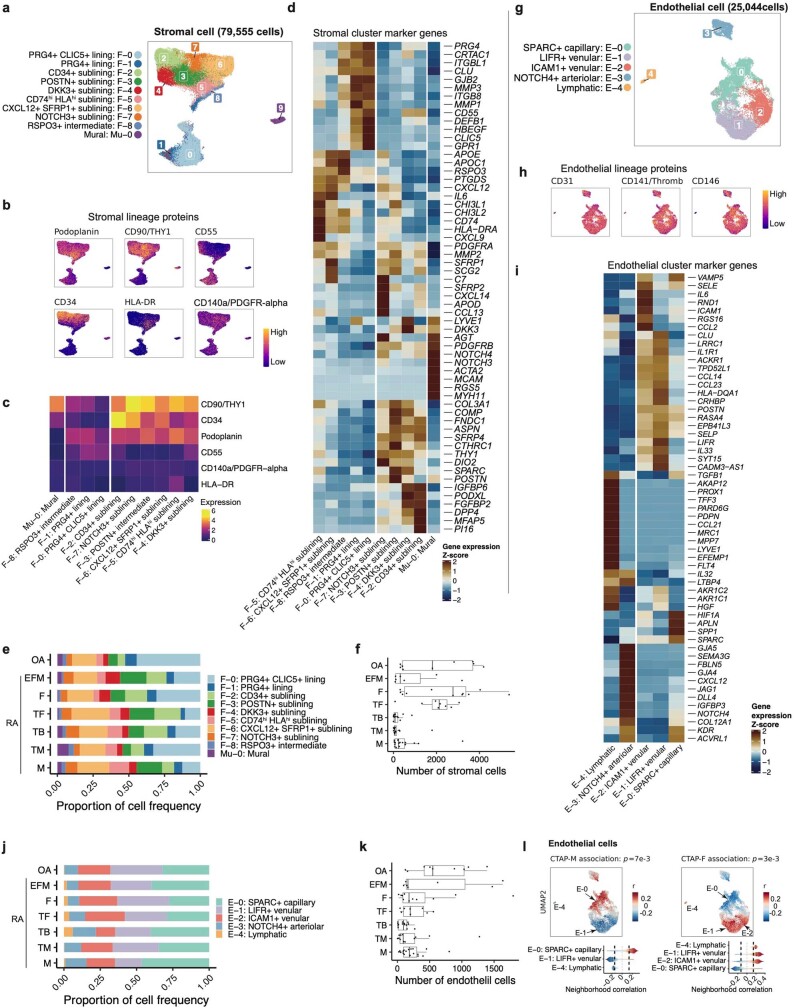
Fibroblasts segregated broadly into lining (PRG4hi) and sublining (THY1+PRG4low) subsets and NOTCH3+MCAM+(CD146) mural cells (Fig. 2e and Extended Data Figs. 2 and 7a–f). As previously described, lining fibroblasts (F-0 and F-1) were depleted in rheumatoid arthritis relative to osteoarthritis and subdivided into PRG4+CLIC5+ (F-0), PRG4+ (F-1) and RSPO3+ (F-8) populations, the last exhibiting an intermediate lining–sublining phenotype. Sublining fibroblasts separated into HLA-DRA+, CD34+ and DKK3+ groups8,32,33. The CD34+ sublining fibroblast cluster (F-2) highly expressed PI16 and DPP4 (CD26), suggesting an undifferentiated, progenitor-like state34. CXCL12+ fibroblasts included an inflammatory CD74hiHLAhi cluster (F-5) and a CXCL12+SFRP1+ cluster (F-6) with the highest levels of IL6, which encodes a proven drug target in rheumatoid arthritis.
Extended Data Fig. 7. Stromal- and endothelial-specific analysis.
a, Stromal cell UMAP colored by fine-grained cell state clusters, b, Expression of selected surface proteins among stromal cells colored from blue (low) to yellow (high), c, Heatmap of surface protein expression in stromal cell clusters colored according to the average normalized expression across cells in the cluster, d, Heatmap of gene expression in stromal cell clusters colored according to the average normalized expression across cells in the cluster, scaled for each gene across clusters, e, Distribution of stromal cells across clusters, stratified by CTAP. The size of each segment of each bar corresponds to the average proportion of cells in that cluster across donors from that CTAP, f, Number of stromal cells per individual, stratified by CTAP. Points represent individuals (N = 82); OA (N = 9), (EFM (N = 7), F (N = 11), TF (N = 8), TB (N = 14), TM (N = 12), M (N = 18). Box plots show median (vertical bar), 25th and 75th percentiles (lower and upper bounds of the box, respectively) and 1.5 x IQR (or minimum/maximum values; end of whiskers), g, Endothelial cell UMAP colored by fine-grained cell state clusters, h, Expression of selected surface proteins among endothelial cells colored from blue (low) to yellow (high), i, Heatmap of gene expression in endothelial cell clusters colored according to the average normalized expression across cells in the cluster, scaled for each gene across clusters, j, Distribution of endothelial cells across clusters, stratified by CTAP. The size of each segment of each bar corresponds to the average proportion of cells in that cluster across donors from that CTAP. k, Number of endothelial cells per individual, stratified by CTAP. Points represent individuals (N = 82); OA (N = 9), EFM (N = 7), F (N = 11), TF (N = 8), TB (N = 14), TM (n = 12), M (N = 18). Box plots show median (vertical bar), 25th and 75th percentiles (lower and upper bounds of the box, respectively) and 1.5 x IQR (or minimum/maximum values; end of whiskers). l, Association of endothelial cell neighborhoods with CTAP-M and CTAP-F. For these CNA results, cells in UMAPs are colored in red (positive) or blue (negative) if their neighborhood is significantly associated with the CTAP (FDR < 0.05), and gray otherwise. Distributions of neighborhood correlations are shown for clusters with >50% of neighborhoods correlated with the CTAP at FDR < 0.05; global p-values were obtained based on the permutation testing from the CNA package.
Synovial endothelial cells separated into lymphatic endothelial cells and blood endothelial cells. Lymphatic endothelial cells (E-4), identified on the basis of high expression of the lymphatic markers LYVE1 and PROX1, exhibited high expression of CCL21 and FLT435,36 (Fig. 2f and Extended Data Figs. 2 and 7g,k). Among blood endothelial cells, we observed several clusters along an arterial-to-venous axis, including NOTCH4+ arteriolar (E-3), SPARC+ capillary (E-0) and CLU+ venular (E-1 and E-2) cells. Arteriolar cells expressed high levels of CXCL12, LTBP4, NOTCH4 and the NOTCH ligand DLL4. SPARC+ capillary cells expressed collagen and extracellular matrix genes. Venular cells further subdivided into LIFR+ (E-1) and ICAM1+ (E-2) and had high expression of inflammatory genes such as IL6 and HLA genes, along with genes that facilitate leukocyte transmigration, such as ICAM1 and SELE (E-selectin) (Extended Data Fig. 7i).
CTAPs are defined by specific cell states
We used co-varying neighbourhood analysis (CNA) to identify single-cell-resolution ‘neighbourhoods’ associated with individual CTAPs. We use ‘expanded’ and ‘depleted’ to refer to differences in relative abundance within a cell type, accounting for age, sex and cell count per sample. Of note, this may not reflect a difference relative to total synovial cells. We tested each cell type for associations with all CTAPs, recognizing that even less enriched cell types may contain critical subsets.
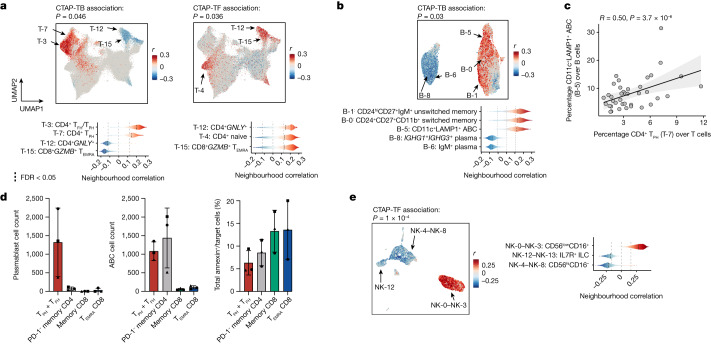
We observed skewed T and B cell neighbourhoods in CTAP-TB (permutation P = 0.046 and 0.03, respectively) (Fig. 3a, Extended Data Fig. 3e, Supplementary Tables 7 and 8). T cell neighbourhoods among CD4+ TFH/TPH (T-3) and CD4+ TPH (T-7) cells were expanded, whereas neighbourhoods among cytotoxic CD4+GNLY+ (T-12) and CD8+GZMB+ cells (T-15) were depleted. Among B cells, we observed expanded neighbourhoods in memory B (B-0 and B-1) and ABC (B-5) clusters, whereas IgG1+IgG3+ and IgM+ plasma cells (B-8 and B-6) were relatively depleted (Fig. 3b and Extended Data Fig. 4e). We note that although plasma cells are depleted among B/plasma cells in CTAP-TB, plasma cells are enriched among total cells in CTAP-TB (4.1% compared with 0.6–3.1% in other CTAPs) (Extended Data Fig. 4e,f). Although TPH (T-7), TFH/TPH (T-3) and ABC (B-5) cells are enriched in CTAP-TB, they are present in all six CTAPs (Extended Data Figs. 3e and 4e). By contrast, germinal centre cells (B-4) were almost exclusively found in CTAP-TB (Extended Data Fig. 4e). Consistent with a role for TFH/TPH and IL-21 in ABC generation37, the frequency of ABCs (B-5) amongst B/plasma cells correlated with the proportion of TPH (T-7) and TFH/TPH (T-3) among T cells (Pearson r = 0.50, P = 3.7 × 10⁻⁶ and Pearson r = 0.24, P = 0.034, respectively) (Fig. 3c and Extended Data Fig. 4g).
Fig. 3. Different T cell, B cell and NK cell populations are associated with rheumatoid arthritis CTAPs.
a, Associations of T cell neighbourhoods with CTAP-TB and CTAP-TF. P values are from the CNA test for each CTAP within T cells. b, Associations of B/plasma cell neighbourhoods with CTAP-TB. c, Percentage of TPH (T-7) as a proportion of T cells and CD11c+ LAMP1+ ABCs (B-5) as a proportion of B/plasma cells for each donor sample. R and P values are calculated from Pearson correlation and two-sided t-tests, respectively. The shaded region represents 95% confidence interval. d, Plasmablast count (left), ABC count (centre) or percentage of annexin+ cells (right) stratified by co-cultured T cell subset. Points represent samples and shapes correspond to samples from the same donor, which were tested in independent experiments (n = 3). Data are mean ± s.d. e, Associations of NK cell neighbourhoods with CTAP-TF. a,b,d, For all CNA results, cells in UMAPs are coloured red (positive) or blue (negative) if their neighbourhood is significantly associated with the CTAP (false discovery rate (FDR) < 0.05), and grey otherwise. Distributions of neighbourhood correlations are shown for clusters with more than 50% of neighbourhoods correlated with the CTAP at FDR < 0.05. Global P values were obtained based on permutation testing from the CNA package.
We hypothesized that the preferential enrichment of TPH and TFH cells in CTAP-TB reflected the ability of these subsets to sustain and activate B cells. To test this hypothesis, we sorted TPH and TFH cells and other memory CD4+ T cells, as well as CD45RA+ effector memory CD8+ T (TEMRA) cells and CD45RO+ memory CD8+ T cells, which are enriched for GZMB+ and GZMK+ CD8+ T cells, respectively16 from blood and co-cultured them with B cells and staphylococcal enterotoxin B superantigen (Fig. 3d, Extended Data Fig. 4h and Supplementary Fig. 8). TPH and TFH cells efficiently induced B cell differentiation into plasmablast and ABC phenotypes. Notably, non-TFH/TPH memory CD4+ T cells were also able to induce ABC differentiation, but not plasmablast differentiation. CD8+ T cells did not induce B cell differentiation despite being functionally potent in cytotoxicity assays.
T cell neighbourhoods enriched in CTAP-TF (permutation P = 0.036) consisted mainly of cytotoxic CD4+GNLY+ (T-12) and CD8+GZMB+ cells (T-15) as well as naive CD4+ and CD8+ T cells (T-4 and T-16) (Fig. 3a, Extended Data Fig. 3e and Supplementary Tables 7 and 8). GZMB-expressing CD56lowCD16+ NK cells (NK-0–3) were also enriched in CTAP-TF, and the proportion of GZMB+ NK cells (NK-0–3) correlated with the proportion of GZMB+ T cells (T-15) (Pearson r = 0.63, P = 4.87 × 10⁻¹⁰; Fig. 3e and Extended Data Fig. 5g). Conversely, GZMK+ CD8+ T cells (T-13 and T-14) correlated with GZMK+ NK cells (NK-4–8, Pearson r = 0.51, P = 1.41 × 10⁻⁶), suggesting that GZMB- and GZMK-expressing CD8+ T and NK cells share a transcriptional programme influenced by their tissue environments.
CTAP-TF also exhibited specific expansion among CXCL12+SFRP1+ sublining fibroblasts (F-6), which expressed IL6 but not HLA-DR genes (Fig. 4a and Extended Data Fig. 7c). By contrast, CTAP-M demonstrated enrichment of CD74hiHLAhi sublining fibroblast neighbourhoods (F-5) among stromal cells (permutation P = 10−3). We also observed that SPARC+ capillary cells (E-0) were expanded among endothelial cells in CTAP-M (permutation P = 7 × 10⁻³; Extended Data Fig. 7l).
Fig. 4. Different stromal, myeloid and endothelial cell populations are associated with rheumatoid arthritis CTAPs.
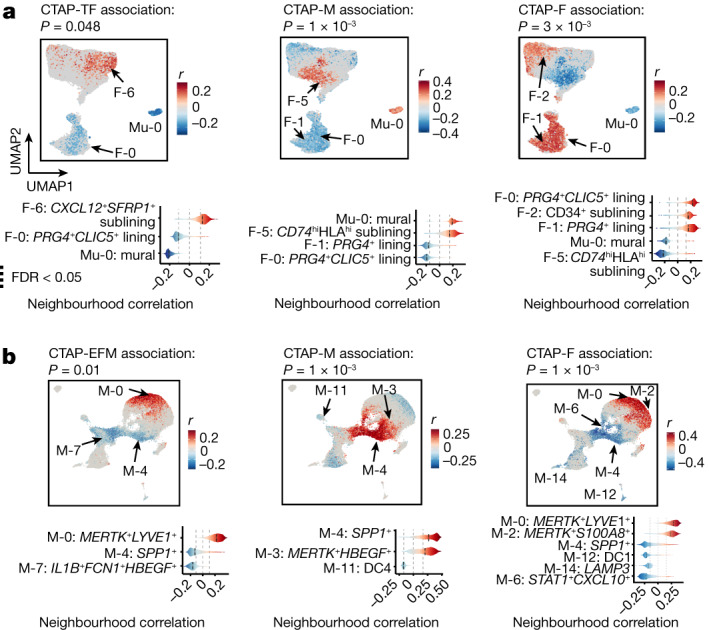
a, Association of stromal cell neighbourhoods with CTAP-TF, CTAP-M and CTAP-F. b, Association of myeloid cell neighbourhoods with CTAP-EFM, CTAP-M and CTAP-F for all CNA results. Cells in UMAPs are coloured red (positive) or blue (negative) if their neighbourhood is significantly associated with the CTAP (FDR < 0.05), and grey otherwise. Distributions of neighbourhood correlations are shown for clusters with more than 50% of neighbourhoods correlated with the CTAP at FDR < 0.05. Global P values were obtained based on the permutation testing from the CNA package.
Among myeloid populations, cell neighbourhoods within SPP1+ (M-4) and MERTK+HBEGF+ (M-3) macrophages were enriched in CTAP-M, suggesting recruitment of inflammatory monocytes and transition to macrophage function (Fig. 4b). Pro-inflammatory IL1B+ macrophages (M-7), known to be expanded in patients with rheumatoid arthritis in general8, were less frequent in CTAP-EFM relative to other CTAPs.
Of note, CTAP-M and CTAP-F exhibited contrasting cell enrichments and depletions across three cell types. (Fig. 4a,b and Extended Data Fig. 7l). Specifically, lining (F-0 and F-1) and CD34+ sublining (F-2) fibroblasts (permutation P = 3 × 10⁻³), MERTK+LYVE1+ (M-0) and MERTK+S100A8+ (M-2) macrophages (permutation P = 10−3), and LIFR+ venular (E-1) and ICAM1+ venular (E-2) endothelial cells were expanded in CTAP-F (permutation P = 3 × 10⁻³) and depleted in CTAP-M.
Given their high plasticity, we hypothesized that monocytes entering synovial tissue are shaped by the network of cell types and soluble factors associated with each CTAP. We tested this concept for CTAP-M and CTAP-TM by exposing human blood CD14+ monocytes to factors enriched in these tissues and then examining which CTAP-associated myeloid state these cells resembled (Extended Data Fig. 6g). We found that activated CD8+ T cell factors that mark CTAP-TM induced a set of genes that mark the STAT1+CXCL10+ macrophage state that is enriched in CTAP-TM (Extended Data Fig. 6h,i). Conversely, factors enriched in CTAP-M, including M-CSF, TGFβ and fibroblasts, drove monocytes towards the MERTK+HBEGF+ phenotype that is enriched in CTAP-M.
Cell states are associated with histology
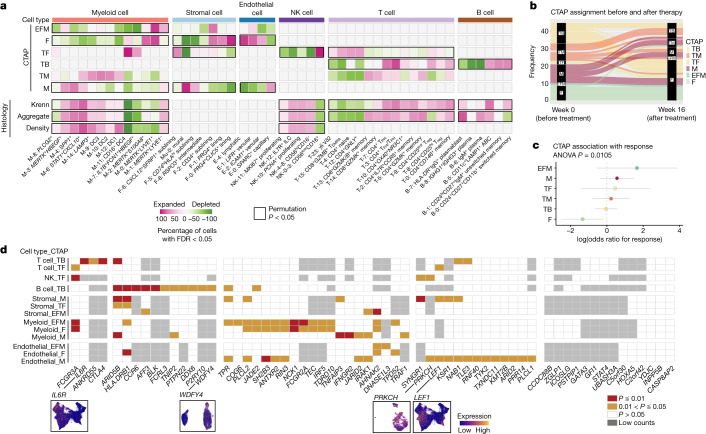
We used CNA to test for cell neighbourhoods associated with histologic features of rheumatoid arthritis synovium, including Krenn scores and discrete histologic cell density and aggregate scores reflecting inflammatory cell infiltration and organization (Fig. 5a, Supplementary Fig. 9a and Methods). Several T cell states were associated with aggregate scores (permutation P = 0.0088), including neighbourhoods among CD4+ TFH/TPH (T-3), GZMK+CD8+ T cells, and some memory CD4+ T cells (Fig. 5a, Supplementary Fig. 9b and Supplementary Table 7). A GZMK+ NK cell cluster, NK-4, was associated with both density and aggregate scores (permutation P = 3 × 10⁻⁴ and 10−4, respectively) (Supplementary Fig. 9b). Neighbourhoods within STAT1+CXCL10+ (M-6), SPP1+ (M-4) and inflammatory DC3 (M-9) (Fig. 5a and Supplementary Fig. 9b) were associated with both aggregate and density scores (permutation P = 0.006 and P = 0.005, respectively). Among B cells, IgM+ plasma cells (B-6), plasmablasts (B-7) and ABCs (B-5) were associated with aggregate scores (permutation P = 0.007) (Fig. 5a and Supplementary Fig. 9b). These disparate cell-state associations with aggregate scores probably reflect the diverse composition of aggregates, which can be T cell-dominant, plasma cell-dominant or T and B cell follicles38,39.
Fig. 5. Single-cell CNA reveals significant association of cell states with disease indicators, genetic factors and treatment response.
a, Heat map of CNA associations of specific cell states with each rheumatoid arthritis CTAP. Colours represent the percentage of cell neighbourhoods from each cell state with local (neighbourhood-level) phenotype correlations passing FDR < 0.05 significance from white to pink (expanded) or green (depleted). Cell types significantly associated globally (at cell-type level) with a phenotype at permutation P < 0.05 are boxed in black. b, Alluvial plot showing CTAP classification of samples prior to and at week 16 after starting treatment with either tocilizumab or rituximab (n = 45). c, Associations between clinical response and CTAPs after correcting for sex, age, treatment and CCP status in the baseline (week 0) samples from the R4RA study (n = 133). The percentage of variance explained by CTAPs alone and P value are calculated with ANOVA tests. Dots represent odds ratios and bars represent 95% confidence intervals. d, Significance of correlations between rheumatoid arthritis risk gene expression and CTAP-associated cells. Significance levels are shown in red (P < 0.01), yellow (0.01 < P < 0.05), and white (P > 0.05). Genes with low counts (more than one unique molecular identifier among less than 5% of cells with a given cell type) were not analysed in that cell type (grey boxes). Bottom, UMAPs displaying normalized expression levels of selected genes in T cells (IL6R and LEF1), B cells (WDFY4) and endothelial cells (PRKCH).
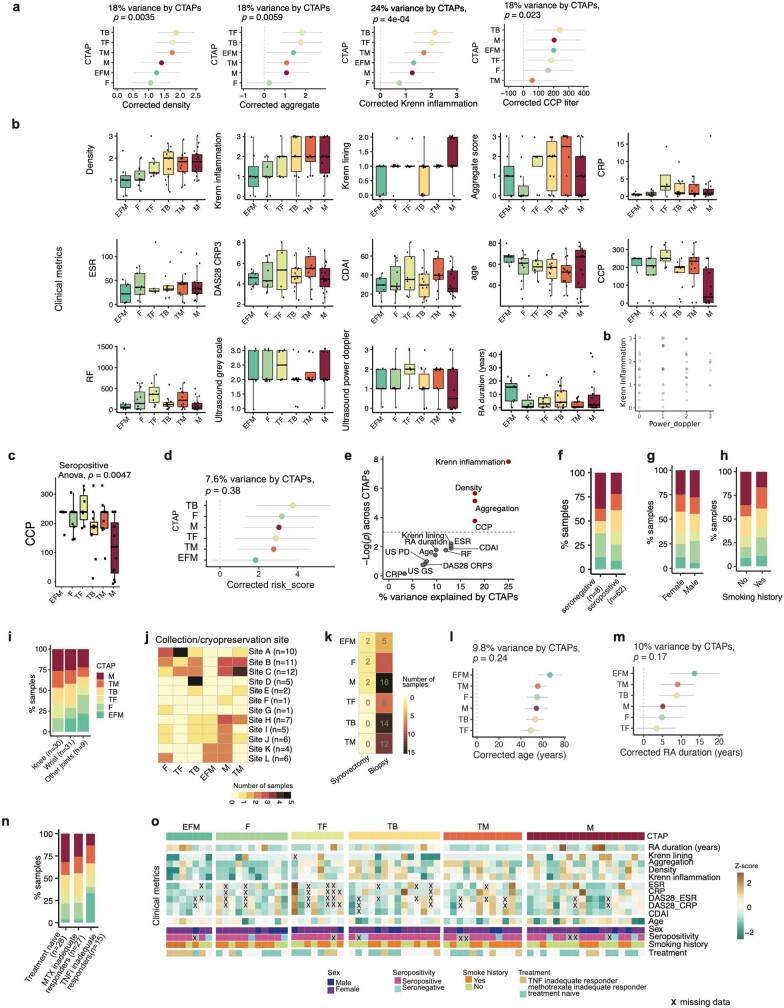
After accounting for age, sex, cell count and clinical collection site (Methods), we found that CTAPs account for 18% of variance of histologic density (P = 0.0035) and 18% of variance for aggregates (P = 0.0059), with CTAP-TB and CTAP-TF having the highest scores for both (Extended Data Fig. 8a,b). Consistent with these observations, CTAPs are associated with Krenn inflammation scores (P = 4 × 10⁻⁴), but not with Krenn lining scores (P = 0.11) (Extended Data Fig. 8a,b). Ultrasound measurements in the biopsied joint did not vary by CTAP (Extended Data Fig. 8b). In our dataset, we observed no association between Krenn inflammation and power doppler scores, consistent with some previous studies40–42 (Extended Data Fig. 8c).
Extended Data Fig. 8. Association of single-cell RA CTAPs with different clinical characteristics.
a, Associations between clinical features and CTAPs (N = 70), adjusting covariates for age, sex, cell number, and clinical collection site. Percentage of variance explained by CTAPs alone and p-value are calculated with ANOVA tests. Points represent odds ratios and bars represent 95% confidence intervals. b, Clinical, histologic, and ultrasound parameters of patients in each CTAP. For all box plots, each dot represents an individual (N = 70); boxes show median (vertical bar), 25th and 75th percentiles (lower and upper bounds of the box, respectively) and 1.5 x IQR (or minimum/maximum values; end of whiskers), c, Dotplot of Krenn inflammation versus power doppler scores. Each point is a patient. d, CCP levels among seropositive patients alone (N = 59). Points represent individuals and box plots show median (vertical bar), 25th and 75th percentiles (lower and upper bounds of the box, respectively) and 1.5 x IQR (or minimum/maximum values; end of whiskers)., e, Corrected RA HLA-DRB1 risk scores and their associations with CTAPs, percent of variance explained by CTAPs only and p-value are calculated with ANOVA test, f, Clinical, demographic, and histologic metrics plotted by percentage of variance explained by CTAPs and the ANOVA p-value for its association with CTAPs. Features in red are significant at p < 0.05. g, CTAP frequency among seropositive (CCP-positive, RF-positive, or both) versus seronegative patients. h, CTAP frequency by sex. i, CTAP frequency by smoking history, j, CTAP frequency by anatomic site of synovial biopsy. k, Number of samples per CTAP in each collection/cryopreservation site. l, Number of patient samples for each CTAP between biopsy and synovectomy, m-n, Association of age and RA duration with CTAPs (N = 70), adjusting covariates for age, sex, cell number, and clinical collection site. Points represent odds ratios and bars represent 95% confidence intervals. Percentage of variance explained by CTAPs alone and p-values are calculated with one-way ANOVA tests. o, Sample distributions across CTAPs by recruitment cohort, p, Heatmap of clinical variables for patient samples grouped by CTAP. Boxes are colored based on z-score of the metric across samples. “X” represents missing data.
CTAPs are largely independent of clinical metrics
Cyclic citrullinated peptide (CCP) autoantibodies are known to confer a higher risk of severe disease and radiographic progression43. CCP titre values differed across CTAPs (P = 0.023, 18% variance), with CTAP-M having the lowest CCP titres, even after restricting the analysis to seropositive patients (P = 0.0047) (Extended Data Fig. 8a,d). HLA-DRB1 is the strongest genetic rheumatoid arthritis risk factor for seropositive disease, yet we did not find that HLA-DRB1 risk alleles were associated with a particular CTAP, although there was a trend toward association with CTAP-TB (Extended Data Fig. 8e and Methods).
We did not find a significant association between CTAPs and disease activity score-28 for rheumatoid arthritis with C-reactive protein (DAS28-CRP) or CDAI (Extended Data Fig. 8b), although our patient cohort is not ideal for testing such associations because it only includes patients with high disease activity. CTAPs were also independent of other clinical factors, smoking history and sex, and mostly independent of anatomic category and clinical site (Extended Data Fig. 8b,f–l and Supplementary Table 9). Patients with CTAP-EFM had statistically nonsignificant trends to be older, have longer-standing rheumatoid arthritis and be inadequate responders to TNF inhibitors (Extended Data Fig. 8m–p).
CTAPs have disease-relevant cytokine profiles
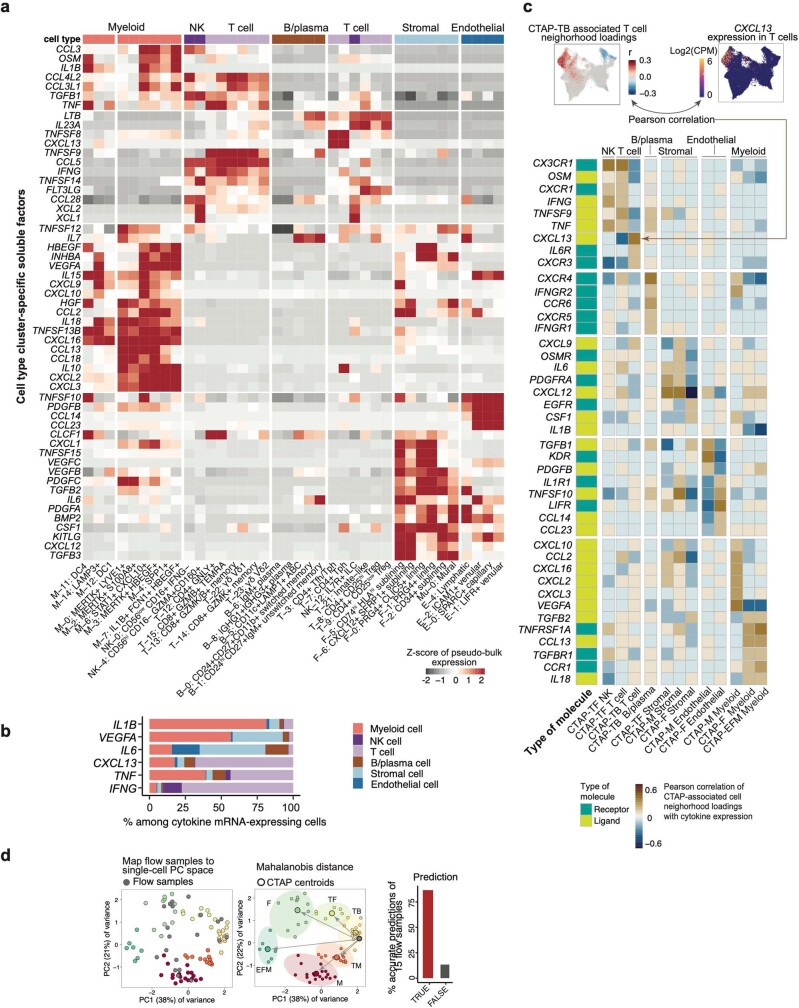
We next analysed transcript levels of cytokines, chemokines, and their receptors, recognizing that these transcripts are often sparse in single-cell RNA-seq data (Supplementary Fig. 10). Most cytokines and chemokines are detected predominantly in one cell type, although some key cytokines were produced by multiple cell types (Extended Data Fig. 9a,b). For example, we detected TNF in roughly equal numbers of T cells and myeloid cells, whereas fibroblasts, endothelial cells and B cells dominated among cells with detectable IL6.
Extended Data Fig. 9. Correlations of cytokines/receptors with CTAP-associated cells.
a, Heatmap depicting expression profiles of cell type cluster-specific soluble factors, b, Percent contribution among cytokine mRNA-expressing cells from each major cell type, c, At top, expression of CXCL13, a representative cytokine that is significantly correlated with CTAP-associated cell neighborhoods. Cells in UMAPs of CTAP associations are colored in red (positive) or blue (negative) if their neighborhood is significantly associated with the CTAP (FDR < 0.05), and gray otherwise. Cells in expression UMAPs are colored from blue (low) to yellow (high). Below, an aggregate heatmap visualizing the cytokines and receptors whose expressions are significantly correlated (r > 0.5) with CTAP-associated cells; we then hierarchically clustered them based on cell type-specific CTAPs. Each gene is labeled with receptor/ligand designation. d, Pipeline and results to map and classify flow cytometry samples by single-cell RA CTAPs. Bar plot shows accuracy of flow sample classification (i.e., assigned to the same CTAP as a single-cell sample from the same patient).
Next, we correlated CTAP neighbourhood association scores with the expression of key cytokines and receptors to identify soluble factors produced by CTAP-associated cell states. For example, as predicted, CTAP-TB, enriched for TFH/TPH cell states, had T cell neighbourhood association scores that correlated with expression of the TFH/TPH marker CXCL13 (Fig. 3a and Extended Data Fig. 9c). By contrast, CTAP-TF-associated GZMB+ T and NK cell neighbourhoods had association scores correlating with the expression of IFNG and TNF (Fig. 3a,e and Extended Data Fig. 9c), suggesting that these cytokines may be key molecular drivers of CTAP-TF.
In some CTAPs, this analysis revealed potential cytokine networks. For example, in CTAP-M, myeloid neighbourhood association scores correlated with expression of angiogenic factor VEGFA, whereas endothelial cell neighbourhood association scores correlated with expression of KDR (also known as VEGFR2), potentially explaining the observed enrichment of capillaries in this CTAP (Extended Data Figs. 7l and 9c). By contrast, in CTAP-F, enriched LIFR+ and ICAM1+ venular endothelial cell neighbourhoods expressed high levels of CCL14, whose cognate receptor CCR1 was highly expressed by MERTK+ macrophage neighbourhoods, which are also enriched in CTAP-F (Fig. 4b and Extended Data Fig. 7l and Fig. 9c). Cell–cell communication analysis confirmed these putative interactions (Supplementary Fig. 11).
Our study included three patients with replicate biopsies obtained from the same joint 98 to 190 days after the initial biopsy. Cell-type composition of repeat biopsies was similar to the initial biopsy (permutation P = 0.073) (Supplementary Fig. 12a,b), but more samples are needed to understand how dynamic CTAPs are.
Mapping CTAPs to other patient cohort data
To enable investigation of these and other CTAP-related questions in larger studies, we examined whether samples can be classified into CTAPs using lower-resolution technologies such as flow cytometry and bulk tissue RNA-seq. We first built a nearest-neighbour classifier for flow cytometry data and were able to accurately replicate CITE-seq-based CTAP assignments (accuracy = 87%; Extended Data Fig. 9d, Supplementary Fig. 12c,d and Supplementary Table 10).
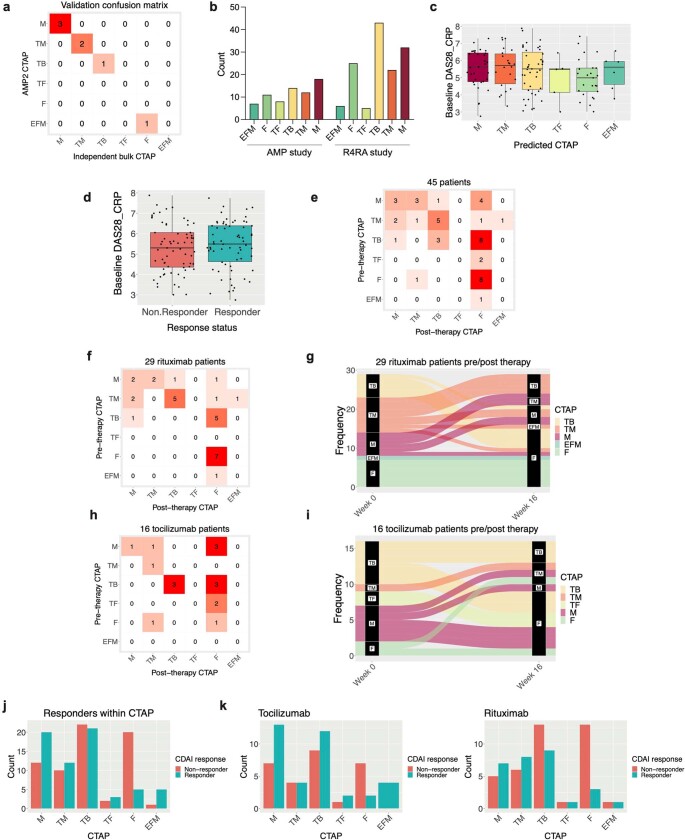
We next developed a method to classify CTAPs using bulk RNA-seq data of intact synovial tissue from a recent clinical trial6. CTAP classification based on bulk RNA-seq agreed with the CITE-seq-based CTAP assignment for 6 out of 7 samples in the present study that were also analysed with bulk RNA-seq (Extended Data Fig. 10a).
Extended Data Fig. 10. Assigning CTAP labels to bulk RNA-seq samples and clinical association analysis.
a, Confusion matrix showing CTAP assignment by the single-cell CITE-seq panel (gold standard) versus classification of synovial tissue bulk RNA-seq obtained from the same individuals (N = 7). b, Patients per CTAP category in the current AMP study, which enrolled a clinically diverse patient cohort, versus the published R4RA study, which restricted enrollment to patients with inadequate response to TNF inhibitor therapies. c, Baseline DAS28-CRP scores stratified by predicted CTAP (N = 133 patients). d, Baseline DAS28-CRP score stratified by clinical response status ( ≥ 50% improved CDAI after treatment) (N = 133 patients). In c and d, Points represent individuals and box plots show median (vertical bar), 25th and 75th percentiles (lower and upper bounds of the box, respectively) and 1.5 x IQR (or minimum/maximum values; end of whiskers). e, Confusion matrix showing predicted CTAP assignment of pre-treatment (week 0) and post-treatment (week 16) synovial tissue samples obtained from 45 patients. f-g, Confusion matrix and alluvial plot showing predicted CTAP assignment before and after treatment with rituximab (N = 29). h-i, Confusion matrix and alluvial plot showing predicted CTAP assignment before and after treatment with tocilizumab (N = 16). j, Graph of responder and non-responders stratified by CTAP (N = 133) among all patients in the R4RA study. k, Graph of responders and non-responders among patients receiving tocilizumab (left, N = 65) or rituximab (right, N = 68), stratified by CTAP.
We applied our CTAP classification algorithm to bulk RNA-seq profiles from the R4RA clinical trial comparing rituximab and tocilizumab for the treatment of patients with rheumatoid arthritis with inadequate response to TNF inhibitor therapy44 (n = 133). The distribution of CTAPs differs between these datasets, probably reflecting differences in cohort recruitment criteria (Extended Data Fig. 10b). As in our cohort, we found no association between CTAP assignment and disease activity or between treatment response and disease activity (Extended Data Fig. 10c,d), supporting our hypothesis that CTAPs reflect distinct inflammatory phenotypes driving arthritis rather than differences in clinical disease activity.
To investigate whether CTAPs change over time, we applied our CTAP classification algorithm to 45 patients from the R4RA trial who had synovial tissue biopsies before and 16 weeks after starting treatment. CTAPs were dynamic during this period, with 30 out of 45 (67%) patients changing to a different CTAP (Fig. 5b and Extended Data Fig. 10e). Patients in the tocilizumab and rituximab treatment arms exhibited similar frequencies of CTAP change (20 out of 29 (69%) and 10 out of 16 (63%) patients, respectively) (Extended Data Fig. 10f–i). Among patients who changed CTAPs, CTAP-F was the most common CTAP at week 16 (16 out of 30 (53%)), consistent with rituximab and tocilizumab targeting inflammatory cells and pathways.
Response to biologic therapy varies by CTAP
To determine whether CTAPs can predict the response to these treatments, we used our algorithm to determine the CTAPs of pre-treatment bulk RNA-seq for R4RA samples (n = 133). We then compared the frequencies of responders (defined as at least 50% improvement in CDAI) versus non-responders among the CTAPs (Extended Data Fig. 10j,k). We found that responses varied by CTAP (P = 0.0105), with CTAP-F having the poorest response to both treatments, even after controlling for covariates (odds ratio = 0.2619, P = 0.0403; Fig. 5c).
CTAP-enriched cell states express risk genes
We next tested whether genes implicated by recent multi-ancestry rheumatoid arthritis genetic studies are preferentially expressed by cell states associated with specific CTAPs45,46. We identified 71 genes that were likely to be causal, all of which were detected in one or more cell types in our dataset (Methods, Supplementary Fig. 13a and Supplementary Table 11).
We identified 48 genes with expression that was significantly positively correlated with CNA loadings for one or more CTAPs for a cell type (P < 0.05, controlling for expression level), indicating that cell states expanded in that CTAP specifically express the rheumatoid arthritis risk gene (Fig. 5d). This is significantly higher than predicted by chance (median = 34, permutation P < 0.01; Supplementary Fig. 13b,c). Some cell types expressed different rheumatoid arthritis genes in different subsets of cells (for example, LEF1 in CTAP-TF-associated naive states and IL6R in CTAP-TB-associated TFH/TPH states). HLA-DRB1 expression was correlated with CTAP-associated cell states in several cell types (Fig. 5d). CTAP-associated rheumatoid arthritis risk genes may also be expressed agnostic of CTAP in a given cell type, such as IL6R in myeloid cells (Supplementary Fig. 13d).
Some genes point to signalling pathways that may be important in a specific CTAP, such as VEGF in CTAP-M (Extended Data Fig. 9c). PRKCH—which encodes protein kinase C (PKC)-η, a mediator of VEGF-induced endothelial cell differentiation47—is highly expressed in endothelial cell states expanded in CTAP-M, which has high expression of VEGF receptor genes KDR and FLT1 among expanded endothelial cell states and VEGFA among expanded myeloid cell states (Fig. 5d and Supplementary Fig. 13e–g).
Discussion
We constructed a comprehensive rheumatoid arthritis synovial tissue reference of more than 314,000 single cells which revealed diverse cellular composition that we characterized into six CTAPs. Previously identified pathogenic cell states in rheumatoid arthritis are expanded in specific CTAPs. For example, CD4+ TFH and TPH cells, which are enriched among T cells in rheumatoid arthritis compared with osteoarthritis11, are present in synovium of all CTAPs but are most expanded in CTAP-TB. Our work also suggests the presence of extra-follicular activation pathways, especially in CTAP-TB, given the rarity of germinal centre dark-zone B cells and abundance of ABCs. Our study also provided more granular insights into previously identified pathogenic cells. For example, inflammatory sublining fibroblast subsets CXCL12+ and CD74hiHLAhi cells were enriched in CTAP-TF and CTAP-M, respectively. MERTK+HBEGF+ and SPP1+ macrophages were also enriched in CTAP-M, probably reflecting different inflammatory axes. These and other instances of co-enriched populations (for example, GZMK+ versus GZMB+CD8+ T and NK cells) inspire new questions about cell–cell interactions underlying inflammatory phenotypes in rheumatoid arthritis and other tissues and diseases.
We found that CTAPs are associated with histologic and serologic (CCP) parameters, in line with studies48 that report increased lymphocyte infiltration (suggesting CTAP-TB, CTAP-TF or CTAP-TM) in CCP-positive synovium compared with CCP-negative synovium. Our finding that CTAP-M, and not CTAP-F or CTAP-EFM, was associated with CCP-negative status warrants further investigation in future studies.
CTAPs can be inferred from single-cell RNA-seq, bulk RNA-seq or flow cytometry data to provide cellular and molecular insights in clinical trials. Even within the more limited clinical diversity of the R4RA cohort44, we found that CTAPs can change over time with treatment, and that CTAP-F was associated with poor clinical response. The dynamic heterogeneity of rheumatoid arthritis synovitis may explain the observation that clinical measures of patients treated with TNF inhibitors do not fall into a bimodal distribution of responders and non-responders49. It is possible that specific CTAPs are more likely to respond to specific therapies that preferentially target infiltrating cell types and relevant pathways. We anticipate that future longitudinal studies will investigate the association of CTAP changes with treatment effects across a larger array of treatments.
The CTAP paradigm provides a tissue classification system that captures coarse cell-type and fine cell-state heterogeneity. This model has the potential to serve as a powerful prototype to classify other types of tissue inflammation, including other immune-mediated diseases. A deeper understanding of the heterogeneity of tissue inflammation in rheumatoid arthritis and other autoimmune diseases may provide new insights into disease pathogenesis and reveal new treatment targets, and key elements of precision medicine.
Reporting summary
Further information on research design is available in the Nature Portfolio Reporting Summary linked to this article.
Online content
Any methods, additional references, Nature Portfolio reporting summaries, source data, extended data, supplementary information, acknowledgements, peer review information; details of author contributions and competing interests; and statements of data and code availability are available at 10.1038/s41586-023-06708-y.
Supplementary information
This file contains Supplementary Methods, Supplementary Figs. 1–3 and 5–13, Supplementary Tables 1–4, 6, 9 and 10 and Supplementary References.
Genes associated with RA risk alleles.
Acknowledgements
This work was supported by the Accelerating Medicines Partnership® Rheumatoid Arthritis and Systemic Lupus Erythematosus (AMP® RA/SLE) Network. AMP is a public-private partnership (AbbVie, Arthritis Foundation, Bristol-Myers Squibb Company, Foundation for the National Institutes of Health, GlaxoSmithKline, Janssen Research and Development, LLC, Lupus Foundation of America, Lupus Research Alliance, Merck & Co., Inc., National Institute of Allergy and Infectious Diseases, National Institute of Arthritis and Musculoskeletal and Skin Diseases, Pfizer, Inc., Rheumatology Research Foundation, Sanofi and Takeda Pharmaceuticals International, Inc.) created to develop new ways of identifying and validating promising biological targets for diagnostics and drug development. Funding was provided through grants from the National Institutes of Health (UH2-AR067676, UH2-AR067677, UH2-AR067679, UH2-AR067681, UH2-AR067685, UH2- AR067688, UH2-AR067689, UH2-AR067690, UH2-AR067691, UH2-AR067694 and UM2- AR067678). Accelerating Medicines Partnership and AMP are registered service marks of the US Department of Health and Human Services. This work was also supported by the PhRMA Foundation and the Arthritis National Research Foundation Award (to F.Z.); NIH NIAMS K08AR081412, Rheumatology Research Foundation Investigator Award, and Arthritis National Research Foundation Award (to A.H.J.); NIH NHGRI T32HG002295 and NIAMS T32AR007530 (to A. Nathan); NIH NIAMS K08AR077037, Rheumatology Research Foundation Innovative Research Award, and Burroughs Wellcome Fund Career Award in Medical Sciences (to K. Wei); NIH NIGMS T32GM007753 (to J.B.K.); NIH NIAMS R01078268 and NCATS UL1 TR001866 (to D.E.O.); NIH NIAID T32AR007258 (to K.S.); Research into Inflammatory Arthritis Centre Versus Arthritis (22072), IMI-RTCure (777357) and the NIHR Birmingham Biomedical Research Centre (BRC-1215-20009) (to A.F. and D.S.T.); NIH NIAMS K08AR072791 and Burroughs Wellcome Fund Career Award in Medical Sciences (to D.A.R.); NIH NIAID R01AI148435 (to L.T.D.); NIH NIAMS R21AR071670 and P30 AR069655 (to J.H.A.); NIH NIAMS R01AR073833 and R01AR073290 (to M.B.B.); NIH NHGRI U01HG009379 and NIAMS R01AR063759 (to S.R.). We especially acknowledge people in the AMP RA/SLE Network: A. Arazi, C. Berthier, J. Buyon, M. Dall’Era, A. Davidson, B. Diamond, A. Fava, J. Grossman, N. Hacohen, D. Hildeman, J. Hodgin, T. Hwang, M. Ishimori, K. Kalunian, D. Kamen, M. Kretzler, H. Maecker, R. Mao, M. McMahon, F. Payan-Schober, M. Petri, C. Putterman, D. Simmons, T. Tuschl, D. Wofsy and Steve Woodle.
Extended data figures and tables
Author contributions
L.G.-P., K.D.D., D.T., A.C., G.S.F., M.M., I.S., A.B.-A., A.M.M., A. Nerviani, F.R., C.P., L.B.H. and D.H., recruited patients and obtained synovial tissues. L.W.M., S.M.G., H.P., V.M.H., A.F., V.P.B. and J.H.A. contributed to the procurement and processing of samples and design of the AMP study. E.D., E.M.G. and B.F.B. performed histologic assessment of tissues. D.W., K.P.L., A.F. and V.P.B. curated and analysed histologic and clinical data. W.A. provided project management and curated histologic and clinical data. K. Wei, A.H.J., G.F.M.W., A. Nathan and M.B.B. designed and implemented the tissue disaggregation, cell sorting and single-cell sequencing pipeline. A.H.J., K. Wei and G.F.M.W. supervised and executed the tissue disaggregation pipeline. S.N., J.R.-M. and N. Meednu. performed immunofluorescence microscopy and analysed these data together with M.C. and A.H.J. K.E.M. and I.M. performed and analysed functional cellular assays. M.J.L., F.R. and C.P. contributed unpublished data from clinical trials. F.Z., A. Nathan, N. Millard, M.C., Q.X., M.G.-A., J.B.K., K. Weinand, J.M., L.R. and S.R. conducted computational and statistical analysis. A.H.J., K. Wei, M.B.B., J.H.A., L.T.D., D.A.R., F.Z., A. Nathan, S.R., D.E.O., J.R.-M. and A.F. provided input on cellular analysis and interpretation. D.E.O., J.R.-M., A.F. and J.H.A. provided input on histologic analyses. N. Millard and K.S. implemented the website. S.R., M.B.B., J.H.A., L.T.D. and D.A.R. supervised the research. F.Z., A.H.J., A. Nathan, N. Millard, Q.X. and S.R. wrote the initial draft. F.Z., A.H.J., A. Nathan, K. Wei, N. Millard, D.A.R, L.T.D., J.H.A, M.B.B. and S.R. edited the draft. AMP RA/SLE Network members contributed to this work by managing patient recruitment, curating clinical data, obtaining and processing synovial tissue samples, managing biorepositories, conducting histologic or computational analysis, providing software code, providing website support and/or providing input on data analysis and interpretation. All authors participated in editing the final manuscript.
Peer review
Peer review information
Nature thanks Judy Cho and the other, anonymous, reviewer(s) for their contribution to the peer review of this work. Peer review reports are available.
Data availability
CITE-seq single-cell expression matrices and sequencing and bulk expression matrices are available on Synapse (10.7303/syn52297840). Associated genotype and clinical data are available through the Arthritis and Autoimmune and Related Diseases Knowledge Portal (ARK Portal, https://arkportal.synapse.org/Explore/Datasets/DetailsPage?id=syn52297840). A cell browser website https://immunogenomics.io/ampra2/ is available to visualize our data and results. AMP Phase 1 single-cell data from ref. 8 are available on Immport (SDY998). PEAC clinical trial RNA-seq data from ref. 6 are available on ArrayExpress (E-MTAB-6141). R4RA clinical trial RNA-seq data from ref. 44 are available on ArrayExpress (E-MTAB-11611). Single-cell and bulk RNA-seq data were aligned to GRCh38 (Ensembl 93), available as part of Cell Ranger v. 3.1.0.
Code availability
The source code for the analyses is available at https://github.com/Immunogenomics/RA_Atlas_CITEseq/ and https://zenodo.org/record/8118599.
Competing interests
A.H.J. reports research support from Amgen outside the submitted work. K. Wei is a consultant for Mestag Therapeutics and Gilead Sciences and reports grant support from Gilead Sciences. S.M.G. reports research support from Novartis and is a consultant for UCB, outside the submitted work. V.M.H. is a co-founder of Q32 Bio and has previously received sponsored research from Janssen and been a consultant for Celgene and BMS, outside the submitted work. A.F. reports personal fees from Abbvie, Roche and Janssen and grant support from Roche, UCB, Nascient, Mestag, GlaxoSmithKline and Janssen, outside the submitted work. D.A.R. reports personal fees from Pfizer, Janssen, Merck, Scipher Medicine, GlaxoSmithKline and Bristol-Myers Squibb and grant support from Janssen and Bristol-Myers Squibb, outside the submitted work. In addition, D.A.R. is a co-inventor on a patent submitted on T peripheral helper cells. M.B.B. is a founder for Mestag Therapeutics and a consultant for GlaxoSmithKline, 4FO Ventures and Scailyte AG. S.R. is a founder for Mestag Therapeutics, a scientific advisor for Janssen and Pfizer, and a consultant for Gilead and Rheos Medicines.
Footnotes
Publisher’s note Springer Nature remains neutral with regard to jurisdictional claims in published maps and institutional affiliations.
These authors contributed equally: Fan Zhang, Anna Helena Jonsson, Aparna Nathan, Nghia Millard
These authors jointly supervised this work: Kevin Wei, Deepak A. Rao, Laura T. Donlin, Jennifer H. Anolik, Michael B. Brenner, Soumya Raychaudhuri
A list of authors and their affiliations appears at the end of the paper
Change history
5/23/2024
In the version of the article initially published, Supplementary Table 11 was missing and is now available with the HTML version of the article.
Contributor Information
Soumya Raychaudhuri, Email: soumya@broadinstitute.org.
Accelerating Medicines Partnership: RA/SLE Network:
Jennifer Albrecht, Jennifer L. Barnas, Joan M. Bathon, David L. Boyle, S. Louis Bridges, Jr, Debbie Campbell, Hayley L. Carr, Adam Chicoine, Andrew Cordle, Patrick Dunn, Lindsy Forbess, Peter K. Gregersen, Joel M. Guthridge, Lionel B. Ivashkiv, Kazuyoshi Ishigaki, Judith A. James, Gregory Keras, Ilya Korsunsky, Amit Lakhanpal, James A. Lederer, Zhihan J. Li, Yuhong Li, Andrew McDavid, Mandy J. McGeachy, Karim Raza, Yakir Reshef, Christopher Ritchlin, William H. Robinson, Saori Sakaue, Jennifer A. Seifert, Anvita Singaraju, Melanie H. Smith, Dagmar Scheel-Toellner, Paul J. Utz, Michael H. Weisman, Aaron Wyse, and Zhu Zhu
Extended data
is available for this paper at 10.1038/s41586-023-06708-y.
Supplementary information
The online version contains supplementary material available at 10.1038/s41586-023-06708-y.
References
- 1.Gravallese EM, Firestein GS. Rheumatoid arthritis—common origins, divergent mechanisms. N. Engl. J. Med. 2023;388:529–542. doi: 10.1056/NEJMra2103726. [DOI] [PubMed] [Google Scholar]
- 2.Alivernini S, Laria A, Gremese E, Zoli A, Ferraccioli G. ACR70-disease activity score remission achievement from switches between all the available biological agents in rheumatoid arthritis: a systematic review of the literature. Arthritis Res. Ther. 2009;11:R163. doi: 10.1186/ar2848. [DOI] [PMC free article] [PubMed] [Google Scholar]
- 3.Alamanos Y, Voulgari PV, Drosos AA. Incidence and prevalence of rheumatoid arthritis, based on the 1987 American College of Rheumatology criteria: a systematic review. Semin. Arthritis Rheum. 2006;36:182–188. doi: 10.1016/j.semarthrit.2006.08.006. [DOI] [PubMed] [Google Scholar]
- 4.Viatte S, Barton A. Genetics of rheumatoid arthritis susceptibility, severity, and treatment response. Semin. Immunopathol. 2017;39:395–408. doi: 10.1007/s00281-017-0630-4. [DOI] [PMC free article] [PubMed] [Google Scholar]
- 5.Oliver J, Plant D, Webster AP, Barton A. Genetic and genomic markers of anti-TNF treatment response in rheumatoid arthritis. Biomark. Med. 2015;9:499–512. doi: 10.2217/bmm.15.18. [DOI] [PubMed] [Google Scholar]
- 6.Lewis MJ, et al. Molecular portraits of early rheumatoid arthritis identify clinical and treatment response phenotypes. Cell Rep. 2019;28:2455–2470.e5. doi: 10.1016/j.celrep.2019.07.091. [DOI] [PMC free article] [PubMed] [Google Scholar]
- 7.Humby F, et al. Rituximab versus tocilizumab in anti-TNF inadequate responder patients with rheumatoid arthritis (R4RA): 16-week outcomes of a stratified, biopsy-driven, multicentre, open-label, phase 4 randomised controlled trial. Lancet. 2021;397:305–317. doi: 10.1016/S0140-6736(20)32341-2. [DOI] [PMC free article] [PubMed] [Google Scholar]
- 8.Zhang F, et al. Defining inflammatory cell states inrheumatoid arthritis joint synovial tissues by integrating single-celltranscriptomics and mass cytometry. Nat. Immunol. 2019;20:928–942. doi: 10.1038/s41590-019-0378-1. [DOI] [PMC free article] [PubMed] [Google Scholar]
- 9.Kuo D, et al. HBEGF+ macrophages in rheumatoid arthritis induce fibroblast invasiveness. Sci. Transl. Med. 2019;11:eaau8587. doi: 10.1126/scitranslmed.aau8587. [DOI] [PMC free article] [PubMed] [Google Scholar]
- 10.Zhang F, et al. IFN-γ and TNF-α drive a CXCL10+ CCL2+ macrophage phenotype expanded in severe COVID-19 lungs and inflammatory diseases with tissue inflammation. Genome Med. 2021;13:64. doi: 10.1186/s13073-021-00881-3. [DOI] [PMC free article] [PubMed] [Google Scholar]
- 11.Rao DA, et al. Pathologically expanded peripheral T helper cell subset drives B cells in rheumatoid arthritis. Nature. 2017;542:110–114. doi: 10.1038/nature20810. [DOI] [PMC free article] [PubMed] [Google Scholar]
- 12.Alivernini S, et al. Distinct synovial tissue macrophage subsets regulate inflammation and remission in rheumatoid arthritis. Nat. Med. 2020;26:1295–1306. doi: 10.1038/s41591-020-0939-8. [DOI] [PubMed] [Google Scholar]
- 13.Wang Y, et al. Rheumatoid arthritis patients display B-cell dysregulation already in the naïve repertoire consistent with defects in B-cell tolerance. Sci Rep. 2019;9:1–13. doi: 10.1038/s41598-019-56279-0. [DOI] [PMC free article] [PubMed] [Google Scholar]
- 14.Wei K, et al. Notch signalling drives synovial fibroblast identity and arthritis pathology. Nature. 2020;582:259–264. doi: 10.1038/s41586-020-2222-z. [DOI] [PMC free article] [PubMed] [Google Scholar]
- 15.Simmons DP, et al. SLAMF7 engagement superactivates macrophages in acute and chronic inflammation. Sci. Immunol. 2022;7:eabf2846. doi: 10.1126/sciimmunol.abf2846. [DOI] [PMC free article] [PubMed] [Google Scholar]
- 16.Jonsson AH, et al. Granzyme K+ CD8 T cells form a core population in inflamed human tissue. Sci. Transl. Med. 2022;14:eabo0686. doi: 10.1126/scitranslmed.abo0686. [DOI] [PMC free article] [PubMed] [Google Scholar]
- 17.Marks KE, Rao DA. T peripheral helper cells in autoimmune diseases. Immunol. Rev. 2022;307:191–202. doi: 10.1111/imr.13069. [DOI] [PMC free article] [PubMed] [Google Scholar]
- 18.Kochi Y. Genetics of autoimmune diseases: perspectives from genome-wide association studies. Int. Immunol. 2016;28:155–161. doi: 10.1093/intimm/dxw002. [DOI] [PMC free article] [PubMed] [Google Scholar]
- 19.Dominguez-Villar M, Hafler DA. Regulatory T cells in autoimmune disease. Nat. Immunol. 2018;19:665–673. doi: 10.1038/s41590-018-0120-4. [DOI] [PMC free article] [PubMed] [Google Scholar]
- 20.Yuseff M-I, et al. Polarized secretion of lysosomes at the B cell synapse couples antigen extraction to processing and presentation. Immunity. 2011;35:361–374. doi: 10.1016/j.immuni.2011.07.008. [DOI] [PubMed] [Google Scholar]
- 21.Rubtsov AV, et al. CD11c-expressing B cells are located at the T cell/B cell border in spleen and are potent APCs. J. Immunol. 2015;195:71–79. doi: 10.4049/jimmunol.1500055. [DOI] [PMC free article] [PubMed] [Google Scholar]
- 22.Radtke D, Bannard O. Expression of the plasma cell transcriptional regulator Blimp-1 by dark zone germinal center B cells during periods of proliferation. Front. Immunol. 2018;9:3106. doi: 10.3389/fimmu.2018.03106. [DOI] [PMC free article] [PubMed] [Google Scholar]
- 23.Weyand CM, Goronzy JJ. Ectopic germinal center formation in rheumatoid synovitis. Ann. N. Y. Acad. Sci. 2003;987:140–149. doi: 10.1111/j.1749-6632.2003.tb06042.x. [DOI] [PubMed] [Google Scholar]
- 24.Ebbo M, Crinier A, Vély F, Vivier E. Innate lymphoid cells: major players in inflammatory diseases. Nat. Rev. Immunol. 2017;17:665–678. doi: 10.1038/nri.2017.86. [DOI] [PubMed] [Google Scholar]
- 25.Gordon S. Phagocytosis: an immunobiologic process. Immunity. 2016;44:463–475. doi: 10.1016/j.immuni.2016.02.026. [DOI] [PubMed] [Google Scholar]
- 26.Jakubzick CV, Randolph GJ, Henson PM. Monocyte differentiation and antigen-presenting functions. Nat. Rev. Immunol. 2017;17:349–362. doi: 10.1038/nri.2017.28. [DOI] [PubMed] [Google Scholar]
- 27.Lim HY, et al. Hyaluronan receptor LYVE-1-expressing macrophages maintain arterial tone through hyaluronan-mediated regulation of smooth muscle cell collagen. Immunity. 2018;49:326–341.e7. doi: 10.1016/j.immuni.2018.06.008. [DOI] [PubMed] [Google Scholar]
- 28.Schuch K, et al. Osteopontin affects macrophage polarization promoting endocytic but not inflammatory properties. Obesity. 2016;24:1489–1498. doi: 10.1002/oby.21510. [DOI] [PubMed] [Google Scholar]
- 29.Remmerie A, et al. Osteopontin expression identifies a subset of recruited macrophages distinct from kupffer cells in the fatty liver. Immunity. 2020;53:641–657.e14. doi: 10.1016/j.immuni.2020.08.004. [DOI] [PMC free article] [PubMed] [Google Scholar]
- 30.Villani A-C, et al. Single-cell RNA-seq reveals new types of human blood dendritic cells, monocytes, and progenitors. Science. 2017;356:eaah4573. doi: 10.1126/science.aah4573. [DOI] [PMC free article] [PubMed] [Google Scholar]
- 31.Zhang Q, et al. Landscape and dynamics of single immune cells in hepatocellular carcinoma. Cell. 2019;179:829–845.e20. doi: 10.1016/j.cell.2019.10.003. [DOI] [PubMed] [Google Scholar]
- 32.Mizoguchi F, et al. Functionally distinct disease-associated fibroblast subsets in rheumatoid arthritis. Nat. Commun. 2018;9:789. doi: 10.1038/s41467-018-02892-y. [DOI] [PMC free article] [PubMed] [Google Scholar]
- 33.Korsunsky I, et al. Cross-tissue, single-cell stromal atlas identifies shared pathological fibroblast phenotypes in four chronic inflammatory diseases. Med. 2022;3:481–518. doi: 10.1016/j.medj.2022.05.002. [DOI] [PMC free article] [PubMed] [Google Scholar]
- 34.Buechler MB, et al. Cross-tissue organization of the fibroblast lineage. Nature. 2021;593:575–579. doi: 10.1038/s41586-021-03549-5. [DOI] [PubMed] [Google Scholar]
- 35.Wigle JT, et al. An essential role for Prox1 in the induction of the lymphatic endothelial cell phenotype. EMBO J. 2002;21:1505–1513. doi: 10.1093/emboj/21.7.1505. [DOI] [PMC free article] [PubMed] [Google Scholar]
- 36.Fujimoto N, et al. Single-cell mapping reveals new markers and functions of lymphatic endothelial cells in lymph nodes. PLoS Biol. 2020;18:e3000704. doi: 10.1371/journal.pbio.3000704. [DOI] [PMC free article] [PubMed] [Google Scholar]
- 37.Wang S, et al. IL-21 drives expansion and plasma cell differentiation of autoreactive CD11chi T-bet+ B cells in SLE. Nat. Commun. 2018;9:1758. doi: 10.1038/s41467-018-03750-7. [DOI] [PMC free article] [PubMed] [Google Scholar]
- 38.Schröder AE, Greiner A, Seyfert C, Berek C. Differentiation of B cells in the nonlymphoid tissue of the synovial membrane of patients with rheumatoid arthritis. Proc. Natl Acad. Sci. USA. 1996;93:221–225. doi: 10.1073/pnas.93.1.221. [DOI] [PMC free article] [PubMed] [Google Scholar]
- 39.Scheel T, Gursche A, Zacher J, Häupl T, Berek C. V-region gene analysis of locally defined synovial B and plasma cells reveals selected B cell expansion and accumulation of plasma cell clones in rheumatoid arthritis. Arthritis Rheum. 2011;63:63–72. doi: 10.1002/art.27767. [DOI] [PubMed] [Google Scholar]
- 40.Andersen M, et al. Ultrasound colour Doppler is associated with synovial pathology in biopsies from hand joints in rheumatoid arthritis patients: a cross-sectional study. Ann. Rheum. Dis. 2014;73:678–683. doi: 10.1136/annrheumdis-2012-202669. [DOI] [PubMed] [Google Scholar]
- 41.Romão VC, et al. Treatment-resistant synovitis and radiographic progression are increased in elderly-onset rheumatoid arthritis patients: findings from a prospective observational longitudinal early arthritis cohort study. Semin. Arthritis Rheum. 2020;50:735–743. doi: 10.1016/j.semarthrit.2020.03.018. [DOI] [PubMed] [Google Scholar]
- 42.Just SA, et al. Six-month prospective trial in early and long-standing rheumatoid arthritis: evaluating disease activity in the wrist through sequential synovial histopathological analysis, RAMRIS magnetic resonance score and EULAR-OMERACT ultrasound score. RMD Open. 2019;5:e000951. doi: 10.1136/rmdopen-2019-000951. [DOI] [PMC free article] [PubMed] [Google Scholar]
- 43.Kroot EJ, et al. The prognostic value of anti-cyclic citrullinated peptide antibody in patients with recent-onset rheumatoid arthritis. Arthritis Rheum. 2000;43:1831–1835. doi: 10.1002/1529-0131(200008)43:8<1831::AID-ANR19>3.0.CO;2-6. [DOI] [PubMed] [Google Scholar]
- 44.Rivellese F, et al. Rituximab versus tocilizumab in rheumatoid arthritis: synovial biopsy-based biomarker analysis of the phase 4 R4RA randomized trial. Nat. Med. 2022;28:1256–1268. doi: 10.1038/s41591-022-01789-0. [DOI] [PMC free article] [PubMed] [Google Scholar]
- 45.Ishigaki K, et al. Multi-ancestry genome-wide association analyses identify novel genetic mechanisms in rheumatoid arthritis. Nat. Genet. 2022;54:1640–1651. doi: 10.1038/s41588-022-01213-w. [DOI] [PMC free article] [PubMed] [Google Scholar]
- 46.Saevarsdottir S, et al. Multiomics analysis of rheumatoid arthritis yields sequence variants that have large effects on risk of the seropositive subset. Ann. Rheum. Dis. 2022;81:1085–1095. doi: 10.1136/annrheumdis-2021-221754. [DOI] [PMC free article] [PubMed] [Google Scholar]
- 47.Zhao H, Li M, Ouyang Q, Lin G, Hu L. VEGF promotes endothelial cell differentiation from human embryonic stem cells mainly through PKC-ɛ/η pathway. Stem Cells Dev. 2020;29:90–99. doi: 10.1089/scd.2019.0172. [DOI] [PubMed] [Google Scholar]
- 48.van Oosterhout M, et al. Differences in synovial tissue infiltrates between anti-cyclic citrullinated peptide-positive rheumatoid arthritis and anti-cyclic citrullinated peptide-negative rheumatoid arthritis. Arthritis Rheum. 2008;58:53–60. doi: 10.1002/art.23148. [DOI] [PubMed] [Google Scholar]
- 49.van Vollenhoven RF, Klareskog L. Clinical responses to tumor necrosis factor alpha antagonists do not show a bimodal distribution: data from the Stockholm tumor necrosis factor alpha followup registry. Arthritis Rheum. 2003;48:1500–1503. doi: 10.1002/art.11027. [DOI] [PubMed] [Google Scholar]
Associated Data
This section collects any data citations, data availability statements, or supplementary materials included in this article.
Supplementary Materials
This file contains Supplementary Methods, Supplementary Figs. 1–3 and 5–13, Supplementary Tables 1–4, 6, 9 and 10 and Supplementary References.
Genes associated with RA risk alleles.
Data Availability Statement
CITE-seq single-cell expression matrices and sequencing and bulk expression matrices are available on Synapse (10.7303/syn52297840). Associated genotype and clinical data are available through the Arthritis and Autoimmune and Related Diseases Knowledge Portal (ARK Portal, https://arkportal.synapse.org/Explore/Datasets/DetailsPage?id=syn52297840). A cell browser website https://immunogenomics.io/ampra2/ is available to visualize our data and results. AMP Phase 1 single-cell data from ref. 8 are available on Immport (SDY998). PEAC clinical trial RNA-seq data from ref. 6 are available on ArrayExpress (E-MTAB-6141). R4RA clinical trial RNA-seq data from ref. 44 are available on ArrayExpress (E-MTAB-11611). Single-cell and bulk RNA-seq data were aligned to GRCh38 (Ensembl 93), available as part of Cell Ranger v. 3.1.0.
The source code for the analyses is available at https://github.com/Immunogenomics/RA_Atlas_CITEseq/ and https://zenodo.org/record/8118599.


