Abstract
The mouse immunoglobulin kappa (Igκ) gene contains an intronic enhancer and two enhancers downstream of its transcription unit. Using chromosome conformation capture technology, we demonstrate that rearranged and actively transcribed Igκ alleles in MPC-11 plasmacytoma cells exhibit mutual interactions over 22 kb between these three enhancers and Vκ gene promoters. In addition, the 5′ region of the active transcription unit exhibits a continuum of interactions with downstream chromatin segments. We also observe interactions between Ei and E3′ with 3′ boundary sequences 24 kb downstream of Ed, adjacent to a neighboring housekeeping gene. Very similar interactions between the enhancers are also exhibited by normal B cells isolated from mouse splenic tissue but not by germ line transcriptionally inactive alleles of T cells or P815 mastocytoma cells, which exhibit a seemingly linear chromatin organization. These results fit a looping mechanism for enhancer function like in the β-globin locus and suggest a dynamic modulation of the spatial organization of the active Igκ locus. Chromatin immunoprecipitation experiments reveal that the interacting Igκ gene cis-acting sequences are associated with AP-4, E47, and p65NF-κB, potential protein candidates that may be responsible for initiating and/or maintaining the formation of these higher-order complexes. However, S107 plasmacytoma cells that lack NF-κB still exhibit mutual interactions between the Igκ gene enhancers.
Alterations in higher-order chromatin structure and nuclear subcompartmentation are emerging as central themes regulating eukaryotic gene expression (for recent reviews, see references 5, 15, 29, 33, 38, 39, 48, and 65). Individual chromosomes occupy specific territories (40), and different chromatin segments exhibit movement limited to their own nuclear subcompartments (1, 41). Within a given subcompartment, DNA segments can diffuse by Brownian motion (41). This type of nuclear DNA sequence mobility has been termed “constrained diffusion” (36). DNA mobility may also be confined to separate chromatin domains by the specific attachment of chromatin segments to nuclear substructures, such as the nucleoli, the nuclear periphery, and the nuclear matrix (14, 16, 33, 68). In reference to recombination, it is noteworthy that the DNA segments most frequently involved in chromosome translocations are localized very close to each other in the interphase nucleus (39). Furthermore, recent results from fluorescence in situ hybridization experiments reveal that the immunoglobulin (Ig) heavy chain gene locus exhibits a large-scale compaction in apparent preparation for V-to-DJ rearrangement (30).
The β-globin gene locus has served as a paradigm for higher-order chromatin structure and nuclear organization during the course of sequential gene activation events. It is now appreciated that the locus changes its nuclear subcompartmentation in preparation for transcription, looping away from its chromosome territory in proerythroblast cells (55). It has also been recently demonstrated by using the “chromosome conformation capture” (3C) technique (20) that the globin gene locus control region (LCR) forms looped complexes with the distal boundary elements and promoters of expressed globin genes during erythroid development (45, 64; for reviews, see references 19 and 21). Maintenance of these looped complexes requires multiple interactions between cis elements in the LCR and promoters (47). Another newly devised technique called “RNA trap” has also shown close interactions between the globin gene LCR and a transcribed globin gene (11). These results have a significant impact on the mechanism of enhancer action, which formerly could be viewed by several models, which included tracking, linking, and looping (reviewed in reference 21). Thus, it appears that constrained diffusion of the globin gene locus allows distal DNA segments to get together through protein-protein interactions between transcription factors. These looped complexes have been termed an “active chromatin hub,” and it has been suggested that this active chromatin hub would possess a high local concentration of DNA binding sites and cause a local accumulation of cognate transcription factors and chromatin remodeling complexes (21). The 3C technique has also been recently employed to demonstrate that the differentially methylated regions of the imprinted Igf2 and H19 genes partition paternally and maternally derived alleles into distinct chromatin loops (44) and that the Th2 LCR localizes in close proximity with the Th2 cytokine genes' promoters in CD4+ T cells and natural killer cells (63).
Here we have employed the 3C technique to assay for promoter-enhancer, enhancer-enhancer, and enhancer-boundary sequence interactions in another model system, the mouse Igκ light chain gene locus. Like the β-globin locus or the Igf2/H19 imprinted loci, this Ig gene also exhibits cell-type and differentiation-dependent nuclear reorganization events in preparation for transcriptional activation or gene silencing (9, 10, 30, 62). However, the mouse Igκ gene locus is close to the size of the Escherichia coli chromosome and constitutes a DNA length of about 20% of the yeast genome or 0.1% of the mouse genome (8). During B-cell development the Ig heavy chain gene(s) rearranges first, by sequential D-J and then by V-(D)J joining, leading to the pro- and pre-B-cell stages of development, respectively (67). The Igκ locus is poised for rearrangement in pre-B cells, and upon appropriate signaling, one of the 95 V genes is semirandomly selected for recombination to a J region (8; for a review of recombination, see reference 25). This recombination event results in transcriptional activation because it positions a V gene carrying a promoter into a chromatin domain containing three powerful downstream enhancers: an intronic enhancer (Ei) within the transcription unit and two enhancers downstream of the transcription termination region, termed E3′ and Ed (36, 43, 46, 52, 66). How these enhancers cooperate during B-cell development is not fully understood, particularly with respect to the newly discovered Ed (36). Here we investigate their interactions between themselves and promoter or boundary sequences in terminally differentiated plasmacytoma cells in which rearranged Igκ gene transcription is maximally activated (59). We demonstrate that in the active Igκ locus, the enhancers interact with themselves and with promoters and boundary sequences, like the corresponding elements in the β-globin gene locus. We further demonstrate that such looping interactions occur between enhancers in normal, stimulated B lymphocytes. Interestingly, these observed interactions are consistent with earlier results demonstrating that these enhancers synergize together to maximally activate transcription in reporter gene constructs (6, 35, 36).
MATERIALS AND METHODS
Cell lines.
MPC-11 cells were maintained in Dulbecco's modified Eagle's medium supplemented with 20% donor horse serum at 37°C with 10% CO2. P815 and S107 cell lines were cultured in RPMI 1640 containing 10% fetal bovine serum and 50 μM β-mercaptoethanol at 37°C with 5% CO2.
Isolation of mature B and T cells.
B and T cells were isolated from the spleens of 8- to 12-week-old C57BL/6 mice. Single-cell suspensions, prepared as described previously (17), were divided into two groups. For B-cell isolation by negative selection, cells were incubated with an optimal concentration of biotinylated anti-mouse CD43 and biotinylated anti-mouse CD11b (PharMingen) for 10 min on ice. For T-cell isolation by negative selection, cells were incubated with an optimal antibody cocktail provided in the Pan T-cell isolation kit (Miltenyi Biotec) for 10 min on ice. After washing with phosphate-buffered saline (PBS)-0.5% bovine serum albumin, cells were incubated with streptavidin microbeads for 30 min on ice. After the removal of unbound microbeads, the cells were loaded into a MiniMACS separation unit. The unbound B cells were collected and cultured in RPMI 1640 containing 10% fetal bovine serum, 50 μM mercaptoethanol, 1 U of penicillin/ml, 100 μg of streptomycin/ml, and 40 μg of lipopolysaccharide/ml at 37°C with 5% CO2. Cells were collected after 48 h for 3C experiments. The unbound T cells were collected immediately for 3C assays.
3C assay and controls.
This procedure was performed according to the method of Tolhuis et al. (64). Briefly, 107 cells were harvested and washed with PBS. Formaldehyde was added to 2% to fix the cells for 10 min at room temperature. One-twentieth volume of 2.5 M glycine was added to terminate cross-linking. Cross-linked cells were washed with cold PBS and lysed with ice-cold lysis buffer (10 mM Tris [pH 8.0], 10 mM NaCl, 0.2% NP-40, 1 mM dithiothreitol) for 5 min. The nuclei were harvested and suspended in the appropriate restriction enzyme buffer containing 0.3% sodium dodecyl sulfate (SDS) and incubated at 37°C for 1 h while shaking. Triton X-100 was added to 1.8% to sequester the SDS, and samples were incubated at 37°C for another 1 h. Samples were then digested with restriction enzyme (AseI, MfeI, or NspI) overnight at 37°C. SDS was added to 1.6%, and the samples were heated at 65°C for 20 min to inactivate the restriction enzyme. The positions of cut sites, choices for restriction enzymes, and PCR primer design all took advantage of the assembled Igκ gene locus sequence by use of VectorNTI software (8). Samples were then diluted with T4 DNA ligase buffer about 12 times to approximately 3 ng of DNA/μl. Triton X-100 was added to 1%, and samples were incubated at 37°C for 1 h. T4 DNA ligase was added, and samples were incubated at 16°C for 4.5 h and 30 min at room temperature. Proteinase K was added to 200 μg/ml, and the samples were incubated at 65°C overnight to reverse cross-linking. Samples were treated with 10 μg of RNase/ml, and DNA was purified by phenol extraction and precipitated with isopropanol. DNA concentration was measured with Picogreen by fluorometry. Three-hundred-nanogram DNA samples were analyzed by 30 cycles of PCR (95°C at 30 s, 51°C at 30 s, and 72°C at 30 s) in 25-μl reaction mixtures, except for the porphobilinogen deaminase control, which used 56°C for the annealing temperature.
To create a standard for normalization of relative PCR efficiencies, yeast cells containing a yeast artificial chromosome (YAC) that spans from Vκ19 to the downstream region, including Vκ19-17, Vκ21-5, Ei, E3′, and Ed, were grown in synthetic defined medium (26). Total DNA was purified from these yeast cells by phenol extraction and isopropanol precipitation. The purified DNA was digested with the corresponding restriction enzyme (AseI, MfeI, or NspI), followed by ligation at high concentrations to allow intermolecular ligation, thus generating equimolar mixtures of all possible ligation products. DNA was purified again as described above. DNA concentrations were determined with Picogreen by fluorometry. Thirty-nanogram DNA samples were used as template in PCRs as described above. To obtain a standard for the assay of potential interactions between enhancers and the downstream border, the downstream fragment that was not included in the YAC was amplified by PCR and cloned into the plasmid pRS413. The plasmid DNA and yeast DNA were combined in an equimolar fashion and processed as described above to generate all possible ligation products as a standard. To assay for potential interactions between enhancers and the upstream border, total DNA purified from MPC-11 cells was used as a control after digestion with restriction enzyme followed by ligation as described above. After purification, 300-ng DNA samples were analyzed by 35 cycles of PCR as described above. The primers used in this study are listed in Table 1.
TABLE 1.
3C PCR primers and probes used in this study
| Primer or probe | Sequence(s) |
|---|---|
| Primers for 3C assays | |
| MfeI digestion | |
| 1 | 5′ CAA CCA GTA TTG AGA GAC TC 3′ |
| 2 | 5′ TCA GAG GAC TGC CCA CTA TC 3′ |
| 3 | 5′ CCA CAA GGA ATC CTG CAG 3′ |
| 4 | 5′ TAG GTA TGT GTC CCA CTG TC 3′ |
| 5 | 5′ ACA GGT GAA GAA GCA GAA CTG 3′ |
| 6 | 5′ CTC TCC ACA GTC TCC ATC G 3′ |
| 7 | 5′ ATC CTT AGG TAC ATA GAC AC 3′ |
| NspI digestion | |
| Porphobilinogen | |
| deaminase | 5′ GTG GGT GGT GGA GGT AAG GT 3′, 5′ GGT GCA CTT GGT GAA AGA AGA G 3′ |
| Vκ21-5 | 5′ ACA GAC ACA CTC CTG CTA TA 3′ |
| 8 | 5′ TGA AAT GCA TCA CAC CAG C 3′ |
| 9 | 5′ CGT CTT AGG CTT CTG AGA CC 3′ |
| 10 | 5′ CAG TCC TTT CTA AGG TTC ACG 3′ |
| 11 | 5′ CTA ATA GTC CCA TGC TCT CC 3′ |
| 12 | 5′ TAT CCA TTC CTC TGT TGA GG 3′ |
| 13 | 5′ CCC AAT GCT TTT GCA CAG TC 3′ |
| 14 | 5′ GGA ATG AGG TTG TGT GTT GC 3′ |
| 15 | 5′ CTA ACT TAG ACC AGG AGA CC 3′ |
| 16 | 5′ TGC CAG TGA GTG TAG TGA CC 3′ |
| 17 | 5′ TGT CAG CTT GCC AAG TAG AC 3′ |
| 18 | 5′ CAA ACA AGA GAC CCT CTC TC 3′ |
| 19 | 5′ CTA ACA AAC CAC ACT TCT GG 3′ |
| 20 | 5′ TCT GCA TCG CAC ACT GTC C 3′ |
| 21 | 5′ TCC TGG GTT GTG TCT GTG G 3′ |
| 22 | 5′ ATA CCA ACA GCC GAG GGA G 3′ |
| 23 | 5′ ATG TGG AGG CAC AGA CAG G 3′ |
| AseI digestion | |
| 24 | 5′ TCT GTT GAG ATG CCA ACT C 3′ |
| 25 | 5′ GTT TCC ATC TTG CTA CCT C 3′ |
| 26 | 5′ AAA GAA TAC AGC ATG TGA C 3′ |
| 27 | 5′ CAA AAT TTG AGG TCA TTG GG 3′ |
| 28 | 5′ GGA GTC TGC TGT CCT TAC AGG 3′ |
| Probes for Southern blots | |
| MfeI digestion | |
| Ei | 5′ ACT GGA TAC AAC CAA AAT GTC CAC CAA 3′ |
| E3′ | 5′ ACA CAT TTA GCA ATG TAA CAG G 3′ |
| Ed | 5′ CAT AGC ACG GTA GAA TCA AGA GAG CCT G 3′ |
| NspI digestion | |
| Ei | 5′ CCA TGG TAG GTT TGA GGA GGC ATA CTT CC 3′ |
| E3′ | 5′ TCA GTA TCC TTG AAG AGT TCT GAT ATG GTC 3′ |
| Ed | 5′ CAC ACA CAC ACA CAC AAC TTC GAA AAG ACA 3′ |
| Ed for downstream | |
| border | 5′ AAC AGC TCC TAG GGA AGG ATC AAA GGA AGG 3′ |
| AseI digestion | 5′ GGC TGC TCA TAA TTC TAT TGT TTT TCT TGG 3′ |
For estimates of restriction enzyme cleavage efficiencies by genomic Southern analyses, MPC-11 and P815 cells were treated as described above without ligation. DNA was purified from the digested nuclei and analyzed as described elsewhere (28). PhosphorImager signals were quantified by using ImageQuant software. Probes for Ei (542 bp), E3′ (665 bp), and Ed (610 bp) were generated by PCR, cloned into the pGEM vector, excised by SacII and NotI cleavage, and gel purified prior to labeling. The primers used to generate the PCR products for cloning were Eif (5′ GGT AAA GAA CTC TCA GTT TTC G 3′), Eir (5′ AAG TAA ATT GAG TCT GAC CC 3′), E3′f (5′ CTA CTT AAT AGG AGA TTG GAT G 3′), E3′r (5′ CTG ATT ATT CCA AGT TGA GT 3′), Edf (5′ CAG TTG TCA TGG AAA GGC CT 3′), and Edr (ATC TAG CCT GTG CCC TGC AC 3′).
Southern analysis of 3C products.
PCR products were resolved by electrophoresis in 3% NuSieve 3:1 agarose gels with 1× Tris-acetate-EDTA as the running buffer. Gels were Southern transferred overnight in 0.4 N NaOH and 0.25 M NaCl to Zeta-Probe GT filters (Bio-Rad). Filters were prehybridized with 10× Denhardt's solution, 6× SSC (1× SSC is 0.15 M NaCl plus 0.015 M sodium citrate), and 1% SDS for 2 h at 42°C and hybridized with probes overnight with 6× SSC-1% SDS at the same temperature. The probes listed in Table 1 were end labeled with [γ-32P]ATP by use of T4 polynucleotide kinase at 37°C for 30 min. Unincorporated isotope was removed with G-Sephadex 25 columns. Filters were washed at room temperature two times with 6× SSC and two times with 2× SSC. After being washed, filters were exposed to PhosphorImager screens overnight and analyzed by phosphorimaging (Molecular Dynamics). Signals were quantified by using ImageQuant software (Molecular Dynamics).
Statistical analysis.
Each 3C experiment was repeated three to five times. Values are reported as means ± standard deviations. A Student's t test assuming equal variance in two samples was conducted to determine the statistical significance of the differences between two samples.
Chromatin immunoprecipitation.
Cells (108) were fixed with 1% formaldehyde at 37°C for 10 min, as reported elsewhere (23). Fixed cells were washed three times with cold PBS buffer and resuspended in RSB buffer (10 mM Tris [pH 8.0], 3 mM MgCl2) containing 10 mM sodium metasulfite as a proteinase inhibitor for 10 min. The swollen cells were disrupted by Dounce homogenization, and the nuclei were collected in Tris-EDTA buffer and sonicated 15 times for 25 s with 90-s breaks between each sonication interval. The average DNA lengths obtained by this treatment were about 500 bp. Chromatin immunoprecipitation (ChIP) assays were performed as described previously (58). Briefly, immunoprecipitations were performed in NET buffer (50 mM Tris [pH 7.4], 150 mM NaCl, 5 mM EDTA, 0.5% NP-40). Sonicated nucleoprotein was incubated with 6 μg of E47, 6 μg of p65NF-κB, or 10 μg of AP-4 antibody (Santa Cruz Biotechnology, Inc.) for 2 h at room temperature. Forty microliters of protein A-Sepharose (for E47 or p65NF-κB) or protein G-Sepharose (for AP-4) (Amersham Pharmacia Biotech) was added for an additional 2 h. Immunocomplexes were washed five times with radioimmunoprecipitation assay buffer (50 mM Tris-HCl, 150 mM NaCl, 1% NP-40, 0.5% sodium deoxycholate, 0.1% SDS, pH 8), two times in lithium buffer (10 mM Tris-HCl, 250 mM LiCl2, 0.5% NP-40, 0.5% sodium deoxycholate, 1 mM EDTA, pH 8), and three times in Tris-EDTA buffer. The Sepharose immunocomplex slurries were incubated at 65°C overnight to reverse cross-links and were then RNase treated, proteinase K treated, deproteinized, and precipitated as described elsewhere (23). Processed DNA fragments were resuspended in 50 μl of distilled water. The concentration of DNA was measured with Picogreen by using fluorometry. Serial threefold dilutions (9, 3, and 1 ng) of immunoprecipitated and input DNA fractions were analyzed by 25 cycles of PCR (94°C for 30 s, 51 or 56°C for 30 s, and 72°C for 30 s) in 25-μl reaction mixtures. Primers are listed in Table 2. Negative control primer-1 was used in all experiments except for the one whose results are described in Fig. 11B, which used negative control primer-2. PCR products (which ranged in size from 100 to 200 bp) were subjected to electrophoresis by using 1.5% agarose gels.
TABLE 2.
ChIP PCR primers used in this study
| Primer | Sequence |
|---|---|
| IgκEi | |
| Forward | 5′ CAG AGG GGA CTT TCC GAG AGG CC 3′ |
| Reverse | 5′ ACC CTG GTC TAA TGG TTT GTA AC 3′ |
| IgκE3′ | |
| Forward | 5′ ATA GCA ACT GTC ATA GCT ACC GT 3′ |
| Reverse | 5′ GCA GGT GTA TGA GGC TTT GGA AA 3′ |
| IgκEd | |
| Forward | 5′ GGG ACA GAT CAC CAT TTC GTT AA 3′ |
| Reverse | 5′ CTT CAG GCC AGC TGG GCA GTG AG 3′ |
| Negative control-1 | |
| Forward | 5′ CTA ATA GTC CCA TGC TCT CC 3′ |
| Reverse | 5′ TCC TTC CTT TGG TGG CTT C 3′ |
| Negative control-2 | |
| Forward | 5′ GGG TAG TTT TCC CAA CGA ACA GT 3′ |
| Reverse | 5′ GGA TGG TTT TCT TAA AGA GTG TGA G 3′ |
| Vκ19-17 promoter | |
| Forward | 5′ GAT GAC TCC TTT GCA TAG ATC CC 3′ |
| Reverse | 5′ TCA CCA GAC AAC CAG AGA AAC AC 3′ |
| Vκ4-58 promoter | |
| Forward | 5′ TGA CAT CTG TGT TTG ACA ATT GG 3′ |
| Reverse | 5′ CTC CCA CAA TAA AGA ATC AAG AAT G 3′ |
FIG. 11.
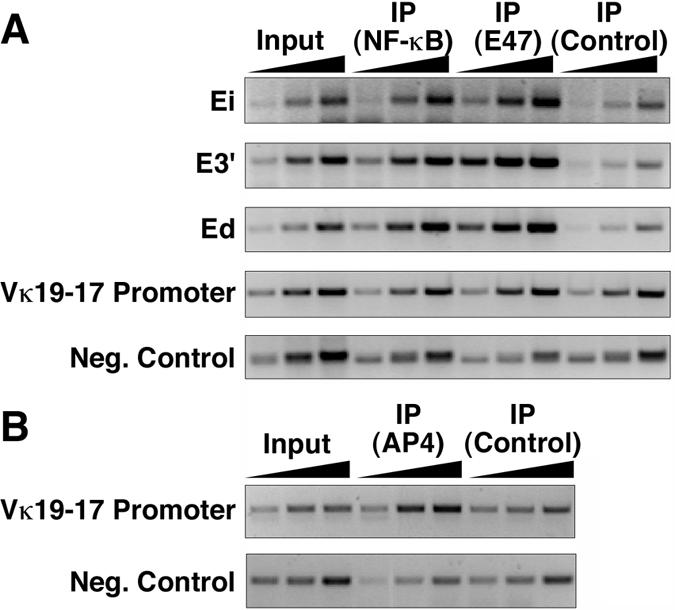
Occupancy of p65NF-κB, E47, and AP-4 transcription factors on Igκ gene enhancer and promoter sequences of MPC-11 cells. Semiquantitative PCRs were performed by using 1, 3, and 9 ng of DNA templates with the indicated input, bound, and preimmune control fractions. (A) ChIP with antibodies against p65NF-κB, E47, and a preimmune control. (B) ChIP with antibodies against AP-4 transcription factor and a preimmune control.
Nuclear extract preparation and Western blotting.
MPC-11 and S107 cells were harvested, washed twice with cold PBS, resuspended in hypotonic buffer A (20 mM HEPES-KOH [pH 7.8], 0.5 mM MgCl2, 1 mM dithiothreitol, 5 mM KCl), and allowed to swell for 15 min on ice. The swollen cells were disrupted by passing 10 times through 25-gauge needles. The intact nuclei were pelleted by centrifugation, resuspended in buffer A containing 0.4 M NaCl, and extracted for 2 h at 4°C. Nuclear debris was pelleted, and the supernatant was used for Western analysis. The protein concentration in nuclear extracts was determined using a Bio-Rad protein assay kit. Fifteen micrograms of total protein was resolved by electrophoresis on SDS-10% polyacrylamide gels and blotted onto a nitrocellulose membrane by using standard techniques. After blocking, the membrane was developed with p65NF-κB antibody (Santa Cruz Biotechnology, Inc.) or with mouse anti-human actin monoclonal antibodies (Oncogene Research Products). The antigen-antibody complexes were visualized by using enhanced chemiluminescence Western blotting detection reagents (Amersham Pharmacia Biotech).
RESULTS
Overall experimental approach.
To examine long-range interactions between cis-acting elements in the Igκ locus, we have used the 3C technique, which was originally invented by Dekker et al. (20) for the analysis of yeast chromosome III structure. We employed the modifications to this procedure introduced by Tolhuis et al. (64) for its use with animal cells and established a standard, fixed set of conditions that are highly reproducible in our hands. In addition, we have also recently assembled the entire germ line mouse Igκ gene sequence (8), and we possess the entire locus cloned on a series of YACs (26), making the design of PCR primers, the selection of appropriate restriction enzymes, and the production of DNA standards, which are requirements for executing 3C technology, readily amenable to us for the performance of this research.
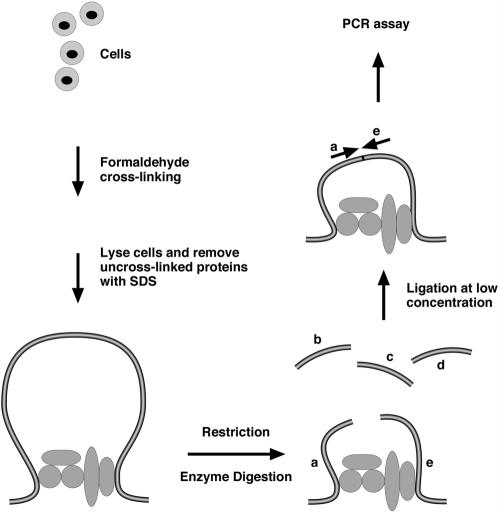
For the 3C technique (Fig. 1), briefly, cells are first treated with formaldehyde to cross-link proteins to DNA and themselves, nuclei released by NP-40 treatment are harvested and suspended in the appropriate restriction enzyme buffer containing SDS to release proteins, and excess Triton X-100 is added to sequester the SDS. Next, the cross-linked chromatin DNA is digested exhaustively with a selected restriction enzyme, which is subsequently inactivated, and the material is diluted with ligase buffer to subsequently achieve “intramolecular” ligation reactions; only DNA fragments that are in close proximity because they are held together by cross-linked proteins are ligatable in this dilute solution. The resulting protein-DNA cross-links are reversed, and DNA is purified, quantitated, and subjected to semiquantitative PCR by use of a series of primer pairs (Fig. 1). One primer in these pairs is always the same (the anchor primer), and the others are complementary to successive restriction fragments, walking 5′ or 3′ or both directions in a locus. In the hypothetical example shown in Fig. 1, pairing primer a successively with primers b, c, d, and e would only give a significant PCR amplified product in the a-e case.
FIG. 1.
Schematic representation of the chromosome conformation capture technology. Chromatin from formaldehyde-fixed cells is digested with a restriction enzyme and diluted for “intramolecular” ligation, and the resulting purified DNA fragments are assayed for specific ligation products by PCR amplification.
Biological systems for comparative 3C.
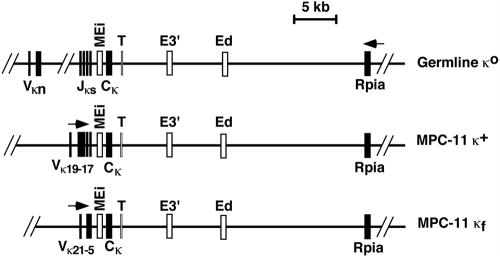
To investigate the higher-order chromatin structure within active and inactive Igκ loci, we selected for study the mouse plasmacytoma cell line MPC-11 as a model system for active Igκ loci. These cells possess two uniquely rearranged and actively transcribed Igκ alleles, designated κ+ and κf (Fig. 2) (13, 49, 60). For comparison, we selected the mouse mastocytoma cell line, P815, in which the locus is germ line and inactive, designated κ° (57). In these cells, the Vκ19 and Vκ21 genes that are rearranged in MPC-11 cells reside 350 and 60 kb, respectively, upstream of Jκ1 (Fig. 2) (8).
FIG. 2.
Genomic organization of Igκ alleles in MPC-11 and P815 cells. Exons are indicated by closed rectangles, and cis-acting sequences are indicated by open rectangles. The arrows indicate the direction of transcription. T represents the position of transcription termination (66). This map is based on data from reference 8.
Controls for 3C.
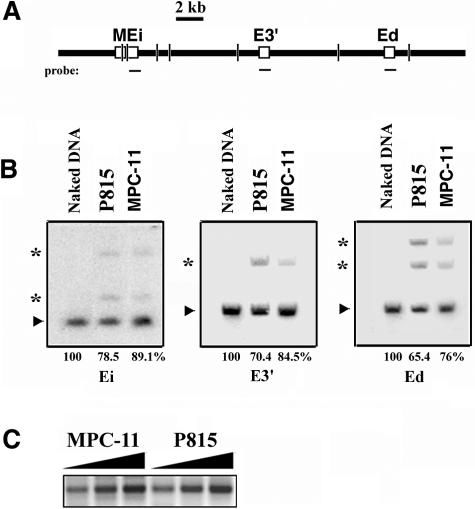
Several controls rule out potential artifacts and establish the validity of the 3C technique in our hands. First, the design of the PCR primer pairs is generally such that they are all in the same orientation with respect to successive restriction fragments. This strategy eliminates the possibly of generating PCR products because of partial digestion and subsequent ligation through circularization. Second, to generate a standard that is both a positive control for establishing the success of primer design and function, as well as for data normalization to correct for the efficiency of the PCR amplification process between various experimental samples, we have utilized DNA purified from yeast cells that harbor a YAC carrying the Igκ sequences being studied that are in mouse cells. This DNA is cut to completion with the restriction enzyme selected for 3C, and fragments are ligated together randomly at a high DNA concentration to generate equimolar amounts of all possible ligation products subject to assay. Third, by genomic Southern analyses, we have determined that restriction enzyme digestion goes to completion at efficiencies ranging between 65 and 89% for AseI at sites within cross-linked chromatin DNA that reside, for example, within or near the transcriptional enhancers, in both the transcriptionally active and inactive Igκ loci of MPC-11 and P815 cells, respectively (Fig. 3A and B); this observation holds true for all other restriction enzymes that we have employed in 3C at all sites tested (data not shown), in agreement with previous reports (45, 63, 64). It should be appreciated that chromatin proteins are only partially cross-linked to DNA in 3C, and many have been released by the SDS treatment prior to restriction enzyme cleavage. Fourth, when we tested for the cross-linking efficiency of the housekeeping gene which encodes porphobilinogen deaminase, which has been reported to exhibit minimal transcriptional variability among different tissues (27), we obtained similar 3C signals for adjacent fragments spaced about 0.5 kb apart from MPC-11 and P815 cells (Fig. 3C). Fifth, a positive 3C PCR signal is totally dependent both on formaldehyde cross-linking and ligation (data not shown). Finally, mouse naked DNA cut to completion and then religated to generate all possible combinations of ligation products does not give a detectable PCR signal with 3C primers with the same number of PCR cycles that gives a robust signal with 3C-processed chromatin (data not shown).
FIG. 3.
Control 3C experiments. (A) Schematic representation of a segment of the Igκ locus. Short vertical lines indicate AseI cutting sites selected for the determination of the efficiencies of restriction enzyme digestion. Probes are shown below as horizontal lines. (B) Genomic Southern analysis of 15-μg purified DNA samples per lane, from digested naked DNA or digested cross-linked chromatin from P815 and MPC-11 cells as indicated. Arrowheads indicate the positions of completely digested fragments, which are 2.1, 7.1, and 5.5 kb for Ei, E3′, and Ed, respectively. Asterisks indicate the positions of partly digested fragments. For Ei, the partly digested fragment lengths are 2.4 and 3.1 kb. For E3′, the partly digested fragment length is 12.6 kb. For Ed, the partly digested fragment lengths are 8.8 and 12.6 kb. The digestion efficiencies of the enhancer bearing fragments were estimated by determining the fractional signal intensities obtained from the cross-linked chromatin samples relative to the naked DNA sample for the completely digested fragments and are shown at the bottom. (C) PCR-amplified 3C ligation products of the housekeeping gene which encodes porphobilinogen deaminase, after digestion with NspI, from MPC-11 and P815 cells, using 100, 200, and 300 ng of template DNA.
Far-downstream enhancer, Ed, exhibits interactions with other upstream cis-acting elements specifically in active Igκ loci.
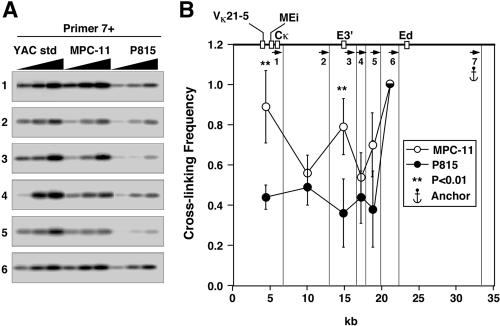
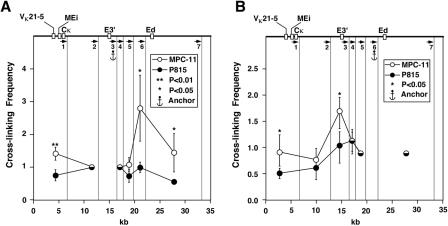
We first investigated interactions in the locus between the far-downstream enhancer, Ed, and restriction fragments that possessed the upstream enhancer, E3′, or the further-upstream intronic enhancer, Ei, together with the matrix association region and rearranged Vκ genes in the case of MPC-11 cells. Figure 4 shows 3C results after MfeI digestion, for which primer 7 serves as the anchor primer and is successively paired with the other upstream primers. To quantitate results, we first performed PCR assays with one, two, or three times template DNA concentrations, and after Southern blotting, the filter was probed with a 32P-labeled DNA segment complementary to common sequences adjacent to primer 7's amplification products (Fig. 4A). After phosphorimaging, we used ImageQuant software to quantitate the signals. For this and all subsequent 3C experiments reported here, we selected data in the linear range of PCR amplification and divided each signal derived from the same template concentration in mouse cells by the signal derived from the YAC standard to correct for differences in the efficiencies of the various PCRs. In addition, to normalize for differences in ligation efficiencies and the quality of templates between experiments and cell types, we assumed that fragments immediately adjacent to the anchor fragment would exhibit similar ligation efficiencies, independent of cell type and gene activity, and we assigned these values the value 1.0. This assumption has been proven to be true for 14 of 17 cases in the β-globin locus in 3C experiments (64); furthermore, we have shown above that the cross-linking efficiency is very similar for a housekeeping gene between MPC-11 and P815 cells (Fig. 3C). Figure 4B summarizes the normalized results for at least three independent experiments and reveals statistically significant, B-cell-specific interactions between Ed and E3′ and VκMEi-bearing restriction fragments.
FIG. 4.
Plasmacytoma-cell-specific looping interactions between Ed, E3′, and VκMEi. (A) PCR-amplified ligation products. Primer 7 was used as an anchor and paired with all the other upstream primers. YAC std, YAC standard. (B) PCR signal quantification. The vertical lines show the cutting sites of MfeI, and the arrows indicate the primers used in PCRs. Standard deviations of the means are indicated. Significant differences are in comparison to P815. The most 5′ MfeI cut sites are not shown and differ for κ+, κf, and κ° alleles, generating restriction fragments that are 7.8, 6.7, and 18.3 kb long, respectively, each with the same 3′ end complementary to primer 1. Those derived from MPC-11 cells possess the entire Vκ19-17 and Vκ21-5 V genes, along with their upstream regulatory sequences. For simplicity the map at the top of panel B shows only the κf allele of MPC-11 cells.
E3′ interacts with Ed, VκMEi, and a novel DNA segment specifically in active Igκ loci.
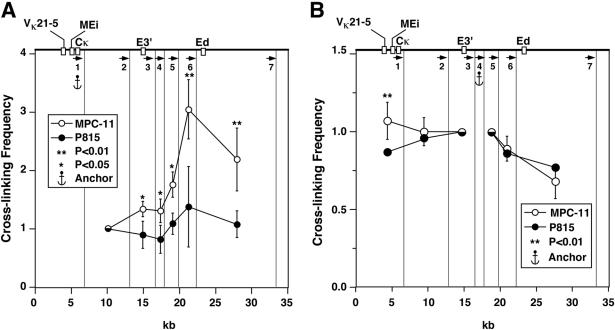
To validate the results described above, we performed a 3C experiment using an anchor primer complementary to E3′, and we paired it successively with upstream and downstream primers (Fig. 5A). As expected, we confirmed the detected interactions described above between E3′ and Ed, and we also detected interactions between E3′ and VκMEi in MPC-11 cells. In addition, this assay reveals another interaction between E3′ and a chromatin segment immediately upstream of Ed residing on restriction fragment 6 (Fig. 5A). Interestingly, this fragment contains E boxes and a κB site and is conserved in the human genome just like Ed (36; data not shown). This interaction would not have been detected using Ed as an anchor. This result was verified by using a primer as an anchor that is complementary to MfeI fragment 6. We now detect interactions between this new segment and E3′ and VκMEi, as shown in Fig. 5B. We conclude that the data thus far generated by 3C are internally consistent and highly reproducible. Hence, it appears that 3C can also serve as a discovery tool for potentially new cis-acting elements.
FIG. 5.
Plasmacytoma-cell-specific looping interactions between E3′ and Ed, VκMEi, and a novel DNA segment, presented as described in the legend to Fig. 4. Significant differences are in comparison to P815. Quantification of PCR signals with primers 3 (A) and 6 (B) as anchors.
Chromatin segments within the transcription unit exhibit interactions throughout regions downstream of the transcription termination region specifically in active Igκ loci.
We also assayed for interactions between sequences residing in the transcription unit and other downstream chromatin segments residing on MfeI digestion products as done before but now using as an anchor a primer complementary to the MEi bearing restriction fragments and pairing it successively with downstream primers. In this case, we observed statistically significant, B-cell-specific interactions between VκMEi and every other downstream chromatin segment beyond the transcription termination region (Fig. 6A) (66). These interactions would not have been detectable using either Ed or E3′ as the anchor. This result was verified by using a primer as an anchor that is complementary to MfeI fragment 4 that was shown previously not to interact with Ed (Fig. 4) but was shown to interact with the VκMEi segments (Fig. 6A). Figure 6B shows that no significant interactions occur between this chromatin segment and Ed as expected but significant B-cell-specific interactions do occur between this fragment and VκMEi segments. We again conclude that the data generated by 3C are internally consistent and highly reproducible.
FIG. 6.
Plasmacytoma-cell-specific looping interactions between the transcription unit(s) and every other chromatin fragment downstream of the transcription termination region, presented as described in the legend to Fig. 4. Significant differences are in comparison to P815. (A) Quantification of PCR signals with primers 1 (A) and 4 (B) as anchors.
Ed exhibits interactions with transcriptionally active, rearranged Vκ19-17 and Vκ21-5 genes, MEi, and E3′ in active Igκ loci.
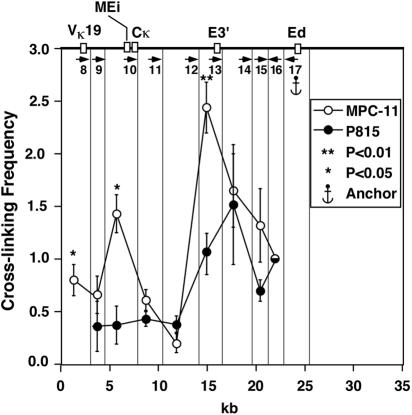
To evaluate Ed's potential interaction with the Vκ19-17 gene that is rearranged to Jκ2 on the κ+ allele in MPC-11 cells (Fig. 2) (13, 49, 60), we performed 3C again but used another restriction enzyme, NspI, to achieve higher resolution and cleavage at two positions between the promoter-bearing fragment and MEi. Figure 7 also shows that statistically significant, B-cell-specific interactions exist between Ed and E3′, and it now establishes separate interactions between Ed and both MEi and the Vκ19-17 gene. Although this Vκ gene is far removed from the locus in the germ line alleles of P815 cells, we can extrapolate the baseline cross-linking frequency expected for an adjacent fragment for purposes of a statistical estimate, which predicts a significant interaction between Vκ19-17 and Ed. In addition, we also assayed for Ed's interactions with the aberrantly rearranged Vκ21-5 gene on the κf allele in MPC-11 cells (Fig. 2) (13, 49, 60), and likewise found an estimated statistically significant interaction between this V gene and Ed (data not shown).
FIG. 7.
Plasmacytoma-cell-specific looping interactions between Ed and the other two enhancers and the promoter. A different restriction enzyme, NspI, was used in this experiment. Quantification of PCR signals with primer 17 as an anchor. The vertical lines indicate the NspI cutting sites that were selected for analysis of the looping interactions. Nineteen fragments were obtained in the region from the promoter to Ed after digestion with NspI. We chose to study the looping interactions within the fragments indicated by the vertical lines corresponding to the promoter of the Vκ19 gene, the three enhancers, the adjacent fragments (so that we could normalize the ligation efficiency between different experiments), and one or two fragments between the enhancers. Sequences complementary to primer 8 are far upstream of MEi (>300 kb) on the κf and κ° alleles of MPC-11 and P815 cells, and sequences complementary to primer 9 are similarly far upstream of MEi (>300 kb) on the κf allele of MPC-11 cells (Fig. 2) (8). Here, the anchor primer and the adjacent primer are pointing towards the other primers instead of having all the primers pointing in the same direction. This configuration, however, does not influence cross-linking frequency estimates because restriction digestion goes to near completion, and those trace products from uncut DNA are much longer than the 3C product and are not seen on gels whatsoever after PCR amplification. We designed our 3C primer pairs to yield products generally between 100 and 250 bp in length, whereas the sizes of the PCR products resulting from primer 17 paired with primers 15 and 14 in uncut DNA would be 0.7 and 3 kb, respectively. These and longer bands are not observed in our experiments. In addition, the primers are in vast molar excess and are not depleted upon the completion of the PCR cycles. Thus, cross-linking frequencies are not being underestimated because of primer competition for PCR products.
Ei per se exhibits interactions with the downstream enhancers specifically in active Igκ loci.
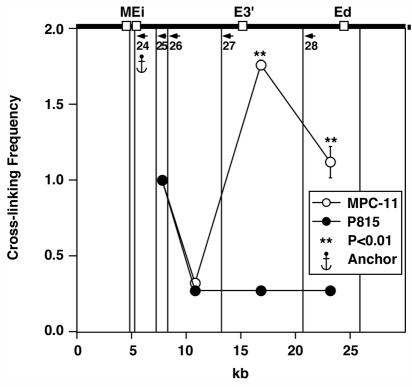
We performed 3C again but used another restriction enzyme, AseI, in an attempt to achieve higher resolution and cleavage of the MEi-bearing fragment between the MAR and enhancer. The results shown in Fig. 8 reveal statistically significant, B-cell-specific interactions between Ei per se and the downstream enhancers very similar to the results shown in Fig. 6, with the important exception that significant interactions are not revealed between Ei and a fragment residing between Ei and E3′. From this result, we can conclude that the continuum of interactions observed between VκMEi and downstream sequences revealed by the results shown in Fig. 6 must be due to sequences upstream of Ei.
FIG. 8.
Plasmacytoma-cell-specific looping interactions between Ei and the other two enhancers. The quantification of PCR signals with primer 24 as the anchor is shown. The vertical lines indicate the AseI cutting sites that were selected for analysis of the looping interactions.
Mutual interactions between Igκ gene cis elements also occur in normal stimulated B lymphocytes but not in T cells.
The results obtained this far utilized comparisons in 3C results between transformed cell lines. In order to extend the observed B-cell-specific interactions between cis elements to normal cells, we employed negative immunoselection to isolate splenic B and T cells for 3C analysis after MfeI digestion. To stimulate transcription of Ig genes in the resting lymphocytes, the B cells were cultured for 48 h with lipopolysaccharide prior to analysis. As shown in Fig. 9, using Ed as an anchor reveals statistically significant interactions between Ed, E3′, and DNA fragments that bear MEi along with presumed multiple rearranged Vκ genes. No significant interactions between Ed and these elements were observed in the T-cell control. It is noteworthy that these results closely resemble those obtained with transformed cells as shown in Fig. 4. We conclude that mutual interactions between these enhancers and presumptive Vκ gene promoters is a general phenomenon and not peculiar to transformed cells.
FIG. 9.
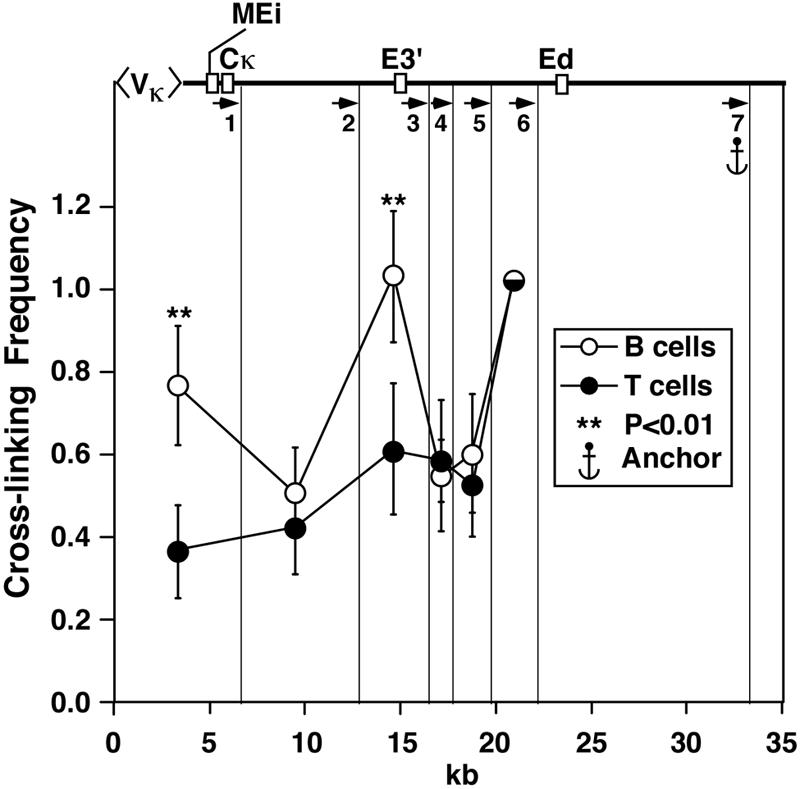
B-lymphocyte-specific interactions between Ed and E3′ and VκMEi, presented as described in the legend to Fig. 4. Quantification of PCR signals with primer 7 as an anchor is shown. Significant differences are in comparison to P815. The vertical lines indicate the MfeI cutting sites.
Jumping 5′ and walking 3′ to determine if MAR/enhancers interact with sequences at locus boundaries.
The LCR of the β-globin locus has been shown by 3C to interact with the 5′ and 3′ distal boundary elements, even before its transcriptional activation in erythroid cells (45, 64; for reviews, see references 19 and 21). This observation raises the question as to whether one or more of the enhancers in the Igκ locus might mediate related interactions. The most upstream V gene is 24 kb downstream of the 5′ housekeeping gene, Tacstd2, while the most distal downstream enhancer, Ed, is also about 24 kb upstream of the 3′ housekeeping gene, Rpia (8). Although we have not investigated the sequences within these regions to determine whether they might have insulator activity, we have used the 3C assay with NspI digestion to determine whether MEi, E3′, or Ed exhibits any interactions with sequences at the locus boundaries. The results shown in Fig. 10A and B reveal that both MEi and E3′ exhibit B-cell-specific interactions with sequences immediately adjacent to the Rpia gene at the 3′ end of the Igκ locus. Interestingly, Ed does not exhibit interactions with these 3′ sequences (Fig. 10C). In addition, we found no evidence for interaction of any of these enhancers with the 5′ border of the locus 3.2 Mb away (data not shown).
FIG. 10.
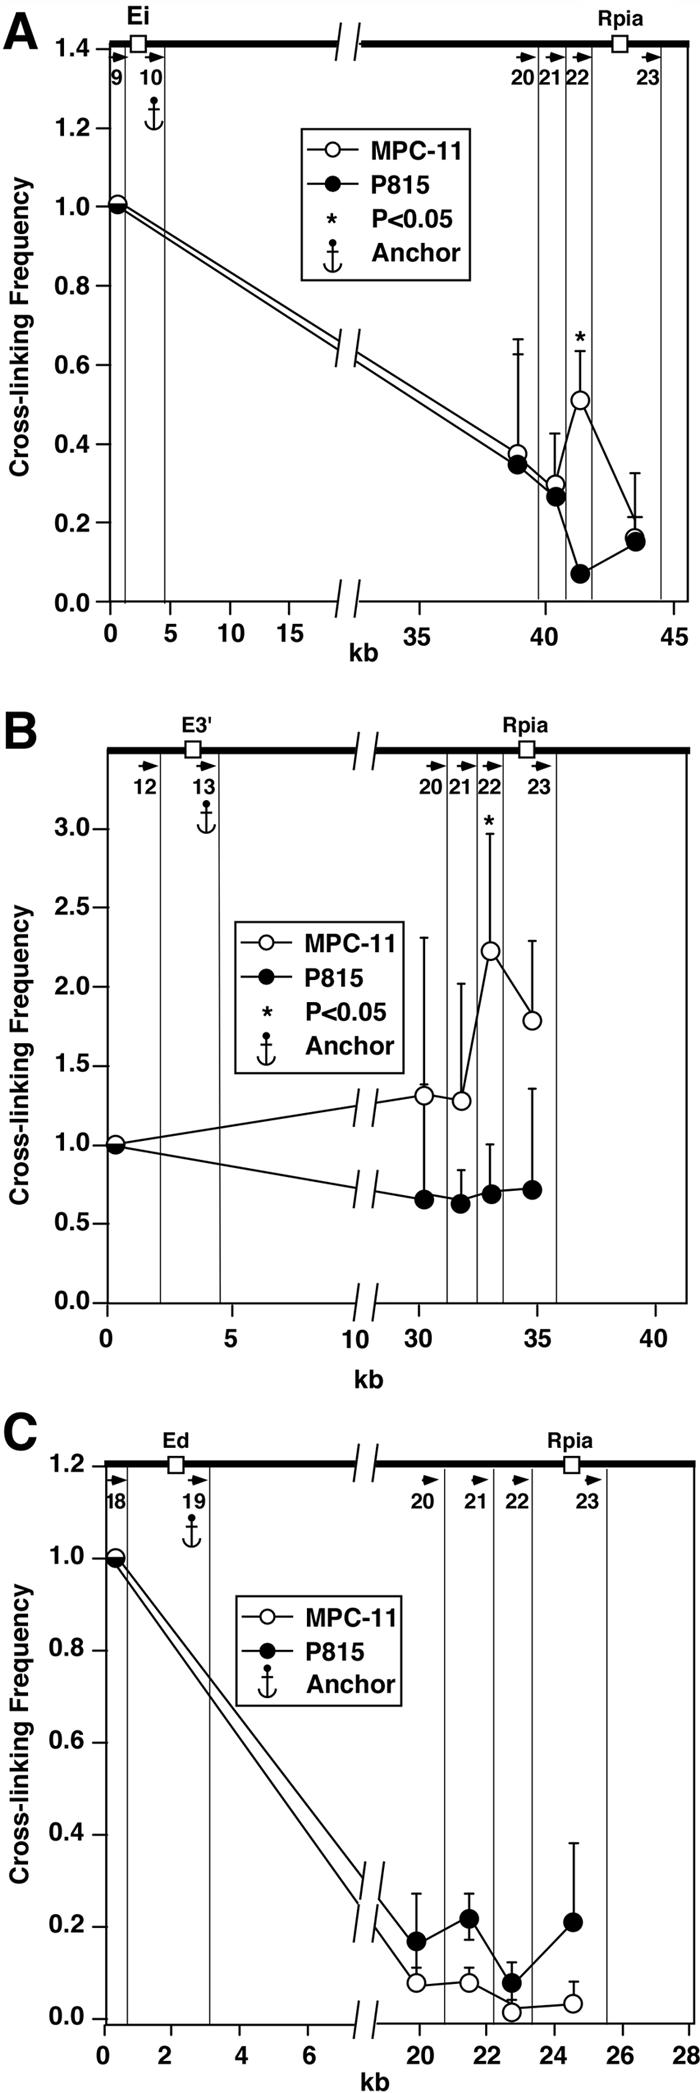
Plasmacytoma-cell-specific looping interactions between the enhancers, Ei and E3′, and a downstream boundary. Quantification of PCR signals with primers 10 (A), 13 (B), and 19 (C). We chose to study the looping interactions between the NspI fragments indicated by the vertical lines.
Candidate proteins involved in interactions between Igκ locus cis elements.
The Igκ gene cis elements for which we have identified mutual interactions have well-established binding sites for numerous transcription factors (2, 12, 34-37, 51, 56, 61). In particular, each of the three different Igκ gene enhancers possess κB sites and E boxes, which bind NF-κB and E2A transcription factors (34, 36, 51; see below). In the cases studied, mutational analysis of these sites severely hampers expression in reporter gene constructs (34, 36, 51). In addition, both of these transcription factors are essential for B-cell development (4, 24, 54). Taken together with the hypothesis that proteins that may be recruited by NF-κB and/or E2A might exhibit mutual bridging interactions between these transcription factors on different cis elements, we decided to first assay for the presence of NF-κB and E2A on the Igκ gene enhancers and the Vκ19-17 gene by performing ChIP experiments.
This approach revealed that Ei, E3′, and Ed sequences were enriched relative to those of the input fractions, approximately twofold, twofold, and threefold, respectively, after cross-linked chromatin fragments of MPC-11 cells were immunoprecipitated with an antibody against p65NF-κB (Fig. 11A). ChIP experiments with the same material and using antibodies against the E2A transcription factor subtype, E47, revealed that Ei, E3′, and Ed sequences were enriched relative to those of the input fractions, approximately threefold, eightfold, and sevenfold, respectively (Fig. 11A). A negative control Igκ gene sequence that lacks both κB sites and E boxes showed no enrichment in these assays, as expected (Fig. 11A). Interestingly, even though the Vκ19-17 promoter has E boxes, it also failed to be enriched in such samples (Fig. 11A). However, this promoter region was enriched severalfold relative to the input after immunoprecipitation with an antibody against AP-4, another transcription factor known to bind to E boxes in Vκ gene promoters (2), whereas the negative control sequence again showed no enrichment (Fig. 11B). In conclusion, this approach revealed that p65NF-κB, E47, and AP-4 are potential candidates for initiating and/or maintaining protein-protein contacts between cis elements in this locus.
NF-κB is not responsible for maintenance of interactions between cis elements in mouse plasmacytoma cell line S107.
To evaluate the importance of NF-κB in mediating interactions between various Igκ cis-acting elements in transcriptionally active loci, we employed another mouse plasmacytoma cell line, S107. Like MPC-11 cells, S107 cells possess two uniquely rearranged and actively transcribed Igκ alleles (31, 32). However, S107 cells are deficient in NF-κB, based on gel mobility shift assays and responsiveness of reporter genes carrying κB sites to induction (3). We have confirmed that this cell line lacks p65NF-κB by Western blotting (Fig. 12A). Furthermore, ChIP experiments reveal that neither enhancer is enriched over those of the input fractions after chromatin fragments were immunoprecipitated with an antibody against p65NF-κB (Fig. 12B). By contrast, ChIP revealed that Ei, E3′, and Ed sequences were enriched relative to those of the input fractions, approximately 2-, 12-, and 10-fold, respectively, after chromatin fragments were immunoprecipitated with an antibody against E47 from S107 cells, whereas the negative control sequence again showed no enrichment (Fig. 12B). The results of 3C experiments with S107 cells after employing NspI digestion with primer 17 as an anchor reveal that looping interactions between the Igκ gene enhancers and an active Vκ4-58 rearranged gene promoter are as prominent as those seen in MPC-11 cells (Fig. 12C). We conclude that NF-κB is not responsible for the maintenance of interactions between the Igκ gene enhancers and promoters in S107 cells.
FIG. 12.
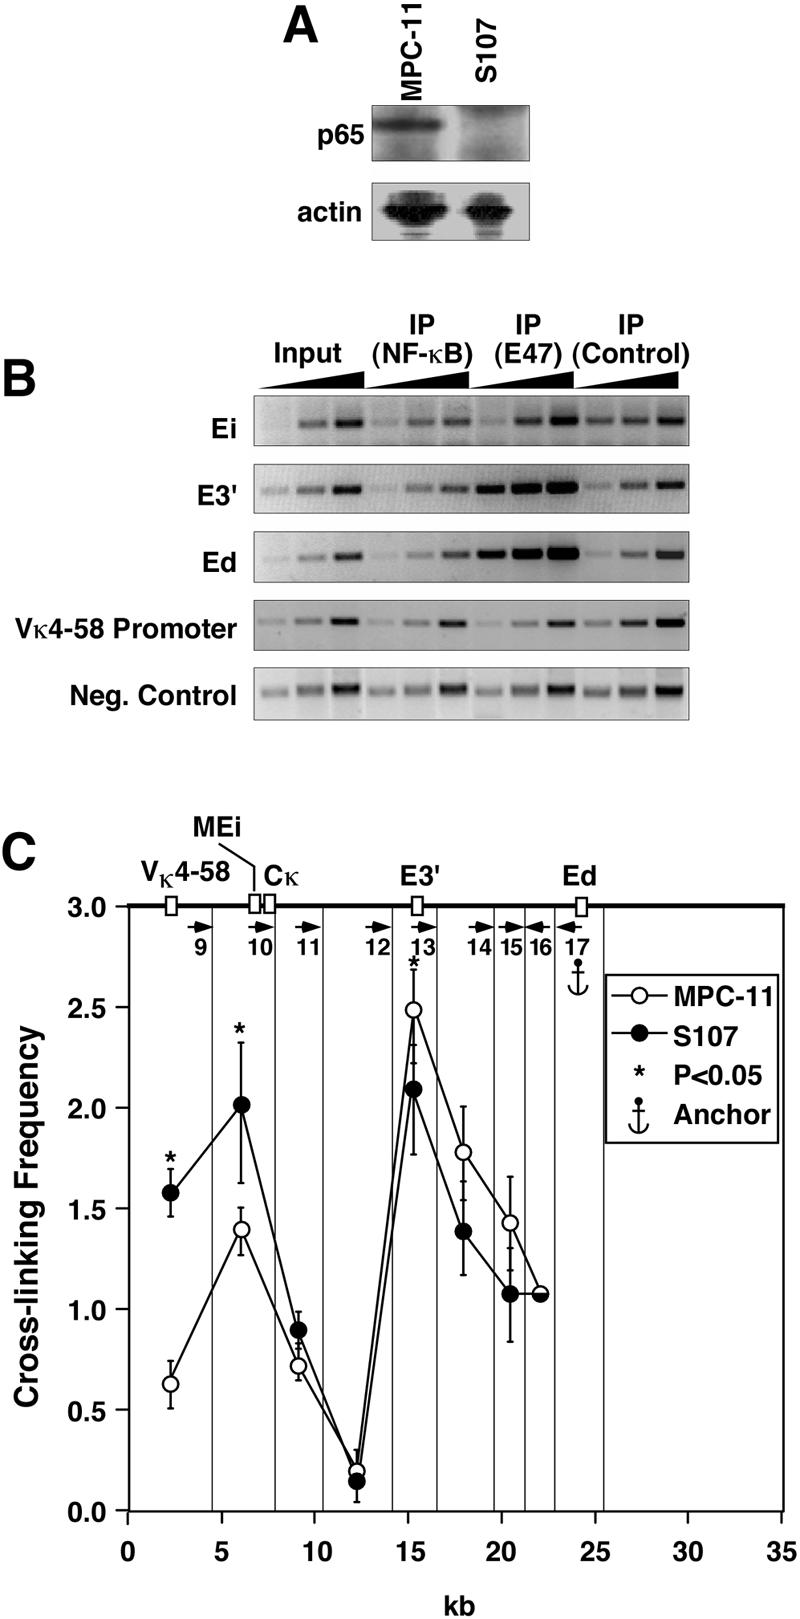
S107 plasmacytoma cells, which lack NF-κB, still exhibit prominent interactions between Igκ gene cis-acting sequences. (A) Western blot of nuclear protein extracts from MPC-11 and S107 cells showing the absence of p65NF-κB in S107 samples but not MPC-11 samples. Probing the same blot with anti-actin antibodies serves as a loading and protein integrity control. (B) Semiquantitative PCRs were performed by using 1, 3, and 9 ng of DNA templates with the indicated input, bound, and preimmune control fractions with antibodies against p65NF-κB or E47 transcription factors as indicated. (C) Comparison of S107 and MPC-11 plasmacytoma-cell-specific looping interactions between Ed and the other two enhancers. Also assayed for were interactions between the Vκ4-58 gene promoter, which is rearranged to Jκ4 in S107 cells (8, 31, 32), and Ed. Quantification of PCR signals with primer 17 as an anchor is shown. The vertical lines indicate the NspI cutting sites that were selected for analysis of the looping interactions. Data from MPC-11 is taken from Fig. 7, and the asterisks specifically indicate what interactions are statistically significant for a comparison between S107 and P815 cells from Fig. 7 data. It should be noted that NspI fragment 9 does not include the Vκ19-17 promoter from MPC-11 cells, which is on the next upstream restriction fragment (see Fig. 7).
DISCUSSION
Similarities and differences between active Igκ and β-globin loci.
Like the active β-globin locus, the active Igκ locus exhibits mutual interactions between its enhancers and genes (45, 64). However, the physical organization of these two loci are quite different, as well as the degree of resolution between our studies. The Igκ locus possesses an enhancer and MAR within its transcription unit, and the other enhancers reside downstream of the transcription termination region (16, 66). In the β-globin locus, the enhancers within the LCR reside in the far-upstream region. The β-globin locus LCR spans more than 22 kb of DNA, approximately the same distance spanned by the three Igκ gene enhancers. Hence, the Igκ gene enhancers together may also constitute an LCR, but it is partially embedded in the transcription unit. In our study, we have separately assayed for interactions between each enhancer, while in the β-globin studies, several enhancers within the LCR were studied together because they resided on the same restriction fragments. Furthermore, we have achieved a higher resolution at the level of the transcription unit itself, and we have been able to study promoter regions separately from other segments of the transcription unit. Our results also fit a looping mechanism for enhancer function but further suggest a dynamic spatial organization for the active transcription unit as discussed below.
Our analysis uncovered a continuum of interactions between the region upstream of Ei in the active transcription unit and downstream chromatin segments extending beyond the known transcription termination site (66). This result may reflect a mixture of stable interactions in different cells or a series of dynamic reversible interactions constantly occurring due to the mobility of the chromatin fiber during the process of transcription. We favor the latter possibility because of the heavy transcription of the Igκ genes in MPC-11 cells, with RNA polymerase II molecules estimated to be every 260 bp, on average, along the transcription units (59). Transcription sites are believed to be fixed in the nucleus, with the chromatin being reeled through (18). Perhaps the observed continuum of interactions of the upstream region of the transcription unit with downstream segments is related to these predicted dynamic movements of the chromatin fiber during transcription and RNA processing events.
The interactions detected by the 3C technique need not all be occurring in the same cells or even on the same allele. They obviously reflect an average of the cell population as a whole. In particular, we have found interactions between Ed and E3′ and Ei, yet when E3′ and Ei interact with the 3′ border of the locus, they do not interact with Ed. Separate interactions such as this were not observed in the β-globin LCR's interactions with its 3′ boundary, but not all interactions between its hypersensitive sites were assayed for. We hypothesize that the interactions detected between Igκ gene cis elements in our study are in dynamic flux in vivo, based on the known general mobility of chromatin fibers and the dynamic nature of transcription factor association with chromatin in living cells (1, 41, 50). It should also be pointed out that sequences that may be appear to be in a specific regulatory complex through 3C results could be brought there indirectly by adjacent interacting sequences, by a “piggyback” effect. For example, we observed that the sequence immediately upstream of Ed apparently interacts with E3′ and VκMEi. However, because Ed interacts with E3′ and VκMEi, this sequence immediately adjacent to Ed would be nearby and perhaps easily cross-linkable. For this reason, we believe that definitive results for demonstrating an interaction in 3C require that the two interacting sequences be separated by a least one, and preferably more than one, noninteracting restriction fragment. Clearly, this stricture is a limitation in the resolution of the 3C technique for studying interactions between relatively closely spaced cis elements. Another thought along these lines is that the observed interactions between Vκ19-17 and MEi and Ed, for example, hypothetically could reflect direct interactions between Vκ19-17 and MEi and direct interactions between MEi and Ed but only piggyback interactions between Vκ19-17 and Ed.
Interestingly, like the insulators at the 5′ and 3′ boundaries of the β-globin locus and the differentially methylated domains of the Igf2/H19 loci (44, 64), the 3′ boundary in the Igκ locus that interacts with MEi and E3′, we have found, possesses candidate CTCF binding sites (unpublished results). In these other gene systems, interactions between these insulators create chromatin loops that organize within them all essential cis elements for proper expression (44, 64). What is puzzling, however, is the observed interactions between the β-globin LCR and its insulators and our observations of MEi and E3′ interacting with 3′ boundary sequences. Clearly, the function(s) of these enhancer-insulator interactions remains to be elucidated.
The magnitudes of the statistically significant differences in cross-linking efficiencies between cis elements in active and inactive Igκ loci that we have observed are generally two- to sevenfold. Control experiments demonstrate that these differences are not a result of differential extents of restriction enzyme cleavage. Larger differences in cross-linking efficiencies between cis elements in active and inactive β-globin loci have been reported (64). However, we attribute this difference to the fact that we are looking at interactions between sequences that are quite close together as opposed to those being separated by 20 to 180 kb, as in the case of the β-globin locus (64). In addition, we have observed that the ligation efficiencies quantitatively differ for restriction fragments generated by different enzymes, even though the same cis elements may reside on the fragments being studied (e.g., compare results between Fig. 4 and 7; however, in Fig. 4, MEi was together with either Vκ21-5 or Vκ19-17 on the same fragments, unlike in Fig. 7). Nevertheless, the 3C results between these experiments are qualitatively similar. We attribute these observations to differences in the steric configurations of the ends of restriction fragments, depending on the positions of the cutting sites, which may be more or less accessible to ligation reactions due to higher-order chromatin structures. Clearly, such steric considerations are an inherent aspect of the 3C technique for any locus under study in varied biological systems.
Proteins that may be involved in initiating and/or maintaining contacts between cis-acting sequences in the active Igκ locus.
The proteins involved in bridging interactions between the Igκ gene enhancers and promoters are not known, although these cis elements have well-established binding sites for numerous transcription factors (2, 12, 34-37, 51, 56, 61). ChIP experiments revealed that the E2A transcription factor subtype, E47, occupied Ei, E3′, and Ed, while AP-4 was bound to the Vκ19-17 gene's promoter in the active Igκ loci in MPC-11 cells. Interestingly, both these proteins' cognate recognition sequences are E boxes, yet they are nonrandomly targeted to selective sites by mechanisms that remain to be elucidated. p65NF-κB was also found to be associated with E3′ and Ed in these cells. However, the results of 3C experiments with the NF-κB-deficient plasmacytoma, S107 (3), rule out the importance of this factor in the maintenance of interactions between Igκ enhancers and promoters. Interestingly, every interacting cis element that we have identified, except the 3′ boundary, possesses E boxes, which bind E2A and AP-4 transcription factors. E2A proteins have been strongly implicated in participating in B-cell development and chromatin accessibility (4, 54). These proteins recruit histone acetylases and chromatin remodeling complexes to their E-box binding sites (7, 22, 42, 53) and as such would be predicted to generate localized high concentrations of coactivators that may bridge contacts between distal cis-acting elements through protein-protein associations.
Acknowledgments
This investigation was supported by grants GM29935 and GM59809 from the National Institutes of Health and grant I-823 from the Robert A. Welch Foundation.
We thank Piotr Widlak for a critical review of the manuscript and Alisha Tizenor for graphic illustrations.
REFERENCES
- 1.Abney, J. R., B. Butler, M. L. Fillbach, D. Axelrod, and B. A. Scalettar. 1997. Chromatin dynamics in interphase nuclei and its implications for nuclear structure. J. Cell Biol. 137:1459-1468. [DOI] [PMC free article] [PubMed] [Google Scholar]
- 2.Aranburu, A., R. Carlsson, C. Persson, and T. Leanderson. 2001. Transcription factor AP-4 is a ligand for immunoglobulin-κ promoter E-box elements. Biochem. J. 354:431-438. [DOI] [PMC free article] [PubMed] [Google Scholar]
- 3.Atchison, M. L., and R. P. Perry. 1987. The role of the κ enhancer and its binding factor NF-kB in the developmental regulation of κ gene transcription. Cell 48:121-128. [DOI] [PubMed] [Google Scholar]
- 4.Bain, G., E. C. R. Maandag, H. P. J. te Riele, A. J. Freeney, A. Sheehy, M. Schlissel, S. A. Shinton, R. R. Hardy, and C. Murre. 1997. Both E12 and E47 allow commitment to the B cell lineage. Immunity 6:145-154. [DOI] [PubMed] [Google Scholar]
- 5.Baxter, J., M. Merkenschlager, and A. G. Fisher. 2002. Nuclear organization and gene expression. Curr. Opin. Cell Biol. 14:372-376. [DOI] [PubMed] [Google Scholar]
- 6.Blasquez, V. C., M. A. Hale, K. W. Trevorrow, and W. T. Garrard. 1992. Immunoglobulin κ gene enhancers synergistically activate gene expression but independently determine chromatin structure. J. Biol. Chem. 267:23888-23893. [PubMed] [Google Scholar]
- 7.Bradney, C., M. Hjelmeland, Y. Komatsu, M. Yoshida, T.-P. Yao, and Y. Zhuang. 2003. Regulation of E2A activities by histone acetyltransferases in B lymphocyte development. J. Biol. Chem. 278:2370-2376. [DOI] [PubMed] [Google Scholar]
- 8.Brekke, K. M., and W. T. Garrard. 2004. Assembly and analysis of the mouse immunoglobulin kappa gene sequence. Immunogenetics 56:490-505. [DOI] [PubMed] [Google Scholar]
- 9.Brown, K. E., J. Baxter, D. Graf, M. Merkenschlager, and A. G. Fisher. 1999. Dynamic repositioning of genes in the nucleus of lymphocytes preparing for cell division. Mol. Cell 3:207-217. [DOI] [PubMed] [Google Scholar]
- 10.Brown, K. E., S. S. Guest, S. T. Smale, K. Hahm, M. Merkenschlager, and A. G. Fisher. 1997. Association of transcriptionally silent genes with ikaros complexes at centromeric heterochromatin. Cell 91:845-854. [DOI] [PubMed] [Google Scholar]
- 11.Carter, D., L. Chakalova, C. S. Osborne, Y.-F. Dai, and P. Fraser. 2002. Long-range chromatin regulatory interactions in vivo. Nat. Genet. 32:623-626. [DOI] [PubMed] [Google Scholar]
- 12.Casellas, R., M. Jankovic, G. Meyer, A. Gazumyan, Y. Luo, R. G. Roeder, and M. C. Nussenzweig. 2002. OcaB is required for normal transcription and V(D)J recombination in a subset of immunoglobulin genes. Cell 110:575-585. [DOI] [PubMed] [Google Scholar]
- 13.Choi, E., M. Kuehl, and R. Wall. 1980. RNA splicing generates a variant light chain from an aberrantly rearranged kappa gene. Nature 286:776-779. [DOI] [PubMed] [Google Scholar]
- 14.Chubb, J. R., S. Boyle, P. Perry, and W. A. Bickmore. 2002. Chromatin motion is constrained by association with nuclear compartments in human cells. Curr. Biol. 12:439-445. [DOI] [PubMed] [Google Scholar]
- 15.Chubb, J. R., and W. Bickmore. 2003. Considering nuclear compartmentalization in the light of nuclear dynamics. Cell 112:403-406. [DOI] [PubMed] [Google Scholar]
- 16.Cockerill, P. N., and W. T. Garrard. 1986. Chromosomal loop anchorage of the kappa immunoglobulin gene occurs next to the enhancer in a region containing topoisomerase II sites. Cell 44:273-282. [DOI] [PubMed] [Google Scholar]
- 17.Coligan, J. E., A. M. Kruisbeek, D. H. Margulies, E. M. Sherach, and W. Strober. 1994. Current protocols in immunology, p. 1.9.1-1.9.3, 6.4.5-6.4.6. John Wiley & Sons, New York, N.Y.
- 18.Cook, P. R. 1999. The organization of replication and transcription. Science 284:1790-1795. [DOI] [PubMed] [Google Scholar]
- 19.Dekker, J. 2003. A closer look a long-range chromosomal interactions. Trends Biochem. Sci. 28:277-280. [DOI] [PubMed] [Google Scholar]
- 20.Dekker, J., K. Rippe, M. Dekker, and N. Kleckner. 2002. Capturing chromosome conformation. Science 295:1306-1311. [DOI] [PubMed] [Google Scholar]
- 21.de Laat, W., and F. Grosveld. 2003. Spatial organization of gene expression: the active chromatin hub. Chromosome Res. 11:447-459. [DOI] [PubMed] [Google Scholar]
- 22.Eckner, R., T.-P. Yao, E. Oldread, and D. M. Livingston. 1996. Interaction and functional collaboration of p300/CBP and bHLH proteins in muscle and B-cell differentiation. Genes Dev. 10:2478-2490. [DOI] [PubMed] [Google Scholar]
- 23.Fernandez, L., M. Winkler, and R. Grosschedl. 2001. Matrix attachment region-dependent function of the immunoglobulin μ enhancer involves histoneacetylation at a distance without changes in enhancer occupancy. Mol. Cell. Biol. 21:196-208. [DOI] [PMC free article] [PubMed] [Google Scholar]
- 24.Franzoso, G., L. Carlson, L. Xing, L. Poljak, E. W. Shores, K. D. Brown, A. Leonardi, T. Tran, B. F. Boyce, and U. Siebenlist. 1997. Requirement for NF-κB in osteoclast and B-cell development. Genes Dev. 11:3482-3496. [DOI] [PMC free article] [PubMed] [Google Scholar]
- 25.Gellert, M. 2002. Recombination: RAG proteins, repair factors, and regulation. Annu. Rev. Biochem. 71:101-132. [DOI] [PubMed] [Google Scholar]
- 26.George, J. B., S. Li, and W. T. Garrard. 1995. Yeast artificial chromosome contigs reveal that distal variable regions genes reside at least 3 megabases from the joining regions in the murine immunoglobulin κ locus. Proc. Natl. Acad. Sci. USA 92:12421-12425. [DOI] [PMC free article] [PubMed] [Google Scholar]
- 27.Gubin, A. N., and J. L. Miller. 2001. Human erythroid porphobilinogen deaminase exists in 2 splice variants. Blood 97:815-817. [DOI] [PubMed] [Google Scholar]
- 28.Hale, M. A., and W. T. Garrard. 1998. A targeted kappa immunoglobulin gene containing a deletion of the nuclear matrix association region exhibits spontaneous hyper-recombination in pre-B cells. Mol. Immunol. 35:609-620. [DOI] [PubMed] [Google Scholar]
- 29.Jackson, D. A. 2003. The principles of nuclear structure. Chromosome Res. 11:387-401. [DOI] [PubMed] [Google Scholar]
- 30.Kosak, S. T., J. A. Skok, K. L. Medina, R. Riblet, M. M. Le Beau, A. G. Fisher, and H. Singh. 2002. Subnuclear compartmentalization of immunoglobulin loci during lymphocyte development. Science 296:158-162. [DOI] [PubMed] [Google Scholar]
- 31.Kwan, S.-P., E. E. Max, S. G. Seidman, P. Leder, and M. D. Scharff. 1981. Two kappa immunoglobulin genes are expressed in the myeloma S107. Cell 26:57-66. [DOI] [PubMed] [Google Scholar]
- 32.Kwan, S.-P., S. Rudikoff, S. G. Seidman, P. Leder, and M. D. Scharff. 1981. Nucleic acid and protein sequences of phosphocholine-binding light chains. J. Exp. Med. 153:1366-1370. [DOI] [PMC free article] [PubMed] [Google Scholar]
- 33.Labrador, M., and V. G. Corces. 2002. Setting the boundaries of chromatin domains and nuclear organization. Cell 111:151-154. [DOI] [PubMed] [Google Scholar]
- 34.Lenardo, M., J. W., Pierce, and D. Baltimore. 1987. Protein-binding sites in Ig gene enhancers determine transcriptional activity and inducibility. Science 236:1573-1577. [DOI] [PubMed] [Google Scholar]
- 35.Liu, X., A. Prabhu, and B. Van Ness. 1999. Developmental regulation of the κ locus involves both positive and negative sequence elements in the 3′ enhancer that affect synergy with the intron enhancer. J. Biol. Chem. 274:3285-3296. [DOI] [PubMed] [Google Scholar]
- 36.Liu, Z.-M., J. B. George-Raizen, S. Li, M. Y. Chang, K. C. Meyers, and W. T. Garrard. 2002. Chromatin structural analyses of the mouse Igκ gene locus reveal new hypersensitive sites specifying a transcriptional silencer and enhancer. J. Biol. Chem. 277:32640-32649. [DOI] [PubMed] [Google Scholar]
- 37.Maitra, S., and M. Atchison. 2000. BSAP can repress enhancer activity by targeting PU.1 function. Mol. Cell. Biol. 20:1911-1922. [DOI] [PMC free article] [PubMed] [Google Scholar]
- 38.Manders, E., M. M., A. E. Visser, A. Koppen, W. C. de Leeuw, R. van Liere, G. J. Brakenhoff, and R. van Driel. 2003. Four-dimensional imaging of chromatin dynamics during the assembly of the interphase nucleus. Chromosome Res. 11:537-547. [DOI] [PubMed] [Google Scholar]
- 39.Marshall, W. F. 2002. Order and disorder in the nucleus. Curr. Biol. 12:R185-R192. [DOI] [PubMed] [Google Scholar]
- 40.Marshall, W. F., A. F. Dernburg, B. Harmon, D. A. Agard, and J. W. Sedat. 1996. Specific interactions of chromatin with the nuclear envelope: positional determination within the nucleus in Drosophila melanogaster. Mol. Biol. Cell. 7:825-842. [DOI] [PMC free article] [PubMed] [Google Scholar]
- 41.Marshall, W. F., A. Straight, J. F. Marko, J. Swedlow, A. Dernburg, A. Belmont, A. W. Murray, D. A. Agard, and J. W. Sedat. 1997. Interphase chromosomes undergo constrained diffusional motion in living cells. Curr. Biol. 7:930-939. [DOI] [PubMed] [Google Scholar]
- 42.Massari, M. E., P. A. Grant, M. G. Pray-Grant, S. L. Berger, J. L. Workman, and C. Murre. 1999. A conserved motif present in a class of helix-loop-helix proteins activates transcription by direct recruitment of the SAGA complex. Mol. Cell 4:63-73. [DOI] [PubMed] [Google Scholar]
- 43.Meyer, K. B., and M. S. Neuberger. 1989. The immunoglobulin κ locus contains a second, stronger B-cell-specific enhancer which is located downstream of the constant region. EMBO J. 8:1959-1964. [DOI] [PMC free article] [PubMed] [Google Scholar]
- 44.Murrell, A., S. Heeson, and W. Reik. 2004. Interaction between differentially methylated regions partitions the imprinted genes Igf2 and H19 into parent-specific chromatin loops. Nat. Genet. 36:889-893. [DOI] [PubMed] [Google Scholar]
- 45.Palstra, R.-J., B. Tolhuis, E. Splinter, R. Nijmeijer, F. Grosveld, and W. de Laat. 2003. The β-globin nuclear compartment in development and erythroid differentiation. Nat. Genet. 35:190-194. [DOI] [PubMed] [Google Scholar]
- 46.Parslow, T. G., D. L. Blair, W. J. Murphy, and D. K. Granner. 1984. Structure of the 5′ ends of immunoglobulin genes: a novel conserved sequence. Proc. Natl. Acad. Sci. USA 81:2650-2654. [DOI] [PMC free article] [PubMed] [Google Scholar]
- 47.Patrinos, G. P., M. de Krom, E. de Boer, A. Langeveld, A. M. Imam, J. Strouboulis, W. de Laat, and F. G. Grosveld. 2004. Multiple interacvtions between regulatory regions are required to stabilize an active chromatin hub. Genes Dev. 18:1495-1509. [DOI] [PMC free article] [PubMed] [Google Scholar]
- 48.Pederson, T. 2004. The spatial organization of the genome in mammalian cells. Curr. Opin. Genet. Dev. 14:203-209. [DOI] [PubMed] [Google Scholar]
- 49.Perry, R. P., D. E. Kelley, C. Coleclough, J. G. Seidman, P. Leder, S. Tonegawa, G. Matthysssens, and M. Weigert. 1980. Transcription of mouse kappa chain genes: implications for allelic exclusion. Proc. Natl. Acad. Sci. USA 77:1937-1941. [DOI] [PMC free article] [PubMed] [Google Scholar]
- 50.Phair, R. D., P. Scaffidi, C. Elbi, J. Vecerova, A. S. Dey, K. Ozato, D. T. Brown, G. Hager, M. Bustin, and T. Misteli. 2004. Global nature of dynamic protein-chromatin interactions in vivo: three-dimensional genome scanning and dynamic interaction networks of chromatin proteins. Mol. Cell. Biol. 24:6393-6402. [DOI] [PMC free article] [PubMed] [Google Scholar]
- 51.Pongubala, J. M. R., and M. L. Atchison. 1991. Functional characterization of the developmentally controlled immunoglobulin kappa 3′ enhancer: regulation by Id, a repressor of helix-loop-helix transcription factors. Mol. Cell. Biol. 11:1040-1047. [DOI] [PMC free article] [PubMed] [Google Scholar]
- 52.Queen, C., and D. Baltimore. 1983. Immunoglobulin gene transcription is activated by downstream sequence elements. Cell 33:741-748. [DOI] [PubMed] [Google Scholar]
- 53.Qui, Y., A. Sharma, and A. Stein. 1998. p300 mediates transcriptional stimulation by the basic helix-loop-helix factors of the insulin gene. Mol. Cell. Biol. 18:2957-2964. [DOI] [PMC free article] [PubMed] [Google Scholar]
- 54.Quong, M. W., W. J. Romanow, and C. Murre. 2002. E protein function in lymphocyte development. Annu. Rev. Immunol. 20:301-322. [DOI] [PubMed] [Google Scholar]
- 55.Ragoczy, T., A. Telling, T. Sawado, M. Groudine, and S. T. Kosas. 2003. A genetic analysis of chromosome territory looping: diverse roles for distal regulatory elements. Chromosome Res. 11:513-525. [DOI] [PubMed] [Google Scholar]
- 56.Roque, M. A., P. A. Smith, and V. C. Blasquez. 1996. A developmentally modulated chromatin structure at the mouse immunoglobulin κ 3′ enhancer. Mol. Cell. Biol. 16:3138-3155. [DOI] [PMC free article] [PubMed] [Google Scholar]
- 57.Rose, S. M., and W. T. Garrard. 1984. Differentiation-dependent chromatin alterations precede and accompany transcription of immunoglobulin light chain genes. J. Biol. Chem. 259:8534-8544. [PubMed] [Google Scholar]
- 58.Schaarschmidt, D., E.-M. Ladenburger, C. Keller, and R. Knippers. 2002. Human mcm proteins at a replication origin during the G1 to S phase transition. Nucleic Acids Res. 30:4176-4185. [DOI] [PMC free article] [PubMed] [Google Scholar]
- 59.Schibler, U., K. B. Marcu, and R. P. Perry. 1978. The synthesis and processing of the messenger RNAs specifying heavy and light chain immunoglobulins in MPC-11 cells. Cell 15:1495-1509. [DOI] [PubMed] [Google Scholar]
- 60.Seidman, J. G., and P. Leder. 1980. A mutant immunoglobulin light chain is formed by aberrant DNA-and RNA-splicing events. Nature 286:779-783. [DOI] [PubMed] [Google Scholar]
- 61.Shaffer, A. L., A. Peng, and M. S. Schlissel. 1997. In vivo occupancy of the κ light chain enhancers in primary pro- and pre-B cells: a model for κ locus activation. Immunity 6:131-143. [DOI] [PubMed] [Google Scholar]
- 62.Skok, J. A., K. E. Brown, V. Azuara, M.-L. Caparros, J. Baxter, K. Takacs, N. Dillon, D. Gray, R. P. Perry, M. Merkenschlager, and A. G. Fisher. 2001. Nonequivalent nuclear location of immunoglobulin alleles in B lymphocytes. Nat. Immunol. 2:848-853. [DOI] [PubMed] [Google Scholar]
- 63.Spiliankis, C. G., and R. A. Flavell. 2004. Long-range intrachromosomal interactions in the T helper type 2 cytokine locus. Nat. Immunol. 5:1017-1027. [DOI] [PubMed] [Google Scholar]
- 64.Tolhuis, B., R.-J. Palstra, E. Splinter, F. Grosveld, and W. de Laat. 2002. Looping and interaction between hypersensitive sites in the active β-globin locus. Mol. Cell 10:1453-1465. [DOI] [PubMed] [Google Scholar]
- 65.Williams, R. R. E. 2003. Transcription and the territory: the ins and outs of gene positioning. Trends Genet. 19:298-302. [DOI] [PubMed] [Google Scholar]
- 66. Xu, M., M. B. Barnard, S. M. Rose, P. N. Cockerill, S.-Y. Huang, and W. T. Garrard. 1986. Transcription termination and chromatin structure of the active immunoglobulin κ gene locus. J. Biol. Chem. 261:3838-3845. [PubMed] [Google Scholar]
- 67.Yancopoulos, G. D., and F. W. Alt. 1985. Developmental controlled and tissue-specific expression of unrearranged Vκ gene segments. Cell 40:271-281. [DOI] [PubMed] [Google Scholar]
- 68.Yusufzai, T. M., H. Tagami, Y. Nakatani, and G. Felsenfeld. 2004. CTCF tethers an insulator to subnuclear sites, suggesting shared insulator mechanisms across species. Cell 13:291-298. [DOI] [PubMed] [Google Scholar]


