

Abstract
Background:
Impaired sleep is commonly associated with Alzheimer’s disease (AD), although the underlying mechanisms remain unclear. Furthermore, the moderating effects of sleep-affecting medications, which have been linked to AD pathology, are incompletely characterized. Using data from the Alzheimer’s Disease Neuroimaging Initiative, we investigated whether a medical history of impaired sleep, informant-reported nighttime behaviors, and sleep-affecting medications are associated with beta-amyloid and tau deposition on PET and cognitive change, cross-sectionally and longitudinally.
Methods:
We included 964 subjects with 18F-florbetapir PET scans. Measures of sleep impairment and medication use were obtained from medical histories and the Neuropsychiatric Inventory Questionnaire. Multivariate models, adjusted for covariates, were used to assess associations among sleep-related features, beta-amyloid and tau, and cognition. Cortical tau deposition, categorized by Braak stage, was assessed using the standardized uptake value peak alignment (SUVP) method on 18F-flortaucipir PET.
Results:
Medical history of sleep impairment was associated with greater baseline tau in the meta-temporal, Braak 1, and Braak 4 regions (p=0.04, p<0.001, p=0.025, respectively). Abnormal nighttime behaviors were also associated with greater baseline tau in the meta-temporal region (p=0.024), and greater cognitive impairment, cross-sectionally (p=0.007) and longitudinally (p<0.001). Impaired sleep was not associated with baseline beta-amyloid (p>0.05). Short-term use of selective serotonin reuptake inhibitors and benzodiazepines slightly weakened the sleep-tau relationship.
Conclusions:
Sleep impairment was associated with tauopathy and cognitive decline, which could be linked to increased tau secretion from neuronal hyperactivity. Clinically, our results help identify high-risk individuals who could benefit from sleep-related interventions aimed to delay cognitive decline and AD.
Keywords: Alzheimer’s disease, insomnia, sleep, positron emission tomography, tau, neuroimaging
1. Introduction
Alzheimer’s disease (AD) is an incurable, progressive neurodegenerative disease characterized by multidomain cognitive impairment and histopathologic evidence of beta-amyloid (Aβ) plaques and neurofibrillary tangles of hyperphosphorylated tau.[1] The influence of lifestyle factors on the accumulation of these protein aggregates has been widely studied and raises the possibility that modifying such factors could be a therapeutic strategy to delay cognitive decline.[2]
Recently, sleep has been implicated in AD pathogenesis.[3,4] Insomnia and chronic sleep deprivation have been reported to accelerate Aβ[5] and tau accumulation,[6] by increasing production and decreasing clearance. In particular, the disruption of nonrapid eye movement (NREM) slow wave sleep (SWS) has been found to be associated with Aβ and tau pathology,[7,8] possibly by disrupting glymphatic function, which is normally enhanced during deep NREM SWS, and thereby impairing clearance of Aβ and tau.[9] Besides glymphatic dysfunction, AD pathology due to disrupted sleep may be associated with other pathologic processes, including heightened neuronal activity during periods of prolonged wakefulness,[10] elevated proinflammatory cytokines,[11] decreased brain-derived neurotrophic factor (BDNF),[12–14] and accelerated microglial aging.[15] However, other studies have found only a limited relationship between sleep and AD pathology or cognitive decline.[16–18]
Beyond sleep itself, whether distinct classes of sleep-affecting medications can mediate or moderate reported sleep-AD relationships has not been thoroughly investigated. For example, there is literature that suggests that SSRIs can reduce Aβ and tau levels in both AD mouse models and in humans with AD, although findings are inconsistent.[19–22] In clinical practice, SSRIs may also be used to treat insomnia off-label, particularly when overlapping with mild depressive symptoms.[23] The nonbenzodiazepine drug zolpidem was recently found to increase hippocampal ripple density, duration, and amplitude in rat models, suggesting a potential role for zolpidem in sleep-dependent memory consolidation.[24] Several studies[25,26] have demonstrated regulation of tau hyperphosphorylation by benzodiazepine drugs in mice; however, the effect of benzodiazepines on AD progression is unclear, with contradictory study findings.[27–30] Characterization of these medications in relation to sleep impairment and AD pathogenesis may be important for identifying individuals for whom sleep-modifying interventions might be most effective, as polypharmacy of these medications is common in older adults.
Given the potential interacting effects of sleep and sleep-affecting medications on AD pathogenesis, we used data from the Alzheimer’s Disease Neuroimaging Initiative (ADNI) to investigate the relationships between sleep impairment, Aβ and tau deposition, and cognition. Specifically, we used a medical history of abnormal sleep, informant-reported abnormal nighttime behaviors on the NPIQ, and logs of sleep-affecting medication consumption to investigate effects on the accumulation of AD pathology and longitudinal cognitive decline.
2. Methods
2.1. The ADNI database
The subjects included in these analyses were participants in the ADNI (www.adni-info.org),[31] which is a longitudinal, multicenter, observational cohort study designed to identify imaging and fluid biomarkers that can be used to diagnose and monitor AD. It was launched in 2003 by the National Institute on Aging (NIA), the National Institute of Biomedical Imaging and Bioengineering (NIBIB), the Food and Drug Administration (FDA), private pharmaceutical companies, and non-profit organizations, as a $60 million, 5-year public-private partnership, led by Principal Investigator, Michael W. Weiner, MD. ADNI-1 was followed by ADNI-GO, ADNI-2, and ADNI-3, and to date, these protocols have recruited over 1500 adults from over 50 sites across the U.S. and Canada. The study was approved by the Institutional Review Boards from all participating institutions. Informed written consent was obtained from all participants at each site. ADNI data were obtained from the publicly available ADNI database, accessed online at adni.loni.usc.edu.
Briefly, subjects in ADNI were between the ages of 55 and 90 years and were enrolled into three diagnostic cohorts (NC, mild cognitive impairment [MCI], and AD). Individuals with any significant non-AD neurological disease, abnormal baseline MRI, significant systemic illness, or psychiatric condition, including major depressive disorder, bipolar disorder, schizophrenia, or recent alcohol or substance use dependency, were excluded. Patients residing in skilled nursing facilities were also excluded.[32] The MCI and AD cohorts were distinct from the NC cohort based on clinical features, including self- or partner- reported memory complaints, a Clinical Dementia Rating (CDR) of 0.5 or above, and memory impairment on the Wechsler Memory Scale. MCI and AD cohorts were further differentiated by the Mini-Mental State Exam (score of 24–30 for MCI and 20–26 for AD); and by the CDR Memory Box score (at least 0.5 for MCI and 1.0 for AD).[32]
2.2. Subject population
Nine hundred sixty-four ADNI subjects who had a 18F-florbetapir Aβ PET scan—278 NC, 559 with MCI, 127 with AD—were included in these analyses (Table 1). Six hundred fifty-seven subjects had at least 1 follow-up 18F-florbetapir PET scan, 403 had at least 2 follow-up scans, 221 had at least 3 follow-up scans, 89 had at least 4 follow-up scans, and 5 had 5 follow-up scans, with a mean duration of follow-up from first to last visit of 4.6 +/− 2.4 years, across all 657 subjects.
Table 1.
Baseline characteristics
| Normal | Mild cognitive impairment, beta-amyloid negative on PET | Mild cognitive impairment, beta-amyloid positive on PET | Alzheimer’s disease | p-value* | |
|---|---|---|---|---|---|
| Number of subjects | 278 | 243 | 316 | 127 | |
| Age, years | 74.3 [5.8] | 70.3 [7.9]* | 73.1 [6.9] | 74.9 [8.0] | < 0.001 |
| Sex, number of subjects (%) - Male - Female |
140 (50.4%) 138 (49.6%) |
136 (56.0%) 107 (44.0%) |
182 (57.6%) 134 (42.4%) |
76 (59.8%) 51 (40.2%) |
0.21 |
| Number (%) of subjects with an APOE ε2 allele | 34 (12.2%) | 31 (12.8%) | 6 (1.9%)* | 5 (3.9%)* | < 0.001 |
| Number (%) of subjects with an APOE ε4 allele | 74 (26.6%) | 53 (21.8%) | 201 (63.6%)* | 86 (67.7%)* | < 0.001 |
| Baseline Alzheimer’s Disease Assessment Scale, 13-item cognitive subscale | 9.9 [5.7] | 12.8 [7.1]* | 18.6 [9.8]* | 31.9 [8.4]* | < 0.001 |
| Number (%) of subjects with a medical history of difficulty sleeping | 25 (9.0%) | 31 (12.8%) | 27 (8.5%) | 11 (8.7%) | 0.37 |
| Number (%) of subjects with abnormal nighttime behaviors on the NPIQ | 76 (27.3%) | 100 (41.2%)* | 141 (44.6%)* | 42 (33.1%) | < 0.001 |
| Number (%) of subjects with a history of OSA | 12 (4.3%) | 44 (18.1%)* | 35 (11.1%)* | 15 (11.8%)* | < 0.001 |
| Number (% of subjects with OSA) of subjects with a history of CPAP treatment for OSA | 5 (33.3%) | 7 (46.7%) | 7 (46.7%) | 5 (33.3%) | 0.19 |
| Number (%) of subjects who have taken SSRIs for less than 10 years | 15 (5.4%) | 25 (10.3%)* | 40 (12.7%)* | 23 (18.1%)* | < 0.001 |
| Number (%) of subjects who have taken SSRIs for ≥ 10 years | 24 (8.6%) | 36 (14.8%)* | 58 (18.4%)* | 23 (18.1%)* | 0.003 |
| Number (%) of subjects who have taken non-SSRI antidepressants for less than 10 years | 14 (5.0%) | 5 (2.1%) | 12 (3.8%) | 5 (3.9%) | 0.35 |
| Number (%) of subjects who have taken non-SSRI antidepressants for ≥ 10 years | 8 (2.9%) | 15 (6.2%) | 8 (2.5%) | 4 (3.1%) | 0.14 |
| Number (%) of subjects who have taken antipsychotics for less than 10 years | 6 (2.2%) | 3 (1.2%) | 8 (2.5%) | 6 (4.7%) | 0.23 |
| Number (%) of subjects who have taken antipsychotics for ≥ 10 years | 0 (0.0%) | 2 (0.8%) | 3 (0.9%) | 1 (0.8%) | 0.37 |
| Number (%) of subjects who have taken benzodiazepines for less than 10 years | 7 (2.5%) | 9 (3.7%) | 18 (5.7%) | 2 (1.6%) | 0.12 |
| Number (%) of subjects who have taken benzodiazepines for ≥ 10 years | 11 (4.0%) | 15 (6.2%) | 12 (3.8%) | 3 (2.4%) | 0.36 |
| Number (%) of subjects who have taken zolpidem for less than 10 years | 3 (1.1%) | 1 (0.4%) | 1 (0.3%) | 1 (0.8%) | 0.64 |
| Number (%) of subjects who have taken zolpidem for ≥ 10 years | 13 (4.7%) | 5 (2.1%) | 6 (1.9%) | 1 (0.8%) | 0.09 |
| Number (%) of subjects who have taken melatonin for less than 10 years | 9 (3.2%) | 9 (3.7%) | 15 (4.7%) | 1 (0.8%) | 0.21 |
| Number (%) of subjects who have taken melatonin for ≥ 10 years | 8 (2.9%) | 10 (4.1%) | 8 (2.5%) | 7 (5.5%) | 0.37 |
| Number (%) of subjects with a Geriatric Depression Scale score ≥ 5 | 10 (3.6%) | 22 (9.1%)* | 20 (6.3%) | 9 (7.1%) | 0.07 |
Data shown are means [standard deviations]
P-values were obtained by the Kruskal-Wallis or Fisher’s Exact tests, depending on the variable type.
P < 0.05 as compared to the cognitively normal group by the Wilcoxon rank sum or Fisher’s Exact tests
18F-flortaucipir PET scans were available for 254 subjects: 119 (43%) of NC, 132 (24%) of MCI, and 3 (2%) of AD subjects. One hundred and forty-four had at least 1 follow-up 18F-flortaucipir PET scan, 65 had at least 2 follow-up scans, and 25 had 3 follow-up scans, with a mean follow-up duration from first to last visit of 2.8 +/− 1.4 years.
Cognitive function was assessed using the Alzheimer’s Disease Assessment Scale Cognitive Subscale (ADAS-Cog), 13-item version, which is the most widely used measure in clinical trials.[33]
2.3. Sample size calculation
Two references were used to estimate the minimum sample size needed for these analyses. The first was a pilot study by Shokouhi et al. assessing the relationship between informant-based sleep reports and Aβ deposition on PET.[34] This study reported an effect size of a 0.18 difference in SUVR between the groups that reported or did not report difficulty sleeping. With a standard deviation of 0.178, a total sample size of 30 would be sufficient, with 15 in each group. A second study by Jackson et al. reported differences in global Aβ levels on PET in individuals with and without obstructive sleep apnea.[35] With an effect size of a 4.68 SUVR difference between groups and a standard deviation of 10.65, a sample size of 236 would be sufficient, with 118 per group. Based on these two references, our sample size of 964 was considered more than sufficient to assess differences in Aβ deposition in people with and without sleep impairment.
2.4. Characterization of impaired sleep
Impaired sleep was assessed in two ways: 1) documentation of “difficulty sleeping,” “difficulty falling asleep,” “having trouble sleeping,” “sleeping difficulty,” “problems sleeping,” “poor sleep,” “interrupted sleep,” “sleep disturbance,” “sleep disorder,” or “sleep disruption” in the subject’s medical history (MH-SLEEP), and 2) informant report of abnormal nighttime behaviors on the Neuropsychiatric Inventory Questionnaire (NPIQ), in response to the question (Question 12a), “Does the patient awake you during the night, rise too early in the morning, or take excessive naps during the day?” (NPI-SLEEP), a measure that has been used to capture abnormal nighttime behaviors in previous studies.[36,37] We also noted if there was a documented medical history of obstructive sleep apnea (OSA), and whether the OSA was treated or not treated with continuous positive airway pressure (CPAP).
2.5. Identifying medications that can affect sleep
We compiled a list of medications that could affect sleep in our cohort based on two sources. First, we referenced a study by Do[38] that compiled data from 7,748 respondents of the 1999–2016 National Health and Nutrition Examination Survey and sourced insomnia data from the Micromedex database, which include boxed warnings, adverse effects from the US Food and Drug Administration, and clinical trial findings. We then supplemented the list with insomnia incidence data collected from the Prescriber’s Digital Reference (PDR).[39] The PDR is the online and updated version of the Physicians’ Desk Reference, a printed reference source of boxed warning, side effects, interactions, and other information on various drugs.
From these two sources, we compiled a list of all medications with an average insomnia incidence ≥ 10%, totaling 106 medications (65 medications from Do[38] and 41 from the PDR) [see Additional file 1]. Vaccines were excluded. We then combined this list of 106 insomnia-related medications with 25 common sedative-hypnotic medications,[40,41] including benzodiazepines, diphenhydramine, and zolpidem (see Additional file 2). We also included melatonin, a commonly used over-the-counter supplement to improve sleep, given previous studies reporting potential therapeutic effects of melatonin and the melatonin receptor agonist, ramelteon, in patients with MCI and AD.[42,43] In total, we prepared a list of 132 medications that could potentially affect sleep.
Out of these 132 medications, we excluded medications that were consumed by fewer than 30 subjects (3%) of our cohort, leaving 21 medications in 6 major classes: SSRIs (sertraline, citalopram, escitalopram, fluoxetine, paroxetine, fluvoxamine), non-SSRI antidepressants (bupropion, venlafaxine, desvenlafaxine), antipsychotics (quetiapine, aripiprazole, olanzapine, risperidone), benzodiazepines (lorazepam, alprazolam, clonazepam, temazepam, diazepam, chlordiazepoxide, triazolam), melatonin, and zolpidem. Of note, Z drugs (aside from zolpidem), doxepin, ramelteon, and diphenhydramine were taken by only 3 or fewer subjects in ADNI, so they were not included in our analyses. Lastly, we classified the duration of medication use as short-term, if used for less than 10 years, or long-term, if used for 10 or more years.
2.6. APOE genotyping
ADNI’s APOE genotyping was performed on DNA extracted from peripheral blood cells and processed by the University of Pennsylvania AD Biofluid Bank Laboratory, as previously described.[44] Approximately 6 ml of blood were obtained from each participant in an EDTA tube, gently mixed by inversion, and shipped at ambient temperature to a single designated laboratory within 24 hours of collection for analysis for genotyping.
2.7. MR image acquisition
All subjects underwent a standardized 3 Tesla MRI protocol, which included a T1-weighted three-dimensional MPRAGE sequence (adni.loni.usc.edu/methods/documents/mri-protocols). This standardized protocol was distributed digitally to all ADNI-certified scanners. Before any subject was scanned with this protocol, an ADNI phantom was used to assess linear and nonlinear spatial distortion, signal-to-noise ratio, and image contrast, which was reviewed by a single quality-control center to ensure harmonization among sites.
2.8. Aβ and tau PET acquisition and processing
18F-florbetapir PET scans were obtained, processed, co-registered to structural 3D T1 MPRAGE sequences, and then regionally segmented by the ADNI PET imaging core as described previously.[45] Briefly, 18F-florbetapir standardized uptake value ratios (SUVR) were obtained from a volume-weighted average of the mean uptake from cortical gray matter regions (lateral and medial frontal, anterior and posterior cingulate, lateral parietal, and lateral temporal) normalized to the cerebellum. These SUVRs were downloaded from the ADNI website (http://adni.loni.usc.edu/).
18F-flortaucipir PET scans were acquired as six frames of 5-minute duration approximately 75 minutes after the injection of approximately 10 mCi of radiotracer. Frames were realigned and averaged. The standardized uptake value peak-alignment (SUVP) method, that we developed,[46] was used for tau quantification to address potential variability in off-target binding in the cerebellar cortex reference region. The SUVP was computed voxel-by-voxel by subtracting the mode of the whole brain SUV, then dividing by the standard deviation of the whole brain SUV. Positive SUVP values in the following regions were then averaged and included in the analyses: meta-temporal (MTL) regions (including the amygdala, entorhinal cortex, parahippocampal gyri, fusiform gyri, and inferior/middle temporal gyri), Braak 1 region (entorhinal cortex), Braak 3 regions (parahippocampal gyri, fusiform gyri, lingual gyri, amygdala), Braak 4 regions (middle and inferior temporal gyri, anterior/posterior/isthmus cingulate, insula, and temporal poles), Braak 5 regions (superior/middle frontal gyri, lateral/medial orbitofrontal gyri, frontal poles, pars opercularis/orbitalis/triangularis, superior and inferior parietal lobules, lateral occipital lobes, supramarginal gyri, superior temporal gyri, precuneus, banks of the superior temporal sulcus, transverse temporal gyri), and Braak 6 regions (pericalcarine cortex, pre- and postcentral gyrus, cuneus).[47] Braak 2 was excluded due to potential artifact from off-target binding to choroid plexus.[48]
2.9. Statistical analysis
All statistical analyses were performed in STATA 16 (StataCorp, College Station, TX). Baseline differences across all three groups were assessed using the Kruskal-Wallis or Fisher’s Exact Tests, depending on the variable type (Table 1). Differences between groups (e.g. NC vs. MCI, NC vs. AD) were then assessed using the Wilcoxon Rank Sum or Fisher’s Exact tests. For all regression models, a p-value of less than 0.05 was considered significant. Plots of residuals were assessed for normality, and quantiles of variable transforms were assessed to better fit a normal distribution.
2.10. Statistical analysis investigating sleep variables and beta-amyloid
To assess whether MH-SLEEP or NPI-SLEEP were associated with cerebral Aβ deposition at baseline, we used separate multivariate regression models with 18F-florbetapir SUVR as the dependent variable and each sleep variable as the independent variable, including age, sex, APOE ε4 or ε2 carrier status, and ADAS-Cog score as covariates. Regression models were also run separately for each cohort: NC, Aβ-negative MCI [MCI-Aβ(−)], Aβ-positive MCI [MCI-Aβ(+)], and AD.
A linear mixed-effects model was used to assess the rate of change in Aβ, in relation to sleep variables, while accounting for within-subject variation.[49,50] The mixed-effects model was designed to separate random variations of Aβ across subjects at baseline from the effects of Aβ change over time and effects of sleep variables. To determine whether MH-SLEEP or NPI-SLEEP were associated with longitudinal change in 18F-florbetapir SUVR, we used the linear mixed-effects model: SUVRij = (B0 + β0) + β1 SLEEPi + (β2 + β3 SLEEPi) tij + covariates + εij. SUVRij represents the SUVR of subject i at timepoint j, SLEEPi represents the sleep variable (i.e. MH-SLEEP or NPI-SLEEP) for each subject, and tij represents the time interval between PET scans. (B0 + β0) are the coefficients for the random and fixed variations in baseline SUVR. The coefficient β1 represents the fixed effects of the association between the sleep variable and SUVR at baseline. Finally, (β2 + β3) are the coefficients for time-dependent changes in SUVR, irrespective (β2) and respective (β3) of the sleep variable. The error term εij represents random noise. Age, sex, APOE ε4 or ε2 carrier status, and ADAS-Cog score were included as covariates.
2.11. Statistical analysis investigating sleep variables and tau
Next, we used similar multivariate regression models to assess whether MH-SLEEP or NPI-SLEEP were associated with cortical tau deposition at baseline in individuals who were Aβ positive on PET (SUVR > 1.11),[51] using 18F-flortaucipir SUVP as the dependent variable and each sleep variable as the independent variable. Age, sex, APOE ε4 or ε2 carrier status, and ADAS-Cog score were included as covariates. Regression models were also run separately for each cohort.
A linear mixed-effects model was used to assess whether each sleep variable was associated with longitudinal change in regional 18F-flortaucipir SUVP: SUVPij = (B0 + β0) + β1 SLEEPi + (β2 + β3 SLEEPi) tij + covariates + εij. Post hoc, we also investigated whether medication use (i.e. SSRIs, other antidepressants, antipsychotics, benzodiazepines, zolpidem) altered the relationship between sleep and tau deposition, by including each of these variables as a potential confounding factor. Depression was defined as a Geriatric Depression Scale score greater than or equal to 5.[52]
2.12. Statistical analysis investigating sleep variables and cognition
Finally, we assessed whether MH-SLEEP or NPI-SLEEP were associated with cognition, using the total from the 13-item ADAS-Cog subscale as the dependent variable and each sleep variable as the independent variable. A linear mixed-effects model was used to assess whether each sleep variable associated with longitudinal change in ADAS-Cog: ADAS-Cog Scoreij = (B0 + β0) + β1 SLEEPi + (β2 + β3 SLEEPi) tij + covariates + εij.
3. Results
3.1. Demographics
Baseline characteristics are shown in Table 1. The MCI-Aβ(−) group was younger than the NC, MCI-Aβ(+), and AD groups (p < 0.001). While all three cohorts had more male subjects than female subjects, the ratio did not differ significantly across groups (p=0.21). As expected, the MCI-Aβ(+) and AD groups had a lower proportion of APOE ε2 carriers (p<0.001) and higher proportion of APOE ε4 carriers than the NC group (p<0.001).
In the overall cohort, 94 subjects [25 NC, 31 MCI-Aβ(−), 27 MCI-Aβ(+), 11 AD] had a positive history of MH-SLEEP and 359 [76 NC, 100 MCI-Aβ(−), 141 MCI-Aβ(+), 42 AD] reported abnormal NPI-SLEEP. There was no significant difference in MH-SLEEP among groups (p = 0.37). The MCI-Aβ(+) group had a higher proportion of informant-reported NPI-SLEEP compared to the NC (MCI-Aβ(+) 44.6% vs. NC 27.3%, p < 0.001) and AD (33.1%, p = 0.033) groups. The MCI-Aβ(−) group also had a higher proportion of NPI-SLEEP (41.2%) compared to the NC group (27.3%, p = 0.001).
The MCI-Aβ(−), MCI-Aβ(+) and AD groups had significantly higher ADAS-Cog scores at baseline, demonstrating more impairment than the NC group (p < 0.001). The MCI-Aβ(−) group had a higher proportion of subjects with a Geriatric Depression Scale score greater than or equal to 5 compared to the NC group (9.1% vs. 3.6%, p = 0.011). The NC group had a lower proportion of subjects reporting OSA (4.3%), compared to the MCI-Aβ(−) (18.1%, p < 0.001), MCI-Aβ(+) (11.1%, p = 0.002) and AD (11.8%, p = 0.009) groups. The proportion of patients with OSA who received CPAP as treatment did not differ significantly across all groups (p=0.19).
Across all groups, there was no significant difference in the proportion of subjects reporting short- or long-term use of a non-SSRI antidepressant, antipsychotic, or benzodiazepine. Long-term use of melatonin was not significantly different across groups (p = 0.37). Short-term use of melatonin was higher in the MCI-Aβ(+) group than the AD group (4.7 vs. 0.8%, p = 0.048). Short- and long-term use of SSRIs were lower in the NC cohort (respectively, 5.4%, 8.6%) compared to the MCI-Aβ(−) (respectively, 10.3%, p = 0.047; 14.8%, p = 0.038), MCI-Aβ(+) (respectively, 12.7%, p = 0.003; 18.4%, p = 0.001), and AD (respectively, 18.1%, p < 0.001; 18.1%, p = 0.007) groups. Short- and long-term zolpidem use did not differ between cohorts (respectively, p = 0.64, p = 0.09).
3.2. Medical history of impaired sleep, abnormal nighttime behaviors, and history of obstructive sleep apnea were not associated with beta-amyloid deposition at baseline.
At baseline, MH-SLEEP (β = −0.0012, p = 0.96) and NPI-SLEEP (β = −0.0075, p = 0.57) were not associated with Aβ deposition on PET, adjusted for age, sex, APOE ε2 or ε4 carrier status, and degree of cognitive impairment (Table 2, Figure 1). A medical history of OSA (β = −0.023, p = 0.26) and CPAP use (β = 0.032, p = 0.43) were also not associated with Aβ deposition on PET. These associations remained nonsignificant when analyzing each group separately (NC, MCI-Aβ(−), MCI-Aβ(+), and AD: all p>0.05).
Table 2.
Regression coefficients demonstrating the associations between beta-amyloid deposition on 18F-florbetapir PET SUVR and sleep variables.
| Regression: Florbetapir PET SUVR ~ medical history of sleeping difficulties + covariates | ||
|---|---|---|
| Regression Coefficient [95% CI] | p-value | |
| Medical history of sleeping difficulties | −0.0012 [−0.043, 0.041] | 0.96 |
| Age, years | 0.0033 [0.0015, 0.0051] | <0.001 |
| Male | −0.031 [−0.056, −0.0051] | 0.017 |
| APOE e2 allele | −0.053 [−0.10, −0.0052] | 0.03 |
| APOE e4 allele | 0.15 [0.12, 0.17] | <0.001 |
| Baseline Alzheimer’s Disease Assessment Scale, 13-item cognitive subscale | 0.0079 [0.0067, 0.0092] | <0.001 |
| Regression: Florbetapir PET SUVR ~ abnormal nighttime behavior on NPIQ + covariates | ||
| Regression Coefficient [95% CI] | p-value | |
| Abnormal nighttime behavior on the Neuropsychiatric Inventory Questionnaire | −0.0075 [−0.033, 0.018] | 0.57 |
| Age, years | 0.0033 [0.0015, 0.0051] | <0.001 |
| Male | −0.030 [−0.056, −0.0053] | 0.017 |
| APOE e2 allele | −0.054 [−0.10, −0.0061] | 0.027 |
| APOE e4 allele | 0.15 [0.12, 0.17] | <0.001 |
| Baseline Alzheimer’s Disease Assessment Scale, 13-item cognitive subscale | 0.0080 [0.0067, 0.0092] | <0.001 |
CI = confidence interval
Figure 1.
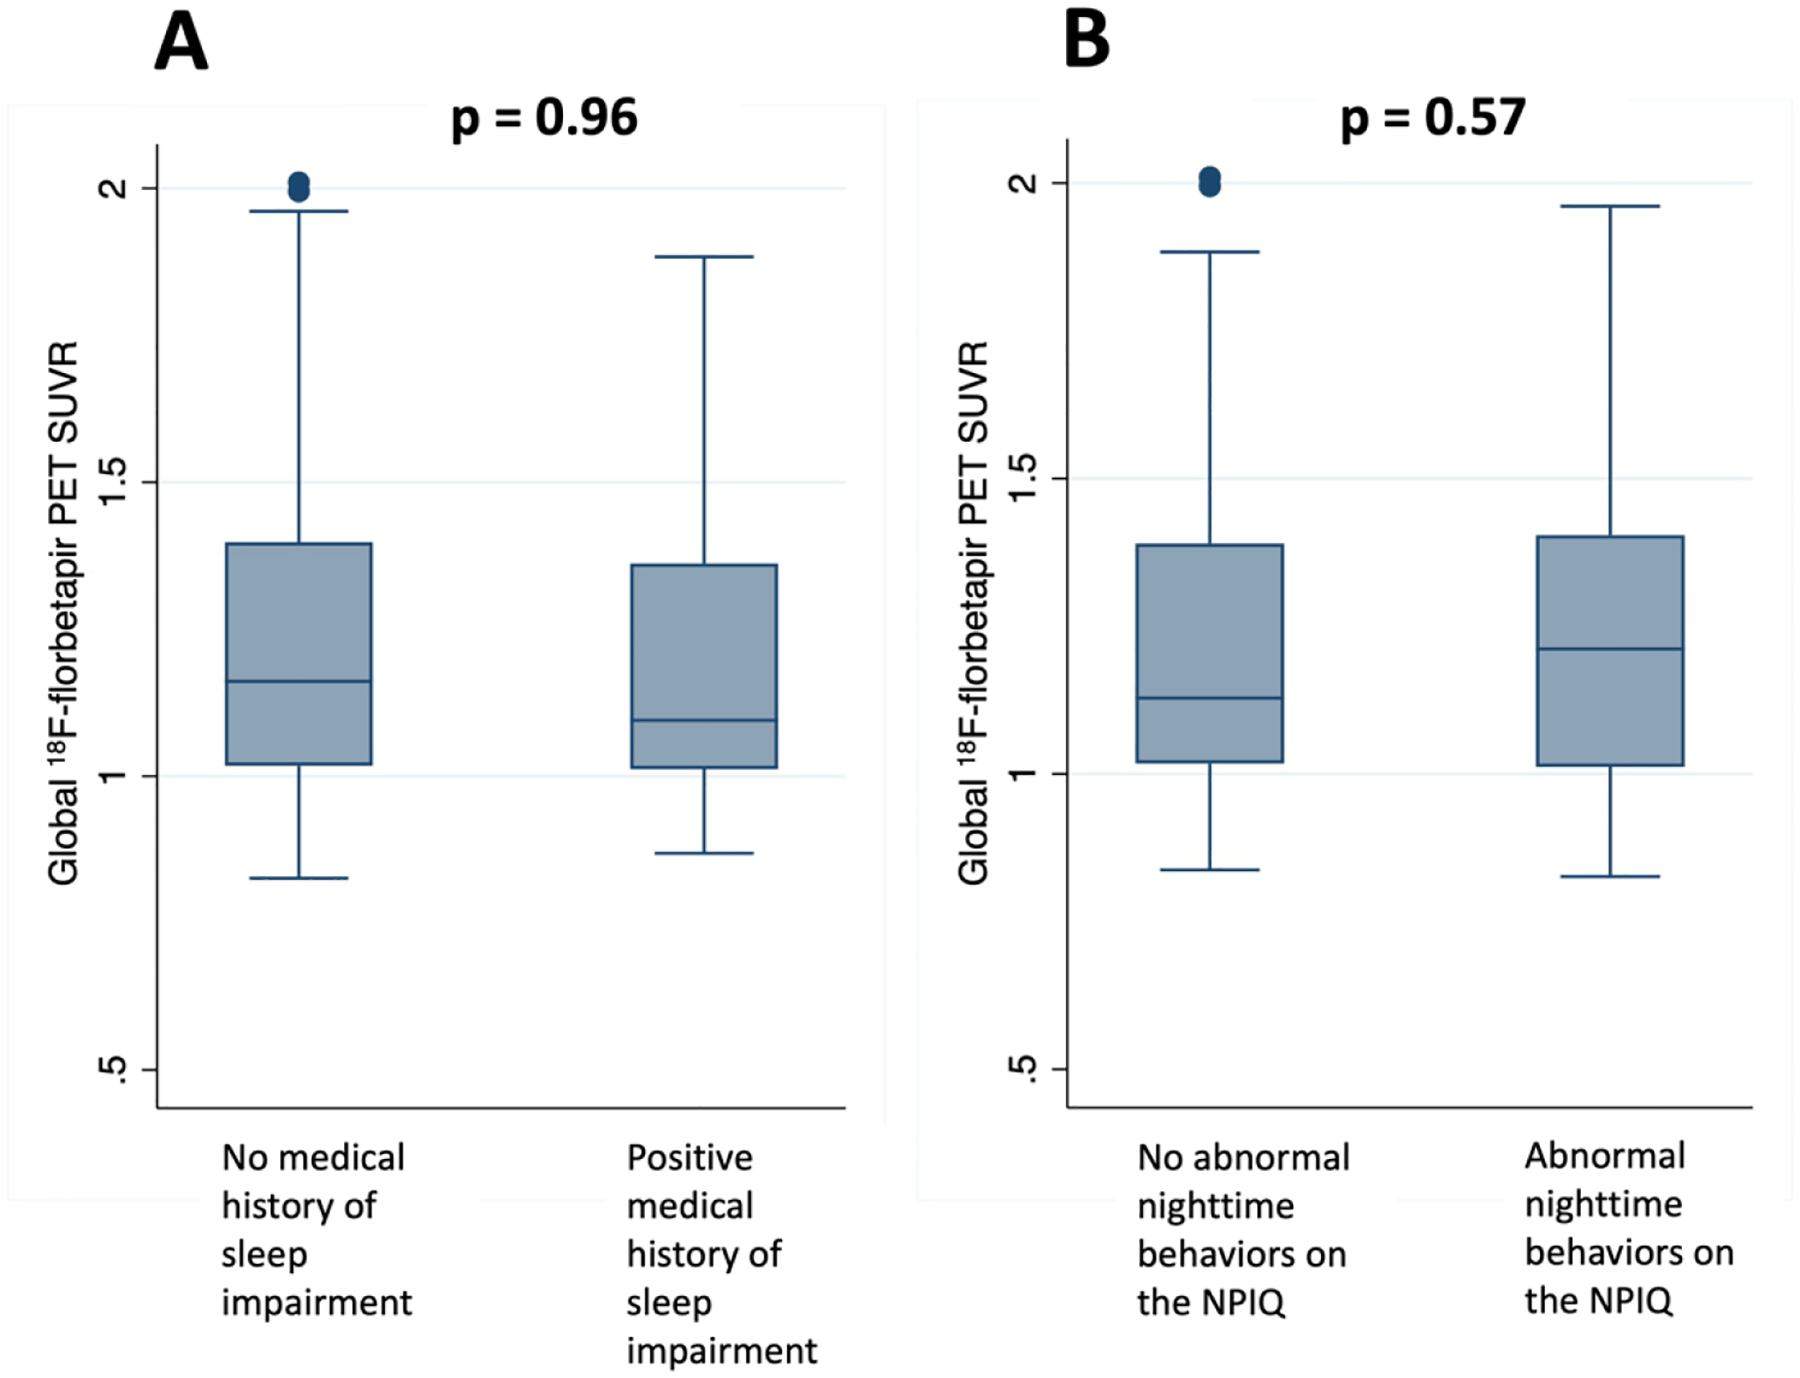
Boxplots showing no difference in global 18F-florbetapir PET SUVR among individuals with or without a medical history of sleep impairment (A), or with or without reported abnormal nighttime behaviors on the NPIQ (B) (p > 0.05).
3.3. Medical history of sleep impairment and abnormal nighttime behaviors were associated with greater tau deposition on PET at baseline.
Across the entire cohort, MH-SLEEP was associated with greater tau deposition on PET in the MTL (β = 0.29, p = 0.04), Braak 1 (β = 0.54, p < 0.001), and Braak 4 regions (β = 0.23, p = 0.025) (Table 3, Figure 2). Separated by group, MH-SLEEP was associated with greater tau in the MTL (β = 0.68, p = 0.035) and Braak 4 regions (β = 0.51, p = 0.017) in the NC group and greater tau in the Braak 1 region in the MCI-Aβ(+) group (β = 0.49, p = 0.003). Of note, although NC with a positive history of MH-SLEEP had greater tau deposition than those without, the level of tau deposition was still below the usual threshold for tau positivity[53] in the Braak 4 region (NC/MH-SLEEP+ mean SUVP 1.02 [range 0.80–1.25] vs. NC/MH-SLEEP− mean SUVP 0.53 [range 0.19–1.24]). The level of tau deposition in the MTL did approach tau positivity thresholds (NC/MH-SLEEP+ mean SUVP 1.29 [range 1.03–1.55] vs. NC/MH-SLEEP− mean SUVP 0.65 [range 0.20–1.77]). Furthermore, the mean level of tau deposition in the Braak 1 region in the MCI/MH-SLEEP+ group did cross tau positivity threshold (MCI/MH-SLEEP+ mean SUVP 1.58 [range 0.88–2.54] vs. MCI/MH-SLEEP− mean SUVP 0.95 [range 0.023–2.16]).
Table 3.
Regression coefficients demonstrating the associations between tau deposition on 18F-flortaucipir PET and sleep variables.
| Regression Coefficient [95% CI] | ||||||
|---|---|---|---|---|---|---|
| p-value | ||||||
| Meta temporal lobe region | Braak 1 region | Braak 3 regions | Braak 4 regions | Braak 5 regions | Braak 6 regions | |
| Medical history of sleeping difficulties | 0.29 [0.13, 0.56] 0.04* |
0.54 [0.28, 0.80] <0.001* |
0.19 [−0.052, 0.43] 0.12 |
0.23 [0.030, 0.44] 0.025* |
−0.010 [−0.16, 0.14] 0.90 |
0.088 [−0.023, 0.20] 0.12 |
| Abnormal nighttime behavior on the Neuropsychiatric Inventory Questionnaire | 0.09 [−0.096, 0.28] 0.33 |
0.21 [0.029, 0.40] 0.024* |
0.14 [−0.024, 0.29] 0.095 |
0.042 [−0.099, 0.18] 0.55 |
0.068 [−0.034, 0.17] 0.19 |
−0.0082 [−0.084, 0.067] 0.83 |
p < 0.05
All models were adjusted by age, sex, APOE2 carrier status, APOE4 carrier status, baseline score on the Alzheimer’s Disease Assessment Scale (13-item cognitive subscale)
Figure 2.
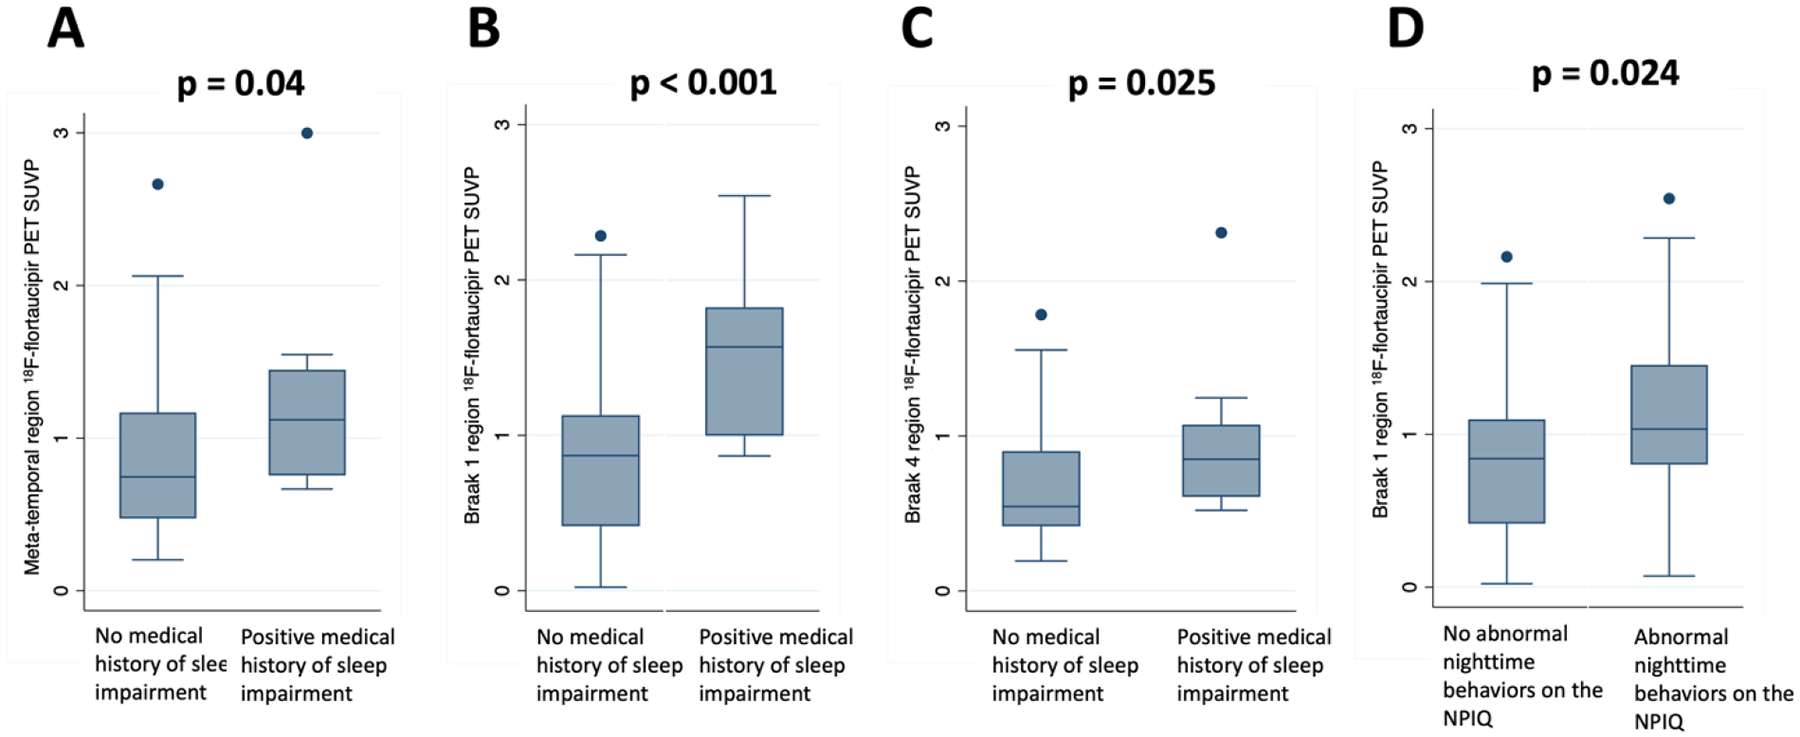
Boxplots showing higher tau deposition on 18F-flortaucipir PET among individuals with a medical history of sleep impairment (A–C) or reported abnormal nighttime behaviors on the NPIQ (D).
NPI-SLEEP was also associated with greater tau deposition on PET in the Braak 1 region (β = 0.21, p = 0.024). In separate group analyses, this held true in the MCI-Aβ(+) group (β = 0.31, p = 0.008). A medical history of OSA was not associated with tau deposition on PET at baseline.
3.4. Longitudinal analyses showed slower rates of Aβ accumulation in cognitive normal individuals with a medical history of sleep impairment and OSA, but faster Aβ accumulation in individuals with AD and OSA
MH-SLEEP and NPI-SLEEP were not associated with longitudinal change in Aβ across the entire cohort (Table 4). When analyzed separately by group, NPI-SLEEP remained not significantly associated with longitudinal change in Aβ in the NC, MCI-Aβ(−), MCI-Aβ(+), and AD groups (p>0.05).
Table 4.
Regression coefficients demonstrating the associations between sleep variables and longitudinal accumulation of beta-amyloid or tau deposition over time.
| Longitudinal change in: | Predictor | Regression coefficient [95% CI] | P-value |
|---|---|---|---|
| 18F-florbetapir PET global SUVR | MH-SLEEP*time | 0.0043 [0.0026, 0.0061] | 0.47 |
| NPI-SLEEP*time | 0.0051 [0.0041, 0.0060] | 0.72 | |
| 18F-flortaucipir PET SUVP (meta-temporal regions) | MH-SLEEP*time | −0.087 [−0.23, 0.055] | 0.23 |
| NPI-SLEEP*time | 0.026 [−0.031, 0.083] | 0.38 | |
| 18F-flortaucipir PET SUVP (Braak 1 region) | MH-SLEEP*time | −0.19 [−0.37, 0.0052] | 0.054 |
| NPI-SLEEP*time | 0.023 [−0.054, 0.10] | 0.56 | |
| 18F-flortaucipir PET SUVP (Braak 3 regions) | MH-SLEEP*time | −0.037 [−0.16, 0.084] | 0.55 |
| NPI-SLEEP*time | 0.041 [−0.0069, 0.088] | 0.094 | |
| 18F-flortaucipir PET SUVP (Braak 4 regions) | MH-SLEEP*time | −0.048 [−0.15, 0.059] | 0.38 |
| NPI-SLEEP*time | 0.016 [−0.027, 0.059] | 0.46 | |
| 18F-flortaucipir PET SUVP (Braak 5 regions) | MH-SLEEP*time | −0.071 [−0.15, 0.012] | 0.094 |
| NPI-SLEEP*time | 0.023 [−0.010, 0.057] | 0.17 | |
| 18F-flortaucipir PET SUVP (Braak 6 regions) | MH-SLEEP*time | −0.034 [−0.12, 0.054] | 0.45 |
| NPI-SLEEP*time | 0.014 [−0.020, 0.050] | 0.41 | |
| Alzheimer’s Disease Assessment Scale (13-item cognitive subscale) | MH-SLEEP*time | −0.0051 [−0.36, 0.35] | 0.98 |
| NPI-SLEEP*time | 0.44 [0.21, 0.66] | <0.001 |
CI = confidence interval
MH-SLEEP = medical history of sleep impairment
NPI-SLEEP = abnormal nighttime behavior on the Neuropsychiatric Inventory Questionnaire
SUVR = standardized uptake value ratio
SUVP = standardized uptake value peak alignment
Values shown are regression coefficients [95% CI]. Regression models that included florbetapir and flortaucipir PET SUVRs as outcome variables included age, sex, baseline score on the Alzheimer’s Disease Assessment Scale Cognitive Subscale (ADAS-Cog), and APOE ε2 and ε4 carrier status as covariates. Regression models that included ADAS-Cog as the outcome variable included age, sex, and APOE ε2 and ε4 carrier status as covariates.
MH-SLEEP was associated with a slower rate of Aβ accumulation in the NC group (p=0.007), such that the rate of accumulation of Aβ was 0.0010 +/− 0.0014 (95% CI: −0.0018, 0.0038) SUVR per year in the NC with a positive MH-SLEEP and 0.0050 +/− 0.00044 (95% CI: 0.0041, 0.0059) SUVR per year in the NC without a positive MH-SLEEP.
A medical history of OSA was associated with slower accumulation of Aβ (β = −0.0034, p < 0.001) in the overall group, such that the rate of accumulation of Aβ was 0.0019 +/− 0.00082 (95% CI: 0.00028, 0.0035) SUVR per year for people with a history of OSA and 0.0053 +/− 0.00030 (95% CI: 0.0047, 0.0059) SUVR per year for people without. In subgroup analysis, a medical history of OSA was associated with slower accumulation of Aβ in the NC group (β = −0.0079, p<0.001), such that people with OSA had a rate of accumulation of −0.0026 +/− 0.0015 (95% CI: −0.0056, 0.00029) SUVR per year, compared to 0.0053 +/− 0.00054 (95% CI: 0.0044, 0.0061) without. Notably, a medical history of OSA was associated with faster accumulation of Aβ in the AD group (β = 0.025, p = 0.006), such that people with AD and OSA had a rate of accumulation of 0.032 +/− 0.0088 (95% CI: 0.014, 0.049) SUVR per year, compared to 0.0068 +/− 0.0024 (95% CI: 0.0021, 0.012) without.
3.5. Longitudinal analyses showed slower rates of tau accumulation in cognitive normal individuals with a medical history of sleep impairment
MH-SLEEP and NPI-SLEEP were not associated with longitudinal change in tau (p > 0.05) [Table 4]. Similarly, a medical history of OSA was not associated with change in tau (p>0.05). Analyzed separately by group, NPI-SLEEP and medical history of OSA remained not associated with longitudinal change in tau (p>0.05).
Interestingly, in the NC group, MH-SLEEP was associated with a slower rate of tau accumulation in the MTL (β=−0.19, p=0.005), Braak 1 (β=−0.31, p<0.001), Braak 4 (β=−0.11, p=0.03), and Braak 5 (β=−0.11, p=0.002) regions. NC subjects with a history of MH-SLEEP accumulated tau at a rate of −0.19 +/− 0.068 (95% CI: −0.32, −0.055) SUVP per year in the MTL, −0.30 +/− 0.083 (95% CI: −0.46, −0.13) SUVP per year in Braak 1, −0.097 +/− 0.051 (95% CI: −0.20, 0.0026) SUVP in the Braak 4 regions, and −0.099 +/− 0.034 (95% CI: −0.16, −0.033) SUVP in the Braak 5 regions, compared to 0.014 +/− 0.013 (95% CI: −0.010, 0.039) SUVP per year in the MTL, 0.015 +/− 0.016 (95% CI: −0.016, 0.046) SUVP per year in the Braak 1, 0.013 +/− 0.0095 (95% CI: −0.0055, 0.032) SUVP in the Braak 4 regions, and 0.0086 +/− 0.0063 (95% CI: 0.0037, 0.021) SUVP in the Braak 5 regions in NC subjects without a history of MH-SLEEP.
3.6. Sleep-affecting medications did not moderate the relationship between medical history of impaired sleep or obstructive sleep apnea and longitudinal change in beta-amyloid
MH-SLEEP remained associated with a slower rate of Aβ accumulation in the NC group, even after adjusting for the use of SSRIs, non-SSRI antidepressants, antipsychotics, benzodiazepines, zolpidem, and melatonin (p<0.05).
A medical history of OSA remained associated with a slower rate of Aβ accumulation in the NC group, even after adjusting for the use of SSRIs, non-SSRI antidepressants, antipsychotics, benzodiazepines, zolpidem, and melatonin (p<0.05).
In subgroup analysis, a medical history of OSA remained associated with slower accumulation of Aβ in the NC group, even after adjusting for the use of SSRIs, non-SSRI antidepressants, antipsychotics, benzodiazepines, zolpidem, and melatonin (p<0.05). Similarly, a medical history of OSA remained associated with faster accumulation of Aβ in the AD group, even after adjusting for medication use, as above (p<0.05).
3.7. Medications that affect sleep moderate the relationship between abnormal nighttime behaviors and tau pathology
The association between MH-SLEEP and tau deposition persisted in the Braak 1 region, even when adjusting for use of SSRIs, non-SSRI antidepressants, antipsychotics, benzodiazepines, zolpidem, and melatonin (p < 0.05). However, including short-term use of SSRIs as a covariate slightly weakened the relationship between MH-SLEEP and tau in the MTL (β = 0.26, p = 0.08) and Braak 4 regions (β = 0.20, p = 0.06). Including short-term use of benzodiazepines as a covariate also slightly weakened the relationship between MH-SLEEP and tau in the MTL (β = 0.25, p = 0.08).
The association between NPI-SLEEP and tau in the Braak 1 region was weakened when including short-term use of SSRIs as a covariate (β = 0.16, p = 0.08).
3.8. Cognitive changes associated with sleep impairment
At baseline, NPI-SLEEP was associated with more cognitive impairment (β = 1.41, p = 0.007). MH-SLEEP was not associated with baseline cognitive impairment.
Longitudinally, NPI-SLEEP was associated with faster increase in cognitive impairment (β = 0.44, p < 0.001), such that an individual without NPI-SLEEP increases 0.59 points on average per year on the ADAS-Cog over the follow-up period versus a 1.03-point increase in an individual with abnormal NPI-SLEEP.
4. Discussion
The major findings of our study were: 1) MH-SLEEP and NPI-SLEEP were associated with baseline higher tau deposition on PET; 2) short-term SSRI and benzodiazepine use weakened some of the relationships between MH-SLEEP or NPI-SLEEP and tau; 3) MH-SLEEP and NPI-SLEEP were not associated with baseline differences in Aβ deposition on PET; 4) MH-SLEEP and medical history of OSA were associated with slower longitudinal accumulation of Aβ in the NC group, but OSA was associated with faster longitudinal accumulation of Aβ in the AD group; and 5) NPI-SLEEP was associated with both more baseline and faster increase in cognitive impairment.
4.1. Sleep impairment and baseline tau deposition on PET
Our first major finding was that a medical history of impaired sleep and having abnormal nighttime behaviors reported on the NPIQ were related to higher baseline tau deposition in Braak regions 1 and 4 and in the MTL. This finding is consistent with prior studies linking sleep deprivation and abnormalities to higher levels of CSF tau in both humans and mice.[10,54,55] Our results also confirm two recent studies that have linked sleep disturbance with regional tau on PET. Yoon et al. reported a relationship between tau and total sleep time, cross-sectionally and longitudinally.[56] Our analyses build upon these findings with a larger sample from the multicenter ADNI cohort, as well as using medical histories and the NPIQ to identify sleep impairment. We also extend the findings of Shokouhi et al. with a larger sample size and longitudinal analyses, assessing the differential effects of our two different sleep variables.[34]
There are several potential mechanisms to explain the underlying pathophysiology linking sleep and tau, which could be bidirectional. For instance, insufficient or impaired sleep could lead to neuronal injury and higher tau levels.[57] It has been shown that acute and chronic sleep loss leads to activated astroglia and microglia, respectively,[58] suggestive of underlying neuroinflammation that is often associated with neuronal damage. However, levels of neurofilament light chain (NfL)—a nonspecific marker of neuronal damage—have not been shown to increase with sleep loss, suggesting that higher tau levels may be due to increased tau secretion, rather than neuronal injury.[10,57] An elevation in excitatory neuronal activity and synaptic strength—due to prolonged wakefulness from insufficient sleep—could explain increased extracellular release of tau.[10] Regulation of tau hyperphosphorylation may also be driven by changes in sleep patterns: chronic sleep deprivation in mice has been shown to increase tau hyperphosphorylation through epigenetic enhancement of cyclin-dependent kinase 5 (CDK5), a tau kinase.[59]
Conversely, the presence of tau could cause sleep abnormalities: as such, sleep could be a symptom of underlying AD pathology, with increased risk of subsequent cognitive impairment. Specifically, higher tau deposition, as quantified on 18F-flortaucipir PET, could reflect more tau pathology in the sleep centers of the brain, such as in the hypothalamus, brainstem, and forebrain, as these are small regions that are below the resolution of PET. The presence of tau in the MTL, for instance, could disrupt the normal effects of slow wave sleep oscillations on enhancing hippocampal memory consolidation.[60,61]
4.2. Short-term SSRI and benzodiazepine use
A few papers investigating AD and sleep have considered sleep aids in their analyses, as a dichotomous covariate, rather than the different classes of medications that can affect sleep, as in our analyses. For example, Kim et al. included sedative/hypnotic use as a covariate, but didn’t find it to be a confounder;[62] Yoon et al. reported baseline consumption of sleep aids by cognitive subgroup, but did not find a significant difference;[56] and Andrews et al. likewise reported sleep aid use based on the Pittsburg Sleep Quality Index (PSQI) questionnaire, but did not find significant interactions with amyloid.[63] Our findings build upon these studies with a systemic evaluation of multiple classes of sleep-affecting medications in both our baseline and longitudinal analyses in an effort to isolate the varying effects of individual medication classes.
After such analyses, we found that short-term SSRI and benzodiazepine use weakened some of the relationships between sleep impairment and tau deposition. While the expected effect of benzodiazepines on tau has not been established in existing literature,[25–30] we expected to find a protective effect of SSRIs on AD pathology, since studies have shown that SSRIs can reduce Aβ,[19,20] tau,[19] and Aβ-induced tau hyperphosphorylation.[22] Instead, our results suggest that consumption of SSRIs or benzodiazepines may serve as confounding variables. A potential explanation is that having a positive MH-SLEEP or abnormal score on the NPI-SLEEP may reflect early behavioral changes, due to tau deposition in the hypothalamus. As such, the recent use of an SSRI or benzodiazepine could be a sign of underlying AD pathology. Recent literature has suggested that mild behavioral impairment could be a sign of underlying AD, sometimes appearing even earlier than many typical symptoms.[64–66] It is also possible that short-term benzodiazepine use may in fact enhance tau hyperphosphorylation mediating AD progression, potentially through altered GABAergic signaling.[25–27] Besides SSRIs and benzodiazepines, use of other classes of sleep medications—non-SSRI antidepressants, antipsychotics, melatonin, and zolpidem—were not found to have significant moderating effects.
4.3. Sleep impairment and baseline beta-amyloid deposition on PET
Our third finding was that impaired sleep was not associated with baseline differences in cerebral Aβ deposition. This was an unexpected finding, since some studies using other patient cohorts have found an association between sleep disturbances and increased Aβ.[67–72] For example, one study analyzing sleep problems reported on the Medical Outcomes Study Sleep Scale found increased Aβ deposition in the frontal cortex, cingulate gyrus, angular gyrus, and precuneus.[72] Similarly, both orexin inhibition and knockout in mice—leading to more sleep and less wakefulness—have been shown to decrease Aβ pathology.[68,70]
On the other hand, other studies have either found no relationship between sleep and Aβ[54] or found a greater association with tau than Aβ.[7] By also including Aβ(−) individuals in our analyses, we build upon the results reported by Yoon et al., which found no relationship between Aβ and total sleep time in Aβ(+) individuals.[56] We divided our analyses into Aβ(+) and Aβ(−) MCI cohorts to isolate the effects of Aβ: such regressions revealed no relationship between sleep impairment and Aβ at baseline.
The lack of a relationship between sleep impairment and Aβ is at odds with glymphatic clearance as a mechanism for accumulation of toxic proteinopathies. If glymphatic clearance were impaired due to lack of sleep, one would expect both Aβ and tau to accumulate. A possible explanation for our tau-specific findings is that changes to sleep architecture may be initiated by tau in sleep centers of the brain before Aβ. This framework has been confirmed by several studies, showing that, in AD, tauopathy in neurons that promote wakefulness may occur before Aβ, which suggests a tau-driven process.[73] It is also possible that our subjective sleep variables (chart review of medical history, informant report) did not capture sleep disturbance adequately, masking detectable Aβ effects. Lastly, our ADNI subjects may not have had severe enough sleep impairment, since ADNI subjects were screened to have fewer comorbidities than the general population.[74]
4.4. Sleep impairment, longitudinal beta-amyloid accumulation, and obstructive sleep apnea
Fourth, we found that sleep impairment and OSA may have stage-specific effects on AD pathology. Specifically, we found slower rates of longitudinal Aβ accumulation in NC subjects with a medical history of impaired sleep or OSA, but faster rates of Aβ accumulation in AD subjects with OSA. Several papers have suggested that OSA is a risk factor for AD,[75–78] and OSA has been frequently associated with increased Aβ and tau.[79–81] OSA exposes the brain to a chronic hypoxemic and hypercarbic state, which may lead to greater amyloid deposition and tauopathy, via regulation of amyloid processing enzymes or tau kinases.[82,83] In addition, OSA may drive AD progression due to REM and SWS fragmentation, during which increased neuronal hyperactivity may lead to heightened Aβ and tau release.[75,84,85]
The stage-specific effects of OSA may play a role in cognitive impairment or accelerated Aβ deposition only at higher baseline Aβ levels or later-stage progression of disease, when there is a greater hypoxic burden or neurovascular changes.[86] This is in line with a recent major study by Bubu et al., which reported stronger longitudinal effects of OSA on AD progression in Aβ(+) subjects, compared to Aβ(−) subjects.[75] In our study, the use of each subject’s medical history to screen for OSA also would not have captured undiagnosed OSA, a common phenomenon.[87] Finally, a high proportion of ADNI subjects were white, highly educated, and healthier than typical OSA or sleep-impaired individuals in the community, since those with significant comorbid cardiovascular conditions were screened out,[74] so the slower rates of Aβ and tau in the NC group may reflect better access to care.
4.5. Sleep impairment and cognitive decline
Lastly, we found that NPI-SLEEP was associated with greater baseline cognitive impairment and a faster decline in cognition. These relationships are consistent with previous studies linking sleep disturbance to cognitive decline.[88–90] The relationship between NPI-SLEEP and more rapid cognitive decline longitudinally suggests that NPI-SLEEP may be an early behavioral symptom of AD, such that these subjects have greater tau and risk for subsequent cognitive decline.
Beyond tau, there are several additional mechanisms that could link impaired sleep with faster cognitive decline. For instance, prolonged periods of wakefulness and cognitive arousal, due to impaired sleep, may heighten the hypothalamic-pituitary-adrenal stress axis, contributing to cognitive impairment via reduction in BDNF, an essential neurotrophin for synaptic plasticity and memory consolidation.[14,91] Mouse models of AD have shown enhanced astroglial phagocytosis secondary to chronic sleep deprivation, through upregulation of the MERTK receptor pathway,[58] which can lead to inflammation and neuronal injury.[92] Similarly, in humans, subjective sleep impairment has been linked to biomarkers for astroglial activation and neuroinflammation, such as chitinase-3-like protein 1.[55] Lastly, sleep impairment may lead to cognitive decline via hippocampal oxidative stress and inhibited hippocampal neurogenesis: in animal models, sleep deprivation reduces neurogenesis in the dentate gyrus of the hippocampus.[92–94]
While both MH-SLEEP and NPI-SLEEP were associated with tau, only NPI-SLEEP was associated with cognitive impairment. A possible explanation for this is that our MH-SLEEP variable was more heterogeneous and subjective, since it was based on notations in the medical history, whereas our NPI-SLEEP variable may have been more specific for AD-related cognitive decline. Indeed, several studies have implicated positive symptoms on the NPIQ as early indicators of AD.[95–97]
4.6. Clinical relevance
Our results have several implications for clinical practice. Our finding that MH-SLEEP was associated with greater tau in the NC and MCI-Aβ(+) cohorts identifies a high-risk group that could benefit from sleep-targeting interventions for the purpose of delaying cognitive decline and the development of frank AD. Similarly, our NPI-SLEEP cohort showed faster cognitive decline longitudinally. This finding again presents an opportunity for intervention, as identification of abnormal nighttime behaviors on the NPIQ could identify individuals who could benefit from disease-modifying therapy, and it supports a growing number of studies linking sleep disturbance on the NPIQ with faster rate of cognitive decline.[36,98]
Thus, MH-SLEEP and NP-SLEEP could be used to screen for high-risk individuals who could benefit from therapies that improve these sleep parameters, thereby possibly slowing cognitive decline. For instance, suvorexant, which belongs to a new class of medications used to treat insomnia, dual orexin receptor antagonists, was recently found to be associated with decreased tau hyperphosphorylation and reduced Aβ levels in cognitively normal individuals, and thus might be a relevant pharmacological intervention in the context of AD.[99] Importantly, although sleep disorders have been associated with AD, our findings show that the effects appear to occur via tau, not Aβ, accumulation. As such, novel anti-amyloid therapies such as lecanemab may not modify the tau-related pathways by which sleep impairment affects AD pathogenesis.
5. Limitations
There are several limitations to our study. The nature of our retrospective analysis prevents us from determining the directionality of the relationships between sleep impairment, Aβ, tau, and cognitive impairment. Our assessment of insomnia was based on medical history and sleep questionnaires, rather than physiological measures of sleep alterations like actigraphy, and thus we cannot interrogate the effects of objective sleep biomarkers or architecture on AD pathology. Our sample size of patients who consumed the medications of interest were also relatively small, limiting power in specific medication subgroup analyses. Lastly, the ADNI cohort is not fully representative of a community population, with overrepresentation of white, highly educated individuals with fewer comorbidities.[74]
6. Conclusions
Nevertheless, we found evidence for an association between sleep impairment—as indicated by a review of the medical history or the NPIQ—and tau deposition on PET. Impaired sleep, particularly on the NPIQ, was also associated with cognitive impairment, both at baseline and longitudinally. Our findings suggest that these two measures of sleep impairment could be used in a clinical setting to identify candidates at higher AD risk, who may benefit from sleep-modifying interventions. Notably, besides short-term SSRI and benzodiazepine use, we did not find concomitant sleep-affecting medication usage to be a significant confounder. Next steps would include prospective studies that investigate longitudinal trajectories of sleep quality and duration, as they relate to development and progression of AD. Further research which assesses regional tau deposition on PET and cognitive changes with improved sleep, using objective measures like actigraphy, is warranted.
Supplementary Material
Figure 3.

Coronal T1-weighted MR (A) and 18F-flortaucipir PET (B) images from a 75 year-old subject with a medical history of insomnia and periodic limb movements during sleep. She had a clinical diagnosis of mild cognitive impairment and used sertraline, a selective serotonin reuptake inhibitor. Her MRI shows mild hippocampal atrophy, more notably on the right. Tau PET images showed greatest cortical tau deposition in the temporal and parietal lobes
Highlights.
Impaired sleep is associated with greater tauopathy on PET.
Impaired sleep is not associated with baseline beta-amyloid deposition on PET.
Impaired sleep is associated with accelerated cognitive decline.
Short-term use of selective serotonin reuptake inhibitors and benzodiazepines slightly weakened the sleep-tau relationship.
Acknowledgements:
The authors thank Ke Xi, Weill Cornell Medicine biostatistician, for reviewing the statistical analyses and for her helpful suggestions.
Funding
Research reported in this publication was supported in part by the following grants: National Institutes of Health/National Institute on Aging R01 AG068398 (G.C.), R56 AG058913 (M.deL.), RF1 AG057570 (M.deL.), and R01 AG057848 (Y.L.).
Data collection and sharing for this project were funded by ADNI (National Institutes of Health Grant U01 AG024904) and DOD ADNI (Department of Defense award number W81XWH-12-2-0012). ADNI is funded by the National Institute on Aging, the National Institute of Biomedical Imaging and Bioengineering, and generous contributions from the following: AbbVie, Alzheimer’s Association; Alzheimer’s Drug Discovery Foundation; Araclon Biotech; BioClinica, Inc.; Biogen; Bristol-Myers Squibb Company; CereSpir, Inc.; Cogstate; Eisai Inc.; Elan Pharmaceuticals, Inc.; Eli Lilly and Company; EuroImmun; F. Hoffmann-La Roche Ltd and its affiliated company Genentech, Inc.; Fujirebio; GE Healthcare; IXICO Ltd.; Janssen Alzheimer Immunotherapy Research & Development, LLC.; Johnson & Johnson Pharmaceutical Research & Development LLC.; Lumosity; Lundbeck; Merck & Co., Inc.; Meso Scale Diagnostics, LLC.; NeuroRx Research; Neurotrack Technologies; Novartis Pharmaceuticals Corporation; Pfizer Inc.; Piramal Imaging; Servier; Takeda Pharmaceutical Company; and Transition Therapeutics. The Canadian Institutes of Health Research is providing funds to support ADNI clinical sites in Canada. Private sector contributions are facilitated by the Foundation for the National Institutes of Health. The grantee organization is the Northern California Institute for Research and Education, and the study is coordinated by the Alzheimer’s Therapeutic Research Institute at the University of Southern California. ADNI data are disseminated by the Laboratory for Neuro Imaging at the University of Southern California. Data used in the preparation of this article were obtained from the Alzheimer’s Disease Neuroimaging Initiative (ADNI) database (adni.loni.usc.edu). As such, although the investigators for ADNI contributed to the design and implementation of our study through their work for ADNI and/or provided data, they did not participate in the analysis or writing of this report. Alzheimer’s Disease Neuroimaging Initiative: A complete listing of ADNI investigators can be found at: http://adni.loni.usc.edu/wp-content/uploads/how_to_apply/ADNI_Acknowledgement_List.pdf
List of abbreviations:
- AD
Alzheimer’s disease
- ADAS-Cog
Alzheimer’s Disease Assessment Scale Cognitive Subscale
- ADNI
Alzheimer’s Disease Neuroimaging Initiative
- Aβ
beta-amyloid
- CPAP
continuous positive airway pressure
- HPA
hypothalamic-pituitary-adrenal
- MCI
mild cognitive impairment
- MH-SLEEP
documentation of sleep impairment in the subject’s medical history
- NC
normal cognition
- NPI-SLEEP
abnormal nighttime behaviors on the NPIQ
- NPIQ
Neuropsychiatric Inventory Questionnaire
- OSA
obstructive sleep apnea
- SSRI
selective serotonin reuptake inhibitor
- SUVP
standardized uptake value peak-alignment
- SUVR
standardized uptake value ratio
Footnotes
Publisher's Disclaimer: This is a PDF file of an unedited manuscript that has been accepted for publication. As a service to our customers we are providing this early version of the manuscript. The manuscript will undergo copyediting, typesetting, and review of the resulting proof before it is published in its final form. Please note that during the production process errors may be discovered which could affect the content, and all legal disclaimers that apply to the journal pertain.
Ethics approval and consent to participate: Subject data was obtained from the publicly available ADNI database. Informed written consent to participate in ADNI was obtained from all participants at each site.
Competing interests: G.C. previously served on the Biogen Medical Advisory Board and received an honorarium. G.C. currently serves as a consultant for Life Molecular Imaging, providing education on the interpretation of amyloid PET scans and receives compensation.
Availability of data and materials:
Data used in the preparation of this article are publicly available and were obtained from the Alzheimer’s Disease Neuroimaging Initiative (ADNI) database (adni.loni.usc.edu).
References
- [1].Hardy J, Selkoe DJ. The Amyloid Hypothesis of Alzheimer’s Disease: Progress and Problems on the Road to Therapeutics. Science 2002;297:353–6. 10.1126/science.1072994. [DOI] [PubMed] [Google Scholar]
- [2].Xu W, Tan L, Wang H-F, Jiang T, Tan M-S, Tan L, et al. Meta-analysis of modifiable risk factors for Alzheimer’s disease. J Neurol Neurosurg Psychiatry 2015;86:1299–306. 10.1136/jnnp-2015-310548. [DOI] [PubMed] [Google Scholar]
- [3].Hung C-M, Li Y-C, Chen H-J, Lu K, Liang C-L, Liliang P-C, et al. Risk of dementia in patients with primary insomnia: a nationwide population-based case-control study. BMC Psychiatry 2018;18:38. 10.1186/s12888-018-1623-0. [DOI] [PMC free article] [PubMed] [Google Scholar]
- [4].Wennberg AMV, Wu MN, Rosenberg PB, Spira AP. Sleep Disturbance, Cognitive Decline, and Dementia: A Review. Semin Neurol 2017;37:395–406. 10.1055/s-0037-1604351. [DOI] [PMC free article] [PubMed] [Google Scholar]
- [5].Chen D-W, Wang J, Zhang L-L, Wang Y-J, Gao C-Y. Cerebrospinal Fluid Amyloid-β Levels are Increased in Patients with Insomnia. J Alzheimers Dis 2018;61:645–51. 10.3233/JAD-170032. [DOI] [PubMed] [Google Scholar]
- [6].Wang C, Holtzman DM. Bidirectional relationship between sleep and Alzheimer’s disease: role of amyloid, tau, and other factors. Neuropsychopharmacology 2020;45:104–20. 10.1038/s41386-019-0478-5. [DOI] [PMC free article] [PubMed] [Google Scholar]
- [7].Lucey BP, McCullough A, Landsness EC, Toedebusch CD, McLeland JS, Zaza AM, et al. Reduced non-rapid eye movement sleep is associated with tau pathology in early Alzheimer’s disease. Sci Transl Med 2019;11:eaau6550. 10.1126/scitranslmed.aau6550. [DOI] [PMC free article] [PubMed] [Google Scholar]
- [8].Ju Y-ES, Ooms SJ, Sutphen C, Macauley SL, Zangrilli MA, Jerome G, et al. Slow wave sleep disruption increases cerebrospinal fluid amyloid-β levels. Brain 2017;140:2104–11. 10.1093/brain/awx148. [DOI] [PMC free article] [PubMed] [Google Scholar]
- [9].Lee DS, Suh M, Sarker A, Choi Y. Brain Glymphatic/Lymphatic Imaging by MRI and PET. Nucl Med Mol Imaging 2020;54:207–23. 10.1007/s13139-020-00665-4. [DOI] [PMC free article] [PubMed] [Google Scholar]
- [10].Holth JK, Fritschi SK, Wang C, Pedersen NP, Cirrito JR, Mahan TE, et al. The sleep-wake cycle regulates brain interstitial fluid tau in mice and CSF tau in humans. Science 2019;363:880–4. 10.1126/science.aav2546. [DOI] [PMC free article] [PubMed] [Google Scholar]
- [11].Green TRF, Ortiz JB, Wonnacott S, Williams RJ, Rowe RK. The Bidirectional Relationship Between Sleep and Inflammation Links Traumatic Brain Injury and Alzheimer’s Disease. Frontiers in Neuroscience 2020;14. 10.3389/fnins.2020.00894. [DOI] [PMC free article] [PubMed] [Google Scholar]
- [12].Buchman AS, Yu L, Boyle PA, Schneider JA, De Jager PL, Bennett DA. Higher brain BDNF gene expression is associated with slower cognitive decline in older adults. Neurology 2016;86:735–41. 10.1212/WNL.0000000000002387. [DOI] [PMC free article] [PubMed] [Google Scholar]
- [13].Giese M, Unternaehrer E, Brand S, Calabrese P, Holsboer-Trachsler E, Eckert A. The Interplay of Stress and Sleep Impacts BDNF Level. PLOS One 2013;8:e76050. 10.1371/journal.pone.0076050. [DOI] [PMC free article] [PubMed] [Google Scholar]
- [14].Sadeghmousavi S, Eskian M, Rahmani F, Rezaei N. The effect of insomnia on development of Alzheimer’s disease. Journal of Neuroinflammation 2020;17:289. 10.1186/s12974-020-01960-9. [DOI] [PMC free article] [PubMed] [Google Scholar]
- [15].Kaneshwaran K, Olah M, Tasaki S, Yu L, Bradshaw EM, Schneider JA, et al. Sleep fragmentation, microglial aging, and cognitive impairment in adults with and without Alzheimer’s dementia. Sci Adv 2019;5:eaax7331. 10.1126/sciadv.aax7331. [DOI] [PMC free article] [PubMed] [Google Scholar]
- [16].Choe YM, Suh G-H, Kim JW, Alzheimer’s Disease Neuroimaging Initiative. Association of a History of Sleep Disorder With Risk of Mild Cognitive Impairment and Alzheimer’s Disease Dementia. Psychiatry Investig 2022;19:840–6. 10.30773/pi.2022.0176. [DOI] [PMC free article] [PubMed] [Google Scholar]
- [17].Fjell AM, Sørensen Ø, Amlien IK, Bartrés-Faz D, Brandmaier AM, Buchmann N, et al. Poor Self-Reported Sleep is Related to Regional Cortical Thinning in Aging but not Memory Decline—Results From the Lifebrain Consortium. Cereb Cortex 2020;31:1953–69. 10.1093/cercor/bhaa332. [DOI] [PMC free article] [PubMed] [Google Scholar]
- [18].Mecca AP, Michalak HR, McDonald JW, Kemp EC, Pugh EA, Becker ML, et al. Sleep Disturbance and the Risk of Cognitive Decline or Clinical Conversion in the ADNI Cohort. Dement Geriatr Cogn Disord 2018;45:232–42. 10.1159/000488671. [DOI] [PMC free article] [PubMed] [Google Scholar]
- [19].Abu-Elfotuh K, Al-Najjar AH, Mohammed AA, Aboutaleb AS, Badawi GA. Fluoxetine ameliorates Alzheimer’s disease progression and prevents the exacerbation of cardiovascular dysfunction of socially isolated depressed rats through activation of Nrf2/HO-1 and hindering TLR4/NLRP3 inflammasome signaling pathway. Int Immunopharmacol 2022;104:108488. 10.1016/j.intimp.2021.108488. [DOI] [PubMed] [Google Scholar]
- [20].Cirrito JR, Disabato BM, Restivo JL, Verges DK, Goebel WD, Sathyan A, et al. Serotonin signaling is associated with lower amyloid-β levels and plaques in transgenic mice and humans. Proc Natl Acad Sci U S A 2011;108:14968–73. 10.1073/pnas.1107411108. [DOI] [PMC free article] [PubMed] [Google Scholar]
- [21].Nelson RL, Guo Z, Halagappa VM, Pearson M, Gray AJ, Matsuoka Y, et al. Prophylactic Treatment with Paroxetine Ameliorates Behavioral Deficits and Retards the Development of Amyloid and Tau Pathologies in 3xTgAD Mice. Exp Neurol 2007;205:166–76. 10.1016/j.expneurol.2007.01.037. [DOI] [PMC free article] [PubMed] [Google Scholar]
- [22].Wang Y-J, Ren Q-G, Gong W-G, Wu D, Tang X, Li X-L, et al. Escitalopram attenuates β-amylo-idinduced tau hyperphosphorylation in primary hippocampal neurons through the 5-HT1A receptor mediated Akt/GSK-3β pathway. Oncotarget 2016;7:13328–39. 10.18632/oncotarget.7798. [DOI] [PMC free article] [PubMed] [Google Scholar]
- [23].Lai LL, Tan MH, Lai YC. Prevalence and factors associated with off-label antidepressant prescriptions for insomnia. Drug Healthc Patient Saf 2011;3:27–36. 10.2147/DHPS.S21079. [DOI] [PMC free article] [PubMed] [Google Scholar]
- [24].Becker LA, Penagos H, Flores FJ, Manoach DS, Wilson MA, Varela C. Eszopiclone and Zolpidem Produce Opposite Effects on Hippocampal Ripple Density. Front Pharmacol 2022;12:792148. 10.3389/fphar.2021.792148. [DOI] [PMC free article] [PubMed] [Google Scholar]
- [25].Liu X, Guo L, Duan B, Wu J, Wang E. Novel benzodiazepine remimazolam tosylate delays neurodegeneration of aged mice via decreasing tau phosphorylation. NeuroToxicology 2022;92:156–65. 10.1016/j.neuro.2022.08.003. [DOI] [PubMed] [Google Scholar]
- [26].Whittington RA, Virág L, Gratuze M, Lewkowitz-Shpuntoff H, Cheheltanan M, Petry F, et al. Administration of the benzodiazepine midazolam increases tau phosphorylation in the mouse brain. Neurobiology of Aging 2019;75:11–24. 10.1016/j.neurobiolaging.2018.10.027. [DOI] [PMC free article] [PubMed] [Google Scholar]
- [27].Al-Kuraishy HM, Al-Gareeb AI, Alsayegh AA, Abusudah WF, Almohmadi NH, Eldahshan OA, et al. Insights on benzodiazepines’ potential in Alzheimer’s disease. Life Sciences 2023;320:121532. 10.1016/j.lfs.2023.121532. [DOI] [PubMed] [Google Scholar]
- [28].Billioti de Gage S, Moride Y, Ducruet T, Kurth T, Verdoux H, Tournier M, et al. Benzodiazepine use and risk of Alzheimer’s disease: case-control study. BMJ 2014;349:g5205. 10.1136/bmj.g5205. [DOI] [PMC free article] [PubMed] [Google Scholar]
- [29].Fastbom J, Forsell Y, Winblad B. Benzodiazepines May Have Protective Effects Against Alzheimer Disease. Alzheimer Disease & Associated Disorders 1998;12:14. 10.1097/00002093-199803000-00002. [DOI] [PubMed] [Google Scholar]
- [30].Imfeld P, Bodmer M, Jick SS, Meier CR. Benzodiazepine Use and Risk of Developing Alzheimer’s Disease or Vascular Dementia: A Case–Control Analysis. Drug Saf 2015;38:909–19. 10.1007/s40264-015-0319-3. [DOI] [PubMed] [Google Scholar]
- [31].Mueller SG, Weiner MW, Thal LJ, Petersen RC, Jack CR, Jagust W, et al. Ways toward an early diagnosis in Alzheimer’s disease: the Alzheimer’s Disease Neuroimaging Initiative (ADNI). Alzheimers Dement 2005;1:55–66. 10.1016/j.jalz.2005.06.003. [DOI] [PMC free article] [PubMed] [Google Scholar]
- [32].Alzheimer’s Disease Cooperative Study (ADCS). Alzheimer’s Disease Neuroimaging Initiative. clinicaltrials.gov; 2014.
- [33].Rosen WG, Mohs RC, Davis KL. A new rating scale for Alzheimer’s disease. Am J Psychiatry 1984;141:1356–64. 10.1176/ajp.141.11.1356. [DOI] [PubMed] [Google Scholar]
- [34].Shokouhi S. Associations of informant-based sleep reports with Alzheimer’s disease pathologies. CIA 2019;Volume 14:1631–42. 10.2147/CIA.S215208. [DOI] [PMC free article] [PubMed] [Google Scholar]
- [35].Jackson ML, Cavuoto M, Schembri R, Doré V, Villemagne VL, Barnes M, et al. Severe Obstructive Sleep Apnea Is Associated with Higher Brain Amyloid Burden: A Preliminary PET Imaging Study. J Alzheimers Dis 2020;78:611–7. 10.3233/JAD-200571. [DOI] [PubMed] [Google Scholar]
- [36].Atayde AL, Fischer CE, Schweizer TA, Munoz DG. Neuropsychiatric Inventory–Questionnaire Assessed Nighttime Behaviors in Cognitively Asymptomatic Patients with Pathologically Confirmed Alzheimer’s Disease Predict More Rapid Cognitive Deterioration. Journal of Alzheimer’s Disease 2022;86:1137–47. 10.3233/JAD-215276. [DOI] [PMC free article] [PubMed] [Google Scholar]
- [37].Bliwise DL, Mercaldo ND, Avidan AY, Boeve BF, Greer SA, Kukull WA. Sleep Disturbance in Dementia with Lewy Bodies and Alzheimer’s Disease: A Multicenter Analysis. Dementia and Geriatric Cognitive Disorders 2011;31:239–46. 10.1159/000326238. [DOI] [PMC free article] [PubMed] [Google Scholar]
- [38].Do D. Trends in the use of medications with insomnia side effects and the implications for insomnia among US adults. J Sleep Res 2020;29:e13075. 10.1111/jsr.13075. [DOI] [PubMed] [Google Scholar]
- [39].Prescriber’s Digital Reference n.d. https://pdr.net/ (accessed May 27, 2023).
- [40].Pope C. List of Common Benzodiazepines + Uses & Side Effects. DrugsCom 2023. https://www.drugs.com/drug-class/benzodiazepines.html (accessed July 24, 2023).
- [41].U.S. Food & Drug Administration. Sleep Disorder (Sedative-Hypnotic) Drug Information. FDA; 2023. [Google Scholar]
- [42].Cardinali DP, Furio AM, Brusco LI. Clinical Aspects of Melatonin Intervention in Alzheimer’s Disease Progression. Current Neuropharmacology 2010;8:218–27. 10.2174/157015910792246209. [DOI] [PMC free article] [PubMed] [Google Scholar]
- [43].Shukla M, Govitrapong P, Boontem P, Reiter RJ, Satayavivad J. Mechanisms of Melatonin in Alleviating Alzheimer’s Disease. Current Neuropharmacology 2017;15:1010–31. 10.2174/1570159X15666170313123454. [DOI] [PMC free article] [PubMed] [Google Scholar]
- [44].Saykin AJ, Shen L, Foroud TM, Potkin SG, Swaminathan S, Kim S, et al. Alzheimer’s Disease Neuroimaging Initiative biomarkers as quantitative phenotypes: Genetics core aims, progress, and plans. Alzheimers Dement 2010;6:265–73. 10.1016/j.jalz.2010.03.013. [DOI] [PMC free article] [PubMed] [Google Scholar]
- [45].Landau SM, Lu M, Joshi AD, Pontecorvo M, Mintun MA, Trojanowski JQ, et al. Comparing positron emission tomography imaging and cerebrospinal fluid measurements of β-amyloid. Ann Neurol 2013;74:826–36. 10.1002/ana.23908. [DOI] [PMC free article] [PubMed] [Google Scholar]
- [46].Chen J, Li Y, Pirraglia E, Okamura N, Rusinek H, de Leon MJ. Quantitative evaluation of tau PET tracers 18F-THK5351 and 18F-AV-1451 in Alzheimer’s disease with standardized uptake value peak-alignment (SUVP) normalization. Eur J Nucl Med Mol Imaging 2018;45:1596–604. 10.1007/s00259-018-4040-1. [DOI] [PMC free article] [PubMed] [Google Scholar]
- [47].Ossenkoppele R, Rabinovici GD, Smith R, Cho H, Schöll M, Strandberg O, et al. Discriminative Accuracy of [18F]flortaucipir Positron Emission Tomography for Alzheimer Disease vs Other Neurodegenerative Disorders. JAMA 2018;320:1151–62. 10.1001/jama.2018.12917. [DOI] [PMC free article] [PubMed] [Google Scholar]
- [48].Pawlik D, Leuzy A, Strandberg O, Smith R. Compensating for choroid plexus based off-target signal in the hippocampus using 18F-flortaucipir PET. Neuroimage 2020;221:117193. 10.1016/j.neuroimage.2020.117193. [DOI] [PubMed] [Google Scholar]
- [49].Fitzmaurice GM, Ravichandran C. A primer in longitudinal data analysis. Circulation 2008;118:2005–10. 10.1161/CIRCULATIONAHA.107.714618. [DOI] [PubMed] [Google Scholar]
- [50].Chiang GC, Insel PS, Tosun D, Schuff N, Truran-Sacrey D, Raptentsetsang ST, et al. Hippocampal atrophy rates and CSF biomarkers in elderly APOE2 normal subjects. Neurology 2010;75:1976–81. 10.1212/WNL.0b013e3181ffe4d1. [DOI] [PMC free article] [PubMed] [Google Scholar]
- [51].Landau SM, Thomas BA, Thurfjell L, Schmidt M, Margolin R, Mintun M, et al. Amyloid PET imaging in Alzheimer’s disease: a comparison of three radiotracers. Eur J Nucl Med Mol Imaging 2014;41:1398–407. 10.1007/s00259-014-2753-3. [DOI] [PMC free article] [PubMed] [Google Scholar]
- [52].Sheikh JI, Yesavage JA. Geriatric Depression Scale (GDS): Recent evidence and development of a shorter version. Clinical Gerontologist: The Journal of Aging and Mental Health 1986;5:165–73. 10.1300/J018v05n01_09. [DOI] [Google Scholar]
- [53].Meyer P-F, Pichet Binette A, Gonneaud J, Breitner JCS, Villeneuve S. Characterization of Alzheimer Disease Biomarker Discrepancies Using Cerebrospinal Fluid Phosphorylated Tau and AV1451 Positron Emission Tomography. JAMA Neurol 2020;77:508–16. 10.1001/jamaneurol.2019.4749. [DOI] [PMC free article] [PubMed] [Google Scholar]
- [54].López-García S, Lage C, Pozueta A, García-Martínez M, Kazimierczak M, Fernández-Rodríguez A, et al. Sleep Time Estimated by an Actigraphy Watch Correlates With CSF Tau in Cognitively Unimpaired Elders: The Modulatory Role of APOE. Front Aging Neurosci 2021;13:663446. 10.3389/fnagi.2021.663446. [DOI] [PMC free article] [PubMed] [Google Scholar]
- [55].Sprecher KE, Koscik RL, Carlsson CM, Zetterberg H, Blennow K, Okonkwo OC, et al. Poor sleep is associated with CSF biomarkers of amyloid pathology in cognitively normal adults. Neurology 2017;89:445–53. 10.1212/WNL.0000000000004171. [DOI] [PMC free article] [PubMed] [Google Scholar]
- [56].Yoon SH, Kim H-K, Lee J-H, Sohn YH, Lee PH, Ryu YH, et al. Association of Sleep Disturbances With Brain Amyloid and Tau Burden, Cortical Atrophy, and Cognitive Dysfunction Across the AD Continuum. Neurology 2023;101:e2162–71. 10.1212/WNL.0000000000207917. [DOI] [PMC free article] [PubMed] [Google Scholar]
- [57].Benedict C, Blennow K, Zetterberg H, Cedernaes J. Effects of acute sleep loss on diurnal plasma dynamics of CNS health biomarkers in young men. Neurology 2020;94:e1181–9. 10.1212/WNL.0000000000008866. [DOI] [PMC free article] [PubMed] [Google Scholar]
- [58].Bellesi M, de Vivo L, Chini M, Gilli F, Tononi G, Cirelli C. Sleep Loss Promotes Astrocytic Phagocytosis and Microglial Activation in Mouse Cerebral Cortex. J Neurosci 2017;37:5263–73. 10.1523/JNEUROSCI.3981-16.2017. [DOI] [PMC free article] [PubMed] [Google Scholar]
- [59].Zhang F, Niu L, Zhong R, Li S, Le W. Chronic Sleep Disturbances Alters Sleep Structure and Tau Phosphorylation in AβPP/PS1 AD Mice and Their Wild-Type Littermates. Journal of Alzheimer’s Disease 2023;92:1341–55. 10.3233/JAD-221048. [DOI] [PubMed] [Google Scholar]
- [60].Diekelmann S, Born J. The memory function of sleep. Nat Rev Neurosci 2010;11:114–26. 10.1038/nrn2762. [DOI] [PubMed] [Google Scholar]
- [61].Winer JR, Mander BA, Helfrich RF, Maass A, Harrison TM, Baker SL, et al. Sleep as a Potential Biomarker of Tau and β-Amyloid Burden in the Human Brain. J Neurosci 2019;39:6315–24. 10.1523/JNEUROSCI.0503-19.2019. [DOI] [PMC free article] [PubMed] [Google Scholar]
- [62].Kim H, Levine A, Cohen D, Gehrman P, Zhu X, Devanand DP, et al. The Role of Amyloid, Tau, and APOE Genotype on the Relationship Between Informant-Reported Sleep Disturbance and Alzheimer’s Disease Risks. Journal of Alzheimer’s Disease 2022;87:1567–80. 10.3233/JAD-215417. [DOI] [PMC free article] [PubMed] [Google Scholar]
- [63].Andrews M, Ross R, Malhotra A, Ancoli-Israel S, Brewer JB, Banks SJ. Sleep and Tau Pathology in Vietnam War Veterans with Preclinical and Prodromal Alzheimer’s Disease. ADR 2021;5:41–8. 10.3233/ADR-200245. [DOI] [PMC free article] [PubMed] [Google Scholar]
- [64].Creese B, Brooker H, Ismail Z, Wesnes KA, Hampshire A, Khan Z, et al. Mild Behavioral Impairment as a Marker of Cognitive Decline in Cognitively Normal Older Adults. The American Journal of Geriatric Psychiatry 2019;27:823–34. 10.1016/j.jagp.2019.01.215. [DOI] [PubMed] [Google Scholar]
- [65].Ismail Z, Smith EE, Geda Y, Sultzer D, Brodaty H, Smith G, et al. Neuropsychiatric symptoms as early manifestations of emergent dementia: Provisional diagnostic criteria for mild behavioral impairment. Alzheimer’s & Dementia 2016;12:195–202. 10.1016/j.jalz.2015.05.017. [DOI] [PMC free article] [PubMed] [Google Scholar]
- [66].Mallo SC, Ismail Z, Pereiro AX, Facal D, Lojo-Seoane C, Campos-Magdaleno M, et al. Assessing mild behavioral impairment with the mild behavioral impairment checklist in people with subjective cognitive decline. International Psychogeriatrics 2018;31:231–9. 10.1017/S1041610218000698. [DOI] [PubMed] [Google Scholar]
- [67].Insel PS, Mohlenhoff BS, Neylan TC, Krystal AD, Mackin RS. Association of Sleep and β-Amyloid Pathology Among Older Cognitively Unimpaired Adults. JAMA Netw Open 2021;4:e2117573. 10.1001/jamanetworkopen.2021.17573. [DOI] [PMC free article] [PubMed] [Google Scholar]
- [68].Kang J-E, Lim MM, Bateman RJ, Lee JJ, Smyth LP, Cirrito JR, et al. Amyloid-β Dynamics are Regulated by Orexin and the Sleep-Wake Cycle. Science 2009;326:1005–7. 10.1126/science.1180962. [DOI] [PMC free article] [PubMed] [Google Scholar]
- [69].Lucey BP, Hicks TJ, McLeland JS, Toedebusch CD, Boyd J, Elbert DL, et al. Effect of sleep on overnight CSF amyloid-β kinetics. Ann Neurol 2018;83:197–204. 10.1002/ana.25117. [DOI] [PMC free article] [PubMed] [Google Scholar]
- [70].Roh JH, Jiang H, Finn MB, Stewart FR, Mahan TE, Cirrito JR, et al. Potential role of orexin and sleep modulation in the pathogenesis of Alzheimer’s disease. J Exp Med 2014;211:2487–96. 10.1084/jem.20141788. [DOI] [PMC free article] [PubMed] [Google Scholar]
- [71].Sharma RA, Varga AW, Bubu OM, Pirraglia E, Kam K, Parekh A, et al. Obstructive Sleep Apnea Severity Affects Amyloid Burden in Cognitively Normal Elderly. A Longitudinal Study. Am J Respir Crit Care Med 2018;197:933–43. 10.1164/rccm.201704-0704OC. [DOI] [PMC free article] [PubMed] [Google Scholar]
- [72].Sprecher KE, Bendlin BB, Racine AM, Okonkwo OC, Christian BT, Koscik RL, et al. Amyloid burden is associated with self-reported sleep in nondemented late middle-aged adults. Neurobiology of Aging 2015;36:2568–76. 10.1016/j.neurobiolaging.2015.05.004. [DOI] [PMC free article] [PubMed] [Google Scholar]
- [73].Lew CH, Petersen C, Neylan TC, Grinberg LT. Tau-driven degeneration of sleep- and wake-regulating neurons in Alzheimer’s disease. Sleep Medicine Reviews 2021;60:101541. 10.1016/j.smrv.2021.101541. [DOI] [PMC free article] [PubMed] [Google Scholar]
- [74].Petersen RC, Aisen PS, Beckett LA, Donohue MC, Gamst AC, Harvey DJ, et al. Alzheimer’s Disease Neuroimaging Initiative (ADNI). Neurology 2010;74:201–9. 10.1212/WNL.0b013e3181cb3e25. [DOI] [PMC free article] [PubMed] [Google Scholar]
- [75].Bubu OM, Umasabor-Bubu OQ, Turner AD, Parekh A, Mullins AE, Kam K, et al. Self-reported obstructive sleep apnea, amyloid and tau burden, and Alzheimer’s disease time-dependent progression. Alzheimer’s & Dementia 2020;17:226–45. 10.1002/alz.12184. [DOI] [PMC free article] [PubMed] [Google Scholar]
- [76].Chang W-P, Liu M-E, Chang W-C, Yang AC, Ku Y-C, Pai J-T, et al. Sleep Apnea and the Risk of Dementia: A Population-Based 5-Year Follow-Up Study in Taiwan. PLOS ONE 2013;8:e78655. 10.1371/journal.pone.0078655. [DOI] [PMC free article] [PubMed] [Google Scholar]
- [77].Lal C, Strange C, Bachman D. Neurocognitive Impairment in Obstructive Sleep Apnea. Chest 2012;141:1601–10. 10.1378/chest.11-2214. [DOI] [PubMed] [Google Scholar]
- [78].Yaffe K, Laffan AM, Harrison SL, Redline S, Spira AP, Ensrud KE, et al. Sleep disordered breathing, hypoxia, and risk of mild cognitive impairment and dementia in older women. JAMA 2011;306:613–9. 10.1001/jama.2011.1115. [DOI] [PMC free article] [PubMed] [Google Scholar]
- [79].Bhuniya S, Goyal M, Chowdhury N, Mishra P. Intermittent hypoxia and sleep disruption in obstructive sleep apnea increase serum tau and amyloid-beta levels. Journal of Sleep Research 2022;31:e13566. 10.1111/jsr.13566. [DOI] [PubMed] [Google Scholar]
- [80].Kazim SF, Sharma A, Saroja SR, Seo JH, Larson CS, Ramakrishnan A, et al. Chronic Intermittent Hypoxia Enhances Pathological Tau Seeding, Propagation, and Accumulation and Exacerbates Alzheimer-like Memory and Synaptic Plasticity Deficits and Molecular Signatures. Biological Psychiatry 2022;91:346–58. 10.1016/j.biopsych.2021.02.973. [DOI] [PMC free article] [PubMed] [Google Scholar]
- [81].Mullins AE, Kam K, Parekh A, Bubu OM, Osorio RS, Varga AW. Obstructive Sleep Apnea and Its Treatment in Aging: Effects on Alzheimer’s disease Biomarkers, Cognition, Brain Structure and Neurophysiology. Neurobiology of Disease 2020;145:105054. 10.1016/j.nbd.2020.105054. [DOI] [PMC free article] [PubMed] [Google Scholar]
- [82].Xie J-C, Ma X-Y, Liu X-H, Yu J, Zhao Y-C, Tan Y, et al. Hypoxia increases amyloid-β level in exosomes by enhancing the interaction between CD147 and Hook1. Am J Transl Res 2018;10:150–63. [PMC free article] [PubMed] [Google Scholar]
- [83].Zhang C-E, Yang X, Li L, Sui X, Tian Q, Wei W, et al. Hypoxia-induced tau phosphorylation and memory deficit in rats. Neurodegener Dis 2014;14:107–16. 10.1159/000362239. [DOI] [PubMed] [Google Scholar]
- [84].Andrade A, Bubu OM, Varga AW, Osorio RS. The relationship between Obstructive Sleep Apnea and Alzheimer’s Disease. J Alzheimers Dis 2018;64:S255–70. 10.3233/JAD-179936. [DOI] [PMC free article] [PubMed] [Google Scholar]
- [85].Cirrito JR, Yamada KA, Finn MB, Sloviter RS, Bales KR, May PC, et al. Synaptic activity regulates interstitial fluid amyloid-beta levels in vivo. Neuron 2005;48:913–22. 10.1016/j.neuron.2005.10.028. [DOI] [PubMed] [Google Scholar]
- [86].Kang J, Tian Z, Wei J, Mu Z, Liang J, Li M. Association between obstructive sleep apnea and Alzheimer’s disease-related blood and cerebrospinal fluid biomarkers: A meta-analysis. J Clin Neurosci 2022;102:87–94. 10.1016/j.jocn.2022.06.004. [DOI] [PubMed] [Google Scholar]
- [87].Finkel KJ, Searleman AC, Tymkew H, Tanaka CY, Saager L, Safer-Zadeh E, et al. Prevalence of undiagnosed obstructive sleep apnea among adult surgical patients in an academic medical center. Sleep Med 2009;10:753–8. 10.1016/j.sleep.2008.08.007. [DOI] [PubMed] [Google Scholar]
- [88].Behrens A, Anderberg P, Berglund JS. Sleep disturbance predicts worse cognitive performance in subsequent years: A longitudinal population-based cohort study. Archives of Gerontology and Geriatrics 2023;106:104899. 10.1016/j.archger.2022.104899. [DOI] [PubMed] [Google Scholar]
- [89].Liguori C, Romigi A, Nuccetelli M, Zannino S, Sancesario G, Martorana A, et al. Orexinergic System Dysregulation, Sleep Impairment, and Cognitive Decline in Alzheimer Disease. JAMA Neurology 2014;71:1498–505. 10.1001/jamaneurol.2014.2510. [DOI] [PubMed] [Google Scholar]
- [90].Osorio RS, Gumb T, Pirraglia E, Varga AW, Lu S, Lim J, et al. Sleep-disordered breathing advances cognitive decline in the elderly. Neurology 2015;84:1964–71. 10.1212/WNL.0000000000001566. [DOI] [PMC free article] [PubMed] [Google Scholar]
- [91].de Almondes KM, Costa MV, Malloy-Diniz LF, Diniz BS. Insomnia and risk of dementia in older adults: Systematic review and meta-analysis. Journal of Psychiatric Research 2016;77:109–15. 10.1016/j.jpsychires.2016.02.021. [DOI] [PubMed] [Google Scholar]
- [92].Chen J, Espeland MA, Brunner RL, Lovato LC, Wallace RB, Leng X, et al. Sleep duration, cognitive decline, and dementia risk in older women. Alzheimer’s & Dementia 2016;12:21–33. 10.1016/j.jalz.2015.03.004. [DOI] [PMC free article] [PubMed] [Google Scholar]
- [93].Guzman-Marin R, Bashir T, Suntsova N, Szymusiak R, McGinty D. Hippocampal neurogenesis is reduced by sleep fragmentation in the adult rat. Neuroscience 2007;148:325–33. 10.1016/j.neuroscience.2007.05.030. [DOI] [PMC free article] [PubMed] [Google Scholar]
- [94].Mueller AD, Pollock MS, Lieblich SE, Epp JR, Galea LAM, Mistlberger RE. Sleep deprivation can inhibit adult hippocampal neurogenesis independent of adrenal stress hormones. American Journal of Physiology-Regulatory, Integrative and Comparative Physiology 2008;294:R1693–703. 10.1152/ajpregu.00858.2007. [DOI] [PubMed] [Google Scholar]
- [95].Masters MC, Morris JC, Roe CM. “Noncognitive” symptoms of early Alzheimer disease: A longitudinal analysis. Neurology 2015;84:617–22. 10.1212/WNL.0000000000001238. [DOI] [PMC free article] [PubMed] [Google Scholar]
- [96].Ng KP, Pascoal TA, Mathotaarachchi S, Chan YH, Jiang L, Therriault J, et al. Neuropsychiatric symptoms are early indicators of an upcoming metabolic decline in Alzheimer’s disease. Transl Neurodegener 2021;10:1. 10.1186/s40035-020-00225-y. [DOI] [PMC free article] [PubMed] [Google Scholar]
- [97].Rosenberg PB, Mielke MM, Appleby BS, Oh ES, Geda YE, Lyketsos CG. The Association of Neuropsychiatric Symptoms in MCI with Incident Dementia and Alzheimer Disease. The American Journal of Geriatric Psychiatry 2013;21:685–95. 10.1016/j.jagp.2013.01.006. [DOI] [PMC free article] [PubMed] [Google Scholar]
- [98].Mudalige D, Guan DX, Ghahremani M, Ismail Z. Longitudinal Associations Between Mild Behavioral Impairment, Sleep Disturbance, and Progression to Dementia. Journal of Alzheimer’s Disease Reports 2023;7:1323–34. 10.3233/ADR-230086. [DOI] [PMC free article] [PubMed] [Google Scholar]
- [99].Lucey BP, Liu H, Toedebusch CD, Freund D, Redrick T, Chahin SL, et al. Suvorexant Acutely Decreases Tau Phosphorylation and Aβ in the Human CNS. Annals of Neurology 2023;n/a. 10.1002/ana.26641. [DOI] [PMC free article] [PubMed] [Google Scholar]
Associated Data
This section collects any data citations, data availability statements, or supplementary materials included in this article.
Supplementary Materials
Data Availability Statement
Data used in the preparation of this article are publicly available and were obtained from the Alzheimer’s Disease Neuroimaging Initiative (ADNI) database (adni.loni.usc.edu).