

Abstract
Lipids are biological molecules that play vital roles in all living organisms. They perform many cellular functions, such as 1) forming cellular and subcellular membranes, 2) storing and using energy, and 3) serving as chemical messengers during intra‐ and inter‐cellular signal transduction. The large‐scale study of the pathways and networks of cellular lipids in biological systems is called “lipidomics” and is one of the fastest‐growing omics technologies of the last two decades. With state‐of‐the‐art mass spectrometry instrumentation and sophisticated data handling, clinical studies show how human lipid composition changes in health and disease, thereby making it a valuable medium to collect for clinical applications, such as disease diagnostics, therapeutic decision‐making, and drug development. This review gives a comprehensive overview of current workflows used in clinical research, from sample collection and preparation to data and clinical interpretations. This is followed by an appraisal of applications in 2022 and a perspective on the exciting future of clinical lipidomics.
Abbreviations
- ACSL4
Acyl‐CoA synthetase long‐chain family member 4
- AIDS
Acquired immunodeficiency syndrome
- AIF
All‐ion fragmentation
- COVID‐19
Coronavirus disease 2019
- CVD
Cardiovascular disease
- DDA
Data‐dependent acquisition
- DI
Direct infusion
- DIA
Data‐independent acquisition
- ESI
Electrospray ionisation
- FA
Fatty acyls
- FAB
Fast atom bombardment
- FID
Flame ionisation detector
- FWHM
Full‐width at half maximum
- GC
Gas chromatography
- GC‐MS
Gas chromatography‐mass spectrometry
- GL
Glycerolipids
- GP
Glycerophospholipids
- HILIC
Hydrophilic interaction liquid chromatography
- HIV
Human immunodeficiency virus
- HRMS
High‐resolution mass spectrometry
- ICPerMed
International Consortium for Personalised Medicine
- (IFN)γ
Interferon gamma
- IMS
Ion mobility spectrometry
- IRI
Irinotecan
- LC
Liquid chromatography
- LC‐MS
Liquid chromatography‐mass spectrometry
- LIPID MAPS
Lipid Metabolites and Pathways Strategy
- LMSD
LIPID MAPS Structure Database
- LRMS
Low‐resolution mass spectrometry
- LTEC
Long‐term elite controller
- MEPS
Micro‐extraction by packed sorbent
- MetS
Metabolic syndrome
- MRM
Multiple reaction monitoring
- MS
Mass spectrometry
- NAFLD
Non‐alcoholic fatty liver disease
- NMR
Nuclear magnetic resonance
- NPLC
Normal‐phase liquid chromatography
- OPLS‐DA
Orthogonal projection to latent structure discriminant analysis
- PBMC
Peripheral blood mononuclear cell
- PC
Lysophosphatidylcholines
- PCA
Principal component analysis
- PE
Lysophosphatidylethanolamines
- PI
Phosphatidylinositols
- PK
Polyketides
- PKCβII
Protein kinase C βII
- PLS‐DA
Partial least squares discriminant analysis
- PR
Prenol lipids
- PRM
Parallel reaction monitoring
- RPLC
Reversed‐phase liquid chromatography
- SARS‐CoV‐2
Severe acute respiratory syndrome coronavirus 2
- SL
Saccharolipids
- SP
Sphingolipids
- SPE
Solid‐phase extraction
- SRM
Selected reaction monitoring
- ST
Sterol lipids
- SWATH
Sequential window of all theoretical fragment‐ion spectra
- T2D
Type 2 diabetes
- TB
Tuberculosis
- TSA
Tuberculostearic acid
- WHO
World Health Organisation
1. INTRODUCTION
Lipids are dynamic, ubiquitous molecules that play vital roles across all biological systems. They perform the following essential functions within cells: energy storage and metabolism, building blocks of cellular and subcellular membranes and intra‐ and inter‐cellular signalling. 1 , 2 , 3 , 4 Mammalian cells express tens to hundreds of thousands of different lipid species. 5 , 6 Endogenous and exogenous factors, such as age, diet, disease, genetics, and environment can influence lipid composition or expression, which means as molecules, they present unique signatures of invaluable information regarding cellular status that is of high interest for the wider scientific community. 4
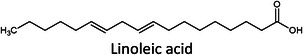
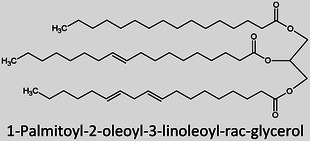
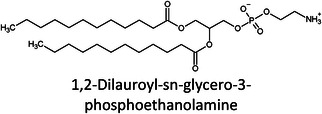
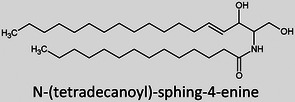
The term “lipids” covers a large chemical space of small molecules that are chemically and structurally diverse, varying in aspects such as the length of the hydrocarbon backbone, branching, degrees of unsaturation, and functional groups (Table 1). 7 These differences occur due to a number of different biochemical transformations during their biosynthesis. 8 Despite falling under the same umbrella term “lipids”, the variability between these molecules is greater than those of genomics and proteomics with an estimated number of structural variations exceeding > 105. 9 , 10 Formally, they are defined as “hydrophobic or amphipathic small molecules that may originate entirely or in part by carbanion‐based condensations of thioesters and/or by carbocation‐based condensations of isoprene units”. 11 Since 2005, the International Lipid Classification and Nomenclature Committee under the sponsorship of the Lipid Metabolites and Pathways Strategy (LIPID MAPS) consortium established the “Comprehensive Classification System for Lipids” that divided all lipids into eight lipid categories: fatty acyls, glycerolipids, glycerophospholipids, sphingolipids, sterol lipids, prenol lipids, saccharolipids, and polyketides (Table 1). As of 13th January 2023, the LIPID MAPS Structure Database (LMSD), which is the largest online lipid database, contains 47,800 unique lipid structures. 12 Researchers refer to the entire collection of lipid species in a cell, organ, or biological system as a “lipidome” and the large‐scale analytical study of this lipidome as well as the lipids’ interactions with other lipids, proteins, and metabolites as “lipidomics”. 2 , 3
TABLE 1.
Lipid categories as per LIPID MAPS classification system 12 with example structures. With the exception of various fatty acyls, the logP values taken 13 show the high hydrophobicity of lipids. The number of molecules in LMSD reported has been updated as of 13th January 2023.
| Lipid category | Example structure | LogP | No. of molecules in LMSD |
|---|---|---|---|
|
Fatty acyls (FA) |
|
–5–15 | 10,524 |
|
Glycerolipids (GL) |
|
5–35 | 7,731 |
|
Glycerophospholipids (GP) |
|
5–25 | 10,074 |
|
Sphingolipids (SP) |
|
5–25 | 4,967 |
|
Sterol lipids (ST) |
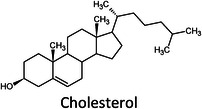
|
0–20 | 3,614 |
|
Prenol lipids (PR) |
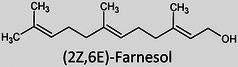
|
0–20 | 2,396 |
|
Saccharolipids a (SL) |
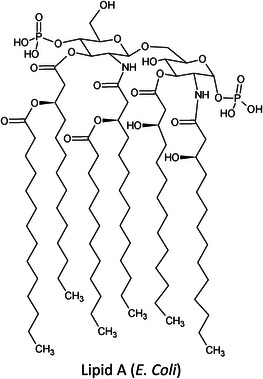
|
0–30 | 1,345 |
|
Polyketides a (PK) |
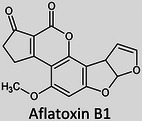
|
0–15 | 7,149 |
These lipids are not synthesised in mammals and therefore within a clinical context should only represent a small portion of the lipidome.
It was only approximately 40 years ago that lipidomics experiments were made possible due to technological advancements in mass spectrometry (MS). Before this, traditional lipid analysis was performed using techniques such as gas chromatography (GC), high‐performance liquid chromatography, thin‐layer chromatography, nuclear magnetic resonance and other spectroscopic methods, or MS using electron ionisation, chemical ionisation, and field desorption. 14 , 15 , 16 , 17 , 18 The major limitations in the past involved addressing the chemical complexity of lipids in biological samples, i.e., the need for instrumentation that can first adequately volatilise and ionise the compounds, and then sensitively analyse and differentiate hundreds of molecules simultaneously. For example, using the molecules shown in Table 1, aflatoxin B1 and 1‐palmitoyl‐2‐oleoyl‐3‐linoleoyl‐rac‐glycerol with boiling points of 528°C 19 and 801°C, 20 respectively, are unlikely to readily volatilise in GC without derivatisation, and cholesterol and (2Z,6E)‐farnesol lack ionisable functional groups for efficient soft ionisation. Another notable limitation was the lack of soft ionisation that made intact lipid characterisations and quantification near impossible.
The first breakthrough for intact lipid analysis was the development of fast atom bombardment (FAB) by Michael Barber 21 that showed considerable success for the analysis of polar involatile lipids, such as phospholipids 22 , 23 and fatty acids, 24 , 25 where lipid class separation and detection with minimal fragmentation was made possible. 22 , 26 , 27 , 28 , 29 , 30 Unfortunately, this was not the case for nonpolar lipids, such as triglycerides, where extensive fragmentation limited its differentiation from other lipid species. 18 Further, a lack of sensitivity and reproducibility of FAB limited its use in large‐scale analyses. The next breakthrough came through the invention of electrospray ionisation (ESI) by John Fenn in 1989 31 that greatly accelerated lipid analysis (Figure 1) due to the softer ionisation mechanism, increased ionisation efficiency of nonpolar lipids through adduct formation, and ease of use for quantification. 18 , 32 , 33 , 34 , 35 , 36 , 37 , 38 , 39 , 40 Now, ESI is the most common ionisation technique used for LC‐MS lipidomics, accounting for nearly two‐thirds of all lipidomics articles since 2010. 41 Lipidomics is one of today's fastest‐growing research fields (Figure 1) 10 and it continues to grow through community‐driven advances in technology (MS, chromatography, bioinformatics), creation of shared online lipid databases, and commercial availability of lipid standards. 42 , 43
FIGURE 1.
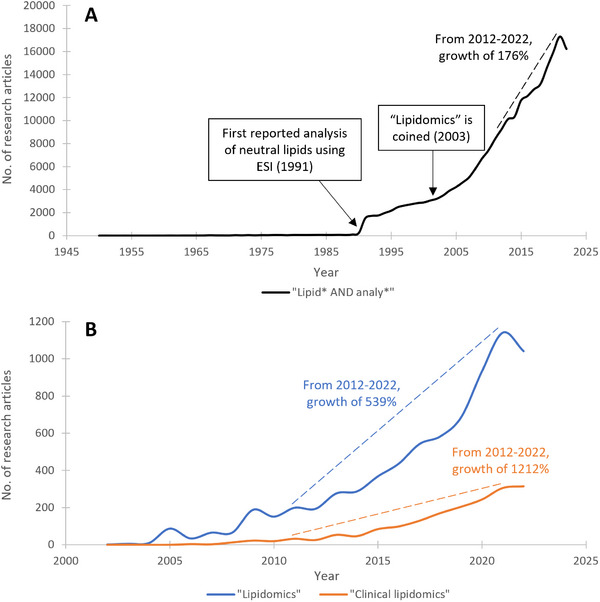
Number of peer‐reviewed research articles published on Web of Science (as of 13th January 2023) using the search terms: (A) “lipid* AND analyte*” between 1950 and 2022, and (B) “lipidomics” and “clinical lipidomics” between 2002 and 2022. Annotated calculations regarding publication growth are calculated as the number of publications in 2022 divided by the number of publications in 2012, multiplied by 100.
Still in its infancy, the wealth of information offered by lipidomics analysis to understand physiological and pathological processes is currently underutilised in clinics. For the last 60 years, the main manifestation of clinical lipid analyses has consisted of total triglycerides, total cholesterol, low‐density lipoprotein cholesterol, and high‐density lipoprotein cholesterol measurements, which are well established for diagnostics but lack insight concerning the total lipidomic profile. 44 Clinical lipidomics is an emerging subfield focussed on clinical and consumer access to lipidomics data for disease diagnostics and health management. 44 , 45 The main goal of clinical lipidomics is to establish meaningful assays that can inform clinical outcomes. Here, a review of all clinical lipidomics literature published in 2022 found using the Scopus search terms “lipidomics” AND “clinic*” on 15th December 2022 was performed to give a snapshot of the current practices. This review is split into two main parts: 1) a discussion of the overall annual trends identified and how they relate to the conventional lipidomics workflow and 2) a more in‐depth discussion of select research articles on key topic areas.
2. 2022 IN REVIEW: MATERIALS AND METHODS
2.1. Sample collection and experimental considerations
A wide variety of biological samples can be used for clinical lipidomics analysis. The samples chosen are often driven by the clinical question being investigated. Biofluids are commonly studied for biomarker discovery, whereas tissues or cells are commonly used to investigate physiological mechanisms. 46 In 2022, as shown in Figure 2, the most popular samples were plasma, serum, and tissue, accounting for 38%, 22%, and 16% of all publications, respectively. Blood samples contain rich signatures due to their sensitivity to the effects of disease, environment, nutrition, and genetic variation. They are also routinely obtained from patients and stored in biobanks, 47 making them readily available for scientific investigations.
FIGURE 2.
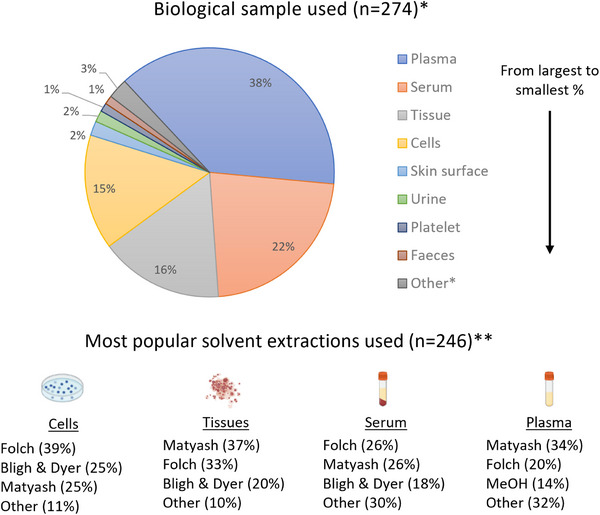
Bibliometric analyses of clinical lipidomics publications in 2022 using Scopus search terms “lipidomics” AND “clinic*” on 15th December 2022. 51 , 60 , 61 , 68 , 77 , 155 , 156 , 157 , 166 , 177 , 178 , 179 , 180 , 181 , 182 , 183 , 184 , 185 , 186 , 187 , 188 , 189 , 190 , 191 , 192 , 193 , 194 , 195 , 196 , 197 , 198 , 199 , 200 , 201 , 202 , 203 , 204 , 205 , 206 , 212 , 213 , 214 , 215 , 232 , 233 , 234 , 235 , 236 , 237 , 238 , 239 , 240 , 241 , 242 , 243 , 244 , 245 , 246 , 247 , 248 , 249 , 250 , 251 , 252 , 253 , 254 , 255 , 256 , 257 , 258 , 259 , 260 , 261 , 262 , 263 , 264 , 265 , 266 , 267 , 268 , 269 , 270 , 271 , 272 , 273 , 274 , 275 , 276 , 277 , 278 , 279 , 280 , 281 , 282 , 283 , 284 , 285 , 286 , 287 , 288 , 289 , 290 , 291 , 292 , 293 , 294 , 295 , 296 , 297 , 298 , 299 , 300 , 301 , 302 , 303 , 304 , 305 , 310 , 311 , 312 , 313 , 314 , 322 , 323 , 324 , 325 , 326 , 327 , 328 , 329 , 330 , 331 , 332 , 333 , 334 , 335 , 345 , 346 , 347 , 348 , 349 , 350 , 351 , 352 , 353 , 354 , 355 , 356 , 357 , 358 , 359 , 360 , 361 , 362 , 363 , 364 , 365 , 366 , 367 , 368 , 369 , 370 , 371 , 372 , 373 , 374 , 375 , 376 , 377 , 378 , 379 , 380 , 381 , 382 , 383 , 384 , 385 , 386 , 387 , 388 , 389 , 390 , 391 , 392 , 393 , 394 , 395 , 396 , 397 , 398 , 399 , 400 , 401 , 402 , 403 , 404 , 405 , 406 , 407 , 408 , 409 , 410 , 411 , 412 , 413 , 414 , 415 , 416 , 417 , 418 , 419 , 420 , 421 , 422 , 423 , 424 , 425 , 426 , 427 , 428 , 429 , 430 , 431 , 432 , 433 , 434 , 435 , 436 , 437 , 438 , 439 , 440 , 441 , 442 , 443 , 444 , 445 , 446 , 447 , 448 , 449 , 450 , 451 , 452 , 453 , 454 , 455 , 456 , 457 . *Note: All biological sample types with more than 1.0% of total publications have been reported individually with all remainder combined under “Other”. **Note: For trending purposes, the unmodified and modified versions of the classic methods (Folch, Bligh & Dyer and Matyash) were combined. The sample images have been created using BioRender.com.
The method and timing of sample collection can have a significant impact on the downstream lipid profile. Fasting status and circadian rhythms for blood samples, for example, have been shown to influence lipidomes. 48 , 49 , 50 To minimise the intra‐ and inter‐variation of cohorts, most studies sample blood at the fasting state to measure baseline levels; however, profiling in the postprandial state could also prove useful. For instance, Velenosi et al. analysed pre‐ and postprandial human plasma samples using standardised mixed meals of control and non‐alcoholic fatty liver disease (NAFLD) patients by untargeted lipidomics. Here, insulin‐related increases in multiple diacylglycerol species at 4 h postprandially were found specifically in NAFLD patients and not in controls, which have been linked to the hepatic secretion of endogenous and not meal‐derived lipids. 51
Sample handling and storage will also cause variations in lipid profiles. For blood samples, the choice of anticoagulants and collection tubes has been demonstrated to have an impact on lipid extraction and MS ionisation. 52 , 53 , 54 , 55 , 56 , 57 , 58 , 59 Two studies performed by Beger et al. and Yadav et al. in 2022 investigated the effects of formalin fixations on the untargeted lipid profiles of brain and skin tissue samples, respectively. 60 , 61 Both studies highlight how preservation added bias to the lipid classes observed, resulting in reduced quality data; therefore, any preservation used should be considered by scientists prior to their study regardless of sample type. After sampling, tissues should be immediately frozen in liquid nitrogen and any biofluids should either be processed immediately or stored at −80°C to limit enzymatic activity or chemical degradation. 41 The multitude of factors that can impact the sampled lipidomes stresses the importance of optimal sampling and storage.
Appropriate experimental design is crucial for clinical lipidomics due to the large intra‐ and inter‐individual biological variability of the human lipidome, resulting in further disease heterogeneity. 62 , 63 , 64 Small sample sizes or the lack of suitable study participants can lead to underpowered designs, resulting in inconclusive or misleading results. Power calculations for discovery experiments are necessary, but difficult with unknown effect sizes, to account for technical and biological variance. 65 , 66 This is especially true for small‐cohort studies where the variability could obscure trends or lead to high false discovery rates. Bias and confounding factors (e.g. differences in storage conditions, testing sites, sampling time) should be factored into the experimental design. Uncontrollable factors (e.g. ethnicity and diet) should also be accounted for in the study design through replication, randomization, and blocking schemes. 67 Further consideration of the clinical application of your study should influence your study design to answer questions such as: what patient population would benefit from these biomarkers, or in which clinical settings will these tests be used? 68 This would aid the translation of research to clinics, where aspects such as costs, facilities available, transportation, and patient demographics may be of relevance. 45
2.2. Sample preparation
After the sample has been collected, it typically undergoes pre‐treatment before analysis for multiple reasons: 1) extraction from biological material, 2) sample matrix clean‐up, 3) analyte preconcentration, and 4) compatibility with instrumentation. For untargeted analyses, where profiling the entire lipidome is of interest, it is important to consider the sampling bias introduced by the extraction method chosen. 69 , 70 , 71 , 72 , 73 , 74 , 75 , 76 , 77 This is a bottleneck in lipidomics workflows due to the large structural diversities of lipids present in biological matrices. The most suitable extraction method for the highest coverage should be investigated through research or literature review prior to experimentation. The amount of sample could also influence the extraction selected. 69 , 78 For targeted approaches, sample preparation is a key area to optimise to make substantial gains in method performance. Here, pre‐treatment approaches, such as solid‐phase extraction (SPE) or derivatisation, for example, esterification, silylation, or charge‐switch derivatisation, can drastically increase analyte sensitivity and/or decrease matrix effects. 41 , 79 , 80 , 81 , 82 , 83 Disadvantages associated with both SPE and derivatisation include their costs, time‐consuming, and cumbersome nature, as well as issues with repeatability due to either batch‐to‐batch variation in sorbents or reagents and/or analyst consistency. 78 , 84 , 85 , 86 , 87 , 88
Solvent extractions are the gold standard in lipidomics sample preparation. Historically, the most widely used solvent extraction systems are the biphasic chloroform/methanol/water mixtures, e.g. “Folch” 89 and “Bligh & Dyer” 90 protocols; however, these classical methods are becoming superseded by new liquid extraction methods, such as the biphasic “Matyash” 91 or “BUME” protocols, or alternatively monophasic alcoholic solutions using isopropanol or methanol, due to their reduced toxicity, automation potential, costs, and/or ease of use. 2 , 69 , 76 , 91 , 92 , 93 , 94 , 95 , 96 , 97 Due to the large sample sizes used, automation of sample preparation is highly advantageous for speed, throughput, and reproducibility. 92 , 96 , 97 With or without the automation of the sample preparation, it is crucial that solvent selection is not only driven by chemistry but also by eco‐friendliness. Analytical studies should aim to develop selective extraction methods to promote green chemistry. 98 , 99 , 100 This shift has been reflected in the trends observed for 2022, where the Folch and Matyash protocols competed to be the most popular extractions for cells, tissues, serum, and plasma (Figure 2). Interestingly, a new monophasic extraction protocol has been developed in 2022 by Fu et al. for untargeted human platelet extraction utilising methanol/methyl tert‐butyl ether/isopropanol (1.3:1:1 v/v/v), reporting almost 100% extraction recoveries of polar and nonpolar lipids. With large‐scale clinical lipidomics studies in mind, the advantages of their solvent system include practicality, eco‐friendliness (reduced solvent consumption and no halogenated solvents), speed, and adaptability to other biofluids. 77
Lastly, the use of internal standards is key to monitoring extraction efficiency (e.g. recovery and repeatability) and accounting for any analyte losses downstream. In 2022, ∼27% of research publications used internal standards.1 Ideally, there should be an internal standard representative of the analyte being quantified, such as an isotopically labelled lipid standard; however, this is not practically possible for untargeted methods involving thousands of compounds. Here, the standardisation of analyte responses is typically performed through the use of commercially available, synthetic lipid standards from AVANTI Polar Lipids through the LIPID MAPS initiative to aid lipid quantification and identification. 42 , 43 The final extract is typically evaporated and reconstituted prior to the introduction to the analytical platform.
2.3. Data acquisition
2.3.1. Separation sciences
The complexity of biological matrices can be reduced through the implementation of separation prior to detection. For lipidomics, this is usually performed using either GC or liquid chromatography (LC) (Figure 3). These techniques can potentially separate isomers and isobars, reduce matrix effects, increase low abundance analyte sensitivities, and minimise the reliance on the detector for quantification and identification purposes. This, however, comes at the expense of lower sample throughput and complicated data processing in comparison to direct infusion approaches. 2 Unconventional approaches include two‐dimensional chromatography 101 , 102 , 103 , 104 , 105 or ion mobility spectrometry. 106 , 107 , 108 , 109
FIGURE 3.
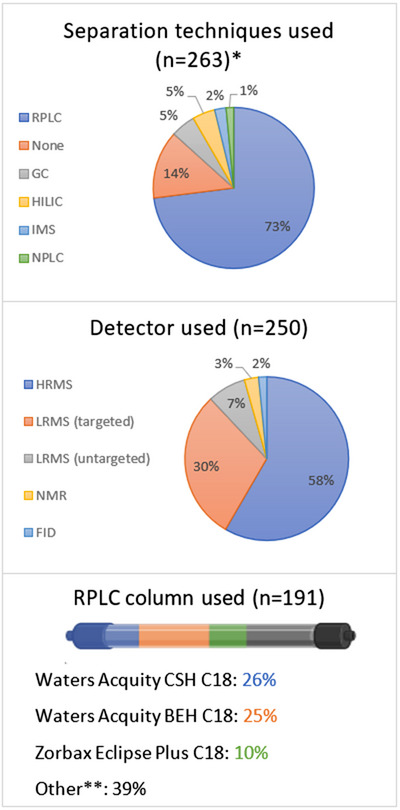
Bibliometric analyses of clinical lipidomics publications in 2022 according to separation techniques, detectors, and RPLC columns used. 51 , 60 , 61 , 68 , 77 , 155 , 156 , 157 , 166 , 177 , 178 , 179 , 180 , 181 , 182 , 183 , 184 , 185 , 186 , 187 , 188 , 189 , 190 , 191 , 192 , 193 , 194 , 195 , 196 , 197 , 198 , 199 , 200 , 201 , 202 , 203 , 204 , 205 , 206 , 212 , 213 , 214 , 215 , 232 , 233 , 234 , 235 , 236 , 237 , 238 , 239 , 240 , 241 , 242 , 243 , 244 , 245 , 246 , 247 , 248 , 249 , 250 , 251 , 252 , 253 , 254 , 255 , 256 , 257 , 258 , 259 , 260 , 261 , 262 , 263 , 264 , 265 , 266 , 267 , 268 , 269 , 270 , 271 , 272 , 273 , 274 , 275 , 276 , 277 , 278 , 279 , 280 , 281 , 282 , 283 , 284 , 285 , 286 , 287 , 288 , 289 , 290 , 291 , 292 , 293 , 294 , 295 , 296 , 297 , 298 , 299 , 300 , 301 , 302 , 303 , 304 , 305 , 310 , 311 , 312 , 313 , 314 , 322 , 323 , 324 , 325 , 326 , 327 , 328 , 329 , 330 , 331 , 332 , 333 , 334 , 335 , 345 , 346 , 347 , 348 , 349 , 350 , 351 , 352 , 353 , 354 , 355 , 356 , 357 , 358 , 359 , 360 , 361 , 362 , 363 , 364 , 365 , 366 , 367 , 368 , 369 , 370 , 371 , 372 , 373 , 374 , 375 , 376 , 377 , 378 , 379 , 380 , 381 , 382 , 383 , 384 , 385 , 386 , 387 , 388 , 389 , 390 , 391 , 392 , 393 , 394 , 395 , 396 , 397 , 398 , 399 , 400 , 401 , 402 , 403 , 404 , 405 , 406 , 407 , 408 , 409 , 410 , 411 , 412 , 413 , 414 , 415 , 416 , 417 , 418 , 419 , 420 , 421 , 422 , 423 , 424 , 425 , 426 , 427 , 428 , 429 , 430 , 431 , 432 , 433 , 434 , 435 , 436 , 437 , 438 , 439 , 440 , 441 , 442 , 443 , 444 , 445 , 446 , 447 , 448 , 449 , 450 , 451 , 452 , 453 , 454 , 455 , 456 , 457 All legends are in order of largest to smallest percentage. *Note: All techniques that represent ≥1.0% of total publications have been reported. **Note: all "Other" named columns constituted ≤5% of publications. The column image has been created in BioRender.com. Key: NPLC = normal‐phase liquid chromatography, RPLC = reversed‐phase liquid chromatography, HILIC = hydrophilic interaction liquid chromatography, GC = gas chromatography, IMS = ion mobility spectrometry, HRMS = high‐resolution mass spectrometry, LRMS = low‐resolution mass spectrometry, FID = flame ionisation detector, NMR = nuclear magnetic resonance.
GC separates compounds based primarily on differences in volatility combined with interactions with the stationary phase. 110 Lipids generally have low volatility and for any carboxylic acids, there can be interactions with stationary phase siloxane groups that result in undesirable late‐eluting broad peaks. To combat this, derivatisation approaches, such as transesterification to fatty acid methyl esters, silylation to trimethylsilyl esters and charge‐switch derivatisation, are performed. 41 , 79 , 80 , 81 , 82 Derivatisations are laborious and tend to complicate interpretation due to the presence of derivatisation artifacts 111 ; however, a key advantage of derivatisation is its selectivity. Derivatisation typically targets specific chemical functionalities, which means that for complex biological samples, this theoretically could limit the number of analytes in GC‐MS chromatograms, allowing easier interpretation and quantification.
Unlike GC, LC is not limited to volatile compounds. LC separates compounds based on interactions of the sample with a mobile and stationary phase. There are many different types of LC, but generally, reversed‐phase LC (RPLC) for nonpolar separations and hydrophilic interaction LC (HILIC) for polar separations are the most popular. As a rule of thumb, RPLC will retain analytes with a logP ≥ ‐1 and HILIC will retain analytes with a logP ≤ 1. 112 , 113 Based on the physicochemical properties of lipids (Table 1), it comes as no surprise that RPLC continues to be the most popular separation technique, accounting for 73% of the literature published in 2022 (Figure 4).
FIGURE 4.
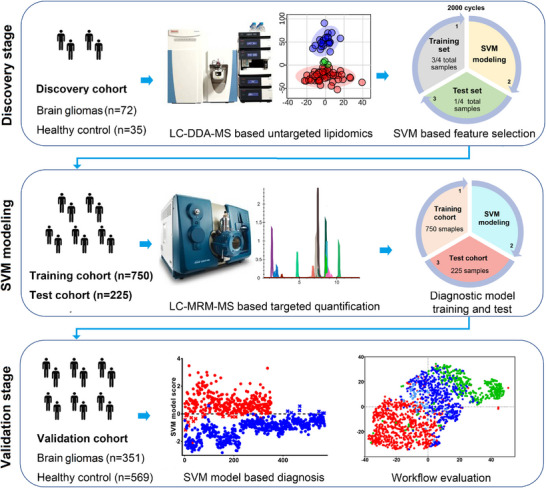
The study design and development of a liquid chromatography‐mass spectrometry (LC‐MS) method from initial biomarker discovery to validation for the diagnosis of malignant brain gliomas. Towards the left of every panel, notice the increase in cohort size as the method enter validation to make it more meaningful for clinical implementation. In the middle of the first two panels, see how the discovery was performed using untargeted high‐resolution MS (HRMS) analysis for screening all lipids and showing clear discrimination between healthy versus disease through a principal component analysis (PCA) plot, whereas the clinical method uses a simpler, targeted method for quantification. Finally, towards the right of the first two panels, see how machine learning through support vector machine modelling is applied, where the model is trained and validated after each study. Reprinted with permission. 155
RPLC uses a nonpolar stationary phase and a polar aqueous mobile phase to generally elute analytes in order of decreasing polarity. Analytes are separated according to two phenomena, namely partitioning and/or adsorption via hydrophobic interactions to the bonded stationary phase. The degree to which each phenomenon contributes to an analyte's retention varies but has been shown through molecular simulations to be dependent on stationary phase alkyl chain length and functional group type. 114 For lipidomics, the retention order predominantly relies on the analyte alkyl chain length and degree of unsaturation. 115 The most popular RPLC columns in 2022 were the Acquity CSH column (26%), the Acquity BEH C18 column (25%), and the Zorbax Eclipse Plus C18 (10%) (Figure 3).
HILIC uses a polar stationary phase and a nonpolar organic‐rich mobile phase to generally elute analytes in order of increasing polarity. It is a variant of normal‐phase LC (NPLC) and complementary to RPLC. Due to a water‐enriched layer adsorbed onto the stationary phase, HILIC separates ions using a mixed‐mode retention mechanism. This mechanism will involve, to different degrees, the following phenomena: hydrophilic partitioning between the mobile phase and the water layer, adsorption to the stationary phase, and/or electrostatic interactions and hydrogen bonding with the stationary phase moieties. The retention order predominantly relies on the lipid headgroup polarity. 106 , 116 Example lipids analysed by HILIC include ceramides, glycerolipids, glycolipids, phospholipids, and sphingolipids. 102 , 106 , 116 , 117 , 118 , 119
2.3.2. Detection
Due to its high sensitivity and specificity, it comes as no surprise that MS was the most popular detector in 2022, accounting for an overall 95% of the literature published in 2022 with high‐resolution MS (HRMS) making up 58% and low‐resolution MS (LRMS) making up 37% (Figure 3). MS is an analytical technique that creates gas‐phase ions from atoms or molecules and measures their mass‐to‐charge ratios (m/z). 120 Mass spectrometers discriminate between ions of different m/z by subjecting them to constant, pulsed, or periodically time‐varying electric and/or magnetic fields. 121 For lipidomics, mass spectrometers are the detectors of choice, where they are capable of (but not limited to): 1) molecular mass, elemental, and isotopic composition determinations, 2) structural elucidation, and 3) quantification. HRMS is commonly defined as mass spectrometers that are capable of resolving powers ≥ 10,000 full‐width at half maximum (FWHM). Generally, HRMS, such as time‐of‐flight and orbitraps, would be used for untargeted analyses due to their higher resolving powers that allow accurate mass measurements, improvements in signal:background ratios, and wider mass ranges. For targeted applications and quantitative approaches, LRMS, such as triple quadrupoles in tandem, are commonly used for their high specificity, sensitivity, and wide linear dynamic ranges.
There are three main mass spectrometric approaches: direct‐infusion MS (termed “shotgun” lipidomics), chromatographically coupled MS (typically LC or GC), or MS imaging (MSI). Key aspects that could influence the approach chosen include matrix effects, confidence in identification, and ease of quantification. Matrix effects, in particular, ion suppression by more dominant and/or easily ionisable lipid species, such as phospholipids, 122 , 123 , 124 , 125 is a major challenge in lipidomics. This problem is more pronounced for shotgun lipidomics as all lipid species are analysed simultaneously, which consequently leads to detection problems concerning low‐level lipid species. Ion suppression can be overcome by either incorporating chromatography or derivatisation. 41 , 79 It is important to note that LC (RPLC or HILIC) can readily separate different lipid classes and therefore resolve their lipid‐lipid interactions and suppression (i.e., interclass interactions), but within‐class interactions (i.e., intraclass interactions) could be significantly increased and this could counterproductively result in greater ion suppression at large concentrations. 101 , 126 In terms of identifications, shotgun lipidomics and MSI offer less confidence due to the lack of molecular separation and retention time information; whereas, through chromatographic coupling, ions are separated from one another prior to detection adding confidence in identification at the expense of more chemical waste and low throughput due to longer analytical run times. Finally, for quantification, in shotgun lipidomics, the steady ionisation environment allows robust quantification using a lipid standard mix with one compound of each lipid class. This approach is dissimilar to chromatographically coupled MS or MSI because the ionisation environment is constantly changing. This means that more thorough calibration work is needed for quantification. 80 Further, MSI analyses lipids in situ with the key advantage of capturing spatial information about the analyte. 127
For untargeted screening methods, the HRMS acquisition modes typically used are full scan, data‐dependent acquisition (DDA), and data‐independent acquisition (DIA). Full scan is an MS1 approach that obtains all m/z measurements across a defined m/z window. In DDA mode, the HRMS performs a full scan on MS1 followed by an MS2 analysis of select precursor ions for structural information. This selection is intensity‐based, which means that the DDA data are biased and lower‐intensity lipids will therefore not have any associated MS2 data. In DIA mode, the HRMS performs a full scan on MS1 followed by an MS2 analysis of all precursor ions through instrument cycles. Commonly used DIA methods include all‐ion fragmentation (AIF) or sequential window of all theoretical fragment‐ion spectra (SWATH). 128 The main advantage of DIA is that it is less biased than DDA and there is no undersampling of peaks. Therefore, all precursor peaks are fragmented; however, this results in more complicated MS/MS spectra, often losing the connection between the product ions to their precursor due to ion overlap. 129 , 130 Several studies highlight the loss of 2‐5x sensitivity when using DIA versus DDA or full scan modes. 131 , 132 , 133 For more information, the following reviews are recommended. 129 , 131 , 134
Based on information from discovery experiments and/or literature, targeted lipidomics experiments can be performed, where a pre‐defined set of lipids with a known m/z of precursor and product ions are analysed in a quantitative manner across large sample sets. Here, selected or multiple reaction monitoring (SRM/MRM) on triple quadrupole instrumentation, and recently parallel reaction monitoring (PRM) on quadrupole time‐of‐flight and orbitraps are employed. 135 Specialised tools, such as LipidCreator 136 and METLIN‐MRM, 137 can aid experimental method development and processing steps. In comparison to untargeted data processing (discussed below), the post‐acquisition processing of targeted data is relatively straightforward using open‐access tools, such as Skyline 138 or XCMS‐MRM, 137 or vendor software, such as TargetLynx, 139 that can automate peak integration, relative and absolute quantification, and evaluate data quality. 140
2.4. Data processing
The high‐throughput nature of lipidomics and the ‘big data’ generated, in particular for untargeted experiments, results in high complexity analysis that has become heavily reliant on statistical testing, mathematical treatment, and computational algorithms. 141 , 142 First, raw data are typically converted to a data format that is compatible with downstream processing through either commercial software packages, such as Progenesis QI, 143 or freely available ones, such as MSConvert that allow a direct conversion of raw data that can be read by software programs, such as MetaboAnalyst, 144 after deconvolution using software such as MZmine, 145 or packages such as XCMS 146 or eRah 147 in R. These programs use algorithms for spectral filtering, baseline correction, peak alignments, normalisation, peak picking, and putative annotations. An example of these programs is the peak detection tool “NeatMS”, which was published by Gloaguen et al. in 2022, to combat the current challenges of irreproducibility and peak overpicking experienced in omics data post‐acquisition. It is an open‐source automated tool that uses machine learning to better differentiate between chemical signals and noise that can readily be added to existing workflows. 148
Then, advanced biostatistical tools are applied to analyse and interpret the data in the context of clinical information. After all, the assumption behind the collection of these lipidomics data is that the co‐variation of a small set of analyte abundances should inform the biological phenomenon being studied. The challenge here is to identify and isolate the lipids that are specific to the phenomenon from the ones that are not relevant. Supervised or unsupervised statistical methods are used. Briefly, these include (but are not limited to) approaches, such as partial least squares discriminant analysis (PLS‐DA), orthogonal projection to latent structure discriminant analysis (OPLS‐DA), and principal component analysis (PCA). 142 , 149 From this, analytes of interest observed to be specific to the biological phenomenon can be further identified through automated programmatic approaches to allow database searching 140 and/or subjected to pathway analysis. Through pathway analyses, the dysregulated lipids observed can be associated with specific metabolic pathways, potentially representing the body's response to a disease or drug treatment (Figure 6). 150 , 151
FIGURE 6.
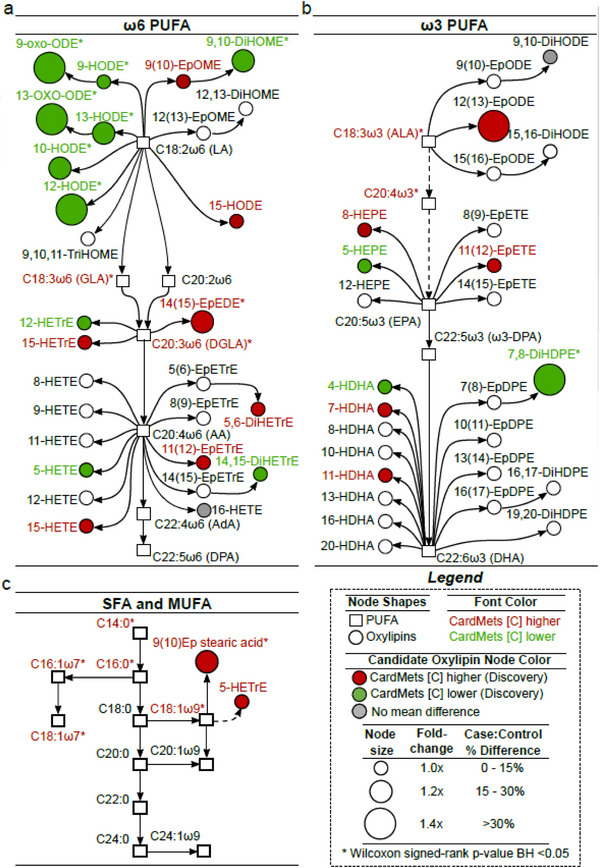
Pathway analysis of oxylipins (n = 54; circles) and fatty acids (n = 25; squares) identified that can discriminate patients with MetS from controls. The metabolic pathways of oxylipin biosynthesis from omega‐6 PUFA (A), omega‐3 PUFA (B), and SFA/MUFAs (C). The oxylipins of interest from the analytical testing are highlighted in colour, where red = upregulated in metabolic syndrome patients, green = downregulated in metabolic syndrome patients, and grey = no difference. Dashed lines represent indirect pathways including intermediate metabolites. Size of nodes represents fold changes between the two cohorts. Reprinted with permission. 294
Finally, as part of the big data revolution, machine learning has gained popularity for building models, e.g. diagnostic tests, to help translate research into clinical practice. Machine learning is the study of computational algorithms that make predictions and decisions based on experience and data, without being explicitly programmed. 152 It is an approach to data analysis that involves building and adapting models to “learn” from experience to further improve their ability to make predictions. 153 , 154 A good example of machine learning applications as applied to biomarker discovery is shown in the articles by Zhou et al. (Figure 4) 155 and Wang et al. 156 Machine learning algorithms, such as lasso (or ridge) regressions, decision trees, support vector machines (ensembles or wrappers of these), and artificial neural networks, are powerful tools for pattern recognition or classification that have significantly accelerated the identification of biomarkers. Interestingly, in Luan et al.’s biomarker discovery work studying spontaneous miscarriage in IVF‐ET women, they approach machine learning in a systematic approach, whereby five classifiers and four feature selection methods were optimised to give the best classification model with the highest accuracy and stability. 157
3. 2022 IN REVIEW: RESULTS AND DISCUSSION
It is known that many diseases are characterised by lipid dysregulation. Lipidomics articles within clinical research generally have two main objectives: to understand molecular mechanisms of lipid metabolisms or establish diagnostic biomarkers. Biomarker studies aim to translate to routine clinical practice; whereas, physiological mechanism studies lend themselves to understanding disease manifestations, identifying therapeutic drug targets, and aiding drug development. To translate this to clinical lipidomics, these profiles need to be integrated with patient phenotypes to potentially identify disease severity‐, duration‐, stage‐, subtype‐ and prognosis‐specific lipidome changes. 45
A biomarker is defined as: “A defined characteristic that is measured as an indicator of normal biological processes, pathogenic processes, or biological responses to an exposure or intervention, including therapeutic interventions”. 158 An ideal biomarker should be: 1) binary or at least quantifiable, 2) the testing should have a turnaround speed appropriate to the clinical indication and be adoptable into routine clinical practice, 3) highly sensitive and/or specific and 4) readily detectable in a non‐invasive biofluid. There are essential method development steps (Figure 4) to establish biomarkers for a disease, namely biomarker discovery and validation. A panel of biomarkers may be used for better performance in terms of diagnostic accuracy. 159 , 160 , 161 , 162 , 163 In the following sections, selected research articles from the most popular subject areas of 2022 will be briefly discussed: oncology, metabolic diseases (e.g. cardiovascular disease (CVD), diabetes, liver disease, and obesity), and infectious diseases (Figure 5).
FIGURE 5.
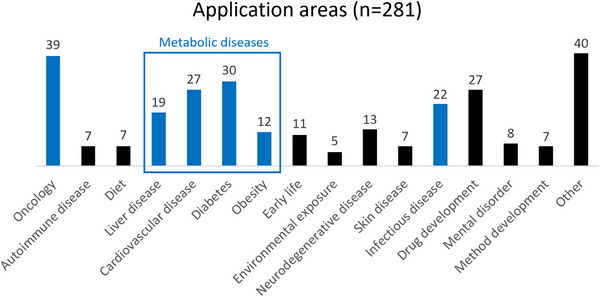
Application areas with ≥ 5 publications have been represented. Application areas with < 5 publications have been sorted under “Other”. *Note: “Early life” combines pregnancy and infant lipidomics studies. Application areas in blue are discussed in this review.
3.1. Oncology
Cancer is the second largest cause of death worldwide with an overall incidence rate of 20.2% over a human lifetime. 164 It has been shown that lipid metabolism in cells is drastically elevated during the different stages of cancer development. 165 , 166 , 167 Increased lipids are needed for plasma membrane synthesis and energy production, but also influence cell membrane compositions to favour metastasis and trigger signalling events within cancer cells. Further, these increased lipids also facilitate metabolic crosstalk between the tumour and surrounding cells within the tumour microenvironment. 165 , 167 The upregulation of fatty acids and cholesterol are common in cancer as their synthetic pathways help facilitate cell proliferation 168 and tumour growth, 169 respectively. Further, lysophospholipid levels have been associated with cancer cell migration, invasion ability of cancer cells, and potentially tumour immunity. 170 , 171 , 172 , 173 Lipidomic analyses have revealed cancer‐specific lipid dysregulations that could potentially serve as promising biomarkers for screening purposes, 174 , 175 as demonstrated by Lee et al. in a plasma analysis of 140 human samples that could differentiate five cancers (liver, lung, gastric, colorectal, and thyroid). 176 It is therefore of no surprise with its known lipid dysregulation and urgency that oncology was the biggest application area in 2022, where the following cancers were studied: bladder, 177 brain, 155 breast, 178 , 179 , 180 , 181 , 182 colorectal, 183 , 184 , 185 , 186 , 187 , 188 endometrial, 189 gallbladder, 190 gastric, 191 kidney, 192 liver, 193 , 194 , 195 , 196 , 197 lungs, 156 , 198 , 199 , 200 nasopharyngeal, 201 ovarian, 202 paediatric, 203 prostate, 204 , 205 and skin. 206
To maximize the survival rates of cancer patients, it is important to identify cancer at its early stages, where tumours can be surgically removed or treated with milder drug regimens. 207 The average 5‐year survival rate in the early stages is 91%; whereas, the average 5‐year survival rate in the late stages is 26%. 208 The most common cancers for men are prostate (20%), lung and bronchus (13%), and colorectal (9%) cancers; whereas, for women, they are breast (30%), lung and bronchus (13%), and colorectal (8%) cancers. 208 The “harder to suspect” cancers due to non‐specific symptoms that typically require multiple consultations that delay diagnosis are multiple myeloma, pancreatic cancer, ovarian, stomach, and lung cancers. 209 Wang et al. discovered for early‐stage lung cancer that the lipid metabolism was dysregulated with the glycerophospholipid metabolism being the most altered. For biomarker discovery, untargeted RPLC‐HRMS analysis of plasma samples revealed nine key lipids for early‐stage cancer detection. Using these, a targeted RPLC‐MS/MS method with a run time of 19 min was developed to separate and quantify these lipids. This assay reached 100% specificity on the validation cohort, and subsequently, out of 1,145 participants from different medical centres, achieved more than 90% sensitivity and 92% specificity. 156
Tumour formation is characterised by the successful circumvention of cell death regulation to allow unlimited replication and immortality. 210 Ferroptosis is a newly identified iron‐dependent form of cell death driven by lipid peroxidation that has garnered interest in the scientific community for its potential as an alternative cancer therapy. 211 Traditional tumour treatments, such as chemotherapy and radiotherapy, are often not as effective due to the breadth of their targets and tumour cell tolerance. 210 , 211 Ferroptosis activation may be a potential strategy for treating cancers that are unsuccessfully targeted by conventional therapies. Zhang et al. used untargeted RPLC‐HRMS analyses of cells to study the molecular mechanisms of ferroptosis, namely the sensors and their link to the amplification process of lipid peroxidation. The enzyme protein kinase C βII (PKCβII) was found critical in ferroptosis in its role of phosphorylation and activating the enzyme Acyl‐CoA synthetase long‐chain family member 4 (ACSL4) required for the lipid peroxidation. The activation of the PKCβII‐ACSL4 pathway could be a potential therapeutic target. 212 Further, Liao et al. showed that T cell‐derived interferon (IFN)γ with arachidonic acid‐induced tumour ferroptosis through the activation of ACSL4 pathway by several methods, including a targeted phospholipid analysis using NPLC‐MS/MS. These data demonstrated how T cells can selectively reprogram tumour cells via the IFNγ signalling pathway. Potential supplementation of arachidonic acid could be an effective therapy for tumour regression. 213
To understand how lipidomics could be used to influence treatment decisions, three studies focusing on drug development will be discussed. Chen et al. demonstrated using untargeted ambient single‐cell HRMS that metformin, an oral antidiabetic drug, has a synergistic effect with the cancer drug irinotecan (IRI) to overcome the drug resistance of previously IRI‐resistant colorectal cancer cells. This was done by studying the metabolome changes in model systems of drug‐resistant cancer cells with both metformin monotherapy and metformin/IRI co‐therapy. Metformin monotherapy induced downregulation of lipids and fatty acids, potentially through the inhibition of fatty acid synthase, whereas co‐treatment resulted in reduced production of ceramide phosphoethanolamine. 214 Antona et al. explored drug repurposing to identify new potential therapies for colorectal cancer that are overall quicker and cheaper than de novo drug synthesis. Spiperone, an antipsychotic drug, was shown to have anticancer effects by inducing apoptosis in colorectal cancer cells. The drug action involved phospholipase C activation, intracellular calcium homeostasis dysregulation, and endoplasmic reticulum stress induction, which caused significant lipid metabolism alterations. This study used several techniques including untargeted RPLC‐HRMS to study drug‐induced changes to the overall cancer cell lipidome. 186 Hatfield et al. analysed the pretransplant serum of patients receiving allogeneic stem cell transplantation to treat haematological malignancies using untargeted DI‐MS/MS. These procedures have a high risk of treatment‐related morbidity and mortality. Through hierarchical clustering analyses, associations between pretransplant lipid profiles and posttransplant complications (including death due to disease relapse or treatment toxicity) were found, demonstrating that patients could be subclassified prior to transplants to direct therapies and inform treatment outcomes according to the individual. 215
3.2. Metabolic diseases
Metabolic diseases occur when abnormal chemical reactions disrupt the body's metabolism. Due to modern sedentary lifestyles and changed nutritional behaviours, they are becoming increasingly prevalent worldwide and currently pose a large burden on global healthcare systems. 216 , 217 The major metabolic diseases include type 2 diabetes (T2D), NAFLD and metabolic syndrome (MetS). Of these, T2D affects more than 200 million people 216 and NAFLD affects an estimated one‐third of the adult population worldwide. 218 There has been an alarming increase in MetS 219 , 220 with an estimated prevalence in 1/4th of the global population. 221 , 222 MetS, also known as syndrome X, 223 insulin resistance syndrome, 224 and the deadly quartet, 225 refers to the co‐occurrence of several cardiovascular risk factors, such as glucose intolerance, obesity, insulin resistance, hypertension and dyslipidaemia. 226 MetS is closely associated with the development of T2D, fatty liver, CVD, and cancer. 227 , 228 , 229 , 230 , 231 Due to the elevated risk of mortality with these diseases, there is a need for strategies in its identification, prevention, and treatment within healthcare. In 2022, as evidenced in Figure 5, the bulk of research articles focussed on related diseases: CVD, 232 , 233 , 234 , 235 , 236 , 237 , 238 , 239 , 240 , 241 , 242 , 243 , 244 , 245 , 246 , 247 , 248 , 249 , 250 , 251 , 252 , 253 , 254 , 255 diabetes, 166 , 233 , 249 , 250 , 256 , 257 , 258 , 259 , 260 , 261 , 262 , 263 , 264 , 265 , 266 , 267 , 268 , 269 , 270 , 271 , 272 , 273 , 274 , 275 , 276 , 277 , 278 liver disease, 51 , 279 , 280 , 281 , 282 , 283 , 284 , 285 , 286 , 287 , 288 , 289 , 290 , 291 , 292 , 293 MetS 277 , 294 , 295 and obesity. 277 , 295 , 296 , 297 , 298 , 299 , 300 , 301 , 302 , 303 , 304 , 305
Coleman et al. investigated the pathogenesis and involvement of the gastrointestinal tract with the syndrome through multiple experiments including an untargeted RPLC‐MS/MS analysis of faecal samples of people with MetS and healthy controls. No signs of intestinal inflammation or increased permeability were found in the MetS patients compared to the controls; however, significant increases in 417 lipid features, including various glycerolipids, glycerophospholipids, sphingolipids, fatty acyls, and polyketides, in the gut lipidome were observed, suggesting alterations of the intestinal host‐microbiota metabolism. 277 Further, Dalle et al. quantitatively analysed plasma for over 130 oxylipins of 476 participants using two orthogonal analytical platforms for added confidence: targeted RPLC‐MS/MS and GC‐MS using fatty acid methyl ester derivatisation. This work demonstrates how a comprehensive understanding of oxylipins as lipid mediators, regulating many cardiometabolic functions, can help elucidate MetS pathophysiology through effective pathway analysis (Figure 6). Some of these oxylipins are directly linked to key molecular pathways, including oxidative stress, inflammation, blood clotting, glucose homeostasis, and adipogenesis, providing additional information that is not provided by the current clinical diagnostic tests. A classification model of 23 oxylipins was developed to stratify patients with MetS at risk of cardiometabolic diseases. 294
Several groups performed large‐cohort longitudinal lipidomics experiments to develop models for disease prognosis. By studying the plasma samples of 4,067 participants over 23 years using DI‐HRMS, Lauber et al. applied machine learning models to develop a lipidomics‐based risk score using 184 lipid concentrations to assess a patient's future risk of developing T2D, CVD, and obesity. Individual lipidomes are stratified into different classifications (low‐high risk) such that interventions could be introduced years before disease incidence for prevention. 233 Al‐Sari et al. used a combination of clinical measurements and omics analyses of plasma samples of 537 participants with type 1 diabetes over 5 years to develop risk scores using machine learning approaches to predict a patient's progression to diabetes complications, such as diabetic kidney disease or diabetic retinopathy. Lipidomic analyses were performed using untargeted RPLC‐HRMS. Thus, the models, using a combination of clinical measurements, metabolites, and lipids, have the potential for the early detection and prevention of complications. 276
3.3. Infectious diseases
Infectious diseases are illnesses caused by microorganisms, such as bacteria, viruses, fungi, or parasites, that are transmitted from an infected person, animal, or object to a susceptible host. According to the World Health Organisation (WHO), they cause an estimated quarter of all deaths worldwide 306 and this number is only expected to grow with climate change, issues with global food supply chains, and international travel that allow these diseases to spread. Globally, it is the leading cause of childhood mortality. 307 As lipids combine with other metabolites and specific pathways to support the human lifecycle, these compounds are involved in the interplay between the infectious agent and its host. This includes how pathogens become internalised into the host's cells, interactions between the pathogen and the host's lipid metabolism and microbiota, and the immune system. 308 , 309 Malaria, tuberculosis, and Human immunodeficiency virus/acquired immunodeficiency syndrome (HIV/AIDS) remain within the 10 top causes of death in low‐ to middle‐income countries. 306 These diseases have been subject to clinical lipidomics experiments to further disease understanding and manifestation. 310 , 311 , 312 , 313 , 314
Tuberculosis (TB) is a highly contagious airborne disease, dating back more than 9,000 years, 315 caused by the bacteria Mycobacterium tuberculosis. In 2020, the WHO reported an estimated 10 million new tuberculosis cases and 1.5 million TB‐related deaths globally with two‐thirds of the cases spread across eight countries: India, China, Indonesia, Philippines, Pakistan, Nigeria, Bangladesh, and South Africa. 316 Brandenburg et al. showed by using a targeted shotgun HRMS analysis that tuberculostearic acid (FA 19:0; TSA)‐containing phosphatidylinositols (PI) are molecular markers of infection with clinically relevant M. tuberculosis complex strains and signify bacterial burden. They developed an indirect, culture‐free targeted lipid assay for bacterial cultures that can be performed within a day (30x faster than conventional methods) to measure the pathogen loads of M. tuberculosis in infected murine microphages, human neutrophils, and murine lung tissue. These PIs were found to be enriched in peripheral blood mononuclear cells (PBMCs) from active TB patients. The focus on PBMC analysis instead of blood analysis was chosen to avoid variation caused by the metabolic state of patients. 310
HIV is a virus that attacks the body's immune system with the most advanced infection stage being AIDS. 317 According to the WHO, there were 1.5 million new HIV cases and approximately 650,000 HIV‐related deaths in 2021. 318 Sub‐Saharan Africa contains a disproportionate amount of HIV cases, accounting for more than 70% of all global cases. 318 , 319 , 320 Masip et al. studied plasma samples using untargeted RPLC‐HRMS of long‐term elite controllers (LTECs), a small subset of HIV individuals that have long‐term viral and immunological HIV control that are used as models of a functional cure, using untargeted RPLC‐HRMS. Here, a panel of 45 lipids could differentiate the clinical outcome of LTEC individuals on whether they are losing viral and/or immunological control, which could inform therapeutic interventions. 311 Wang et al. analysed plasma samples using RPLC‐HRMS of women with or at high risk of HIV to study alterations in host gut microbiota upon infection. The data together with network analysis showed positive associations between enriched pathogenic gut bacteria Fusobacterium and Proteus to the host lipidomic and metabolomic profiles, particularly in lysophosphatidylcholines (PC), lysophosphatidylethanolamines (PE), and diglycerides, which are associated with the progression of atherosclerosis. 252
Severe acute respiratory syndrome coronavirus 2 (SARS‐CoV‐2) is a positive‐sense RNA virus responsible for the global coronavirus disease 2019 (COVID‐19) pandemic that started in 2019 with more than 660 million people infected and more than 6.7 million deaths (on 12th January 2023). 321 Since its outbreak in 2019, the world population has experienced a drastic change in lifestyle due to the unpredictable nature of the disease. Despite the explosive efforts by the scientific community, there remain many questions regarding its pathological mechanisms, treatment, and the clinical management of patients that research groups have attempted to address through lipidomics experiments. 322 , 323 , 324 , 325 , 326 , 327 , 328 , 329 , 330 , 331 , 332 , 333 , 334 , 335
Castañé et al. analysed serum using RPLC‐HRMS in a semi‐quantitative approach to compare the lipidomic signatures of hospitalised COVID‐19 patients against disease controls (other infectious/inflammatory diseases, e.g. CVD, diabetes, kidney diseases and cancer) and healthy controls. Clear differences in acylcarnitines, fatty acids, and oxylipins were observed between COVID‐19 and healthy patients, but more importantly, this study shows how many of these lipid alterations were not specific to COVID‐19 patients and was shared with other infectious/inflammatory diseases. Altered levels in oxylipins, bile acids, and glycerophospholipids were found to best distinguish between COVID‐19 and negative controls. 323
Biagini et al. quantified the plasma levels of 48 oxylipins and five cytokines using micro‐extraction by packed sorbent (MEPS)‐RPLC‐MS/MS of hospitalised COVID‐19 ward and ICU patients to study their inflammatory responses to COVID‐19, in particular the cytokine and oxylipin storms. 336 Here, ICU patients were found to have significantly lower levels of oxylipins, suggesting an impaired inflammatory response that would put them at higher risk of severe viral attacks. 328 Similarly, Karu et al. quantified the plasma levels of 63 signalling lipids (free fatty acids, oxylipins and their intermediates, and immune‐active endocannabinoids) by RPLC‐MS/MS to understand COVID‐19 severity and progression. Substantial differences between the signalling lipid profiles of COVID‐19 patients were found at varying disease stages. The metabolic picture of severe patients was correlated with persistent inflammation and a disruption in the balance of signalling lipids, which could potentially prevent an effective shift into the resolution of inflammation. 330
Finally, Saud et al. studied the molecular composition of the SARS‐CoV‐2 lipid envelope using virus particles by HILIC‐MS/MS. This knowledge is important to design anti‐viral agents as well as improve our understanding of viral‐host interactions, infectivity, pathogenicity, and immune system clearance. The SARS‐CoV‐2 lipid membrane was observed to be primarily composed of PC, PE, and PI with a high proportion of external aminophospholipids. The molecular fatty acyl species may vary depending on the host cell. Further, in vitro and randomised controlled clinical studies of COVID‐19 patients using surfactant‐containing mouthwashes were found to be a potential antiviral approach for wider prevention and societal control strategies. 322
3.4. Future perspectives
In this review, we have demonstrated the relevance of lipidomics data for the elucidation of potential biomarkers and disease mechanisms in clinical studies. With future development, these could improve the diagnosis and prognosis of various diseases and be used to predict and measure treatment efficacy. They are largely not yet ready to be used in a clinical setting, as reflected by the low number of omics‐based biomarkers that have been approved by regulatory agencies and used in clinical settings, 337 , 338 and consequently, omics technologies are often perceived as over‐promising and/or underdelivering in clinical applications. The main challenges here include the inappropriate design of clinical trials and lack of validation, 339 , 340 and the difficulty and lack of standardisation of analytical methods. 339 , 340 , 341 With the number of lipidomics research articles concerning biomarker discovery continually increasing, there is a growing demand to convert these complex multivariate signatures into reliable cost‐effective assays that can routinely be used in practice. Lipidomics plays a key role here in first discovering a biomarker in a small cohort, then trialling its suitability through larger, validation cohorts with diverse participants for representation and inclusion, before translating its detection to a cheaper reliable method that can be used by the wider community at a clinic or at home (exemplified in Figure 4). 342
An exciting opportunity for clinical lipidomics is precision medicine (also known as personalised medicine), which aims to provide individualised healthcare in terms of disease treatment and prevention. It involves assessing the genotype and/or phenotype of a patient before treatment to more accurately and comprehensively direct therapy, 340 , 343 acknowledging the importance of an individual's characteristics in response to treatment. It would rework the current healthcare practices, from the one‐size‐fits‐all approach typically after a patient reports symptoms to one that tests a patient with an ability to preventatively predict diseases and determine which medical treatments will be safest and most effective for the individual patient. 343 This approach is more likely to detect non‐communicable diseases. According to Leroy Hood, a pioneer in this area, precision medicine promises to 1) provide deep insights into disease mechanisms, 2) make blood a diagnostic window for both the health and disease of an individual, 3) stratify complex diseases into subtypes, 4) provide new ways to drug target discovery, and 5) generate metrics for evaluating wellness. 341 It aims to be preventative, predictive, personalised, and participatory (termed “P4 medicine”). 341 According to the International Consortium for Personalised Medicine (ICPerMed), the implementation of precision medicine is targeted to be before 2030. 344
4. CONCLUSION
In conclusion, the most popular clinical research areas of 2022 in lipidomics were oncology, metabolic diseases (e.g. CVD, diabetes, liver disease and obesity), drug development, and infectious diseases. This is likely due to both their urgency and their known lipid dysregulations. MS‐based lipid analyses and sophisticated bioinformatics approaches are growing in parallel and can revolutionise lipidomic research. Still in its infancy, lipidomics has a strong potential to change the face of current clinical practices for disease stratification and precision medicine approaches; however, clear hurdles, such as the difficulty to convert complex laboratory procedures to simple reliable tests, lack of clinical sizes and validation cohorts for regulatory approval, prevent its current translation.
AUTHOR CONTRIBUTIONS
Caroline Géhin: Conceptualisation, investigation, visualisation, and writing—original draft. Stephen J. Fowler: Reviewing and editing. Drupad K. Trivedi: Conceptualisation, reviewing, and editing.
CONFLICT OF INTEREST STATEMENT
The authors declare no conflict of interest.
Géhin C, Fowler SJ, Trivedi DK. Chewing the fat: How lipidomics is changing our understanding of human health and disease in 2022. Anal Sci Adv. 2023;4:104–131. 10.1002/ansa.202300009
Footnotes
The bibliometric analysis was performed on the Google Scholar search engine (10th April 2023) using two searches: 1) an in‐text search of the keywords “lipidomics clinic*” limited to research articles in 2022 and 2) an in‐text search of the keywords “lipidomics clinic*” AND “internal standard*” limited to research articles in 2022. A percentage was calculated by dividing the number of publications for search #2 by search #1, then multiplying by 100.
DATA AVAILABILITY STATEMENT
Data sharing is not applicable to this article as no new data were created or analysed in this study.
REFERENCES
- 1. Han X. Lipidomics for studying metabolism. Nat Rev Endocrinol. 2016;12:668‐679. 10.1038/nrendo.2016.98 [DOI] [PubMed] [Google Scholar]
- 2. Yang K, Han X. Lipidomics: techniques, applications, and outcomes related to biomedical sciences. Trends Biochem Sci. 2016;41:954‐969. 10.1016/j.tibs.2016.08.010 [DOI] [PMC free article] [PubMed] [Google Scholar]
- 3. Benedusi V. Lipidomics . Mater Methods. 2018;8:2665. 10.13070/mm.en.8.2665 [DOI] [Google Scholar]
- 4. O'Donnell VB, Ekroos K, Liebisch G, Wakelam M. Lipidomics: current state of the art in a fast moving field. Wiley Interdiscip Rev Syst Biol Med. 2020;12:e1466. 10.1002/wsbm.1466 [DOI] [PubMed] [Google Scholar]
- 5. Muro E, Atilla‐Gokcumen GE, Eggert US. Lipids in cell biology: how can we understand them better? Mol Biol Cell. 2014;25:1819‐1823. 10.1091/mbc.e13-09-0516 [DOI] [PMC free article] [PubMed] [Google Scholar]
- 6. Gross RW. The evolution of lipidomics through space and time. Biochim Biophys Acta Mol Cell Biol Lipids. 2017;1862:731‐739. 10.1016/j.bbalip.2017.04.006 [DOI] [PMC free article] [PubMed] [Google Scholar]
- 7. Hinterwirth H, Stegemann C, Lipidomics Mayr M.. Circ Cardiovasc Genet. 2014;7:941‐954. 10.1161/CIRCGENETICS.114.000550 [DOI] [PubMed] [Google Scholar]
- 8. Fahy E, Cotter D, Sud M, Subramaniam S. Lipid classification, structures and tools. Biochim Biophys Acta Mol Cell Biol Lipids. 2011;1811:637‐647. 10.1016/j.bbalip.2011.06.009 [DOI] [PMC free article] [PubMed] [Google Scholar]
- 9. Dennis EA. Lipidomics joins the omics evolution. Proc Natl Acad Sci. 2009;106:2089‐2090. 10.1073/pnas.0812636106 [DOI] [PMC free article] [PubMed] [Google Scholar]
- 10. Züllig T, Köfeler HC. High resolution mass spectrometry in lipidomics. Mass Spectrom Rev. 2021;40:162‐176. 10.1002/mas.21627 [DOI] [PMC free article] [PubMed] [Google Scholar]
- 11. Fahy E, Subramaniam S, Brown HA, et al. A comprehensive classification system for lipids. J Lipid Res. 2005;46:839‐861. 10.1194/jlr.E400004-JLR200 [DOI] [PubMed] [Google Scholar]
- 12. LIPID MAPS Structure Database (LMSD) n.d. Accessed January 13, https://lipidmaps.org/databases/lmsd/overview 2023.
- 13. Aldana J, Romero‐Otero A, Cala MP. Exploring the lipidome: current lipid extraction techniques for mass spectrometry analysis. Metabolites. 2020;10:231. 10.3390/metabo10060231 [DOI] [PMC free article] [PubMed] [Google Scholar]
- 14. Christie WW. Lipid Analysis. Pergamon Press; 1982. [Google Scholar]
- 15. Robins SJ, Patton GM. Separation of phospholipid molecular species by high performance liquid chromatography: potentials for use in metabolic studies. J Lipid Res. 1986;27:131‐139. 10.1016/S0022-2275(20)38844-1 [DOI] [PubMed] [Google Scholar]
- 16. McCluer RH, Ullman DM, Jungalwala FB. HPLC of glycosphingolipids and phospholipids. Adv Chromatogr. 1986;25:309‐353. [PubMed] [Google Scholar]
- 17. Wood R, Harlow RD. Structural analyses of rat liver phosphoglycerides. Arch Biochem Biophys. 1969;135:272‐281. 10.1016/0003-9861(69)90540-2 [DOI] [PubMed] [Google Scholar]
- 18. Duffin KL, Henion JD, Shieh JJ. Electrospray and tandem mass spectrometric characterization of acylglycerol mixtures that are dissolved in nonpolar solvents. Anal Chem. 1991;63:1781‐1788. 10.1021/ac00017a023 [DOI] [PubMed] [Google Scholar]
- 19. ChemSpider . (‐)‐Aflatoxin B1 2023. Accessed April 12, http://www.chemspider.com/Chemical‐Structure.162470.html 2023.
- 20. ChemSrc . 1‐Palmitoyl‐2‐oleoyl‐3‐linoleoyl‐rac‐glycerol 2023. Accessed April 12, https://www.chemsrc.com/en/cas/2680‐59‐3_1030794.html 2023.
- 21. Barber M, Bordoli RS, Sedgwick RD, Tyler AN. Fast atom bombardment of solids (F.A.B.): a new ion source for mass spectrometry. J Chem Soc, Chem Commun. 1981:325‐327. 10.1039/C39810000325 [DOI] [Google Scholar]
- 22. Fenwick GR, Eagles J, Self R. Fast atom bombardment mass spectrometry of intact phospholipids and related compounds. Biol Mass Spectrom. 1983;10:382‐386. 10.1002/bms.1200100608 [DOI] [Google Scholar]
- 23. Münster H, Stein J, Budzikiewicz H. Structure analysis of underivatized phospholipids by negative ion fast atom bombardment mass spectrometry. Biomed Environ Mass Spectrom. 1986;13:423‐427. 10.1002/bms.1200130808 [DOI] [Google Scholar]
- 24. Tomer KB, Jensen NJ, Gross ML. Fast atom bombardment and tandem mass spectrometry for determining structural modification of fatty acids. Anal Chem. 1986;58:2429‐2433. 10.1021/ac00125a017 [DOI] [Google Scholar]
- 25. Wheelan P, Zirrolli JA, Murphy RC. Low‐energy fast atom bombardment tandem mass spectrometry of monohydroxy substituted unsaturated fatty acids. Biol Mass Spectrom. 1993;22:465‐473. 10.1002/bms.1200220808 [DOI] [PubMed] [Google Scholar]
- 26. Kayganich KA, Murphy RC. Fast atom bombardment tandem mass spectrometric identification of diacyl, alkylacyl, and alk‐1‐enylacyl molecular species of glycerophosphoethanolamine in human polymorphonuclear leukocytes. Anal Chem. 1992;64:2965‐2971. 10.1021/ac00047a015 [DOI] [PubMed] [Google Scholar]
- 27. Byrdwell WC, Emken EA, Neff WE, Adlof RO. Quantitative analysis of triglycerides using atmospheric pressure chemical ionization‐mass spectrometry. Lipids. 1996;31:919‐935. 10.1007/BF02522685 [DOI] [PubMed] [Google Scholar]
- 28. Cole MJ, Enke CG. Direct determination of phospholipid structures in microorganisms by fast atom bombardment triple quadrupole mass spectrometry. Anal Chem. 1991;63:1032‐1038. 10.1021/ac00010a020 [DOI] [PubMed] [Google Scholar]
- 29. Gross RW. Identification of plasmalogen as the major phospholipid constituent of cardiac sarcoplasmic reticulum. Biochemistry. 1985;24:1662‐1668. 10.1021/bi00328a014 [DOI] [PubMed] [Google Scholar]
- 30. Gross RW. High plasmalogen and arachidonic acid content of canine myocardial sarcolemma: a fast atom bombardment mass spectroscopic and gas chromatography‐mass spectroscopic characterization. Biochemistry. 1984;23:158‐165. 10.1021/bi00296a026 [DOI] [PubMed] [Google Scholar]
- 31. Fenn JB, Mann M, Meng CK, Wong SF, Whitehouse CM. Electrospray ionization for mass spectrometry of large biomolecules. Science. 1989;246:64‐71. 10.1126/science.2675315 [DOI] [PubMed] [Google Scholar]
- 32. Han X, Gross RW. Electrospray ionization mass spectroscopic analysis of human erythrocyte plasma membrane phospholipids. Proc Natl Acad Sci. 1994;91:10635‐10639. 10.1073/pnas.91.22.10635 [DOI] [PMC free article] [PubMed] [Google Scholar]
- 33. Han X, Gross RW. Structural determination of picomole amounts of phospholipids via electrospray ionization tandem mass spectrometry. J Am Soc Mass Spectrom. 1995;6:1202‐1210. 10.1016/1044-0305(95)00568-4 [DOI] [PubMed] [Google Scholar]
- 34. Han X, Gross RW. Structural determination of lysophospholipid regioisomers by electrospray ionization tandem mass spectrometry †. J Am Chem Soc. 1996;118:451‐457. 10.1021/ja952326r [DOI] [Google Scholar]
- 35. Ford DA, Han X, Horner CC, Gross RW. Accumulation of unsaturated acylcarnitine molecular species during acute myocardial ischemia: metabolic compartmentalization of products of fatty acyl chain elongation in the acylcarnitine pool. Biochemistry. 1996;35:7903‐7909. 10.1021/bi960552n [DOI] [PubMed] [Google Scholar]
- 36. Weintraub ST, Pinckard RN, Hail M, Gaskell SJ. Electrospray ionization for analysis of platelet‐activating factor. Rapid Commun Mass Spectrom. 1991;5:309‐311. 10.1002/rcm.1290050702 [DOI] [PubMed] [Google Scholar]
- 37. Han X, Yang J, Cheng H, Ye H, Gross RW. Toward fingerprinting cellular lipidomes directly from biological samples by two‐dimensional electrospray ionization mass spectrometry. Anal Biochem. 2004;330:317‐331. 10.1016/j.ab.2004.04.004 [DOI] [PubMed] [Google Scholar]
- 38. Hoischen C, Ihn W, Gura K, Gumpert J. Structural characterization of molecular phospholipid species in cytoplasmic membranes of the cell wall‐less Streptomyces hygroscopicus L form by use of electrospray ionization coupled with collision‐induced dissociation mass spectrometry. J Bacteriol. 1997;179:3437‐3442. 10.1128/jb.179.11.3437-3442.1997 [DOI] [PMC free article] [PubMed] [Google Scholar]
- 39. Kim H‐Y, Wang T‐CL, Ma Y‐C. Liquid chromatography/mass spectrometry of phospholipids using electrospray ionization. Anal Chem. 1994;66:3977‐3982. 10.1021/ac00094a020 [DOI] [PubMed] [Google Scholar]
- 40. Yang K, Cheng H, Gross RW, Han X. Automated lipid identification and quantification by multidimensional mass spectrometry‐based shotgun lipidomics. Anal Chem. 2009;81:4356‐4368. 10.1021/ac900241u [DOI] [PMC free article] [PubMed] [Google Scholar]
- 41. Köfeler HC, Ahrends R, Baker ES, et al. Recommendations for good practice in MS‐based lipidomics. J Lipid Res. 2021;62:100138. 10.1016/j.jlr.2021.100138 [DOI] [PMC free article] [PubMed] [Google Scholar]
- 42. Moore JD, Caufield W V., Shaw WA. Quantitation and standardization of lipid internal standards for mass spectroscopy. Methods Enzymol. 2007;432:351‐367. 10.1016/S0076-6879(07)32014-4 [DOI] [PubMed] [Google Scholar]
- 43. Wenk MR. Lipidomics: new tools and applications. Cell. 2010;143:888‐895. 10.1016/j.cell.2010.11.033 [DOI] [PubMed] [Google Scholar]
- 44. Meikle TG, Huynh K, Giles C, Meikle PJ. Clinical lipidomics: realizing the potential of lipid profiling. J Lipid Res. 2021;62:100127. 10.1016/j.jlr.2021.100127 [DOI] [PMC free article] [PubMed] [Google Scholar]
- 45. Lv J, Zhang L, Yan F, Wang X. Clinical lipidomics: a new way to diagnose human diseases. Clin Transl Med. 2018;7:12. 10.1186/s40169-018-0190-9 [DOI] [PMC free article] [PubMed] [Google Scholar]
- 46. Chetwynd AJ, Dunn WB, Rodriguez‐Blanco G. Collection and preparation of clinical samples for metabolomics. In: Metabolomics: From Fundamentals to Clinical Applications. Springer International Publishing; 2017. pp. 19‐44. 10.1007/978-3-319-47656-8_2 [DOI] [PubMed] [Google Scholar]
- 47. Burla B, Arita M, Arita M, et al. MS‐based lipidomics of human blood plasma: a community‐initiated position paper to develop accepted guidelines. J Lipid Res. 2018;59:2001‐2017. 10.1194/jlr.S087163 [DOI] [PMC free article] [PubMed] [Google Scholar]
- 48. Chua EC‐P, Shui G, Lee IT‐G, et al. Extensive diversity in circadian regulation of plasma lipids and evidence for different circadian metabolic phenotypes in humans. Proc Natl Acad Sci. 2013;110:14468‐14473. 10.1073/pnas.1222647110 [DOI] [PMC free article] [PubMed] [Google Scholar]
- 49. Ang JE, Revell V, Mann A, et al. Identification of human plasma metabolites exhibiting time‐of‐day variation using an untargeted liquid chromatography–mass spectrometry metabolomic approach. Chronobiol Int. 2012;29:868‐881. 10.3109/07420528.2012.699122 [DOI] [PMC free article] [PubMed] [Google Scholar]
- 50. Kasukawa T, Sugimoto M, Hida A, et al. Human blood metabolite timetable indicates internal body time. Proc Natl Acad Sci. 2012;109:15036‐15041. 10.1073/pnas.1207768109 [DOI] [PMC free article] [PubMed] [Google Scholar]
- 51. Velenosi TJ, Ben‐Yakov G, Podszun MC, et al. Postprandial plasma lipidomics reveal specific alteration of hepatic‐derived diacylglycerols in nonalcoholic fatty liver disease. Gastroenterology. 2022;162:1990‐2003. 10.1053/j.gastro.2022.03.004 [DOI] [PMC free article] [PubMed] [Google Scholar]
- 52. Gonzalez‐Covarrubias V, Dane A, Hankemeier T, Vreeken RJ. The influence of citrate, EDTA, and heparin anticoagulants to human plasma LC–MS lipidomic profiling. Metabolomics. 2013;9:337‐348. 10.1007/s11306-012-0450-4 [DOI] [Google Scholar]
- 53. Bowen RAR, Remaley AT. Interferences from blood collection tube components on clinical chemistry assays. Biochem Medica. 2014;24:31‐44. 10.11613/BM.2014.006 [DOI] [PMC free article] [PubMed] [Google Scholar]
- 54. Yin P, Peter A, Franken H, et al. Preanalytical aspects and sample quality assessment in metabolomics studies of human blood. Clin Chem. 2013;59:833‐845. 10.1373/clinchem.2012.199257 [DOI] [PubMed] [Google Scholar]
- 55. Yin P, Lehmann R, Xu G. Effects of pre‐analytical processes on blood samples used in metabolomics studies. Anal Bioanal Chem. 2015;407:4879‐4892. 10.1007/s00216-015-8565-x [DOI] [PMC free article] [PubMed] [Google Scholar]
- 56. Dorow J, Becker S, Kortz L, Thiery J, Hauschildt S, Ceglarek U. Preanalytical investigation of polyunsaturated fatty acids and eicosanoids in human plasma by liquid chromatography–tandem mass spectrometry. Biopreserv Biobank. 2016;14:107‐113. 10.1089/bio.2015.0005 [DOI] [PubMed] [Google Scholar]
- 57. Hammad SM, Pierce JS, Soodavar F, et al. Blood sphingolipidomics in healthy humans: impact of sample collection methodology. J Lipid Res. 2010;51:3074‐3087. 10.1194/jlr.D008532 [DOI] [PMC free article] [PubMed] [Google Scholar]
- 58. Wolrab D, Chocholoušková M, Jirásko R, et al. Determination of one year stability of lipid plasma profile and comparison of blood collection tubes using UHPSFC/MS and HILIC‐UHPLC/MS. Anal Chim Acta. 2020;1137:74‐84. 10.1016/j.aca.2020.08.061 [DOI] [PubMed] [Google Scholar]
- 59. Kano K, Matsumoto H, Kono N, Kurano M, Yatomi Y, Aoki J. Suppressing postcollection lysophosphatidic acid metabolism improves the precision of plasma LPA quantification. J Lipid Res. 2021;62:100029. 10.1016/j.jlr.2021.100029 [DOI] [PMC free article] [PubMed] [Google Scholar]
- 60. Beger AW, Hauther KA, Dudzik B, Woltjer RL, Wood PL. Human brain lipidomics: investigation of formalin fixed brains. Front Mol Neurosci. 2022;15:835628. 10.3389/fnmol.2022.835628 [DOI] [PMC free article] [PubMed] [Google Scholar]
- 61. Yadav M, Chaudhary PP, D'Souza BN, Spathies J, Myles IA. Impact of skin tissue collection method on downstream MALDI‐imaging. Metabolites. 2022;12:497. 10.3390/metabo12060497 [DOI] [PMC free article] [PubMed] [Google Scholar]
- 62. McClellan J, King M‐C. Genetic heterogeneity in human disease. Cell. 2010;141:210‐207. 10.1016/j.cell.2010.03.032 [DOI] [PubMed] [Google Scholar]
- 63. Nair ATN, Wesolowska‐Andersen A, Brorsson C, et al. Heterogeneity in phenotype, disease progression and drug response in type 2 diabetes. Nat Med. 2022;28:982‐988. 10.1038/s41591-022-01790-7 [DOI] [PubMed] [Google Scholar]
- 64. Young AL, Marinescu R V, Oxtoby NP, et al. Uncovering the heterogeneity and temporal complexity of neurodegenerative diseases with Subtype and Stage Inference. Nat Commun. 2018;9:4273. 10.1038/s41467-018-05892-0 [DOI] [PMC free article] [PubMed] [Google Scholar]
- 65. Zhao X, Niu L, Clerici C, Russo R, Byrd M, Setchell KDR. Data analysis of MS‐based clinical lipidomics studies with crossover design: a tutorial mini‐review of statistical methods. Clin Mass Spectrom. 2019;13:5‐17. 10.1016/j.clinms.2019.05.002 [DOI] [PMC free article] [PubMed] [Google Scholar]
- 66. Blaise BJ, Correia G, Tin A, et al. Power analysis and sample size determination in metabolic phenotyping. Anal Chem. 2016;88:5179‐5188. 10.1021/acs.analchem.6b00188 [DOI] [PubMed] [Google Scholar]
- 67. Burger B, Vaudel M, Barsnes H. Importance of block randomization when designing proteomics experiments. J Proteome Res. 2021;20:122‐128. 10.1021/acs.jproteome.0c00536 [DOI] [PMC free article] [PubMed] [Google Scholar]
- 68. Zheng Y. Study design considerations for cancer biomarker discoveries. J Appl Lab Med. 2018;3:282‐289. 10.1373/jalm.2017.025809 [DOI] [PMC free article] [PubMed] [Google Scholar]
- 69. Wong MWK, Braidy N, Pickford R, Sachdev PS, Poljak A. Comparison of single phase and biphasic extraction protocols for lipidomic studies using human plasma. Front Neurol. 2019;10:879. 10.3389/fneur.2019.00879 [DOI] [PMC free article] [PubMed] [Google Scholar]
- 70. Reis A, Rudnitskaya A, Blackburn GJ, Fauzi NM, Pitt AR, Spickett CM. A comparison of five lipid extraction solvent systems for lipidomic studies of human LDL. J Lipid Res. 2013;54:1812‐1814. 10.1194/jlr.M034330 [DOI] [PMC free article] [PubMed] [Google Scholar]
- 71. Ulmer CZ, Jones CM, Yost RA, Garrett TJ, Bowden JA. Optimization of Folch, Bligh‐Dyer, and Matyash sample‐to‐extraction solvent ratios for human plasma‐based lipidomics studies. Anal Chim Acta. 2018;1037:351‐357. 10.1016/j.aca.2018.08.004 [DOI] [PMC free article] [PubMed] [Google Scholar]
- 72. Erben V, Poschet G, Schrotz‐King P, Brenner H. Evaluation of different stool extraction methods for metabolomics measurements in human faecal samples. BMJ Nutr Prev Heal. 2021;4:374‐384. 10.1136/bmjnph-2020-000202 [DOI] [PMC free article] [PubMed] [Google Scholar]
- 73. Liao H‐W, Cheng Y‐W, Tang S‐C, Kuo C‐H. Bias caused by incomplete metabolite extraction and matrix effect: Evaluation of critical factors for plasma sample preparation prior to metabolomics. J Pharm Biomed Anal. 2022;219:114930. 10.1016/j.jpba.2022.114930 [DOI] [PubMed] [Google Scholar]
- 74. Höring M, Stieglmeier C, Schnabel K, et al. Benchmarking one‐phase lipid extractions for plasma lipidomics. Anal Chem. 2022;94:12292‐12296. 10.1021/acs.analchem.2c02117 [DOI] [PMC free article] [PubMed] [Google Scholar]
- 75. Zhang H, Gao Y, Sun J, et al. Optimization of lipid extraction and analytical protocols for UHPLC‐ESI‐HRMS‐based lipidomic analysis of adherent mammalian cancer cells. Anal Bioanal Chem. 2017;409:5349‐5358. 10.1007/s00216-017-0483-7 [DOI] [PubMed] [Google Scholar]
- 76. Gil A, Zhang W, Wolters JC, et al. One‐ vs two‐phase extraction: re‐evaluation of sample preparation procedures for untargeted lipidomics in plasma samples. Anal Bioanal Chem. 2018;410:5859‐5870. 10.1007/s00216-018-1200-x [DOI] [PMC free article] [PubMed] [Google Scholar]
- 77. Fu X, Calderón C, Harm T, Gawaz M, Lämmerhofer M. Advanced unified monophasic lipid extraction protocol with wide coverage on the polarity scale optimized for large‐scale untargeted clinical lipidomics analysis of platelets. Anal Chim Acta. 2022;1221:340155. 10.1016/j.aca.2022.340155 [DOI] [PubMed] [Google Scholar]
- 78. Teo CC, Chong WPK, Tan E, Basri NB, Low ZJ, Ho YS. Advances in sample preparation and analytical techniques for lipidomics study of clinical samples. TrAC Trends Anal Chem. 2015;66:1‐18. 10.1016/j.trac.2014.10.010 [DOI] [Google Scholar]
- 79. Hu C, Duan Q, Han X. Strategies to improve/eliminate the limitations in shotgun lipidomics. Proteomics. 2020;20:e1900070‐e1900070. 10.1002/pmic.201900070 [DOI] [PMC free article] [PubMed] [Google Scholar]
- 80. Züllig T, Trötzmüller M, Köfeler HC. Lipidomics from sample preparation to data analysis: a primer. Anal Bioanal Chem. 2020;412:2191‐2209. 10.1007/s00216-019-02241-y [DOI] [PMC free article] [PubMed] [Google Scholar]
- 81. Zhao X, Zhu S, Liu H. Recent progresses of derivatization approaches in the targeted lipidomics analysis by mass spectrometry. J Sep Sci. 2020;43:1838‐1846. 10.1002/jssc.201901346 [DOI] [PubMed] [Google Scholar]
- 82. Xia F, Wan J. Chemical derivatization strategy for mass spectrometry‐based lipidomics. Mass Spectrom Rev. 2023;42:432‐452. 10.1002/mas.21729 [DOI] [PubMed] [Google Scholar]
- 83. Jurowski K, Kochan K, Walczak J, Barańska M, Piekoszewski W, Buszewski B. Comprehensive review of trends and analytical strategies applied for biological samples preparation and storage in modern medical lipidomics: State of the art. TrAC Trends Anal Chem. 2017;86:276‐289. 10.1016/j.trac.2016.10.014 [DOI] [Google Scholar]
- 84. Andrade‐Eiroa A, Canle M, Leroy‐Cancellieri V, Cerdà V. Solid‐phase extraction of organic compounds: A critical review. part ii. TrAC Trends Anal Chem. 2016;80:655‐667. 10.1016/j.trac.2015.08.014 [DOI] [Google Scholar]
- 85. Stone J. Sample preparation techniques for mass spectrometry in the clinical laboratory. In: Nair H, Clarke W, eds., Mass Spectrometry for the Clinical Laboratory. Elsevier; 2017. pp. 37‐62. 10.1016/B978-0-12-800871-3.00003-1 [DOI] [Google Scholar]
- 86. Jiang R, Jiao Y, Xu F. Chemical derivatization‐based LC–MS for metabolomics: advantages and challenges. Bioanalysis. 2016;8:1881‐1883. 10.4155/bio-2016-0192 [DOI] [PubMed] [Google Scholar]
- 87. Fritsche‐Guenther R, Gloaguen Y, Bauer A, et al. Optimized workflow for on‐line derivatization for targeted metabolomics approach by gas chromatography‐mass spectrometry. Metabolites. 2021;11:888. 10.3390/metabo11120888 [DOI] [PMC free article] [PubMed] [Google Scholar]
- 88. Xie Y, Wu Z, Qin Z, et al. Methods of lipidomic analysis: extraction, derivatization, separation, and identification of lipids. Adv Exp Med Biol. 2021;1280:173‐187. 10.1007/978-3-030-51652-9_12 [DOI] [PubMed] [Google Scholar]
- 89. Folch J, Lees M, Sloane Stanley GH. A simple method for the isolation and purification of total lipids from animal tissues. J Biol Chem. 1957;226:497‐509. 10.1016/S0021-9258(18)64849-5 [DOI] [PubMed] [Google Scholar]
- 90. Bligh EG, Dyer WJ. A rapid method of total lipid extraction and purification. Can J Biochem Physiol. 1959;37:911‐917. 10.1139/o59-099 [DOI] [PubMed] [Google Scholar]
- 91. Matyash V, Liebisch G, Kurzchalia T V, Shevchenko A, Schwudke D. Lipid extraction by methyl‐tert‐butyl ether for high‐throughput lipidomics. J Lipid Res. 2008;49:1137‐1146. 10.1194/jlr.D700041-JLR200 [DOI] [PMC free article] [PubMed] [Google Scholar]
- 92. Löfgren L, Ståhlman M, Forsberg G‐B, Saarinen S, Nilsson R, Hansson GI. The BUME method: a novel automated chloroform‐free 96‐well total lipid extraction method for blood plasma. J Lipid Res. 2012;53:1690‐1700. 10.1194/jlr.D023036 [DOI] [PMC free article] [PubMed] [Google Scholar]
- 93. Sarafian MH, Gaudin M, Lewis MR, et al. Objective set of criteria for optimization of sample preparation procedures for ultra‐high throughput untargeted blood plasma lipid profiling by ultra performance liquid chromatography–mass spectrometry. Anal Chem. 2014;86:5766‐5774. 10.1021/ac500317c [DOI] [PubMed] [Google Scholar]
- 94. Pellegrino RM, Di Veroli A, Valeri A, Goracci L, Cruciani G. LC/MS lipid profiling from human serum: a new method for global lipid extraction. Anal Bioanal Chem. 2014;406:7937‐7948. 10.1007/s00216-014-8255-0 [DOI] [PubMed] [Google Scholar]
- 95. Satomi Y, Hirayama M, Kobayashi H. One‐step lipid extraction for plasma lipidomics analysis by liquid chromatography mass spectrometry. J Chromatogr B. 2017;1063:93‐100. 10.1016/j.jchromb.2017.08.020 [DOI] [PubMed] [Google Scholar]
- 96. Surma MA, Herzog R, Vasilj A, et al. An automated shotgun lipidomics platform for high throughput, comprehensive, and quantitative analysis of blood plasma intact lipids. Eur J Lipid Sci Technol. 2015;117:1540‐1549. 10.1002/ejlt.201500145 [DOI] [PMC free article] [PubMed] [Google Scholar]
- 97. Löfgren L, Forsberg G‐B, Ståhlman M. The BUME method: a new rapid and simple chloroform‐free method for total lipid extraction of animal tissue. Sci Rep. 2016;6:27688. 10.1038/srep27688 [DOI] [PMC free article] [PubMed] [Google Scholar]
- 98. Saini RK, Prasad P, Shang X, Keum Y‐S. Advances in lipid extraction methods—a review. Int J Mol Sci. 2021;22:13643. 10.3390/ijms222413643 [DOI] [PMC free article] [PubMed] [Google Scholar]
- 99. Câmara JS, Perestrelo R, Berenguer C V, et al. Green extraction techniques as advanced sample preparation approaches in biological, food, and environmental matrices: a review. Molecules. 2022;27:2953. 10.3390/molecules27092953 [DOI] [PMC free article] [PubMed] [Google Scholar]
- 100. Tikunov AP, Tipton JD, Garrett TJ, et al. Green chemistry preservation and extraction of biospecimens for multi‐omic analyses. Methods Mol Biol. 2022;2394:267‐298. 10.1007/978-1-0716-1811-0_17 [DOI] [PubMed] [Google Scholar]
- 101. Granafei S, Azzone P, Spinelli VA, Losito I, Palmisano F, Cataldi TRI. Hydrophilic interaction and reversed phase mixed‐mode liquid chromatography coupled to high resolution tandem mass spectrometry for polar lipids analysis. J Chromatogr A. 2016;1477:47‐55. 10.1016/j.chroma.2016.11.048 [DOI] [PubMed] [Google Scholar]
- 102. Lísa M, Cífková E, Holčapek M. Lipidomic profiling of biological tissues using off‐line two‐dimensional high‐performance liquid chromatography–mass spectrometry. J Chromatogr A. 2011;1218:5146‐5156. 10.1016/j.chroma.2011.05.081 [DOI] [PubMed] [Google Scholar]
- 103. Nie H, Liu R, Yang Y, et al. Lipid profiling of rat peritoneal surface layers by online normal‐ and reversed‐phase 2D LC QToF‐MS. J Lipid Res. 2010;51:2833‐2844. 10.1194/jlr.D007567 [DOI] [PMC free article] [PubMed] [Google Scholar]
- 104. Schwaiger M, Schoeny H, El Abiead Y, Hermann G, Rampler E, Koellensperger G. Merging metabolomics and lipidomics into one analytical run. Analyst. 2019;144:220‐229. 10.1039/C8AN01219A [DOI] [PubMed] [Google Scholar]
- 105. Rampler E, Schoeny H, Mitic BM, El Abiead Y, Schwaiger M, Koellensperger G. Simultaneous non‐polar and polar lipid analysis by on‐line combination of HILIC, RP and high resolution MS. Analyst. 2018;143:1250‐1258. 10.1039/C7AN01984J [DOI] [PubMed] [Google Scholar]
- 106. Baker PRS, Armando AM, Campbell JL, Quehenberger O, Dennis EA. Three‐dimensional enhanced lipidomics analysis combining UPLC, differential ion mobility spectrometry, and mass spectrometric separation strategies. J Lipid Res. 2014;55:2432‐2442. 10.1194/jlr.D051581 [DOI] [PMC free article] [PubMed] [Google Scholar]
- 107. Vasilopoulou CG, Sulek K, Brunner A‐D, et al. Trapped ion mobility spectrometry and PASEF enable in‐depth lipidomics from minimal sample amounts. Nat Commun. 2020;11:331. 10.1038/s41467-019-14044-x [DOI] [PMC free article] [PubMed] [Google Scholar]
- 108. Jackson SN, Wang H‐YJ, Woods AS, Ugarov M, Egan T, Schultz JA. Direct tissue analysis of phospholipids in rat brain using MALDI‐TOFMS and MALDI‐ion mobility‐TOFMS. J Am Soc Mass Spectrom. 2005;16:133‐138. 10.1016/j.jasms.2004.10.002 [DOI] [PubMed] [Google Scholar]
- 109. Paglia G, Kliman M, Claude E, Geromanos S, Astarita G. Applications of ion‐mobility mass spectrometry for lipid analysis. Anal Bioanal Chem. 2015;407:4995‐5007. 10.1007/s00216-015-8664-8 [DOI] [PubMed] [Google Scholar]
- 110. Deda O, Gika H, Raikos N, Theodoridis G. GC‐MS‐based metabolic phenotyping. In: Lindon JC, Nicholson JK, Holmes E, eds., The Handbook of Metabolic Phenotyping. Elsevier; 2019. pp. 137‐169. 10.1016/B978-0-12-812293-8.00004-9 [DOI] [Google Scholar]
- 111. Little JL. Artifacts in trimethylsilyl derivatization reactions and ways to avoid them. J Chromatogr A. 1999;844:1‐22. 10.1016/S0021-9673(99)00267-8 [DOI] [PubMed] [Google Scholar]
- 112. Knoll S, Rösch T, Huhn C. Trends in sample preparation and separation methods for the analysis of very polar and ionic compounds in environmental water and biota samples. Anal Bioanal Chem. 2020;412:6149‐6165. 10.1007/s00216-020-02811-5 [DOI] [PMC free article] [PubMed] [Google Scholar]
- 113. McKeown AP. A simple, generally applicable HILIC method development platform based upon selectivity. Chromatography Today. 2015. https://www.chromatographytoday.com/article/hplc‐uhplc/31/advanced‐chromatography‐technologies/a‐simple‐generally‐applicable‐hilic‐method‐development‐platform‐based‐upon‐selectivity/1958
- 114. Žuvela P, Skoczylas M, Jay Liu J, et al. Column characterization and selection systems in reversed‐phase high‐performance liquid chromatography. Chem Rev. 2019;119:3674‐729. 10.1021/acs.chemrev.8b00246 [DOI] [PubMed] [Google Scholar]
- 115. Ovčačíková M, Lísa M, Cífková E, Holčapek M. Retention behavior of lipids in reversed‐phase ultrahigh‐performance liquid chromatography–electrospray ionization mass spectrometry. J Chromatogr A. 2016;1450:76‐85. 10.1016/j.chroma.2016.04.082 [DOI] [PubMed] [Google Scholar]
- 116. Cífková E, Holčapek M, Lísa M, et al. Nontargeted quantitation of lipid classes using hydrophilic interaction liquid chromatography–electrospray ionization mass spectrometry with single internal standard and response factor approach. Anal Chem. 2012;84:10064‐10070. 10.1021/ac3024476 [DOI] [PubMed] [Google Scholar]
- 117. Li A, Hines KM, Xu L. Lipidomics by HILIC‐Ion Mobility‐Mass Spectrometry. Methods Mol Biol. 2020;2084:119‐132. 10.1007/978-1-0716-0030-6_7 [DOI] [PMC free article] [PubMed] [Google Scholar]
- 118. Pham TH, Zaeem M, Fillier TA, et al. Targeting modified lipids during routine lipidomics analysis using HILIC and C30 reverse phase liquid chromatography coupled to mass spectrometry. Sci Rep. 2019;9:5048. 10.1038/s41598-019-41556-9 [DOI] [PMC free article] [PubMed] [Google Scholar]
- 119. Zhu C, Dane A, Spijksma G, et al. An efficient hydrophilic interaction liquid chromatography separation of 7 phospholipid classes based on a diol column. J Chromatogr A. 2012;1220:26‐34. 10.1016/j.chroma.2011.11.034 [DOI] [PubMed] [Google Scholar]
- 120. McCullagh J, Oldham N. Mass Spectrometry. Oxford University Press; 2019. [Google Scholar]
- 121. Gross J. Mass Spectrometry: A Textbook. Springer; 2017. [Google Scholar]
- 122. Emerson B, Gidden J, Lay JO, Durham B. A rapid separation technique for overcoming suppression of triacylglycerols by phosphatidylcholine using MALDI‐TOF MS. J Lipid Res. 2010;51:2428‐2434. 10.1194/jlr.D003798 [DOI] [PMC free article] [PubMed] [Google Scholar]
- 123. Kushon S, Pike E. An improved method for eliminating ion suppression and other phospholipid‐induced interferences in bioanalytical samples. LCGC. Suppl 2012;10:28‐31 [Google Scholar]
- 124. Araujo P, Tilahun E, Breivik JF, Abdulkader BM, Frøyland L, Zeng Y. A simple liquid extraction protocol for overcoming the ion suppression of triacylglycerols by phospholipids in liquid chromatography mass spectrometry studies. Talanta. 2016;148:463‐471. 10.1016/j.talanta.2015.11.016 [DOI] [PubMed] [Google Scholar]
- 125. Khoury S, El Banna N, Tfaili S, Chaminade P. A study of inter‐species ion suppression in electrospray ionization‐mass spectrometry of some phospholipid classes. Anal Bioanal Chem. 2016;408:1453‐1465. 10.1007/s00216-015-9245-6 [DOI] [PubMed] [Google Scholar]
- 126. Yang K, Han X. Accurate quantification of lipid species by electrospray ionization mass spectrometry ‐ Meet a key challenge in lipidomics. Metabolites. 2011;1:21‐40. 10.3390/metabo1010021 [DOI] [PMC free article] [PubMed] [Google Scholar]
- 127. Djambazova K V., Klein DR, Migas LG, et al. Resolving the complexity of spatial lipidomics using MALDI TIMS imaging mass spectrometry. Anal Chem. 2020;92:13290‐13297. 10.1021/acs.analchem.0c02520 [DOI] [PubMed] [Google Scholar]
- 128. Bonner R, Hopfgartner G. SWATH data independent acquisition mass spectrometry for metabolomics. TrAC Trends Anal Chem. 2019;120:115278. 10.1016/j.trac.2018.10.014 [DOI] [Google Scholar]
- 129. Defossez E, Bourquin J, von Reuss S, Rasmann S, Glauser G. Eight key rules for successful data‐dependent acquisition in mass spectrometry‐based metabolomics. Mass Spectrom Rev. 2023;42(1):131‐143. 10.1002/mas.21715 [DOI] [PMC free article] [PubMed] [Google Scholar]
- 130. van der Laan T, Boom I, Maliepaard J, Dubbelman A‐C, Harms AC, Hankemeier T. Data‐independent acquisition for the quantification and identification of metabolites in plasma. Metabolites. 2020;10(12):514. 10.3390/metabo10120514 [DOI] [PMC free article] [PubMed] [Google Scholar]
- 131. Guo J, Huan T. Comparison of full‐scan, data‐dependent, and data‐independent acquisition modes in liquid chromatography–mass spectrometry based untargeted metabolomics. Anal Chem. 2020;92:8072‐8080. 10.1021/acs.analchem.9b05135 [DOI] [PubMed] [Google Scholar]
- 132. Barbier Saint Hilaire P, Rousseau K, Seyer A, et al. Comparative evaluation of data dependent and data independent acquisition workflows implemented on an orbitrap fusion for untargeted metabolomics. Metabolites. 2020;10:158. 10.3390/metabo10040158 [DOI] [PMC free article] [PubMed] [Google Scholar]
- 133. Broeckling CD, Hoyes E, Richardson K, Brown JM, Prenni JE. Comprehensive tandem‐mass‐spectrometry coverage of complex samples enabled by data‐set‐dependent acquisition. Anal Chem. 2018;90:8020‐8027. 10.1021/acs.analchem.8b00929 [DOI] [PubMed] [Google Scholar]
- 134. Valmori M, Marie V, Fenaille F, Colsch B, Touboul D. Recent methodological developments in data‐dependent analysis and data‐independent analysis workflows for exhaustive lipidome coverage. Front Anal Sci. 2023;3. 10.3389/frans.2023.1118742 [DOI] [Google Scholar]
- 135. Park J, Oh HJ, Han D, et al. Parallel reaction monitoring‐mass dpectrometry (PRM‐MS)‐based targeted proteomic surrogates for intrinsic subtypes in breast cancer: comparative analysis with immunohistochemical phenotypes. J Proteome Res. 2020;19:2643‐2653. 10.1021/acs.jproteome.9b00490 [DOI] [PubMed] [Google Scholar]
- 136. Peng B, Kopczynski D, Pratt BS, et al. LipidCreator workbench to probe the lipidomic landscape. Nat Commun. 2020;11:2057. 10.1038/s41467-020-15960-z [DOI] [PMC free article] [PubMed] [Google Scholar]
- 137. Domingo‐Almenara X, Montenegro‐Burke JR, Ivanisevic J, et al. XCMS‐MRM and METLIN‐MRM: a cloud library and public resource for targeted analysis of small molecules. Nat Methods. 2018;15:681‐684. 10.1038/s41592-018-0110-3 [DOI] [PMC free article] [PubMed] [Google Scholar]
- 138. Adams KJ, Pratt B, Bose N, et al. Skyline for small molecules: a unifying software package for quantitative metabolomics. J Proteome Res. 2020;19:1447‐1458. 10.1021/acs.jproteome.9b00640 [DOI] [PMC free article] [PubMed] [Google Scholar]
- 139. Waters . TargetLynx. 2023. Accessed April 10, https://www.waters.com/waters/en_US/TargetLynx‐/nav.htm?cid=513791&locale=en_US 2023.
- 140. Ni Z, Wölk M, Jukes G, et al. Guiding the choice of informatics software and tools for lipidomics research applications. Nat Methods. 2023;20:193‐204. 10.1038/s41592-022-01710-0 [DOI] [PMC free article] [PubMed] [Google Scholar]
- 141. Checa A, Bedia C, Jaumot J. Lipidomic data analysis: tutorial, practical guidelines and applications. Anal Chim Acta. 2015;885:1‐16. 10.1016/j.aca.2015.02.068 [DOI] [PubMed] [Google Scholar]
- 142. Liebal UW, Phan ANT, Sudhakar M, Raman K, Blank LM. Machine learning applications for mass spectrometry‐based metabolomics. Metabolites. 2020;10:243. 10.3390/metabo10060243 [DOI] [PMC free article] [PubMed] [Google Scholar]
- 143. Waters . Progenesis QI 2023. Accessed January 13, https://www.nonlinear.com/progenesis/qi/ 2023.
- 144. Pang Z, Chong J, Zhou G, et al. MetaboAnalyst 5.0: narrowing the gap between raw spectra and functional insights. Nucleic Acids Res. 2021;49:W388‐W396. 10.1093/nar/gkab382 [DOI] [PMC free article] [PubMed] [Google Scholar]
- 145. Pluskal T, Castillo S, Villar‐Briones A, Orešič M. MZmine 2: modular framework for processing, visualizing, and analyzing mass spectrometry‐based molecular profile data. BMC Bioinformatics. 2010;11:395. 10.1186/1471-2105-11-395 [DOI] [PMC free article] [PubMed] [Google Scholar]
- 146. Forsberg EM, Huan T, Rinehart D, et al. Data processing, multi‐omic pathway mapping, and metabolite activity analysis using XCMS Online. Nat Protoc. 2018;13:633‐651. 10.1038/nprot.2017.151 [DOI] [PMC free article] [PubMed] [Google Scholar]
- 147. Domingo‐Almenara X, Brezmes J, Vinaixa M, et al. eRah: a computational tool integrating spectral deconvolution and alignment with quantification and identification of metabolites in GC/MS‐based metabolomics. Anal Chem. 2016;88:9821‐9829. 10.1021/acs.analchem.6b02927 [DOI] [PubMed] [Google Scholar]
- 148. Gloaguen Y, Kirwan JA, Beule D. Deep learning‐assisted peak curation for large‐scale LC‐MS metabolomics. Anal Chem. 2022;94:4930‐4937. 10.1021/acs.analchem.1c02220 [DOI] [PMC free article] [PubMed] [Google Scholar]
- 149. Saccenti E, Hoefsloot HCJ, Smilde AK, Westerhuis JA, Hendriks MMWB. Reflections on univariate and multivariate analysis of metabolomics data. Metabolomics. 2014;10:361‐374. 10.1007/s11306-013-0598-6 [DOI] [Google Scholar]
- 150. Wieder C, Frainay C, Poupin N, et al. Pathway analysis in metabolomics: Recommendations for the use of over‐representation analysis. PLoS Comput Biol. 2021;17:e1009105‐e1009105. 10.1371/journal.pcbi.1009105 [DOI] [PMC free article] [PubMed] [Google Scholar]
- 151. Lam SM, Wang Z, Li B, Shui G. High‐coverage lipidomics for functional lipid and pathway analyses. Anal Chim Acta. 2021;1147:199‐210. 10.1016/j.aca.2020.11.024 [DOI] [PubMed] [Google Scholar]
- 152. Mitchell TM. Machine Learning. McGraw‐Hill; 1997. [Google Scholar]
- 153. DeepAI . Machine learning. n.d. Accessed January 1, https://deepai.org/machine‐learning‐glossary‐and‐terms/machine‐learning 2023.
- 154. Cai Z, Poulos RC, Liu J, Zhong Q. Machine learning for multi‐omics data integration in cancer. IScience. 2022;25:103798. 10.1016/j.isci.2022.103798 [DOI] [PMC free article] [PubMed] [Google Scholar]
- 155. Zhou J, Ji N, Wang G, et al. Metabolic detection of malignant brain gliomas through plasma lipidomic analysis and support vector machine‐based machine learning. EBioMedicine. 2022;81:104097. 10.1016/j.ebiom.2022.104097 [DOI] [PMC free article] [PubMed] [Google Scholar]
- 156. Wang G, Qiu M, Xing X, et al. Lung cancer scRNA‐seq and lipidomics reveal aberrant lipid metabolism for early‐stage diagnosis. Sci Transl Med. 2022;14:eabk2756. 10.1126/scitranslmed.abk2756 [DOI] [PubMed] [Google Scholar]
- 157. Luan C, Xie W, Liu D, Li W, Yuan Z. Candidate circulating biomarkers of spontaneous miscarriage after IVF‐ET identified via coupling machine learning and serum lipidomics profiling. Reprod Sci. 2022;29:750‐760. 10.1007/s43032-021-00830-w [DOI] [PubMed] [Google Scholar]
- 158. FDA‐NIH Biomarker Working Group . BEST (Biomarkers, EndpointS, and other Tools) resource 2016. Accessed December 21, https://www.ncbi.nlm.nih.gov/books/NBK326791 2022. [PubMed]
- 159. Fasano S, Pierro L, Borgia A, et al. Biomarker panels may be superior over single molecules in prediction of renal flares in systemic lupus erythematosus: an exploratory study. Rheumatology. 2020;59:3193‐3200. 10.1093/rheumatology/keaa074 [DOI] [PubMed] [Google Scholar]
- 160. Zhu CS, Pinsky PF, Cramer DW, et al. A framework for evaluating biomarkers for early detection: validation of biomarker panels for ovarian cancer. Cancer Prev Res. 2011;4:375‐383. 10.1158/1940-6207.CAPR-10-0193 [DOI] [PMC free article] [PubMed] [Google Scholar]
- 161. Kane LE, Mellotte GS, Mylod E, et al. Diagnostic accuracy of blood‐based biomarkers for pancreatic cancer: a systematic review and meta‐analysis. Cancer Res Commun. 2022;2:1229‐1243. 10.1158/2767-9764.CRC-22-0190 [DOI] [PMC free article] [PubMed] [Google Scholar]
- 162. Kim S, Song Y, Kim S, et al. Identification of a biomarker panel for diagnosis of early childhood caries using salivary metabolic profile. Metabolites. 2023;13:356. 10.3390/metabo13030356 [DOI] [PMC free article] [PubMed] [Google Scholar]
- 163. Zhang Z, Wang J, Li Y, et al. Proteomics and metabolomics profiling reveal panels of circulating diagnostic biomarkers and molecular subtypes in stable COPD. Respir Res. 2023;24:73. 10.1186/s12931-023-02349-x [DOI] [PMC free article] [PubMed] [Google Scholar]
- 164. Mattiuzzi C, Lippi G. Current cancer epidemiology. J Epidemiol Glob Health. 2019;9:217. 10.2991/jegh.k.191008.001 [DOI] [PMC free article] [PubMed] [Google Scholar]
- 165. Broadfield LA, Pane AA, Talebi A, Swinnen J V., Fendt S‐M. Lipid metabolism in cancer: new perspectives and emerging mechanisms. Dev Cell. 2021;56:1363‐1393. 10.1016/j.devcel.2021.04.013 [DOI] [PubMed] [Google Scholar]
- 166. Liu J, Bai L, Wang W, et al. LC‐MS‐based lipidomic analysis of serum samples from patients with type 2 diabetes mellitus (T2DM). Dis Markers. 2022;2022:5559470. 10.1155/2022/5559470 [DOI] [PMC free article] [PubMed] [Google Scholar]
- 167. Pan M, Qin C, Han X. Lipid metabolism and lipidomics applications in cancer research. Adv Exp Med Biol. 2021;1316:1‐24. 10.1007/978-981-33-6785-2_1 [DOI] [PMC free article] [PubMed] [Google Scholar]
- 168. Röhrig F, Schulze A. The multifaceted roles of fatty acid synthesis in cancer. Nat Rev Cancer. 2016;16:732‐749. 10.1038/nrc.2016.89 [DOI] [PubMed] [Google Scholar]
- 169. Mullen PJ, Yu R, Longo J, Archer MC, Penn LZ. The interplay between cell signalling and the mevalonate pathway in cancer. Nat Rev Cancer. 2016;16:718‐731. 10.1038/nrc.2016.76 [DOI] [PubMed] [Google Scholar]
- 170. Ray U, Roy Chowdhury S, Vasudevan M, Bankar K, Roychoudhury S, Roy SS. Gene regulatory networking reveals the molecular cue to lysophosphatidic acid‐induced metabolic adaptations in ovarian cancer cells. Mol Oncol. 2017;11:491‐516. 10.1002/1878-0261.12046 [DOI] [PMC free article] [PubMed] [Google Scholar]
- 171. Auciello FR, Bulusu V, Oon C, et al. A stromal lysolipid–autotaxin signaling axis promotes pancreatic tumor progression. Cancer Discov. 2019;9:617‐627. 10.1158/2159-8290.CD-18-1212 [DOI] [PMC free article] [PubMed] [Google Scholar]
- 172. Phan TK, Williams SA, Bindra GK, Lay FT, Poon IKH, Hulett MD. Phosphoinositides: multipurpose cellular lipids with emerging roles in cell death. Cell Death Differ. 2019;26:781‐793. 10.1038/s41418-018-0269-2 [DOI] [PMC free article] [PubMed] [Google Scholar]
- 173. Xu Y. Lysophospholipid signaling in the epithelial ovarian cancer tumor microenvironment. Cancers. 2018;10:227. 10.3390/cancers10070227 [DOI] [PMC free article] [PubMed] [Google Scholar]
- 174. Yan F, Zhao H, Zeng Y. Lipidomics: a promising cancer biomarker. Clin Transl Med. 2018;7. 10.1186/s40169-018-0199-0 [DOI] [PMC free article] [PubMed] [Google Scholar]
- 175. Agarwala PK, Aneja R, Kapoor S. Lipidomic landscape in cancer: Actionable insights for membrane‐based therapy and diagnoses. Med Res Rev. 2022;42:983‐1018. 10.1002/med.21868 [DOI] [PubMed] [Google Scholar]
- 176. Lee GB, Lee JC, Moon MH. Plasma lipid profile comparison of five different cancers by nanoflow ultrahigh performance liquid chromatography‐tandem mass spectrometry. Anal Chim Acta. 2019;1063:117‐126. 10.1016/j.aca.2019.02.021 [DOI] [PubMed] [Google Scholar]
- 177. Kami Reddy KR, Piyarathna DWB, Kamal AHM, et al. Lipidomic profiling identifies a novel lipid signature associated with ethnicity‐specific disparity of bladder cancer. Metabolites. 2022;12:544. 10.3390/metabo12060544 [DOI] [PMC free article] [PubMed] [Google Scholar]
- 178. Tokareva AO, Starodubtseva NL, Chagovets VV, et al. Lipidomic markers of tumor progress in breast cancer patients. Biomeditsinskaya Khimiya. 2022;68:144‐152. 10.18097/pbmc20226802144 [DOI] [PubMed] [Google Scholar]
- 179. Chistyakov D V., Guryleva M V., Stepanova ES, et al. Multi‐omics approach points to the importance of oxylipins metabolism in early‐stage breast cancer. Cancers. 2022;14:2041. 10.3390/cancers14082041 [DOI] [PMC free article] [PubMed] [Google Scholar]
- 180. Estrada‐Pérez AR, Bakalara N, García‐Vázquez JB, Rosales‐Hernández MC, Fernández‐Pomares C, Correa‐Basurto J. LC–MS based lipidomics depict phosphatidylethanolamine as biomarkers of TNBC MDA‐MB‐231 over nTNBC MCF‐7 cells. Int J Mol Sci. 2022;23:12074. 10.3390/ijms232012074 [DOI] [PMC free article] [PubMed] [Google Scholar]
- 181. Frankevich V, Novoselova A, Starodubtseva N, et al. Methodology of determining the metabolomic profile of tumor‐associated macrophages and monocytes in oncological diseases. Bull RSMU. 2022(5):58‐64. 10.24075/brsmu.2022.049 [DOI] [Google Scholar]
- 182. Su G‐H, Jiang L, Xiao Y, et al. A multiomics signature highlights alterations underlying homologous recombination deficiency in triple‐negative breast cancer. Ann Surg Oncol. 2022;29:7165‐7175. 10.1245/s10434-022-11958-7 [DOI] [PubMed] [Google Scholar]
- 183. Zhou H, Nong Y, Zhu Y, et al. Serum untargeted lipidomics by UHPLC‐ESI‐HRMS aids the biomarker discovery of colorectal adenoma. BMC Cancer. 2022;22:314. 10.1186/s12885-022-09427-1 [DOI] [PMC free article] [PubMed] [Google Scholar]
- 184. Peng S, Li Y, Huang M, et al. Metabolomics reveals that CAF‐derived lipids promote colorectal cancer peritoneal metastasis by enhancing membrane fluidity. Int J Biol Sci. 2022;18:1912‐1932. 10.7150/ijbs.68484 [DOI] [PMC free article] [PubMed] [Google Scholar]
- 185. Chen H, Zhang J, Zhou H, et al. UHPLC‐HRMS–based serum lipisdomics reveals novel biomarkers to assist in the discrimination between colorectal adenoma and cancer. Front Oncol. 2022;12. 10.3389/fonc.2022.934145 [DOI] [PMC free article] [PubMed] [Google Scholar]
- 186. Antona A, Varalda M, Roy K, et al. Dissecting the mechanism of action of spiperone—a candidate for drug repurposing for colorectal cancer. Cancers. 2022;14:776. 10.3390/cancers14030776 [DOI] [PMC free article] [PubMed] [Google Scholar]
- 187. Saorin A, Di Gregorio E, Buonadonna A, Miolo G, Corona G. The riddle of cetuximab‐related skin toxicity: 1H‐NMR sebum analysis revealed dynamic lipid alterations associated with skin toxicity development in metastatic colorectal cancer patients. Cancers. 2022;14:5308. 10.3390/cancers14215308 [DOI] [PMC free article] [PubMed] [Google Scholar]
- 188. Yang C, Zhou S, Zhu J, et al. Plasma lipid‐based machine learning models provides a potential diagnostic tool for colorectal cancer patients. Clin Chim Acta. 2022;536:191‐199. 10.1016/j.cca.2022.09.002 [DOI] [PubMed] [Google Scholar]
- 189. Mao X, Lei H, Yi T, et al. Lipid reprogramming induced by the TFEB‐ERRα axis enhanced membrane fluidity to promote EC progression. J Exp Clin Cancer Res. 2022;41:28. 10.1186/s13046-021-02211-2 [DOI] [PMC free article] [PubMed] [Google Scholar]
- 190. Sharma N, Yadav M, Tripathi G, et al. Bile multi‐omics analysis classifies lipid species and microbial peptides predictive of carcinoma of gallbladder. Hepatology. 2022;76:920‐935. 10.1002/hep.32496 [DOI] [PubMed] [Google Scholar]
- 191. Liu Z‐C, Wu W‐H, Huang S, et al. Plasma lipids signify the progression of precancerous gastric lesions to gastric cancer: a prospective targeted lipidomics study. Theranostics. 2022;12:4671‐4683. 10.7150/thno.74770 [DOI] [PMC free article] [PubMed] [Google Scholar]
- 192. Jirásko R, Idkowiak J, Wolrab D, et al. Altered plasma, urine, and tissue profiles of sulfatides and sphingomyelins in patients with renal cell carcinoma. Cancers (Basel). 2022;14:4622. 10.3390/cancers14194622 [DOI] [PMC free article] [PubMed] [Google Scholar]
- 193. Ning Z, Guo X, Liu X, et al. USP22 regulates lipidome accumulation by stabilizing PPARγ in hepatocellular carcinoma. Nat Commun. 2022;13:2187. 10.1038/s41467-022-29846-9 [DOI] [PMC free article] [PubMed] [Google Scholar]
- 194. Qu X, Wang T, Liu X, Jiang X, Liang X, Wu J. Dual‐mechanism‐driven strategy for high‐coverage detection of serum lipids on a novel SALDI‐MS target. Anal Chem. 2022;94:8570‐8579. 10.1021/acs.analchem.1c04929 [DOI] [PubMed] [Google Scholar]
- 195. Wu H, Cheng H, Luo S, et al. Use of cellular metabolomics and lipidomics to decipher the mechanism of Huachansu injection‐based intervention against human hepatocellular carcinoma cells. J Pharm Biomed Anal. 2022;212:114654. 10.1016/j.jpba.2022.114654 [DOI] [PubMed] [Google Scholar]
- 196. Wang J, Zhou Y, Zhang D, et al. CRIP1 suppresses BBOX1‐mediated carnitine metabolism to promote stemness in hepatocellular carcinoma. EMBO J. 2022;41:e110218. 10.15252/embj.2021110218 [DOI] [PMC free article] [PubMed] [Google Scholar]
- 197. Wang Q, Tan Y, Jiang T, et al. Metabolic reprogramming and its relationship to survival in hepatocellular carcinoma. Cells. 2022;11:1066. 10.3390/cells11071066 [DOI] [PMC free article] [PubMed] [Google Scholar]
- 198. Gong W‐J, Cao P, Zhang Q‐L, et al. Prediction of response and adverse drug reaction of pemetrexed plus platinum‐based chemotherapy in lung adenocarcinoma by serum metabolomic profiling. Transl Oncol. 2022;19:101393. 10.1016/j.tranon.2022.101393 [DOI] [PMC free article] [PubMed] [Google Scholar]
- 199. Cang S, Liu R, Mu K, et al. Assessment of plasma amino acids, purines, tricarboxylic acid cycle metabolites, and lipids levels in NSCLC patients based on LC‐MS/MS quantification. J Pharm Biomed Anal. 2022;221:114990. 10.1016/j.jpba.2022.114990 [DOI] [PubMed] [Google Scholar]
- 200. Verdura S, Encinar JA, Fernández‐Arroyo S, et al. Silibinin suppresses the hyperlipidemic effects of the ALK‐tyrosine kinase inhibitor lorlatinib in hepatic cells. Int J Mol Sci. 2022;23:9986. 10.3390/ijms23179986 [DOI] [PMC free article] [PubMed] [Google Scholar]
- 201. Huang Y, Liang J, Hu W, et al. Integration profiling between plasma lipidomics, Epstein–Barr virus and clinical phenomes in nasopharyngeal carcinoma patients. Front Microbiol. 2022;13. 10.3389/fmicb.2022.919496 [DOI] [PMC free article] [PubMed] [Google Scholar]
- 202. Lu Z, Lin F, Li T, et al. Identification of clinical and molecular features of recurrent serous borderline ovarian tumour. EClinicalMedicine. 2022;46:101377. 10.1016/j.eclinm.2022.101377 [DOI] [PMC free article] [PubMed] [Google Scholar]
- 203. Tao L, Mohammad MA, Milazzo G, et al. MYCN‐driven fatty acid uptake is a metabolic vulnerability in neuroblastoma. Nat Commun. 2022;13:3728. 10.1038/s41467-022-31331-2 [DOI] [PMC free article] [PubMed] [Google Scholar]
- 204. Mak B, Lin H‐M, Kwan EM, et al. Combined impact of lipidomic and genetic aberrations on clinical outcomes in metastatic castration‐resistant prostate cancer. BMC Med. 2022;20:112. 10.1186/s12916-022-02298-0 [DOI] [PMC free article] [PubMed] [Google Scholar]
- 205. Altuna‐Coy A, Ruiz‐Plazas X, Sánchez‐Martin S, et al. The lipidomic profile of the tumoral periprostatic adipose tissue reveals alterations in tumor cell's metabolic crosstalk. BMC Med. 2022;20:255. 10.1186/s12916-022-02457-3 [DOI] [PMC free article] [PubMed] [Google Scholar]
- 206. Chen X, Liu Q, Chen Y, et al. Carboxylesterase 2 induces mitochondrial dysfunction via disrupting lipid homeostasis in oral squamous cell carcinoma. Mol Metab. 2022;65:101600. 10.1016/j.molmet.2022.101600 [DOI] [PMC free article] [PubMed] [Google Scholar]
- 207. World Health Organization . Guide to Cancer Early Diagnosis. WHO; 2017. [Google Scholar]
- 208. Siegel RL, Miller KD, Jemal A. Cancer statistics, 2019. CA Cancer J Clin. 2019;69:7‐34. 10.3322/caac.21551 [DOI] [PubMed] [Google Scholar]
- 209. Lyratzopoulos G, Wardle J, Rubin G. Rethinking diagnostic delay in cancer: how difficult is the diagnosis? BMJ. 2014;349:g7400‐g7400. 10.1136/bmj.g7400 [DOI] [PubMed] [Google Scholar]
- 210. Zhao L, Zhou X, Xie F, et al. Ferroptosis in cancer and cancer immunotherapy. Cancer Commun. 2022;42:88‐116. 10.1002/cac2.12250 [DOI] [PMC free article] [PubMed] [Google Scholar]
- 211. Lei G, Zhuang L, Gan B. Targeting ferroptosis as a vulnerability in cancer. Nat Rev Cancer. 2022;22:381‐396. 10.1038/s41568-022-00459-0 [DOI] [PMC free article] [PubMed] [Google Scholar]
- 212. Zhang H‐L, Hu B‐X, Li Z‐L, et al. PKCβII phosphorylates ACSL4 to amplify lipid peroxidation to induce ferroptosis. Nat Cell Biol. 2022;24:88‐98. 10.1038/s41556-021-00818-3 [DOI] [PubMed] [Google Scholar]
- 213. Liao P, Wang W, Wang W, et al. CD8(+) T cells and fatty acids orchestrate tumor ferroptosis and immunity via ACSL4. Cancer Cell. 2022;40:365‐378.e6. 10.1016/j.ccell.2022.02.003 [DOI] [PMC free article] [PubMed] [Google Scholar]
- 214. Chen X, Sun M, Yang Z. Single cell mass spectrometry analysis of drug‐resistant cancer cells: metabolomics studies of synergetic effect of combinational treatment. Anal Chim Acta. 2022;1201:339621. 10.1016/j.aca.2022.339621 [DOI] [PMC free article] [PubMed] [Google Scholar]
- 215. Hatfield KJ, Bruserud Ø, Reikvam H. Pretransplant systemic lipidomic profiles in allogeneic stem cell transplant recipients. Cancers. 2022;14:2910. 10.3390/cancers14122910 [DOI] [PMC free article] [PubMed] [Google Scholar]
- 216. Shaw JE, Sicree RA, Zimmet PZ. Global estimates of the prevalence of diabetes for 2010 and 2030. Diabetes Res Clin Pract. 2010;87:4‐14. 10.1016/j.diabres.2009.10.007 [DOI] [PubMed] [Google Scholar]
- 217. Potenza M V., Mechanick JI. The metabolic syndrome. Nutr Clin Pract. 2009;24:560‐577. 10.1177/0884533609342436 [DOI] [PubMed] [Google Scholar]
- 218. Basaranoglu M, Neuschwander‐Tetri BA. Nonalcoholic fatty liver disease: clinical features and pathogenesis. Gastroenterol Hepatol. 2006;2:282‐291 [PMC free article] [PubMed] [Google Scholar]
- 219. Hamid el Bilbeisi A, Shab‐Bidar S, Jackson D, Djafarian K. The prevalence of metabolic syndrome and its related factors among adults in Palestine: a meta‐analysis. Ethiop J Health Sci. 2017;27:77. 10.4314/ejhs.v27i1.10 [DOI] [PMC free article] [PubMed] [Google Scholar]
- 220. van Vliet‐Ostaptchouk J V, Nuotio M‐L, Slagter SN, et al. The prevalence of metabolic syndrome and metabolically healthy obesity in Europe: a collaborative analysis of ten large cohort studies. BMC Endocr Disord. 2014;14:9. 10.1186/1472-6823-14-9 [DOI] [PMC free article] [PubMed] [Google Scholar]
- 221. Saklayen MG. The global epidemic of the metabolic syndrome. Curr Hypertens Rep. 2018;20:12. 10.1007/s11906-018-0812-z [DOI] [PMC free article] [PubMed] [Google Scholar]
- 222. Vaquero Alvarez M, Aparicio‐Martinez P, Fonseca Pozo FJ, Valle Alonso J, Blancas Sánchez IM, Romero‐Saldaña M. A sustainable approach to the metabolic syndrome in children and its economic burden. Int J Environ Res Public Health. 2020;17:1891. 10.3390/ijerph17061891 [DOI] [PMC free article] [PubMed] [Google Scholar]
- 223. Reaven GM. Role of insulin resistance in human disease. Diabetes. 1988;37:1595‐607. 10.2337/diab.37.12.1595 [DOI] [PubMed] [Google Scholar]
- 224. DeFronzo RA, Ferrannini E. Insulin resistance: a multifaceted syndrome responsible for NIDDM, obesity, hypertension, dyslipidemia, and atherosclerotic cardiovascular disease. Diabetes Care. 1991;14:173‐194. 10.2337/diacare.14.3.173 [DOI] [PubMed] [Google Scholar]
- 225. Kaplan NM. The deadly quartet. Arch Intern Med. 1989;149:1514. 10.1001/archinte.1989.00390070054005 [DOI] [PubMed] [Google Scholar]
- 226. Huang PL. A comprehensive definition for metabolic syndrome. Dis Model Mech. 2009;2:231‐237. 10.1242/dmm.001180 [DOI] [PMC free article] [PubMed] [Google Scholar]
- 227. Chadt A, Scherneck S, Joost H‐G, Al‐Hasani H. Molecular links between obesity and diabetes: “Diabesity.” MDText.com, Inc.; 2000. [Google Scholar]
- 228. Samuel VT, Petersen KF, Shulman GI. Lipid‐induced insulin resistance: unravelling the mechanism. Lancet. 2010;375:2267‐2277. 10.1016/S0140-6736(10)60408-4 [DOI] [PMC free article] [PubMed] [Google Scholar]
- 229. Grundy SM, Hansen B, Smith SC, Cleeman JI, Kahn RA. Clinical management of metabolic syndrome. Circulation. 2004;109:551‐556. 10.1161/01.CIR.0000112379.88385.67 [DOI] [PubMed] [Google Scholar]
- 230. Eckel RH, Grundy SM, Zimmet PZ. The metabolic syndrome. Lancet. 2005;365:1415‐1428. 10.1016/S0140-6736(05)66378-7 [DOI] [PubMed] [Google Scholar]
- 231. Mottillo S, Filion KB, Genest J, et al. The metabolic syndrome and cardiovascular risk. J Am Coll Cardiol. 2010;56:1113‐1132. 10.1016/j.jacc.2010.05.034 [DOI] [PubMed] [Google Scholar]
- 232. Cebo M, Dittrich K, Fu X, et al. Platelet ACKR3/CXCR7 favors antiplatelet lipids over an atherothrombotic lipidome and regulates thromboinflammation. Blood. 2022;139:1722‐1742. 10.1182/blood.2021013097 [DOI] [PubMed] [Google Scholar]
- 233. Lauber C, Gerl MJ, Klose C, Ottosson F, Melander O, Simons K. Lipidomic risk scores are independent of polygenic risk scores and can predict incidence of diabetes and cardiovascular disease in a large population cohort. PLOS Biol. 2022;20:e3001561. 10.1371/journal.pbio.3001561 [DOI] [PMC free article] [PubMed] [Google Scholar]
- 234. Xu Y, Han Y, Wang Y, et al. Ambient air pollution and atherosclerosis: a potential mediating role of sphingolipids. Arterioscler Thromb Vasc Biol. 2022;42:906‐918. 10.1161/ATVBAHA.122.317753 [DOI] [PubMed] [Google Scholar]
- 235. Liu X, Zhang H, Si Y, Du Y, Wu J, Li J. High‐coverage lipidomics analysis reveals biomarkers for diagnosis of acute exacerbation of chronic obstructive pulmonary disease. J Chromatogr B. 2022;1201–1202:123278. 10.1016/j.jchromb.2022.123278 [DOI] [PubMed] [Google Scholar]
- 236. Olkowicz M, Ribeiro RVP, Yu F, et al. Dynamic metabolic changes during prolonged ex situ heart perfusion are associated with myocardial functional decline. Front Immunol. 2022;13:859506. 10.3389/fimmu.2022.859506 [DOI] [PMC free article] [PubMed] [Google Scholar]
- 237. Kosek V, Hajšl M, Bechyňská K, et al. Long‐term effects on the lipidome of acute coronary syndrome patients. Metabolites. 2022;12:124. 10.3390/metabo12020124 [DOI] [PMC free article] [PubMed] [Google Scholar]
- 238. Nodeland M, Klevjer M, Sæther J, et al. Atherogenic lipidomics profile in healthy individuals with low cardiorespiratory fitness: The HUNT3 fitness study. Atherosclerosis. 2022;343:51‐57. 10.1016/j.atherosclerosis.2022.01.001 [DOI] [PubMed] [Google Scholar]
- 239. Zhou Y, Chen J, Li S, et al. Prognostic implication of lipidomics in patients with coronary total occlusion undergoing PCI. Eur J Clin Invest. 2022;52:13826. 10.1111/eci.13826 [DOI] [PMC free article] [PubMed] [Google Scholar]
- 240. Mansell T, Saffery R, Burugupalli S, et al. Early life infection and proinflammatory, atherogenic metabolomic and lipidomic profiles in infancy: a population‐based cohort study. Elife. 2022;11:e75170. 10.7554/eLife.75170 [DOI] [PMC free article] [PubMed] [Google Scholar]
- 241. Huang C‐Y, Tsai P‐J, Wu H‐W, Chen I‐T, Wang H‐YJ. Quantitative analyses and validation of phospholipids and sphingolipids in ischemic rat brains. Metabolites. 2022;12:1075. 10.3390/metabo12111075 [DOI] [PMC free article] [PubMed] [Google Scholar]
- 242. Leandro AC, Michael LF, Almeida M, et al. Influence of the human lipidome on epicardial fat volume in Mexican American individuals. Front Cardiovasc Med. 2022;9:889985. 10.3389/fcvm.2022.889985 [DOI] [PMC free article] [PubMed] [Google Scholar]
- 243. Lim SY, Lim FLS, Criado‐Navarro I, et al. Multi‐omics investigation into acute myocardial infarction: an integrative method revealing interconnections amongst the metabolome, lipidome, glycome, and metallome. Metabolites. 2022;12:1080. 10.3390/metabo12111080 [DOI] [PMC free article] [PubMed] [Google Scholar]
- 244. Cadby G, Giles C, Melton PE, et al. Comprehensive genetic analysis of the human lipidome identifies loci associated with lipid homeostasis with links to coronary artery disease. Nat Commun. 2022;13:3124. 10.1038/s41467-022-30875-7 [DOI] [PMC free article] [PubMed] [Google Scholar]
- 245. Nieddu G, Michelucci E, Formato M, et al. Molecular characterization of plasma HDL, LDL, and VLDL lipids cargos from atherosclerotic patients with advanced carotid lesions: a preliminary report. Int J Mol Sci. 2022;23:12449. 10.3390/ijms232012449 [DOI] [PMC free article] [PubMed] [Google Scholar]
- 246. Stănciulescu L‐A, Scafa A, Duduianu C, et al. Lipoprofiling assessed by NMR spectroscopy in patients with acute coronary syndromes: is there a need for fasting prior to sampling? Diagnostics. 2022;12:1675. 10.3390/diagnostics12071675 [DOI] [PMC free article] [PubMed] [Google Scholar]
- 247. Zarini S, Brozinick JT, Zemski Berry KA, et al. Serum dihydroceramides correlate with insulin sensitivity in humans and decrease insulin sensitivity in vitro. J Lipid Res. 2022;63:100270. 10.1016/j.jlr.2022.100270 [DOI] [PMC free article] [PubMed] [Google Scholar]
- 248. Shang Z, Liu Y, Yuan Y‐Y, Wang X‐Y, Yu H‐Y, Gao W. Early identification of STEMI patients with emergency chest pain using lipidomics combined with machine learning. J Geriatr Cardiol. 2022;19:685‐695. 10.11909/j.issn.1671-5411.2022.09.003 [DOI] [PMC free article] [PubMed] [Google Scholar]
- 249. Huang Z, Klaric L, Krasauskaite J, et al. Serum metabolomic profiles associated with subclinical and clinical cardiovascular phenotypes in people with type 2 diabetes. Cardiovasc Diabetol. 2022;21:62. 10.1186/s12933-022-01493-w [DOI] [PMC free article] [PubMed] [Google Scholar]
- 250. Chen L, Xu R, McDonald JD, Bruno RS, Choueiry F, Zhu J. Dairy milk casein and whey proteins differentially alter the postprandial lipidome in persons with prediabetes: a comparative lipidomics study. J Agric Food Chem. 2022;70:10209‐10220. 10.1021/acs.jafc.2c03662 [DOI] [PMC free article] [PubMed] [Google Scholar]
- 251. Fei C, Ji D, Tong H, et al. Therapeutic mechanism of Curcuma aromatica Salisb. rhizome against coronary heart disease based on integrated network pharmacology, pharmacological evaluation and lipidomics. Front Pharmacol. 2022;13. 10.3389/fphar.2022.950749 [DOI] [PMC free article] [PubMed] [Google Scholar]
- 252. Wang Z, Peters BA, Usyk M, et al. Gut microbiota, plasma metabolomic profiles, and carotid artery atherosclerosis in HIV infection. Arterioscler Thromb Vasc Biol. 2022;42:1081‐1093. 10.1161/ATVBAHA.121.317276 [DOI] [PMC free article] [PubMed] [Google Scholar]
- 253. Barchuk M, Ancel P, Miksztowicz V, et al. Epicardial adipose tissue ceramides are related to lipoprotein lipase activity in coronary artery disease: unfolding a missing link. Arterioscler Thromb Vasc Biol. 2022;42. 10.1161/ATVBAHA.122.317840 [DOI] [PubMed] [Google Scholar]
- 254. Caligiuri SPB, Pierce GN, Ravandi A, Aukema HM. The plasma oxylipidome links smoking status to peripheral artery disease. Metabolites. 2022;12:627. 10.3390/metabo12070627 [DOI] [PMC free article] [PubMed] [Google Scholar]
- 255. Brial F, Hedjazi L, Sonomura K, et al. Genetic architecture of untargeted lipidomics in cardiometabolic‐disease patients combines strong polygenic control and pleiotropy. Metabolites. 2022;12:596. 10.3390/metabo12070596 [DOI] [PMC free article] [PubMed] [Google Scholar]
- 256. Hansen CS, Suvitaival T, Theilade S, et al. Cardiovascular autonomic neuropathy in type 1 diabetes is associated with disturbances in TCA, lipid, and glucose metabolism. Front Endocrinol. 2022;13:831793. 10.3389/fendo.2022.831793 [DOI] [PMC free article] [PubMed] [Google Scholar]
- 257. Zhang L, Hu Y, An Y, Wang Q, Liu J, Wang G. The changes of lipidomic profiles reveal therapeutic effects of exenatide in patients with type 2 diabetes. Front Endocrinol. 2022;13:677202. 10.3389/fendo.2022.677202 [DOI] [PMC free article] [PubMed] [Google Scholar]
- 258. Guo J, Wang H, Jiang X, et al. An untargeted lipidomics study of acute ischemic stroke with hyperglycemia based on ultrahigh‐performance liquid chromatography‐mass spectrometry. Comput Math Methods Med. 2022;2022:8332278. 10.1155/2022/8332278 [DOI] [PMC free article] [PubMed] [Google Scholar]
- 259. Wang J, Liu J‐J, Gurung RL, et al. Clinical variable‐based cluster analysis identifies novel subgroups with a distinct genetic signature, lipidomic pattern and cardio‐renal risks in Asian patients with recent‐onset type 2 diabetes. Diabetologia. 2022;65:2146‐2156. 10.1007/s00125-022-05741-2 [DOI] [PMC free article] [PubMed] [Google Scholar]
- 260. Li H, Ma Y, Feng N, Wang W, He C. Exploration of potential biomarkers for type 2 diabetes by UPLC‐QTOF‐MS and WGCNA of skin surface lipids. Clin Cosmet Investig Dermatol. 2022;15:87‐96. 10.2147/CCID.S347245 [DOI] [PMC free article] [PubMed] [Google Scholar]
- 261. Afshinnia F, Reynolds EL, Rajendiran TM, et al. Serum lipidomic determinants of human diabetic neuropathy in type 2 diabetes. Ann Clin Transl Neurol. 2022;9:1392‐13404. 10.1002/acn3.51639 [DOI] [PMC free article] [PubMed] [Google Scholar]
- 262. Alcazar O, Ogihara M, Ren G, Buchwald P, Abdulreda MH. Exploring computational data amplification and imputation for the discovery of type 1 diabetes (T1D) biomarkers from limited human datasets. Biomolecules. 2022;12:1444. 10.3390/biom12101444 [DOI] [PMC free article] [PubMed] [Google Scholar]
- 263. Denimal D, Benanaya S, Monier S, et al. Normal HDL cholesterol efflux and anti‐inflammatory capacities in type 2 diabetes despite lipidomic abnormalities. J Clin Endocrinol Metab. 2022;107:e3816‐e3823. 10.1210/clinem/dgac339 [DOI] [PMC free article] [PubMed] [Google Scholar]
- 264. Feng J, Wang Y, Li W, et al. High levels of oxidized fatty acids in HDL impair the antioxidant function of HDL in patients with diabetes. Front Endocrinol. 2022;13:993193. 10.3389/fendo.2022.993193 [DOI] [PMC free article] [PubMed] [Google Scholar]
- 265. Kostara CE, Karakitsou KS, Florentin M, Bairaktari ET, Tsimihodimos V. Progressive, qualitative, and quantitative alterations in HDL lipidome from healthy subjects to patients with prediabetes and type 2 diabetes. Metabolites. 2022;12:683. 10.3390/metabo12080683 [DOI] [PMC free article] [PubMed] [Google Scholar]
- 266. Pappa E, Kostara C, Bairaktari E, Arvaniti E, Tsimihodimos V. Effect of fixed‐dose combination of insulin degludec and liraglutide on apoB‐containing lipoprotein subclasses and HDL lipidome in type 2 diabetes. J Diabetes Complications. 2022;36:108286. 10.1016/j.jdiacomp.2022.108286 [DOI] [PubMed] [Google Scholar]
- 267. Qiu G, Wang H, Yan Q, et al. A lipid signature with perturbed triacylglycerol co‐regulation, identified from targeted lipidomics, predicts risk for type 2 diabetes and mediates the risk from adiposity in two prospective cohorts of Chinese adults. Clin Chem. 2022;68:1094‐1107. 10.1093/clinchem/hvac090 [DOI] [PubMed] [Google Scholar]
- 268. Wang J, Zhang Y, Li W, Zhou F, Li J. Changes in the lipid profile of aqueous humor from diabetic cataract patients. Transl Vis Sci Technol. 2022;11:5. 10.1167/tvst.11.11.5 [DOI] [PMC free article] [PubMed] [Google Scholar]
- 269. Wang Y, Wu P, Huang Y, et al. BMI and lipidomic biomarkers with risk of gestational diabetes in pregnant women. Obesity. 2022;30:2044‐2054. 10.1002/oby.23517 [DOI] [PubMed] [Google Scholar]
- 270. Wu I‐W, Tsai T‐H, Lo C‐J, et al. Discovering a trans‐omics biomarker signature that predisposes high risk diabetic patients to diabetic kidney disease. Npj Digit Med. 2022;5:166. 10.1038/s41746-022-00713-7 [DOI] [PMC free article] [PubMed] [Google Scholar]
- 271. Xuan Q, Hu C, Zhang Y, et al. Serum lipidomics profiles reveal potential lipid markers for prediabetes and type 2 diabetes in patients from multiple communities. Front Endocrinol. 2022;13:966823. 10.3389/fendo.2022.966823 [DOI] [PMC free article] [PubMed] [Google Scholar]
- 272. Zhong J, Cheung CYY, Su X, et al. Specific triacylglycerol, diacylglycerol, and lyso‐phosphatidylcholine species for the prediction of type 2 diabetes: a ∼ 16‐year prospective study in Chinese. Cardiovasc Diabetol. 2022;21:234. 10.1186/s12933-022-01677-4 [DOI] [PMC free article] [PubMed] [Google Scholar]
- 273. Li J, Xu M, Xing B, et al. Combination of Salviae Miltiorrhizae Radix et Rhizoma and Carthami Flos improves cardiac function of diabetic cardiomyopathy mice by regulating the unfolded protein response signaling pathway. Phyther Res. 2022;36:3571‐3583. 10.1002/ptr.7524 [DOI] [PubMed] [Google Scholar]
- 274. Zhang Z, Piro AL, Allalou A, et al. Prolactin and maternal metabolism in women with a recent GDM pregnancy and links to future T2D: the SWIFT study. J Clin Endocrinol Metab. 2022;107:2652‐2665. 10.1210/clinem/dgac346 [DOI] [PMC free article] [PubMed] [Google Scholar]
- 275. Tian H, Wang S, Deng Y, et al. Fatty acid profiles and their association with autoimmunity, insulin sensitivity and β cell function in latent autoimmune diabetes in adults. Front Endocrinol. 2022;13:916981. 10.3389/fendo.2022.916981 [DOI] [PMC free article] [PubMed] [Google Scholar]
- 276. Al‐Sari N, Kutuzova S, Suvitaival T, et al. Precision diagnostic approach to predict 5‐year risk for microvascular complications in type 1 diabetes. EBioMedicine. 2022;80:104032. 10.1016/j.ebiom.2022.104032 [DOI] [PMC free article] [PubMed] [Google Scholar]
- 277. Coleman MJ, Espino LM, Lebensohn H, et al. Individuals with metabolic syndrome show altered fecal lipidomic profiles with no signs of intestinal inflammation or increased intestinal permeability. Metabolites. 2022;12:431. 10.3390/metabo12050431 [DOI] [PMC free article] [PubMed] [Google Scholar]
- 278. Jiang D, He J, Hua S, et al. A comparative lipidomic study of the human placenta from women with or without gestational diabetes mellitus. Mol Omi. 2022;18:545‐554. 10.1039/D2MO00083K [DOI] [PubMed] [Google Scholar]
- 279. Huang W‐C, Xu J‐W, Li S, Ng XE, Tung Y‐T. Effects of exercise on high‐fat diet–induced non‐alcoholic fatty liver disease and lipid metabolism in ApoE knockout mice. Nutr Metab. 2022;19:10. 10.1186/s12986-022-00644-w [DOI] [PMC free article] [PubMed] [Google Scholar]
- 280. Casulleras M, Flores‐Costa R, Duran‐Güell M, et al. Albumin lipidomics reveals meaningful compositional changes in advanced cirrhosis and its potential to promote inflammation resolution. Hepatol Commun. 2022;6:1443‐1456. 10.1002/hep4.1893 [DOI] [PMC free article] [PubMed] [Google Scholar]
- 281. Zhu S, Zhang J, Wang W, Jiang X, Chen YQ. Blockage of NDUFB9‐SCD1 pathway inhibits adipogenesis. J Physiol Biochem. 2022;78:377‐388. 10.1007/s13105-022-00876-7 [DOI] [PubMed] [Google Scholar]
- 282. Sun Z, Tang Z, Yang X, et al. 3‐tert‐butyl‐4‐hydroxyanisole impairs hepatic lipid metabolism in male mice fed with a high‐fat diet. Environ Sci Technol. 2022;56:3204‐3213. 10.1021/acs.est.1c07182 [DOI] [PubMed] [Google Scholar]
- 283. Frandsen HS, Vej‐Nielsen JM, Smith LE, et al. Mapping proteome and lipidome changes in early‐onset non‐alcoholic fatty liver disease using hepatic 3D spheroids. Cells. 2022;11:3216. 10.3390/cells11203216 [DOI] [PMC free article] [PubMed] [Google Scholar]
- 284. Harrison SA, Mayo PR, Hobbs TM, et al. Rencofilstat, a cyclophilin inhibitor: A phase 2a, multicenter, single‐blind, placebo‐controlled study in F2/F3 NASH. Hepatol Commun. 2022;6:3379‐3392. 10.1002/hep4.2100 [DOI] [PMC free article] [PubMed] [Google Scholar]
- 285. Martínez‐Sanz J, Calvo MV, Serrano‐Villar S, et al. Effects of HIV infection in plasma free fatty acid profiles among people with non‐alcoholic fatty liver disease. J Clin Med. 2022;11:3842. 10.3390/jcm11133842 [DOI] [PMC free article] [PubMed] [Google Scholar]
- 286. Hudert CA, Adams LA, Alisi A, et al. Variants in mitochondrial amidoxime reducing component 1 and hydroxysteroid 17‐beta dehydrogenase 13 reduce severity of nonalcoholic fatty liver disease in children and suppress fibrotic pathways through distinct mechanisms. Hepatol Commun. 2022;6:1934‐1948. 10.1002/hep4.1955 [DOI] [PMC free article] [PubMed] [Google Scholar]
- 287. Gao B, Wu T‐C, Lang S, et al. Machine learning applied to omics datasets predicts mortality in patients with alcoholic hepatitis. Metabolites. 2022;12:41. 10.3390/metabo12010041 [DOI] [PMC free article] [PubMed] [Google Scholar]
- 288. Šmíd V, Dvořák K, Šedivý P, et al. Effect of omega‐3 polyunsaturated fatty acids on lipid metabolism in patients with metabolic syndrome and NAFLD. Hepatol Commun. 2022;6:1336‐1349. 10.1002/hep4.1906 [DOI] [PMC free article] [PubMed] [Google Scholar]
- 289. Gao B, Zeng S, Maccioni L, et al. Lipidomics for the prediction of progressive liver disease in patients with alcohol use disorder. Metabolites. 2022;12:433. 10.3390/metabo12050433 [DOI] [PMC free article] [PubMed] [Google Scholar]
- 290. McGlinchey AJ, Govaere O, Geng D, et al. Metabolic signatures across the full spectrum of non‐alcoholic fatty liver disease. JHEP Reports. 2022;4:100477. 10.1016/j.jhepr.2022.100477 [DOI] [PMC free article] [PubMed] [Google Scholar]
- 291. Gadgil MD, Sarkar M, Sands C, Lewis MR, Herrington DM, Kanaya AM. Associations of NAFLD with circulating ceramides and impaired glycemia. Diabetes Res Clin Pract. 2022;186:109829. 10.1016/j.diabres.2022.109829 [DOI] [PMC free article] [PubMed] [Google Scholar]
- 292. Sánchez‐Rodríguez MB, Téllez É, Casulleras M, et al. Reduced plasma extracellular vesicle CD5L content in patients with acute‐on‐chronic liver failure: interplay with specialized pro‐resolving lipid mediators. Front Immunol. 2022;13:842996. 10.3389/fimmu.2022.842996 [DOI] [PMC free article] [PubMed] [Google Scholar]
- 293. Zhu Q, Li H, Ao Z, et al. Lipidomic identification of urinary extracellular vesicles for non‐alcoholic steatohepatitis diagnosis. J Nanobiotechnology. 2022;20:349. 10.1186/s12951-022-01540-4 [DOI] [PMC free article] [PubMed] [Google Scholar]
- 294. Dalle C, Tournayre J, Mainka M, et al. The plasma oxylipin signature provides a deep phenotyping of metabolic syndrome complementary to the clinical criteria. Int J Mol Sci. 2022;23:11688. 10.3390/ijms231911688 [DOI] [PMC free article] [PubMed] [Google Scholar]
- 295. Mocciaro G, D'Amore S, Jenkins B, et al. Lipidomic approaches to study HDL metabolism in patients with central obesity diagnosed with metabolic syndrome. Int J Mol Sci. 2022;23:6786. 10.3390/ijms23126786 [DOI] [PMC free article] [PubMed] [Google Scholar]
- 296. Lahelma M, Qadri S, Ahlholm N, et al. The human liver lipidome is significantly related to the lipid composition and aggregation susceptibility of low‐density lipoprotein (LDL) particles. Atherosclerosis. 2022;363:22‐29. 10.1016/j.atherosclerosis.2022.11.018 [DOI] [PubMed] [Google Scholar]
- 297. Secor JD, Cho BS, Yu LJ, et al. Structurally‐engineered fatty acid 1024 (SEFA‐1024) improves diet‐induced obesity, insulin resistance, and fatty liver disease. Lipids. 2022;57:241‐255. 10.1002/lipd.12351 [DOI] [PMC free article] [PubMed] [Google Scholar]
- 298. Sot J, García‐Arribas A, Abad B, et al. Erythrocyte membrane nanomechanical rigidity is decreased in obese patients. Int J Mol Sci. 2022;23:1920. 10.3390/ijms23031920 [DOI] [PMC free article] [PubMed] [Google Scholar]
- 299. Gonzalez PA, Simcox J, Raff H, et al. Lipid signatures of chronic pain in female adolescents with and without obesity. Lipids Health Dis. 2022;21:80. 10.1186/s12944-022-01690-2 [DOI] [PMC free article] [PubMed] [Google Scholar]
- 300. Mir SA, Chen L, Burugupalli S, et al. Population‐based plasma lipidomics reveals developmental changes in metabolism and signatures of obesity risk: a mother‐offspring cohort study. BMC Med. 2022;20:242. 10.1186/s12916-022-02432-y [DOI] [PMC free article] [PubMed] [Google Scholar]
- 301. Wilhelmsen A, Davies A, Mallinson J, et al. Acute effects of prior dietary fat ingestion on postprandial metabolic responses to protein and carbohydrate co‐ingestion in overweight and obese men: A randomised crossover trial. Clin Nutr. 2022;41:1623‐1635. 10.1016/j.clnu.2022.06.022 [DOI] [PubMed] [Google Scholar]
- 302. Bischoff M, Zimny S, Feiner S, et al. Multidisciplinary lifestyle intervention is associated with improvements in liver damage and in surrogate scores of NAFLD and liver fibrosis in morbidly obese patients. Eur J Nutr. 2022;61:2725‐2735. 10.1007/s00394-022-02846-7 [DOI] [PMC free article] [PubMed] [Google Scholar]
- 303. Al‐Shaer AE, Regan J, Buddenbaum N, et al. Enriched marine oil supplement increases specific plasma specialized pro‐resolving mediators in adults with obesity. J Nutr. 2022;152:1783‐1791. 10.1093/jn/nxac075 [DOI] [PMC free article] [PubMed] [Google Scholar]
- 304. dos Santos KG, Yoshinaga MY, Glezer I, et al. Orange juice intake by obese and insulin‐resistant subjects lowers specific plasma triglycerides: A randomized clinical trial. Clin Nutr ESPEN. 2022;51:336‐344. 10.1016/j.clnesp.2022.08.005 [DOI] [PubMed] [Google Scholar]
- 305. Szczerbinski L, Wojciechowska G, Olichwier A, et al. Untargeted metabolomics analysis of the serum metabolic signature of childhood obesity. Nutrients. 2022;14:214. 10.3390/nu14010214 [DOI] [PMC free article] [PubMed] [Google Scholar]
- 306. World Health Organization . The top 10 causes of death 2020. Accessed January 13, https://www.who.int/news‐room/fact‐sheets/detail/the‐top‐10‐causes‐of‐death 2023.
- 307. DeWeerdt S. Uneven attention hampers the drive to control infectious diseases. Nat Index. 2021;598:S10‐S13. [Google Scholar]
- 308. Lydic TA, Goo Y‐H. Lipidomics unveils the complexity of the lipidome in metabolic diseases. Clin Transl Med. 2018;7:e4. 10.1186/s40169-018-0182-9 [DOI] [PMC free article] [PubMed] [Google Scholar]
- 309. Theken KN, FitzGerald GA. Bioactive lipids in antiviral immunity. Science. 2021;371:237‐238. 10.1126/science.abf3192 [DOI] [PubMed] [Google Scholar]
- 310. Brandenburg J, Heyckendorf J, Marwitz F, et al. Tuberculostearic acid‐containing phosphatidylinositols as markers of bacterial burden in tuberculosis. ACS Infect Dis. 2022;8:1303‐1315. 10.1021/acsinfecdis.2c00075 [DOI] [PMC free article] [PubMed] [Google Scholar]
- 311. Masip J, Rallón N, Yeregui E, et al. Elevated α‐ketoglutaric acid concentrations and a lipid‐balanced signature are the key factors in long‐term HIV control. Front Immunol. 2022;13:822272. 10.3389/fimmu.2022.822272 [DOI] [PMC free article] [PubMed] [Google Scholar]
- 312. Olund Villumsen S, Benfeitas R, Knudsen AD, et al. Integrative lipidomics and metabolomics for system‐level understanding of the metabolic syndrome in long‐term treated HIV‐infected individuals. Front Immunol. 2022;12:742736. 10.3389/fimmu.2021.742736 [DOI] [PMC free article] [PubMed] [Google Scholar]
- 313. Bowman ER, Wilson M, Riedl KM, et al. Lipidome alterations with exercise among people with and without HIV: an exploratory study. AIDS Res Hum Retrovir. 2022;38:544‐551. 10.1089/aid.2021.0154 [DOI] [PMC free article] [PubMed] [Google Scholar]
- 314. Chambrion C, Depond M, Angella L, et al. Altered subpopulations of red blood cells and post‐treatment anemia in malaria. Front Physiol. 2022;13:875189. 10.3389/fphys.2022.875189 [DOI] [PMC free article] [PubMed] [Google Scholar]
- 315. Hershkovitz I, Donoghue HD, Minnikin DE, et al. Detection and molecular characterization of 9000‐year‐old Mycobacterium tuberculosis from a neolithic settlement in the Eastern Mediterranean. PLoS One. 2008;3:e3426. 10.1371/journal.pone.0003426 [DOI] [PMC free article] [PubMed] [Google Scholar]
- 316. World Health Organization . Tuberculosis. 2021. Accessed January 13, https://www.who.int/news‐room/fact‐sheets/detail/tuberculosis 2023.
- 317. Centers for Disease Control and Prevention . HIV. 2023. Accessed January 13, https://www.cdc.gov/hiv/basics/whatishiv.html 2023.
- 318. World Health Organization . HIV 2023. Accessed January 13, https://www.who.int/news‐room/fact‐sheets/detail/hiv‐aids 2023.
- 319. Kharsany ABM, Karim QA. HIV infection and AIDS in Sub‐Saharan Africa: current status, challenges and opportunities. Open AIDS J. 2016;10:34‐48. 10.2174/1874613601610010034 [DOI] [PMC free article] [PubMed] [Google Scholar]
- 320. Dwyer‐Lindgren L, Cork MA, Sligar A, et al. Mapping HIV prevalence in sub‐Saharan Africa between 2000 and 2017. Nature. 2019;570:189‐193. 10.1038/s41586-019-1200-9 [DOI] [PMC free article] [PubMed] [Google Scholar]
- 321. World Health Organization . WHO Coronavirus (COVID‐19) dashboard 2022. Accessed January 12, 2023 https://covid19.who.int/
- 322. Saud Z, Tyrrell VJ, Zaragkoulias A, et al. The SARS‐CoV2 envelope differs from host cells, exposes procoagulant lipids, and is disrupted in vivo by oral rinses. J Lipid Res. 2022;63:100208. 10.1016/j.jlr.2022.100208 [DOI] [PMC free article] [PubMed] [Google Scholar]
- 323. Castañé H, Iftimie S, Baiges‐Gaya G, et al. Machine learning and semi‐targeted lipidomics identify distinct serum lipid signatures in hospitalized COVID‐19‐positive and COVID‐19‐negative patients. Metabolism. 2022;131:155197. 10.1016/j.metabol.2022.155197 [DOI] [PMC free article] [PubMed] [Google Scholar]
- 324. Kida M, Nakamura T, Kobayashi K, Shimosawa T, Murata T. Urinary lipid profile of patients with coronavirus diseases 2019. Front Med. 2022;9:941563. 10.3389/fmed.2022.941563 [DOI] [PMC free article] [PubMed] [Google Scholar]
- 325. Pike DP, McGuffee RM, Geerling E, et al. Plasmalogen loss in sepsis and SARS‐CoV‐2 infection. Front Cell Dev Biol. 2022;10:912880. 10.3389/fcell.2022.912880 [DOI] [PMC free article] [PubMed] [Google Scholar]
- 326. Schuurman AR, Léopold V, Pereverzeva L, et al. The platelet lipidome is altered in patients with COVID‐19 and correlates with platelet reactivity. Thromb Haemost. 2022;122:1683‐1692. 10.1055/s-0042-1749438 [DOI] [PMC free article] [PubMed] [Google Scholar]
- 327. Žarković N, Orehovec B, Baršić B, et al. Lipidomics revealed plasma phospholipid profile differences between deceased and recovered COVID‐19 patients. Biomolecules. 2022;12:1488. 10.3390/biom12101488 [DOI] [PMC free article] [PubMed] [Google Scholar]
- 328. Biagini D, Franzini M, Oliveri P, et al. MS‐based targeted profiling of oxylipins in COVID‐19: A new insight into inflammation regulation. Free Radic Biol Med. 2022;180:236‐243. 10.1016/j.freeradbiomed.2022.01.021 [DOI] [PMC free article] [PubMed] [Google Scholar]
- 329. Ciccarelli M, Merciai F, Carrizzo A, et al. Untargeted lipidomics reveals specific lipid profiles in COVID‐19 patients with different severity from Campania region (Italy). J Pharm Biomed Anal. 2022;217:114827. 10.1016/j.jpba.2022.114827 [DOI] [PMC free article] [PubMed] [Google Scholar]
- 330. Karu N, Kindt A, Lamont L, et al. Plasma oxylipins and their precursors are strongly associated with COVID‐19 severity and with immune response markers. Metabolites. 2022;12:619. 10.3390/metabo12070619 [DOI] [PMC free article] [PubMed] [Google Scholar]
- 331. Lipman D, Safo SE, Chekouo T. Multi‐omic analysis reveals enriched pathways associated with COVID‐19 and COVID‐19 severity. PLoS One. 2022;17:e0267047. 10.1371/journal.pone.0267047 [DOI] [PMC free article] [PubMed] [Google Scholar]
- 332. Ghini V, Meoni G, Pelagatti L, et al. Profiling metabolites and lipoproteins in COMETA, an Italian cohort of COVID‐19 patients. PLOS Pathog. 2022;18:e1010443. 10.1371/journal.ppat.1010443 [DOI] [PMC free article] [PubMed] [Google Scholar]
- 333. Speranza E, Purushotham JN, Port JR, et al. Age‐related differences in immune dynamics during SARS‐CoV‐2 infection in rhesus macaques. Life Sci Alliance. 2022;5:e202101314. 10.26508/lsa.202101314 [DOI] [PMC free article] [PubMed] [Google Scholar]
- 334. Batra R, Whalen W, Alvarez‐Mulett S, et al. Multi‐omic comparative analysis of COVID‐19 and bacterial sepsis‐induced ARDS. PLOS Pathog. 2022;18:e1010819. 10.1371/journal.ppat.1010819 [DOI] [PMC free article] [PubMed] [Google Scholar]
- 335. Guntur VP, Nemkov T, de Boer E, et al. Signatures of mitochondrial dysfunction and impaired fatty acid metabolism in plasma of patients with post‐acute sequelae of COVID‐19 (PASC). Metabolites. 2022;12:1026. 10.3390/metabo12111026 [DOI] [PMC free article] [PubMed] [Google Scholar]
- 336. Balta MG, Papathanasiou E, Christopoulos PF. Specialized pro‐resolving mediators as potential regulators of inflammatory macrophage responses in COVID‐19. Front Immunol. 2021;12. 10.3389/fimmu.2021.632238 [DOI] [PMC free article] [PubMed] [Google Scholar]
- 337. Bossuyt PM. Where are all the new omics‐based tests? Clin Chem. 2014;60:1256‐1257. 10.1373/clinchem.2014.223339 [DOI] [PubMed] [Google Scholar]
- 338. Trifonova OP, Maslov DL, Balashova EE, Lokhov PG. Mass spectrometry‐based metabolomics diagnostics – myth or reality? Expert Rev Proteomics. 2021;18:7‐12. 10.1080/14789450.2021.1893695 [DOI] [PubMed] [Google Scholar]
- 339. Pinu FR, Goldansa202300009z SA, Jaine J. Translational metabolomics: current challenges and future opportunities. Metabolites. 2019;9:108. 10.3390/metabo9060108 [DOI] [PMC free article] [PubMed] [Google Scholar]
- 340. Trivedi DK, Hollywood KA, Goodacre R. Metabolomics for the masses: the future of metabolomics in a personalized world. New Horizons Transl Med. 2017;3:294‐305. 10.1016/j.nhtm.2017.06.001 [DOI] [PMC free article] [PubMed] [Google Scholar]
- 341. Hood L, Flores M. A personal view on systems medicine and the emergence of proactive P4 medicine: predictive, preventive, personalized and participatory. N Biotechnol. 2012;29:613‐624. 10.1016/j.nbt.2012.03.004 [DOI] [PubMed] [Google Scholar]
- 342. Clish CB. Metabolomics: an emerging but powerful tool for precision medicine. Mol Case Stud. 2015;1:a000588. 10.1101/mcs.a000588 [DOI] [PMC free article] [PubMed] [Google Scholar]
- 343. Mathur S, Sutton J. Personalized medicine could transform healthcare. Biomed Reports. 2017;7:3‐5. 10.3892/br.2017.922 [DOI] [PMC free article] [PubMed] [Google Scholar]
- 344. Vicente AM, Ballensiefen W, Jönsson J‐I. How personalised medicine will transform healthcare by 2030: the ICPerMed vision. J Transl Med. 2020;18:180. 10.1186/s12967-020-02316-w [DOI] [PMC free article] [PubMed] [Google Scholar]
- 345. Lancaster SM, Lee‐McMullen B, Abbott CW, et al. Global, distinctive, and personal changes in molecular and microbial profiles by specific fibers in humans. Cell Host Microbe. 2022;30:848‐862.e7. 10.1016/j.chom.2022.03.036 [DOI] [PMC free article] [PubMed] [Google Scholar]
- 346. Burugupalli S, Smith AAT, Oshlensky G, et al. Ontogeny of circulating lipid metabolism in pregnancy and early childhood – a longitudinal population study. Elife. 2022;11:e72779. 10.7554/eLife.72779 [DOI] [PMC free article] [PubMed] [Google Scholar]
- 347. Zhang L, Bi S, Liang Y, et al. Integrated metabolomic and lipidomic analysis in the placenta of preeclampsia. Front Physiol. 2022;13:807583. 10.3389/fphys.2022.807583 [DOI] [PMC free article] [PubMed] [Google Scholar]
- 348. Xu Y, Chen X, Han Y, et al. Ceramide metabolism mediates the impaired glucose homeostasis following short‐term black carbon exposure: A targeted lipidomic analysis. Sci Total Environ. 2022;829:154657. 10.1016/j.scitotenv.2022.154657 [DOI] [PubMed] [Google Scholar]
- 349. Koh JH, Yoon SJ, Kim M, et al. Lipidome profile predictive of disease evolution and activity in rheumatoid arthritis. Exp Mol Med. 2022;54:143‐155. 10.1038/s12276-022-00725-z [DOI] [PMC free article] [PubMed] [Google Scholar]
- 350. Li X, Zhang L, Li T, et al. Abplatin(IV) inhibited tumor growth on a patient derived cancer model of hepatocellular carcinoma and its comparative multi‐omics study with cisplatin. J Nanobiotechnol. 2022;20:258. 10.1186/s12951-022-01465-y [DOI] [PMC free article] [PubMed] [Google Scholar]
- 351. Avisar H, Guardia‐Laguarta C, Surface M, et al. Lipid level alteration in human and cellular models of alpha synuclein mutations. Npj Park Dis. 2022;8:52. 10.1038/s41531-022-00313-y [DOI] [PMC free article] [PubMed] [Google Scholar]
- 352. Butera A, Roy M, Zampieri C, et al. p53‐driven lipidome influences non‐cell‐autonomous lysophospholipids in pancreatic cancer. Biol Direct. 2022;17:6. 10.1186/s13062-022-00319-9 [DOI] [PMC free article] [PubMed] [Google Scholar]
- 353. Merciai F, Musella S, Sommella E, Bertamino A, D'Ursi AM, Campiglia P. Development and application of a fast ultra‐high performance liquid chromatography‐trapped ion mobility mass spectrometry method for untargeted lipidomics. J Chromatogr A. 2022;1673:463124. 10.1016/j.chroma.2022.463124 [DOI] [PubMed] [Google Scholar]
- 354. DeVeaux SA, Ogle ME, Vyshnya S, et al. Characterizing human mesenchymal stromal cells’ immune‐modulatory potency using targeted lipidomic profiling of sphingolipids. Cytotherapy. 2022;24:608‐618. 10.1016/j.jcyt.2021.12.009 [DOI] [PMC free article] [PubMed] [Google Scholar]
- 355. Lamichhane S, Siljander H, Salonen M, et al. Impact of extensively hydrolyzed infant formula on circulating lipids during early life. Front Nutr. 2022;9:859627. 10.3389/fnut.2022.859627 [DOI] [PMC free article] [PubMed] [Google Scholar]
- 356. Zandl‐Lang M, Züllig T, Trötzmüller M, et al. Changes in the cerebrospinal fluid and plasma lipidome in patients with Rett syndrome. Metabolites. 2022;12:291. 10.3390/metabo12040291 [DOI] [PMC free article] [PubMed] [Google Scholar]
- 357. Rangel‐Huerta OD, de la Torre‐Aguilar MJ, Mesa MD, et al. The metabolic impact of two different parenteral nutrition lipid emulsions in children after hematopoietic stem cell transplantation: a lipidomics investigation. Int J Mol Sci. 2022;23:3667. 10.3390/ijms23073667 [DOI] [PMC free article] [PubMed] [Google Scholar]
- 358. Iwuchukwu I, Nguyen D, Shirazian A, Asatryan A, Jun B, Bazan NG. Neuroprotectin D1, a lipid anti‐inflammatory mediator, in patients with intracerebral hemorrhage. Biochimie. 2022;195:16‐18. 10.1016/j.biochi.2021.12.017 [DOI] [PubMed] [Google Scholar]
- 359. Guo L, Zhang T, Li R, et al. Alterations in the plasma lipidome of adult women with bipolar disorder: a mass spectrometry‐based lipidomics research. Front Psychiatry. 2022;13:802710. 10.3389/fpsyt.2022.802710 [DOI] [PMC free article] [PubMed] [Google Scholar]
- 360. Mastrogiovanni M, Trostchansky A, Naya H, et al. HPLC‐MS/MS oxylipin analysis of plasma from amyotrophic lateral sclerosis patients. Biomedicines. 2022;10:674. 10.3390/biomedicines10030674 [DOI] [PMC free article] [PubMed] [Google Scholar]
- 361. White JB, Trim PJ, Salagaras T, et al. Equivalent carbon number and interclass retention time conversion enhance lipid identification in untargeted clinical lipidomics. Anal Chem. 2022;94:3476‐3484. 10.1021/acs.analchem.1c03770 [DOI] [PubMed] [Google Scholar]
- 362. Franck M, de Toro‐Martín J, Varin TV, et al. Raspberry consumption: identification of distinct immune‐metabolic response profiles by whole blood transcriptome profiling. J Nutr Biochem. 2022;101:108946. 10.1016/j.jnutbio.2022.108946 [DOI] [PubMed] [Google Scholar]
- 363. Huang Z, Luo R, Yang L, et al. CPT1A‐mediated fatty acid oxidation promotes precursor osteoclast fusion in rheumatoid arthritis. Front Immunol. 2022;13:838664. 10.3389/fimmu.2022.838664 [DOI] [PMC free article] [PubMed] [Google Scholar]
- 364. Zhu Z, Wang W, Zha Y, et al. Transcriptomic and lipidomic profiles in nasal polyps of glucocorticoid responders and non‐responders: before and after treatment. Front Pharmacol. 2022;12:814953. 10.3389/fphar.2021.814953 [DOI] [PMC free article] [PubMed] [Google Scholar]
- 365. Nikolic P, Mudgil P, Harman DG, Whitehall J. Untargeted lipidomic differences between clinical strains of methicillin‐sensitive and methicillin‐resistant Staphylococcus aureus. Infect Dis. 2022;54:497‐507. 10.1080/23744235.2022.2049863 [DOI] [PubMed] [Google Scholar]
- 366. Kuan P‐F, Yang X, Kotov R, Clouston S, Bromet E, Luft BJ. Metabolomics analysis of post‐traumatic stress disorder symptoms in World Trade Center responders. Transl Psychiatry. 2022;12:174. 10.1038/s41398-022-01940-y [DOI] [PMC free article] [PubMed] [Google Scholar]
- 367. Shen L, Lv X, Yang X, et al. Bufotenines‐loaded liposome exerts anti‐inflammatory, analgesic effects and reduce gastrointestinal toxicity through altering lipid and bufotenines metabolism. Biomed Pharmacother. 2022;153:113492. 10.1016/j.biopha.2022.113492 [DOI] [PubMed] [Google Scholar]
- 368. Konjevod M, Sáiz J, Nikolac Perkovic M, et al. Plasma lipidomics in subjects with combat posttraumatic stress disorder. Free Radic Biol Med. 2022;189:169‐177. 10.1016/j.freeradbiomed.2022.07.012 [DOI] [PubMed] [Google Scholar]
- 369. Boddupalli CS, Nair S, Belinsky G, et al. Neuroinflammation in neuronopathic Gaucher disease: role of microglia and NK cells, biomarkers, and response to substrate reduction therapy. Elife. 2022;11. 10.7554/eLife.79830 [DOI] [PMC free article] [PubMed] [Google Scholar]
- 370. Can M, Sengül T, Demir SA, İnci OK, Basırlı H, Seyrantepe V. Analysis of brain lipids in the early‐onset Tay–Sachs disease mouse model with the combined deficiency of β‐hexosaminidase A and neuraminidase 3. Front Mol Biosci. 2022;9:892248. 10.3389/fmolb.2022.892248 [DOI] [PMC free article] [PubMed] [Google Scholar]
- 371. Zhang D, Jiang L, Li L, et al. Integrated metabolomics revealed the fibromyalgia‐alleviation effect of Mo2C nanozyme through regulated homeostasis of oxidative stress and energy metabolism. Biomaterials. 2022;287:121678. 10.1016/j.biomaterials.2022.121678 [DOI] [PubMed] [Google Scholar]
- 372. Loef M, van de Stadt L, Böhringer S, et al. The association of the lipid profile with knee and hand osteoarthritis severity: the IMI‐APPROACH cohort. Osteoarthr Cartil. 2022;30:1062‐1069. 10.1016/j.joca.2022.05.008 [DOI] [PubMed] [Google Scholar]
- 373. Zhang W, Zhao H, Du P, et al. Integration of metabolomics and lipidomics reveals serum biomarkers for systemic lupus erythematosus with different organs involvement. Clin Immunol. 2022;241:109057. 10.1016/j.clim.2022.109057 [DOI] [PubMed] [Google Scholar]
- 374. Li J, Li L, Liu R, Zhu et al. Integrative lipidomic features identify plasma lipid signatures in chronic urticaria. Front Immunol. 2022;13:933312. 10.3389/fimmu.2022.933312 [DOI] [PMC free article] [PubMed] [Google Scholar]
- 375. Zhang T, Guo L, Li R, et al. Alterations of plasma lipids in adult women with major depressive disorder and bipolar depression. Front Psychiatry. 2022;13:927817. 10.3389/fpsyt.2022.927817 [DOI] [PMC free article] [PubMed] [Google Scholar]
- 376. Yu J, Cheng Q, He F, et al. Altered intestinal microbiomes and lipid metabolism in patients with prolonged disorders of consciousness. Front Immunol. 2022;13:781148. 10.3389/fimmu.2022.781148 [DOI] [PMC free article] [PubMed] [Google Scholar]
- 377. Tan S, Feng X, Liu Z, et al. The pro‐inflammatory effect of triglyceride on human CD4+ T cells and experimental autoimmune uveitis. Clin Immunol. 2022;240:109056. 10.1016/j.clim.2022.109056 [DOI] [PubMed] [Google Scholar]
- 378. Zhu Z, Zeng Q, Wang Z, et al. Skin microbiome reconstruction and lipid metabolism profile alteration reveal the treatment mechanism of Cryptotanshinone in the acne rat. Phytomedicine. 2022;101:154101. 10.1016/j.phymed.2022.154101 [DOI] [PubMed] [Google Scholar]
- 379. Gao Y, Li J, Fan S, Chen P, Huang M, Bi H. Lipid analysis of follicular fluids by UHPLC‐ESI‐HRMS discovers potential biomarkers for ovarian hyperstimulation syndrome. Front Endocrinol. 2022;13:895116. 10.3389/fendo.2022.895116 [DOI] [PMC free article] [PubMed] [Google Scholar]
- 380. Shum M, London CM, Briottet M, et al. CF patients’ airway epithelium and sex contribute to biosynthesis defects of pro‐resolving lipids. Front Immunol. 2022;13:915261. 10.3389/fimmu.2022.915261 [DOI] [PMC free article] [PubMed] [Google Scholar]
- 381. Pannkuk EL, Laiakis EC, Garty G, et al. Biofluid metabolomics and lipidomics of mice exposed to external very high‐dose rate radiation. Metabolites. 2022;12:520. 10.3390/metabo12060520 [DOI] [PMC free article] [PubMed] [Google Scholar]
- 382. Huang NK, Matthan NR, Matuszek G, Lichtenstein AH. Plasma metabolite response to simple, refined and unrefined carbohydrate‐enriched diets in older adults—randomized controlled crossover trial. Metabolites. 2022;12:547. 10.3390/metabo12060547 [DOI] [PMC free article] [PubMed] [Google Scholar]
- 383. Starodubtseva NL, Chagovets V V, Nekrasova ME, et al. Shotgun lipidomics for differential diagnosis of HPV‐associated cervix transformation. Metabolites. 2022;12:503. 10.3390/metabo12060503 [DOI] [PMC free article] [PubMed] [Google Scholar]
- 384. Chao de la Barca JM, Richard A, Robert P, et al. Metabolomic profiling of angiotensin‐II‐induced abdominal aortic aneurysm in Ldlr−/− mice points to alteration of nitric oxide, lipid, and energy metabolisms. Int J Mol Sci. 2022;23:6387. 10.3390/ijms23126387 [DOI] [PMC free article] [PubMed] [Google Scholar]
- 385. Ding W, Hu Y, Yu X, He C, Tian Y. Analysis on the difference of skin surface lipids during blue light therapy for acne by lipidomics. Biomed Opt Express. 2022;13:3434. 10.1364/BOE.452614 [DOI] [PMC free article] [PubMed] [Google Scholar]
- 386. McGurk KA, Farrell L, Kendall AC, Keavney BD, Nicolaou A. Genetic analyses of circulating PUFA‐derived mediators identifies heritable dihydroxyeicosatrienoic acid species. Prostaglandins Other Lipid Mediat. 2022;160:106638. 10.1016/j.prostaglandins.2022.106638 [DOI] [PubMed] [Google Scholar]
- 387. Ma Y, Cui L, Tian Y, He C. Lipidomics analysis of facial lipid biomarkers in females with self‐perceived skin sensitivity. Heal Sci Reports. 2022;5:e632. 10.1002/hsr2.632 [DOI] [PMC free article] [PubMed] [Google Scholar]
- 388. Zhang J, Lu L, Tian X, et al. Lipidomics revealed aberrant lipid metabolism caused by inflammation in cardiac tissue in the early stage of systemic lupus erythematosus in a murine model. Metabolites. 2022;12:415. 10.3390/metabo12050415 [DOI] [PMC free article] [PubMed] [Google Scholar]
- 389. Khan MBN, Iftikhar F, Ali M, et al. XMN polymorphism along with HU administration renders alterations to RBC membrane lipidome in β‐thalassemia patients. Chem Phys Lipids. 2022;244:105195. 10.1016/j.chemphyslip.2022.105195 [DOI] [PubMed] [Google Scholar]
- 390. Yin X, Mongan D, Cannon M, et al. Plasma lipid alterations in young adults with psychotic experiences: a study from the Avon longitudinal study of parents and children cohort. Schizophr Res. 2022;243:78‐85. 10.1016/j.schres.2022.02.029 [DOI] [PubMed] [Google Scholar]
- 391. Shen H, Liu X, Chen Y, HE B, Cheng W. Associations of lipid levels during gestation with hypertensive disorders of pregnancy and gestational diabetes mellitus: a prospective longitudinal cohort study. BMJ Open. 2016;6:e013509. 10.1136/bmjopen-2016-013509 [DOI] [PMC free article] [PubMed] [Google Scholar]
- 392. Yan X, Zhao W, Wei J, et al. A serum lipidomics study for the identification of specific biomarkers for endometrial polyps to distinguish them from endometrial cancer or hyperplasia. Int J Cancer. 2022;150:1549‐1559. 10.1002/ijc.33943 [DOI] [PubMed] [Google Scholar]
- 393. Khan MBN, Iftikhar F, Khan T, et al. IVS I‐5 is associated with changes to the RBC membrane lipidome in response to hydroxyurea treatment in β‐thalassemia patients. Mol Omi. 2022;18:534‐544. 10.1039/D2MO00008C [DOI] [PubMed] [Google Scholar]
- 394. Huang X, Luu LDW, Jia N, et al. Multi‐platform omics analysis reveals molecular signatures for pathogenesis and activity of systemic lupus erythematosus. Front Immunol. 2022;13:833699. 10.3389/fimmu.2022.833699 [DOI] [PMC free article] [PubMed] [Google Scholar]
- 395. Shah RM, Jadhav SR, Phan L, Tremellen K, Tran CD, Beale DJ. Plasma metabolic and lipidomic fingerprinting of individuals with increased intestinal permeability. Metabolites. 2022;12:302. 10.3390/metabo12040302 [DOI] [PMC free article] [PubMed] [Google Scholar]
- 396. Liu T, Dogan I, Rothe M, et al. Bioaccumulation of blood long‐chain fatty acids during hemodialysis. Metabolites. 2022;12:269. 10.3390/metabo12030269 [DOI] [PMC free article] [PubMed] [Google Scholar]
- 397. Yeung MHY, Leung KL, Choi LY, et al. Lipidomic analysis reveals the protection mechanism of GLP‐1 analogue dulaglutide on high‐fat diet‐induced chronic kidney disease in mice. Front Pharmacol. 2022;12:777395. 10.3389/fphar.2021.777395 [DOI] [PMC free article] [PubMed] [Google Scholar]
- 398. Ma C, Liu M, Tian J, et al. Lipidomic profiling identifies serum lipids associated with persistent multisite musculoskeletal pain. Metabolites. 2022;12:206. 10.3390/metabo12030206 [DOI] [PMC free article] [PubMed] [Google Scholar]
- 399. Kepchia D, Huang L, Currais A, Liang Z, Fischer W, Maher P. The Alzheimer's disease drug candidate J147 decreases blood plasma fatty acid levels via modulation of AMPK/ACC1 signaling in the liver. Biomed Pharmacother. 2022;147:112648. 10.1016/j.biopha.2022.112648 [DOI] [PMC free article] [PubMed] [Google Scholar]
- 400. Zhao H, Wu S‐N, Shao Y, et al. Lipidomics profiles revealed alterations in patients with meibomian gland dysfunction after exposure to intense pulsed light. Front Neurol. 2022;13:827544. 10.3389/fneur.2022.827544 [DOI] [PMC free article] [PubMed] [Google Scholar]
- 401. Đurašević S, Ružičić A, Lakić I, et al. The effects of a meldonium pre‐treatment on the course of the LPS‐induced sepsis in rats. Int J Mol Sci. 2022;23:2395. 10.3390/ijms23042395 [DOI] [PMC free article] [PubMed] [Google Scholar]
- 402. Yan Y, Wang J, Huang D, et al. Plasma lipidomics analysis reveals altered lipids signature in patients with osteonecrosis of the femoral head. Metabolomics. 2022;18:14. 10.1007/s11306-022-01872-0 [DOI] [PubMed] [Google Scholar]
- 403. Cai Y, Xu Y, Ban Y, et al. Plasma lipid profile and intestinal microflora in pregnancy women with hypothyroidism and their correlation with pregnancy outcomes. Front Endocrinol. 2022;12:792536. 10.3389/fendo.2021.792536 [DOI] [PMC free article] [PubMed] [Google Scholar]
- 404. Görs PE, Wittenhofer P, Ayala‐Cabrera JF, Meckelmann SW. Potential of atmospheric pressure ionization sources for the analysis of free fatty acids in clinical and biological samples by gas chromatography‐mass spectrometry. Anal Bioanal Chem. 2022;414:6621‐6634. 10.1007/s00216-022-04223-z [DOI] [PMC free article] [PubMed] [Google Scholar]
- 405. Sanders AE, Weatherspoon ED, Ehrmann BM, et al. Circulating omega‐6 and omega‐3 polyunsaturated fatty acids in painful temporomandibular disorder and low back pain. J Pain. 2022;23:1724‐1736. 10.1016/j.jpain.2022.05.008 [DOI] [PMC free article] [PubMed] [Google Scholar]
- 406. Sanders AE, Weatherspoon ED, Ehrmann BM, et al. Ratio of omega‐6/omega‐3 polyunsaturated fatty acids associated with somatic and depressive symptoms in people with painful temporomandibular disorder and irritable bowel syndrome. J Pain. 2022;23:1737‐1748. 10.1016/j.jpain.2022.04.006 [DOI] [PMC free article] [PubMed] [Google Scholar]
- 407. Kalecký K, German DC, Montillo AA, Bottiglieri T. Targeted metabolomic analysis in Alzheimer's disease plasma and brain tissue in Non‐Hispanic whites. J Alzheimer's Dis. 2022;86:1875‐1895. 10.3233/JAD-215448 [DOI] [PMC free article] [PubMed] [Google Scholar]
- 408. Xi C, Zhao H, Liu H‐X, et al. Screening of radiation gastrointestinal injury biomarkers in rat plasma by high‐coverage targeted lipidomics. Biomarkers. 2022;27:448‐460. 10.1080/1354750X.2022.2056920 [DOI] [PubMed] [Google Scholar]
- 409. Liu T, Dogan I, Rothe M, et al. Hemodialysis and plasma oxylipin biotransformation in peripheral tissue. Metabolites. 2022;12:34. 10.3390/metabo12010034 [DOI] [PMC free article] [PubMed] [Google Scholar]
- 410. Abdelhamid SS, Scioscia J, Vodovotz Y, et al. Multi‐omic admission‐based prognostic biomarkers identified by machine learning algorithms predict patient recovery and 30‐day survival in trauma patients. Metabolites. 2022;12:774. 10.3390/metabo12090774 [DOI] [PMC free article] [PubMed] [Google Scholar]
- 411. Aleidi SM, Al‐Ansa202300009ri MM, Alnehmi EA, et al. Lipidomics profiling of patients with low bone mineral density (LBMD). Int J Mol Sci. 2022;23:12017. 10.3390/ijms231912017 [DOI] [PMC free article] [PubMed] [Google Scholar]
- 412. Berdyshev E, Goleva E, Bissonnette R, et al. Dupilumab significantly improves skin barrier function in patients with moderate‐to‐severe atopic dermatitis. Allergy. 2022;77:3388‐3397. 10.1111/all.15432 [DOI] [PubMed] [Google Scholar]
- 413. Bernecker C, Matzhold EM, Kolb D, et al. Membrane properties of human induced pluripotent stem cell‐derived cultured red blood cells. Cells. 2022;11:2473. 10.3390/cells11162473 [DOI] [PMC free article] [PubMed] [Google Scholar]
- 414. Bishop LM, Fiehn O. Comprehensive lipidomic profiling by plasma separation cards. Anal Bioanal Chem. 2023;415:193‐201. 10.1007/s00216-022-04399-4 [DOI] [PMC free article] [PubMed] [Google Scholar]
- 415. Chen Z, Shi J, Zhang Y, et al. Lipidomics profiles and lipid metabolite biomarkers in serum of coal workers’ pneumoconiosis. Toxics. 2022;10:496. 10.3390/toxics10090496 [DOI] [PMC free article] [PubMed] [Google Scholar]
- 416. Choi E, Mir SA, Ji S, et al. Understanding the systemic burden of disease in hidradenitis suppurativa from plasma lipidomic analysis. J Dermatol Sci. 2022;107:133‐141. 10.1016/j.jdermsci.2022.08.005 [DOI] [PubMed] [Google Scholar]
- 417. Dakterzada F, Benítez ID, Targa A, et al. Blood‐based lipidomic signature of severe obstructive sleep apnoea in Alzheimer's disease. Alzheimers Res Ther. 2022;14:163. 10.1186/s13195-022-01102-8 [DOI] [PMC free article] [PubMed] [Google Scholar]
- 418. Ding Y, Jiang Y, Zhu M, et al. Follicular fluid lipidomic profiling reveals potential biomarkers of polycystic ovary syndrome: A pilot study. Front Endocrinol. 2022;13:960274. 10.3389/fendo.2022.960274 [DOI] [PMC free article] [PubMed] [Google Scholar]
- 419. Du Preez A, Lefèvre‐Arbogast S, González‐Domínguez R, et al. Impaired hippocampal neurogenesis in vitro is modulated by dietary‐related endogenous factors and associated with depression in a longitudinal ageing cohort study. Mol Psychiatry. 2022;27:3425‐3440. 10.1038/s41380-022-01644-1 [DOI] [PMC free article] [PubMed] [Google Scholar]
- 420. Ebright B, Assante I, Poblete RA, et al. Eicosanoid lipidome activation in post‐mortem brain tissues of individuals with APOE4 and Alzheimer's dementia. Alzheimers Res Ther. 2022;14:152. 10.1186/s13195-022-01084-7 [DOI] [PMC free article] [PubMed] [Google Scholar]
- 421. Emonds JJ, Ringel C, Reinicke M, et al. Influence of trimethylamine N‐oxide on platelet activation. Nutrients. 2022;14:3261. 10.3390/nu14163261 [DOI] [PMC free article] [PubMed] [Google Scholar]
- 422. Fujiogi M, Zhu Z, Raita Y, et al. Nasopharyngeal lipidomic endotypes of infants with bronchiolitis and risk of childhood asthma: a multicentre prospective study. Thorax. 2022:thoraxjnl‐2022‐219016. 10.1136/thorax-2022-219016 [DOI] [PMC free article] [PubMed] [Google Scholar]
- 423. Furse S, Kusinski LC, Ray A, et al. Relative abundance of lipid metabolites in spermatozoa across three compartments. Int J Mol Sci. 2022;23:11655. 10.3390/ijms231911655 [DOI] [PMC free article] [PubMed] [Google Scholar]
- 424. Gonzalez‐Riano C, Santos M, Díaz M, et al. Birth weight and early postnatal outcomes: association with the cord blood lipidome. Nutrients. 2022;14:3760. 10.3390/nu14183760 [DOI] [PMC free article] [PubMed] [Google Scholar]
- 425. Hermans ME, van Weeghel M, Vaz FM, et al. Multi‐omics in classical galactosemia: evidence for the involvement of multiple metabolic pathways. J Inherit Metab Dis. 2022;45:1094‐1105. 10.1002/jimd.12548 [DOI] [PubMed] [Google Scholar]
- 426. Hong X, Cai Z, Zhou F, et al. Improved pharmacokinetics of tenofovir ester prodrugs strengthened the inhibition of HBV replication and the rebalance of hepatocellular metabolism in preclinical models. Front Pharmacol. 2022;13:932934. 10.3389/fphar.2022.932934 [DOI] [PMC free article] [PubMed] [Google Scholar]
- 427. Huang H, Jiesisibieke D, Zhou X, et al. A lipid metabolite lipidomics assay for prediction and severity evaluation of rotator cuff injury. Front Nutr. 2022;9:1000947. 10.3389/fnut.2022.1000947 [DOI] [PMC free article] [PubMed] [Google Scholar]
- 428. Ivanova AA, Rees JC, Parks BA, et al. Integrated quantitative targeted lipidomics and proteomics reveal unique fingerprints of multiple metabolic conditions. Biomolecules. 2022;12:1439. 10.3390/biom12101439 [DOI] [PMC free article] [PubMed] [Google Scholar]
- 429. Lauritano A, Cipollone I, Verde R, et al. The endocannabinoidome mediator N‐oleoylglycine is a novel protective agent against 1‐methyl‐4‐phenyl‐pyridinium‐induced neurotoxicity. Front Aging Neurosci. 2022;14:926634. 10.3389/fnagi.2022.926634 [DOI] [PMC free article] [PubMed] [Google Scholar]
- 430. Li W, Sun X, Liu Y, et al. Plasma metabolomics and lipidomics signatures of motoric cognitive risk syndrome in community‐dwelling older adults. Front Aging Neurosci. 2022;14:977191. 10.3389/fnagi.2022.977191 [DOI] [PMC free article] [PubMed] [Google Scholar]
- 431. Lillo A, Marin S, Serrano‐Marín J, et al. Targeted metabolomics shows that the level of glutamine, kynurenine, acyl‐carnitines and lysophosphatidylcholines is significantly increased in the aqueous humor of glaucoma patients. Front Med. 2022;9:935084. 10.3389/fmed.2022.935084 [DOI] [PMC free article] [PubMed] [Google Scholar]
- 432. Liu N, Guo Y‐N, Wang X‐J, et al. Copy number analyses identified a novel gene: APOBEC3A related to lipid metabolism in the pathogenesis of preeclampsia. Front Cardiovasc Med. 2022;9:841249. 10.3389/fcvm.2022.841249 [DOI] [PMC free article] [PubMed] [Google Scholar]
- 433. Liu X, Gao L, Huang X, et al. Lipidomics reveals the potential mechanism of honokiol against adenine‐induced chronic kidney disease. Front Pharmacol. 2022;13:1019629. 10.3389/fphar.2022.1019629 [DOI] [PMC free article] [PubMed] [Google Scholar]
- 434. López de Frutos L, Almeida F, Murillo‐Saich J, et al. Serum phospholipid profile changes in Gaucher disease and Parkinson's disease. Int J Mol Sci. 2022;23:10387. 10.3390/ijms231810387 [DOI] [PMC free article] [PubMed] [Google Scholar]
- 435. Lu Z, Liu C, Wu Q, Deng Y. High‐coverage targeted lipidomics could reveal lipid alterations and evaluate therapeutic efficacy of membranous nephropathy. Nutr Metab. 2022;19:68. 10.1186/s12986-022-00701-4 [DOI] [PMC free article] [PubMed] [Google Scholar]
- 436. Mousa H, Elrayess MA, Diboun I, Jackson SK, Zughaier SM. Metabolomics profiling of vitamin D status in relation to dyslipidemia. Metabolites. 2022;12:771. 10.3390/metabo12080771 [DOI] [PMC free article] [PubMed] [Google Scholar]
- 437. Navarro SL, Zheng Z, Randolph TW, et al. Lipidomics of cyclophosphamide 4‐hydroxylation in patients receiving post‐transplant cyclophosphamide. Clin Transl Sci. 2022;15:2772‐2780. 10.1111/cts.13404 [DOI] [PMC free article] [PubMed] [Google Scholar]
- 438. Rabcuka J, Blonski S, Meli A, et al. Metabolic reprogramming under hypoxic storage preserves faster oxygen unloading from stored red blood cells. Blood Adv. 2022;6:5415‐5428. 10.1182/bloodadvances.2022007774 [DOI] [PMC free article] [PubMed] [Google Scholar]
- 439. Ramírez‐Vélez R, Martínez‐Velilla N, Correa‐Rodríguez M, et al. Lipidomic signatures from physically frail and robust older adults at hospital admission. GeroScience. 2022;44:1677‐1688. 10.1007/s11357-021-00511-1 [DOI] [PMC free article] [PubMed] [Google Scholar]
- 440. Saito K, Gemma A, Tatsumi K, et al. Identification and characterization of lysophosphatidylcholine 14:0 as a biomarker for drug‐induced lung disease. Sci Rep. 2022;12:19819. 10.1038/s41598-022-24406-z [DOI] [PMC free article] [PubMed] [Google Scholar]
- 441. Sánchez‐Fernández A, Zandee S, Mastrogiovanni M, et al. Administration of Maresin‐1 ameliorates the physiopathology of experimental autoimmune encephalomyelitis. J Neuroinflammation. 2022;19:27. 10.1186/s12974-022-02386-1 [DOI] [PMC free article] [PubMed] [Google Scholar]
- 442. Seeliger B, Carleo A, Wendel‐Garcia PD, et al. Changes in serum metabolomics in idiopathic pulmonary fibrosis and effect of approved antifibrotic medication. Front Pharmacol. 2022;13:837680. 10.3389/fphar.2022.837680 [DOI] [PMC free article] [PubMed] [Google Scholar]
- 443. Straat ME, Jurado‐Fasoli L, Ying Z, et al. Cold exposure induces dynamic changes in circulating triacylglycerol species, which is dependent on intracellular lipolysis: A randomized cross‐over trial. EBioMedicine. 2022;86:104349. 10.1016/j.ebiom.2022.104349 [DOI] [PMC free article] [PubMed] [Google Scholar]
- 444. Tao S, Zhang Y, Wang Q, et al. Identifying transdiagnostic biological subtypes across schizophrenia, bipolar disorder, and major depressive disorder based on lipidomics profiles. Front Cell Dev Biol. 2022;10:969575. 10.3389/fcell.2022.969575 [DOI] [PMC free article] [PubMed] [Google Scholar]
- 445. Wang D, Ho ES, Cotticelli MG, et al. Skin fibroblast metabolomic profiling reveals that lipid dysfunction predicts the severity of Friedreich's ataxia. J Lipid Res. 2022;63:100255. 10.1016/j.jlr.2022.100255 [DOI] [PMC free article] [PubMed] [Google Scholar]
- 446. Wang F, Guo L, Zhang T, et al. Alterations in plasma lipidomic profiles in adult patients with schizophrenia and major depressive disorder. Medicina (B Aires). 2022;58:1509. 10.3390/medicina58111509 [DOI] [PMC free article] [PubMed] [Google Scholar]
- 447. Wang M‐G, Wu S‐Q, Zhang M‐M, He J‐Q. Plasma metabolomic and lipidomic alterations associated with anti‐tuberculosis drug‐induced liver injury. Front Pharmacol. 2022;13:1044808. 10.3389/fphar.2022.1044808 [DOI] [PMC free article] [PubMed] [Google Scholar]
- 448. Wohlfarter Y, Eidelpes R, Yu RD, et al. Lost in promiscuity? An evolutionary and biochemical evaluation of HSD10 function in cardiolipin metabolism. Cell Mol Life Sci. 2022;79:562. 10.1007/s00018-022-04579-6 [DOI] [PMC free article] [PubMed] [Google Scholar]
- 449. Yau A, Fear MW, Gray N, et al. Enhancing the accuracy of surgical wound excision following burns trauma via application of Rapid Evaporative Ionisation Mass Spectrometry (REIMS). Burns. 2022;48:1574‐1583. 10.1016/j.burns.2022.08.021 [DOI] [PubMed] [Google Scholar]
- 450. Ye X, Zhu B, Chen Y, et al. Integrated metabolomics and lipidomics approach for the study of metabolic network and early diagnosis in cerebral infarction. J Proteome Res. 2022;21:2635‐2646. 10.1021/acs.jproteome.2c00348 [DOI] [PubMed] [Google Scholar]
- 451. Yeudall S, Upchurch CM, Seegren P V., et al. Macrophage acetyl‐CoA carboxylase regulates acute inflammation through control of glucose and lipid metabolism. Sci Adv. 2022;8. 10.1126/sciadv.abq1984 [DOI] [PMC free article] [PubMed] [Google Scholar]
- 452. Yin H, Qiu Z, Zhu R, et al. Dysregulated lipidome of sebum in patients with atopic dermatitis. Allergy. 2022. 10.1111/all.15569 [DOI] [PubMed] [Google Scholar]
- 453. Zeng W, Beyene HB, Kuokkanen M, et al. Lipidomic profiling in the Strong Heart Study identified American Indians at risk of chronic kidney disease. Kidney Int. 2022;102:1154‐1166. 10.1016/j.kint.2022.06.023 [DOI] [PMC free article] [PubMed] [Google Scholar]
- 454. Zhang L, Wen X, Hou Y, et al. Integrated metabolomics and lipidomics study of patients with atopic dermatitis in response to dupilumab. Front Immunol. 2022;13:1002536. 10.3389/fimmu.2022.1002536 [DOI] [PMC free article] [PubMed] [Google Scholar]
- 455. Zhang W, Yuan Y, Li X, et al. Orange‐derived and dexamethasone‐encapsulated extracellular vesicles reduced proteinuria and alleviated pathological lesions in IgA nephropathy by targeting intestinal lymphocytes. Front Immunol. 2022;13:900963. 10.3389/fimmu.2022.900963 [DOI] [PMC free article] [PubMed] [Google Scholar]
- 456. Zhou M, Li C, Han X, et al. Lipidomic analysis reveals altered lipid profiles of gingival tissues with periodontitis. J Clin Periodontol. 2022;49:1192‐1202. 10.1111/jcpe.13710 [DOI] [PubMed] [Google Scholar]
- 457. Zhu Y, Zhang L, Zhang X, et al. Tripterygium wilfordii glycosides ameliorates collagen‐induced arthritis and aberrant lipid metabolism in rats. Front Pharmacol. 2022;13:938849. 10.3389/fphar.2022.938849 [DOI] [PMC free article] [PubMed] [Google Scholar]
Associated Data
This section collects any data citations, data availability statements, or supplementary materials included in this article.
Data Availability Statement
Data sharing is not applicable to this article as no new data were created or analysed in this study.