

Abstract
Transcription regulation is controlled by coordinated binding of one or more transcription factors in the promoter regions of genes. In many species, especially higher eukaryotes, transcription factor binding sites tend to occur as homotypic or heterotypic clusters, also known as cis-regulatory modules. The number of sites and distances between the sites, however, vary greatly in a module. We propose a statistical model to describe the underlying cluster structure as well as individual motif conservation and develop a Monte Carlo motif screening strategy for predicting novel regulatory modules in upstream sequences of coregulated genes. We demonstrate the power of the method with examples ranging from bacterial to insect and human genomes.
Keywords: evolutionary Monte Carlo, gene regulation, hidden Markov models, transcription factor binding sites
Transcription factor binding sites (TFBSs) are short sequence segments (≈10 bp) located near genes' transcription start sites (TSSs) and are recognized by respective transcription factors (TFs) for gene regulation. Laboratory assays such as electrophoretic mobility shift assays and DNase footprinting have been developed to locate TFBSs on a gene-by-gene and site-by-site basis, but these methods are laborious, time-consuming, and unsuitable for large-scale studies. Computational methods thus have become necessary for genome-wide analyses of transcription regulation.
TFBSs recognized by the same TF usually show a conserved pattern, which is often called a TF binding motif (TFBM) and modeled by a position-specific weight matrix (PSWM) with each of its columns describing the occurrence frequencies of the four nucleotides in the corresponding motif position. Over the past decade, a spate of computational methods have been developed to infer TFBMs for sets of coregulated genes (1-9). There also have been efforts to improve motif prediction by correlating sequence patterns with mRNA expression data (10, 11) or by using comparative genomics information (12-14). Although these methods have been very successful for bacterial and yeast genomes, they have met with limited success in mammalian genomes.
The main difficulties with in silico TFBM predictions in high eukaryotes include the increased volume of the sequence search space, with proximal TFBSs occurring a few kilobases away from the TSSs; the increased occurrence of low-complexity repeats; the increased complexity in combinatorial controls; and shorter and less-conserved TFBSs. Despite these challenges, there are two possible redeeming factors: (i) many eukaryotic genomes have been or are being sequenced, and comparative genomic analysis can be extremely powerful; and (ii) most eukaryotic genes are controlled by a combination of factors with the corresponding binding sites forming homotypic or heterotypic clusters known as “cis-regulatory modules” (CRMs) (15, 16). A statistical model that can explicitly incorporate the CRM concept is likely to bring out more information.
Most available approaches for discovering CRMs have concentrated on either predicting novel motifs and looking for cooccurrences (17) or using experimentally determined motif matrices to search for possible clusters in a predetermined sequence window (12, 18, 19). Some recent methods attempt to incorporate site-clustering information with de novo motif discovery by building a rule to discriminate modules preserving a certain ordering of motifs from sequences with random occurrences of motifs (20, 21). However, these methods do not explicitly specify a probability model and impose restrictive conditions such as a known number of motifs in the module or a known number of occurrences of each motif in the module. The method of Kreiman (22) searches exhaustively for combinations of TFBSs up to four different types obtained from databases or motif search algorithms. However, this method needs some arbitrary criteria set for the definition of a module, such as the maximum module length and a lower bound on the number of genes in which the module must occur. Another factor that none of these methods take into consideration is the ordering preference of the motif sites within a module.
By using a hidden Markov model similar to that in ref. 23 to represent CRM, we develop a method called “emcmodule” for inferring the CRM responsible for a set of coregulated genes. The method starts with an initial collection of putative TFBMs obtained from both de novo motif search by using existing algorithms (6, 7, 9) and databases such as TRANSFAC (24) and JASPAR (25). It then iteratively selects motif types that are likely members of the CRM and updates the corresponding motif sites and parameters. The method employs the evolutionary Monte Carlo (EMC) method (26) for screening the motif candidates and a dynamic programming-based recursion for locating the motif sites.
Methods
Let S be the set of upstream sequences of n coregulated genes for which we want to predict CRMs. We assume that an unknown number K of TFs are involved in these CRMs, with the corresponding unknown weight matrices W1,..., WK. Let Θ = {W1,..., WK}. The location of the jth TFBS in the ith sequence is denoted as Ai,j, and let A be the collection of all site locations. Associated with each site is its type indicator Ti,j, with Ti,j taking one of the K values. Because each TF may have its preferred neighbors, we model the dependence between Ti,j and Ti,j+1 by a K × K transition matrix V. Fig. 1 shows a situation where the rectangular type of TFBSs prefer to follow the pentagon-shaped type. The module can occur anywhere in the sequences with equal probability, and the distance between neighboring TFBSs in a CRM, dij = Ai,j+1 - Ai,j, is assumed to follow the truncated geometric distribution Q(d; λ). The background (nonsite) sequence is modeled by a lth-order Markov chain with transition parameter ρ. These parameters and distributions allow us to write out the probability of the observed sequence data as
 |
[1] |
Fig. 1.

Starting with a set of D putative motifs, emcmodule iterates the above three steps to estimate the posterior probability for each motif to be included in the CRM.
where the summations over all possible motif types and site locations can be completed efficiently by a forward-backward recursion method. To conduct a Bayesian inference on the parameters of interest, we first prescribe a prior distribution P(Θ, V, λ, ρ, K) on the unknowns, and then compute the posterior distribution as
 |
[2] |
The “maximum a posteriori” estimate of the CRM is then the set of Θs that results in the highest value of Eq. 2.
A similar statistical model and inference strategy have been implemented in refs. 23 and 27, where they assumed that K is known and used Markov chain Monte Carlo (28) to explore Eq. 2. However, since the landscape of Θ defined by Eq. 2 is extremely rugged, especially when K is unknown, their search algorithms are easily trapped in local modes. Our strategy is to start with a large collection 𝒟 of putative PSWMs by using existing motif finding tools or databases, and then infer the CRM as a subset M of 𝒟. As illustrated in Fig. 1, the inference process iterates among the following three main steps: (i) Given the CRM configuration M, update the motif site locations; (ii) given motif site locations, update the corresponding PSWMs and other parameters; and (iii) update the CRM configuration by the EMC method.
With given motif types in the CRM and the corresponding site locations A, it is straightforward to update the parameters in the model (e.g., the PSWMs and T for the hidden Markov model) by Gibbs sampling (28). However, updating the motif site locations A requires a forward-backward dynamic programming approach. In the “forward summation” step, we calculate the partial likelihood function by using a recursive formula (Eq. 2.6 in Supporting Text, which is published as supporting information on the PNAS web site), which is based on the fact that given the partial likelihood up to position n - 1 of the sequence, the likelihood up to position n can be found by enumerating and summing over the possibilities that position n is generated from either the background or a motif of type k ending at position n. Then, in the “backward sampling” step, we sample A recursively starting from the end of the sequence. At position n, we decide whether a motif site ends at n or position n is generated from the background model.
Evaluating exhaustively which motifs in𝒟 should be included in the CRM entails O(2D) computation, where D is the size of 𝒟, which is infeasible when D is large. We use EMC (26) to overcome the difficulty. EMC starts with multiple CRM constructions, each of which is represented by a 0-1 vector u of length D, with “1” indicating the inclusion of the corresponding motif in the CRM. Then, by a series of random “crossover” and “mutation” events, the CRM constructions in the population are updated, and the overall “fitness” of the population evolves to an equilibrium. Unlike the genetic algorithm, the EMC allows less fitted individuals (compared with their parents) to be accepted into the population, thus avoiding being too greedy in initial steps. Details on both the forward-backward sampling algorithm and the EMC procedure can be found in Supporting Text. The emcmodule software (written in C) for UNIX and LINUX platforms is available on request from M.G. or J.S.L.
Results
Bacillus subtilis Regulatory Sequences. We collected a set of 142 σA-dependent promoter sequences from B. subtilis (29), almost all of which are located from -100 to +15 relative to known TSSs. Biological evidence suggests that these sequences are expected to contain a motif consisting of two blocks, TTGACA and TATAAT, separated by a variable gap. The two blocks tend to occur at the -28 and -10 positions, respectively.
We chose to use the de novo motif discovery method SDDA (9) to analyze the data because it has a statistically rigorous stopping rule (based on the maximum a posteriori score) to prevent over-fitting. Without any prior knowledge on the number or the spatial arrangement of the motifs, SDDA predicted a set of 15 single-block motif PSWMs as being “enriched.” The site locations of these motifs do not show any clear pattern. The posterior distribution of site types in the module for 20,000 iterations of emcmodule shows that motifs ranked 4, 7 (corresponding to the known patterns TTGACA and TATAAT), and 14 (AATAAA) from SDDA are likely to constitute the “module.” The third pattern is known as an “up-element” that occurs near σA sites. The sites corresponding to the selected motifs show a tendency to occur in identical positions relative to the TSSs (Fig. 2). This example demonstrates that even algorithms with a conservative built-in stopping criterion can turn up a list of motifs containing many false positives when the clustering information is not used and that one can gain substantially in the accuracy of TFBS predictions by using our CRM model.
Fig. 2.

σA binding site prediction from upstream sequences of 142 of B. subtilis genes. (a) Posterior probabilities estimated by emcmodule for each motif to be included in the CRM. (b) Site locations for motifs selected by emcmodule. The x axis gives the sequence number, and the y axis gives the sequence position with “0” corresponding to the TSS of each gene.
Drosophila Developmental Genes. Several genetic and biochemical studies of the Drosophila embryonic development suggest that the cis-regulatory region of the pair-rule gene even-skipped (eve) is organized into a series of discrete sequence regions of ≈500-1,000 bp in length, each of which controls a distinct component of eve's expression pattern (16). This modular organization of cis-regulatory regions is observed in many developmental genes in Drosophila. Several TFs bind to each of these CRMs, and multiple binding sites for each of these factors act combinatorially to regulate transcriptional activity. For example, five TFs that are known to act together in the early Drosophila embryo are Bicoid (Bcd), Caudal (Cd), Hunchback (Hb), Knirps (Kn), and Kruppel (Kr). A number of CRMs composed of varying combinations of these TFBSs have been found to be present in upstream regions of several genes known to be involved in embryonic development of Drosophila (19).
We compiled a set of 15 sequences from the upstream regions of the genes involved in embryonic development (19). For a starting set of motifs, we used both bioprospector (7) and meme (2) in turn, retaining the 50 top-scoring, nonredundant, predicted motifs. In this and the following example (and generally for complex genomes), we do not use SDDA to derive the starting set mainly because it is computationally too expensive for large and complex data sets. To validate our computational predictions, we also collected a set of binding sites derived from DNase protection experiments from the literature (19). However, although we were able to find the frequency of occurrences of each motif type, the exact location of the individual sites was not available for this data set. Hence, we can only compare the composition of the found and experimentally derived motifs but not whether specific instances overlapped on the sequence.
The top 10 motifs selected by meme and bioprospector contained only two of the five expected motifs, whereas alignace discovered no known motifs in its entire run (the stopping criterion being determined internally). By using emcmodule, we found that a set (six to seven) of motifs with a posterior probability of >60% contained sites corresponding to four of the five expected motifs (Table 1). Binding sites for the fifth TF, Knirps, are believed to be present in the sequences upstream of developmental genes but were not found in our data set by the algorithm. For calibration, we permuted the original data sets independently 100 times and used the five matrices to scan these generated data sets. For all of the motifs except Knirps, the motif score and frequency in the original set are much higher than those for the shuffled sets (see Fig. 4, which is published as supporting information on the PNAS web site), hence showing that the Knirps sites may not be abundant enough in the data set for its de novo prediction.
Table 1. Comparison of TFBM predictions for the Drosophila data set.
| Motif count
|
|||||
|---|---|---|---|---|---|
| TF | Logo | BP | MEME | EMCM | Expt. |
| Bicoid | 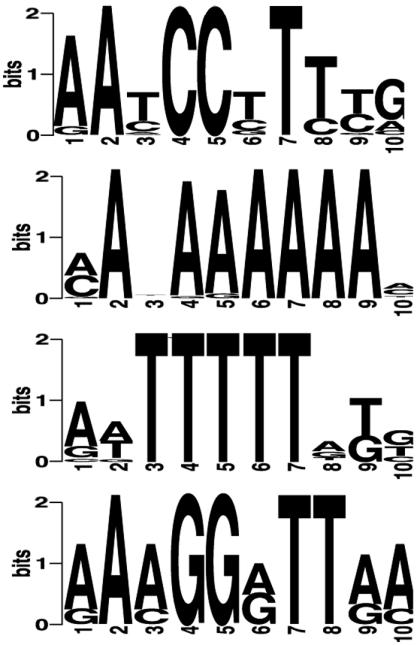 |
— | 32 | 32 | 51 |
| Caudal | 26 | — | 37 | 34 | |
| Hunchback | 24 | 48 | 46 | 93 | |
| Kruppel | — | — | 10 | 37 | |
| Knirps | — | — | — | — | 5 |
The sequence logos (30) are generated from the sites predicted by emcmodule (EMCM). Expt. lists the numbers of experimentally derived sites (although exact locations of these sites on the sequences are not available to us). For bioprospector (BP) and meme, we specified the stopping criterion as to output the five best motifs. cismodule and Gibbs Module Sampler failed to locate any motifs that match the consensus of the known motifs.
We also compared the results for both the B. subtilis and Drosophila data to those obtained by using two other de novo module prediction algorithms, the Gibbs module sampler (23) and cismodule (27). The module sampler requires the input of motif widths and number but no other information about the motifs. cismodule requires the module length to be given and the total number of motif types but does not require information on motifs. Neither of these methods predicted motifs that corresponded to any of the known motifs.
Human and Mouse Skeletal Muscle Regulatory Sequences. In higher eukaryotes, regulatory elements may be found upstream or downstream of the genes and may be located from hundreds to tens of thousands kilobases away, making it extremely challenging for in silico TFBS prediction. Wasserman et al. (12) proposed a comparative genomics technique for discovering mammalian TFBSs and applied the method to a set of carefully annotated human skeletal muscle genes, of which each upstream sequence contains at least one experimentally reported binding site. Wasserman et al. (12) aligned upstream regions of orthologous gene pairs from human and mouse and retained only the parts that share >65% percent identity, reducing the search space to ≈40% of the original. Next, applying the Gibbs sampler to the conserved sequence pairs, they succeeded in identifying three (MYF, MEF2, and SRF) of five motifs believed to be involved in skeletal muscle transcription regulation.
Ab initio CRM predictions. We compared the performance of emcmodule on the same data set, consisting of upstream sequences of 24 orthologous pairs of genes in human and mouse. We initially used the same alignment cutoffs to reduce the search space from ≈5 kb upstream regions to sequences ranging from 235 to 3,272 nucleotides in length. However, we did not use the between-species conservation any further. By using bioprospector, meme, and alignace in turn, we found ≈100 significant motifs, including redundant ones. For bioprospector and meme, the top-scoring 10 motif sets respectively contained 2 and 3 matching the true motifs, whereas alignace found none. The best scoring module configuration from emcmodule contained three of the known five motifs, MYF, MEF2, and SP1 (Table 2) and two uncharacterized motifs with consensus ACACACACAC and GCNARGGAGA. The number of potential TEF sites matching the reported consensus in these sequences appears to be small. Table 3 gives the relative error rates for each of the studied data sets compared for each algorithm used, showing that emcmodule significantly cuts down the percentage of false positives in the output compared with the methods that do not adjust for positional clustering of motifs.
Table 2. Number of experimentally derived sites predicted by each computational method.
| Method | MEF | MYF | SP1 | SRF | Total | SENS | SPEC | MotifSpec | Time |
|---|---|---|---|---|---|---|---|---|---|
| meme | 0 | 1 | 21 | 0 | 161 | 0.14 | 0.14 | 0.20 | 3,927.6 |
| bioprospector | 6 | 1 | 8 | 1 | 155 | 0.10 | 0.10 | 0.36 | 481.0 |
| cismodule | 17 | 0 | 8 | 0 | 257 | 0.16 | 0.10 | 0.40 | 6,450.6 |
| GMS | 6 | 6 | 2 | 1 | 84 | 0.10 | 0.25 | 0.44 | 68,258.75 |
| GMSp* | 14 | 14 | 4 | 6 | 162 | 0.25 | 0.23 | 0.60 | 131,112.9 |
| emcmodule | 12 | 12 | 5 | 7 | 180 | 0.23 | 0.20 | 0.67 | 21,943.0 |
| emcmodule + JASPAR | 17 | 13 | 8 | 10 | 108 | 0.31 | 0.44 | 0.80 | 8,536.2 |
| True | 32 | 50 | 44 | 28 | 154 | — | — | — | — |
Total, the total number of sites predicted; SENS, sensitivity of the method defined as (#predicted true positives)/(#true positives); SPEC, defined as (#predicted true positives)/(#predicted sites). In this example, the number of “true positives” = 154. MotifSpec, motif specificity, defined as the fraction of the predicted motif types that “correspond” to known motif types. The criterion for correspondence is to match at least 80% of the positions in the consensus motif. Time, the CPU time used in seconds on a Xeon 3.06-GHz processor running Redhat Enterprise Linux WS (Release 3). GMS and CM require the total number of motif types to be specified, which was set to be five, the “true” number motif types. Each algorithm was run five times, and the table reports rounded average numbers. GMSp* denotes the output from using a strong informative prior specifying the number of sites per motif and motif abundance per sequence.
Table 3. False negative and false positive rates in comparison with experimentally validated results: proportion of motifs as part of the final selected set (module) for different data sets.
| False negative rates
|
False positive rates
|
|||||||||
|---|---|---|---|---|---|---|---|---|---|---|
| Data set | BP | MEME | CM | GMS | EMCM | BP | MEME | CM | GMS | EMCM |
| B. subtilis | 0 | 0 | 1 | 1 | 0 | 0.81 | 0.9 | — | — | 0.33 |
| Drosophila | 0.4 | 0.2 | 1 | 1 | 0.2 | 0.92 | 0.88 | 1 | — | 0.44 |
| Human/mouse | 0.4 | 0.4 | 0.6 | 0.4† | 0.2 | 0.83 | 0.92 | 0.6 | 0.4 | 0.2 |
For bioprospector (BP) and meme, the first 50 nonredundant motifs found are considered in an attempt to control false negative rates. An overlap with the experimentally verified motif for at least 80% of motif positions is considered a correct prediction. For cismodule (CM) and Gibbs Module Sampler (GMS), the total number of motifs in the module needs to be specified, and this value is given as the true known number of motifs in each case (two, five, and five, respectively for the three data sets). In all cases emcmodule (EMCM) was initiated with a starting set of 50 motifs from five runs of BP, and excluding redundant motifs. The false positive/false negative rates are based on the motifs having the highest posterior probability of being part of a module. We acknowledge that we cannot be sure of the exact false positive rates because there may be unvalidated true binding sites present. —denotes CM and GMS did not turn up motifs corresponding to any of the known ones.
The GMS result for the human data is based on a strong informative prior (details in text).
Using TF databases for CRM predictions. With the vast existing and rapidly expanding literature on experimentally determined TFBSs, it is desirable to incorporate this prior knowledge into our methodology to make more informed predictions. We demonstrate here that emcmodule can make effective use of existing knowledge in predicting novel sites. By using the same human/mouse skeletal muscle regulatory sequence data and a starting collection of PSWMs derived from the eukaryotic TF database JASPAR (http://jaspar.cgb.ki.se), we predict the TFBMs and their sites in this data set.
The initial 111 motif count matrices from JASPAR were filtered according to the following two criteria: (i) length of at least 10 bp (all known muscle TFBMs are 10-12 bp), and (ii) number of experimentally verified sites used to construct the matrix of at least six (for reliability). If the motif was >10 bp, we truncated it to the best conserved part of 10 bp. This process led to a total of 65 PSWMs. To get the initial set of motif sites for emcmodule, we scanned the sequence data set with all of the 65 matrices and retained all sites with a positive posterior log-odds ratio, i.e., with
 |
where the prior odds ratio α is taken as 1 per 1,000 bp. This cutoff criterion is arbitrary. Slightly higher and lower values did not lead to any significant change in the result.
We ran emcmodule under a number of prior specifications and conducted multiple runs with different random starts. Similar results were obtained consistently (documented in Supporting Text). For prior specifications that favored very sparse motif occurrences, a different set was obtained but with very few sites in each category. The sequence logos (30) for the motifs comprising the module and the corresponding site locations are shown in Fig. 5, which is published as supporting information on the PNAS web site. We also obtained the detailed locations of a number of experimentally verified sites (23), which helped us determine a potential number of false negatives (although it is difficult to determine for certain the false positives because the functionality of some sites may have not been discovered).
emcmodule selected four of five expected motifs (MEF2, MYF, SP1, and SRF) to compose the module. The TEF motif, which is present in the initial set from JASPAR, was not chosen for the “best” module configuration. This result is not very surprising, because even on scanning the sequences with the experimentally derived matrix (from JASPAR) at extremely liberal cutoffs, we failed to find more than a couple of sites. The other two motifs that turned up are annotated in JASPAR as AGL-3 and TBP (TATA box). Structurally, the AGL-3-like sites are very close to the SRF and the TBP are very close to MEF2 (reverse complement), so potentially some SRF (or MEF) sites that differ slightly from the respective consensus motifs are being mistaken for AGL-3 (or TBP) (see Supporting Text for details). On comparing with the “real” sites, this hypothesis indeed turns out to be the case.
Overall comparison. Table 2 summarizes the comparison between the predicted sites by using different methods with the “true” sites. The Gibbs module sampler (23) was run with the true motif widths given and by using two prior settings: the default setting and the prior file used in ref. 23, which was specially trained for this data set. The module sampler performed markedly better under the second setting (the row for GMSp* in Table 2), but such a detailed prior knowledge (such as the site abundance for each motif) is usually unavailable. cismodule (27), meme, and bioprospector all were run under their default settings. Table 2 indicates that emcmodule performed well with regard to both sensitivity and specificity besides being time-efficient. We also saw that emcmodule performed more robustly than other methods in the absence of sufficient prior knowledge, which is particularly important when analyzing unfamiliar data.
Fig. 3 and Table 4 show the superimposition of the matches to the experimental sites along with the unmatched predicted sites. A number of sites that have not been experimentally validated are possibly true binding sites because (i) they occur in identical positions in both species and (ii) they are in close proximity to a experimentally validated site. However, further analysis is needed before one can draw a conclusion about the validity of these predicted sites. The sequence logos for the four motifs of interest can be compared with those derived from the experimental sites.
Fig. 3.

emcmodule analysis of the human-mouse muscle-specific genes using motif matrices in JAS-PAR. Sites predicted by emcmodule are superimposed to “real” ones. Red indicates being experimentally validated, and blue indicates not being experimentally validated.
Table 4. emcmodule analysis of the human-mouse muscle-specific genes by using motif matrices in JASPAR.
| TF | Expt. | emcmodule |
|---|---|---|
| MEF2 |

|
|
| MYF | ||
| SP1 | ||
| SRF | ||
| TEF | ||
Logos for both experimentally validated and predicted TFBSs. Expt., experimentally derived sites.
Discussion
We illustrate here both a statistical framework and a computational strategy for discovering enriched and clustered motif patterns in genomic sequences when individual ones are too weak to provide a distinguishable signal. Our algorithm emcmodule attempts to overcome some of the limitations of previous approaches. Unlike the Gibbs module sampler (23), emcmodule does not limit the length of a module a priori and requires no input of the total number of motifs or motif widths. The model selection procedure in emcmodule makes the prediction results more robust to prior specifications. Unlike cismodule (27), emcmodule does not require the total number of motifs to be known and has no restriction on the module sequence length, which is particularly advantageous when dealing with mammalian genomes. emcmodule also can incorporate relative positional preferences of motif sites within a module and has the option of using available information from TFBS databases, which may greatly improve the prediction specificity and sensitivity when such information is from a reliable source.
However, there are still a number of conceptual as well as practical improvements that may make the methodology more powerful in a wide variety of situations. For example, data on locations of known binding sites in Drosophila developmental genes and some other well-studied regulatory modules suggest that the distance between adjacent motif sites in a CRM can be modeled by a truncated geometric distribution of the form (1 - λ)x-1λ. However, the inference is sensitive to the choice of λ, which can be an issue in cases in which we do not have much prior knowledge. In such a case, we recommend one of two options: (i) initiating with a very small λ (e.g., 0.001) and then updating λ iteratively as the algorithm progresses or (ii) integrating out λ from the model likelihood. Option (ii) appeared more robust in applications with longer sequence lengths (e.g., the skeletal muscle data). Other possible options that we considered were (iii) taking a mixture of geometric distributions with different λ or (iv) taking a mixture of a geometric and uniform distribution. Neither option (iii) nor (iv) resulted in better performances for the examples but might be useful in other applications. With more empirical information, this aspect of the module model can be improved further. We also studied how the rate of convergence of emcmodule was affected by the population size used in the EMC algorithm. Our results (data not shown) indicate that the gain is not significant after a point, say, 20.
In the examples, the starting set of motifs were obtained from existing motif-finding algorithms and, in some cases, databases of experimentally determined binding sites. The general rationale here is to use as many and as diverse sources of information as possible to get a good motif set starting from which emcmodule can infer the CRM. However, having too large a starting set (say, >100 motifs) has a detrimental effect on both the convergence and the specificity of the algorithm. Therefore, there is a need to be reasonably cautious when choosing candidate motifs. A general guideline is to have an ab initio set of 20-50 motifs resulting from motif-finding algorithms such as bioprospector or meme supplemented, if available, by a set of experimentally derived PSWMs from reliable biological sources (such as JASPAR). Some prescreening strategies might be used when considering motifs from a TFBS database. Because of the stochastic nature of many de novo motif prediction algorithms, it is advisable to use multiple runs (say, 5-10) of each, taking the top 10 candidates from each run and removing redundant ones.
For multiple runs of emcmodule with different starting seeds, there was no noticeable difference in the results over a wide range of prior settings (see Table 5, which is published as supporting information on the PNAS web site). We also did not observe any noticeable influence on the final CRM prediction by emcmodule when using starting motif sets of different sizes ranging from 25 to 65 (see Table 6, which is published as supporting information on the PNAS web site), indicating that the algorithm is quite robust to prior specifications. We also noticed that the maximal score (posterior marginal likelihood) obtained was exactly the same (and corresponded to the same selection of sites) in almost 75% of the runs with different random seeds for each data set. This result suggests that if emcmodule is run for a few times with random seeds and the maximal score noted in each case, getting the same (or similar) maximal score more than once is a good indicator that the algorithm has found the optimal solution. A similar stopping criterion was used in ref. 4 in which the Gibbs sampler was first introduced for motif discovery.
In the examples where the true answers are known, it is often seen that for many experimentally derived PSWMs the information content is very low in most positions; however, when the computational method finds the true motif, the information content for the motif is much higher. This occurrence may be caused by some artifacts during the experimental discovery of the TFBSs (e.g., maybe a mixture of two types of sites corresponding to different environmental cues). It also may be that the information content measure (or a similar statistically based score) is not necessarily the best surrogate for the binding affinity, and the multinomial model, which favors strongly conserved motifs with respect to information content, may not be the ideal model to use. Alternative modeling techniques may need to be explored.
Supplementary Material
Acknowledgments
We thank Bill Thompson for providing the upstream sequences of the human skeletal muscle genes together with their mouse alignments and Charles Lawrence, Jason Lieb, Richard Losick, and Xiaole Liu for helpful comments and discussions. J.S.L. was supported in part by National Science Foundation Grants DMS-0204674 and DMS-0244638.
Author contributions: M.G. and J.S.L. designed research; M.G. and J.S.L. performed research; M.G. contributed new reagents/analytic tools; M.G. analyzed data; and M.G. and J.S.L. wrote the paper.
This paper was submitted directly (Track II) to the PNAS office.
Abbreviations: CRM, cis-regulatory module; EMC, evolutionary Monte Carlo; PSWM, position-specific weight matrix; TF, transcription factor; TFBM, TF binding motif; TFBS, TF binding site; TSS, transcription start site.
References
- 1.Hertz, G. Z., Hartzell, G. W., III, & Stormo, G. D. (1990) Comput. Appl. Biosci. 6, 81-92. [DOI] [PubMed] [Google Scholar]
- 2.Bailey, T. & Elkan, C. (1994) in Proceedings of the Second International Conference on Intelligent Systems for Molecular Biology, eds. Altman, R., Brutlag, D., Karp, P., Lathrop, R. & Searls, D. (Am. Assoc. Artificial Intelligence Press, Menlo Park, CA), pp. 28-36.
- 3.Lawrence, C. E. & Reilly, A. A. (1990) Proteins 7, 41-51. [DOI] [PubMed] [Google Scholar]
- 4.Lawrence, C. E., Altschul, S. F., Boguski, M. S., Liu, J. S., Neuwald, A. F. & Wootton, J. C. (1993) Science 262, 208-214. [DOI] [PubMed] [Google Scholar]
- 5.Liu, J. S., Neuwald, A. F. & Lawrence, C. E. (1995) J. Am. Stat. Assoc. 90, 1156-1170. [Google Scholar]
- 6.Roth, F. R., Hughes, J., Estep, P. & Church, G. M. (1998) Nat. Biotechnol. 10, 939-945. [DOI] [PubMed] [Google Scholar]
- 7.Liu, X., Brutlag, D. L. & Liu, J. S. (2001) Pacific Symp. Biocomput. 6, 127-138. [PubMed] [Google Scholar]
- 8.Bussemaker, H. J., Li, H. & Siggia, E. D. (2000) Proc. Natl. Acad. Sci. USA 97, 10096-10100. [DOI] [PMC free article] [PubMed] [Google Scholar]
- 9.Gupta, M. & Liu, J. S. (2003) J. Am. Stat. Assoc. 98, 55-66. [Google Scholar]
- 10.Bussemaker, H. J., Li, H. & Siggia, E. D. (2001) Nat. Genet. 27, 167-174. [DOI] [PubMed] [Google Scholar]
- 11.Conlon, E. M., Liu, X. S., Lieb, J. D. & Liu, J. S. (2003) Proc. Natl. Acad. Sci. USA 100, 3339-3344. [DOI] [PMC free article] [PubMed] [Google Scholar]
- 12.Wasserman, W. W., Palumbo, M., Thompson, W., Fickett, J. W. & Lawrence, C. E. (2000) Nat. Genet. 26, 225-228. [DOI] [PubMed] [Google Scholar]
- 13.McCue, L. A., Thompson, W., Carmack, C. S., Ryan, M. P., Liu, J. S., Derbyshire, V. & Lawrence, C. E. (2001) Nucleic Acids Res. 29, 774-782. [DOI] [PMC free article] [PubMed] [Google Scholar]
- 14.Kellis, M., Patterson, N., Endrizzi, M., Birren, B. & Lander, E. (2003) Nature 423, 241-254. [DOI] [PubMed] [Google Scholar]
- 15.Kel-Margoulis, O., Romaschenko, A., Kolchanov, N., Wingender, E. & Kel, A. (2000) Nucleic Acids Res. 28, 311-315. [DOI] [PMC free article] [PubMed] [Google Scholar]
- 16.Davidson, E. H. (2001) Genomic Regulatory Systems: Development and Evolution (Academic, San Diego).
- 17.Sinha, S. & Tompa, M. (2002) Nucleic Acids Res. 30, 5549-5560. [DOI] [PMC free article] [PubMed] [Google Scholar]
- 18.Frith, M. C., Spouge, J. L., Hansen, U. & Weng, Z. (2002) Nucleic Acids Res. 30, 3214-3224. [DOI] [PMC free article] [PubMed] [Google Scholar]
- 19.Berman, B., Nibu, Y., Pfeiffer, B., Tomancak, P., Celniker, S., Levine, M., Rubin, G. & Eisen, M. (2002) Proc. Natl. Acad. Sci. USA 99, 757-762. [DOI] [PMC free article] [PubMed] [Google Scholar]
- 20.Segal, E. & Sharan, R. (2004) in RECOMB 2004: Proceedings of the Eighth Annual International Conference on Research in Computational Biology, eds. Gusfield, D., Bourne, P., Istrail, S., Pevzner, P. A. & Waterman, M. (Assoc. Comput. Machinery Press, New York), pp. 141-149.
- 21.Marsan, L. & Sagot, M. (2000) in RECOMB 2000: Proceedings of the Fourth Annual International Conference on Computational Molecular Biology, eds. Shamir, R., Miyano, S., Istrail, S., Pevzner, P. & Waterman, M. (Assoc. Comput. Machinery Press, New York), pp. 210-219.
- 22.Kreiman, G. (2004) Nucleic Acids Res. 32, 2889-2900. [DOI] [PMC free article] [PubMed] [Google Scholar]
- 23.Thompson, W, Palumbo, M. J., Wasserman, W. W., Liu, J. S. & Lawrence, C. E. (2004) Genome Res. 10, 1967-1974. [DOI] [PMC free article] [PubMed] [Google Scholar]
- 24.Heinemeyer, T., Wingender, E., Reuter, I., Hermjakob, H., Kel, A. E., Kel, O. V., Ignatieva, E. V., Ananko, E. A., Podkolodnaya, O. A., Kolpakov, F. A., et al. (1998) Nucleic Acids Res. 26, 362-370. [DOI] [PMC free article] [PubMed] [Google Scholar]
- 25.Sandelin, A., Alkema, W., Engström, P., Wasserman, W. & Lenhard, B. (2004) Nucleic Acids Res. 32, 91-94. [DOI] [PMC free article] [PubMed] [Google Scholar]
- 26.Liang, F. & Wong, W. H. (2000) Statistica Sinica 10, 317-342. [Google Scholar]
- 27.Zhou, Q. & Wong, W. H. (2004) Proc. Natl. Acad. Sci. USA 101, 12114-12119. [DOI] [PMC free article] [PubMed] [Google Scholar]
- 28.Liu, J. S. (2001) Monte Carlo Strategies in Scientific Computing (Springer, New York).
- 29.Helmann, J. (1995) Nucleic Acids Res. 23, 2351-2360. [DOI] [PMC free article] [PubMed] [Google Scholar]
- 30.Schneider, T. D. & Stephens, R. M. (1990) Nucleic Acids Res. 18, 6097-6100. [DOI] [PMC free article] [PubMed] [Google Scholar]
Associated Data
This section collects any data citations, data availability statements, or supplementary materials included in this article.