Abstract
Epigenetic dysregulation is a prominent feature in cancer as exemplified by frequent mutations in chromatin regulators, including the MLL/KMT2 family of histone methyltransferases. While MLL/KMT2A activity on H3K4 methylation is well documented, their non-canonical activities remain mostly unexplored. Here, we show that MLL1/KMT2A methylates Borealin K143 in the intrinsically disordered region essential for liquid-liquid phase separation (LLPS) of chromosome passenger complex (CPC). Co-crystal structure highlights the distinct binding mode of the MLL1 SET domain with Borealin K143. Inhibiting MLL1 activity or mutating Borealin K143 to arginine perturbs CPC phase separation, reduces Aurora kinase B activity, and impairs resolution of erroneous kinetochore-microtubule attachments and sister chromatid cohesion. They significantly increase chromosome instability and aneuploidy in a subset of hepatocellular carcinoma (HCC), resulting in growth inhibition. These results demonstrate a non-redundant function of MLL1 in regulating inner centromere liquid condensates and genome stability via a non-canonical enzymatic activity.
Introduction
The MLL/KMT2 family histone methyltransferases are among the most frequently mutated genes in hematopoietic malignancies and solid tumors1. The KMT2 family proteins, namely KMT2A-D and KMT2F/G, are evolutionarily conserved. They catalyze majority of mono-, di-, and tri-methylation H3K4 (H3K4me) at actively transcribed gene promoters and enhancers1. H3K4me plays a crucial role in recruiting the basic transcription machinery and chromatin remodeling complexes for transcription activation2,3. It also coordinates co-transcriptional processes4–6 and facilitates long-range chromatin interactions7. Rearrangement of the H3K4me1-decorated enhancer landscape is one of the early events in malignant transformation8. However, paradoxical evidence emerge recently questioning whether H3K4 methylation is uncoupled from gene activation and whether enzymatic activity is relevant for MLL/KMT2 function in cancers9–12. Furthermore, the KMT2 enzymes exhibit non-overlapping functions despite sharing the same histone substrate13–16. These observations led us to postulate whether the KMT2 enzymes possess divergent non-canonical activities that contribute to their distinct physiological and pathological functions.
Faithful cell division is crucial for genome stability. The chromosome passenger complex (CPC) plays a vital role in ensuring error-free cell division and preserving genome integrity17. Comprising four highly conserved proteins (INCENP, Borealin, Survivin, and Aurora kinase B (AurkB)), the CPC coordinates kinetochore assembly and sister chromatid cohesion at the centromere in prometaphase and metaphase18,19. Elevated expression of the CPC is often found in cancer and associated with poor prognosis18,20. Recent studies demonstrated that the CPC undergoes liquid-liquid phase separation (LLPS), forming a gel-like phase-separated state in vitro and in cells21. LLPS of CPC requires amino acids 130-159 in the intrinsically disordered region (IDR) of Borealin21. Disrupting the LLPS of the CPC impairs error correction of aberrant kinetochore-microtubule attachments during mitosis21. However, it is still unclear whether the LLPS of the CPC is regulated in cells and how it may impact mitotic fidelity and genome stability.
Significant advancements in cancer proteogenomics have revealed frequent dysregulation of MLL1/KMT2A in a broad range of cancers22–24. However, how MLL1 contributes to cancer development and the involvement of its methyltransferase activity in the H3K4me-dependent or independent manner remain unclear. Here we performed an unbiased proteomics analysis to identify potential non-canonical substratates for MLL1. We identified Borealin K143 in the CPC as a bona fide substrate for MLL1, but not other KMT2 enzymes during mitosis. We further show that Borealin K143 methylation by MLL1 regulates LLPS of the inner centromeric CPC and disruption of this activity results in erroneous mitosis and genome instability. Our results revealed a potential therapeutic strategy of targeting MLL1 in a subset of HCC that exhibits high level of chromosomal instability.
Results
MLL1/KMT2A has non-canonical activity for Borealin K143
We performed two orthogonal quantitative proteomics experiments to identify potential non-canonical substrates for MLL1 (Extended Data Fig. 1a). We first conducted stable isotope labeling by amino acids in cell culture (SILAC) for the wildtype mouse embryonic fibroblasts (MEFs) (Mll1+/+). Light isotope labeled cell lysates were subject to immunoprecipitation (IP) using FLAG-tagged 3xMBTWT that specifically binds to methyl-lysine independent of sequence context25, while heavy isotope labeled cell lysates were subjected to IP using FLAG-3xMBTD355N mutant (Extended Data Fig. 1b, left panel). Quantitative mass spectrometry identified 204 proteins with at least two-fold enrichment in 3XMBTWT IP (Supplementary Table 1–2), representing the lysine methylome of Mll1+/+ MEFs. We next performed FLAG-3xMBTWT IP using light and heavy isotope labeled lysates from Mll1+/+ and Mll1−/− MEFs, respectively (Extended Data Fig. 1a and 1b, right panel). It led to identification of 444 proteins that are preferably methylated in Mll1+/+ cells (Supplementary Table 3–4). A total of 33 proteins were identified in both experiments (Fig. 1a and Supplementary Table 5). They were potential MLL1 substrates in MEFs. Borealin showed 16-fold enrichment in Mll1+/+ versus Mll1−/− MEFs and ~3-fold enrichment in 3XMBTWT over 3xMBTD355N IP (Fig. 1a, red dot). In contrast, histone H3 showed only modest enrichment in Mll1+/+ MEFs (Fig. 1a, green dot), consistent with presence of redundant H3K4me activities in MEFs. We also confirmed that MLL1 deletion did not affect Borealin expression in MEFs (Extended Data Fig. 1c)
Fig. 1 |. MLL1 methylates Borealin at K143.
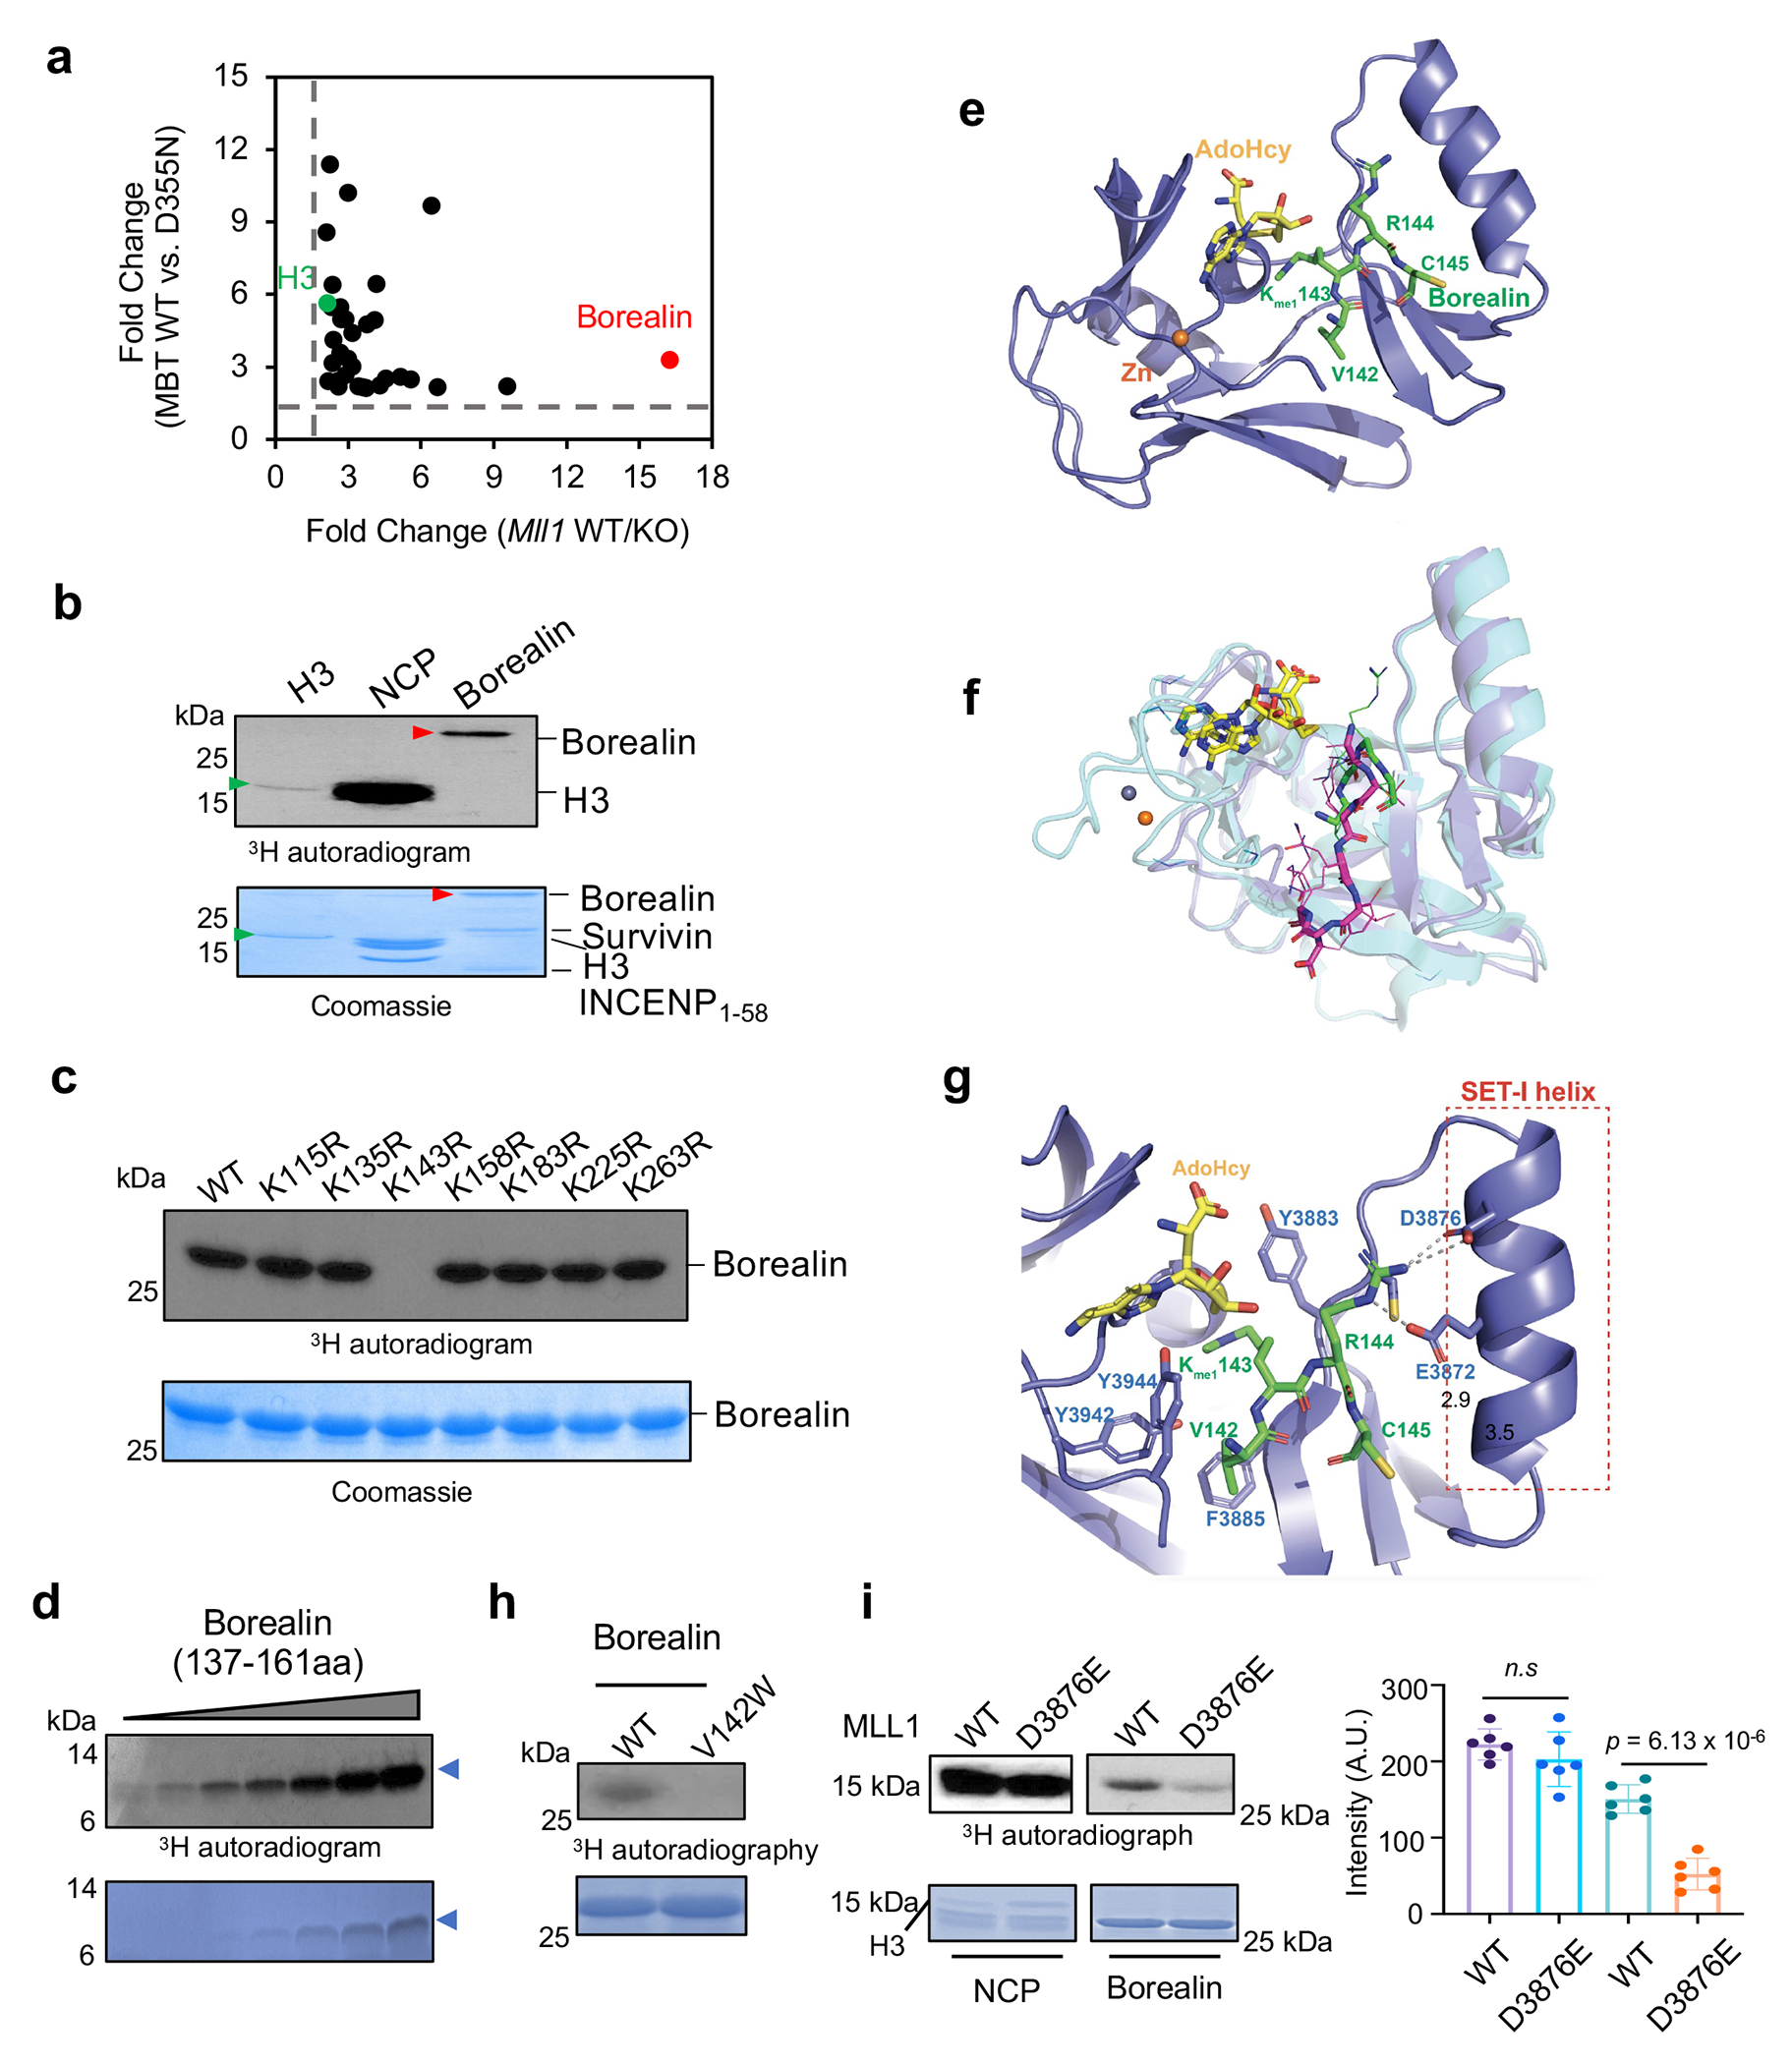
(a) Scatter plot for 33 proteins with more than 2-fold enrichment in two parallel SILAC experiments. H3 and Borealin were highlighted in green and red, respectively. The dashed lines represent 2-fold cutoff.
(b) In vitro methylation assay for the MLL1 core complex on various substrates as indicated on top. Top, autoradiogram; Bottom, Coomassie stain of duplicate reactions. Borealin and free histone H3 bands were indicated by red and green arrowheads, respectively. This experiment is independently repeated three times with similar results.
(c) In vitro methylation assay for the MLL1 core complex on wild type and mutant Borealin as indicated on top. Coomassie stain of Borealin substrates was shown on bottom. This experiment is independently repeated four times with similar results.
(d) In vitro methylation assay using the MLL1 core complex. The Borealin 137-161aa peptide (blue arrowhead) of varying concentration was used as the substrate. Top, 3H autoradiogram; Bottom, Coomassie stain of the Borealin peptide. This experiment is independently repeated two times with similar results.
(e) Co-crystal structure of MLL1SET (blue) in complex with Borealin peptide (green). S-Adenosyl-L-homocysteine (SAH) is shown in yellow. The zinc ion is shown in orange.
(f) Overlay of the MLL1SET-histone H3 (magenta) and MLL1SET-Borealin (green) structures.
(g) The MLL1-SET-I helix (colored in blue) makes direct contacts with Borealin peptide (colored in green). The SAH is shown in yellow. The putative hydrogen bonds are shown as dashed lines.
(h) in vitro methylation assay for the MLL1 core complex on wild type or V142W Borealin. Top, 3H autoradiogram; Bottom, Coomassie stain of Borealin. This experiment is independently repeated two times with similar results.
(i) in vitro methylation assay for the wild type or SETD3876E MLL1 core complex on either NCP (H3) or Borealin. Top, 3H autoradiogram; Bottom, Coomassie stain of NCP or Borealin; Quantification of the 3H autoradiogram is shown on the right. Data are presented as mean values +/− SEM. The p-value was calculated for n = 5 independent experiments using two-tailed unpaired Student’s t-test. n.s., p > 0.05
To confirm Borealin is a bona fide substrate for MLL1, we expressed the ISB complex containing INCENP (1-58aa), Survivin and Borealin (Extended Data Fig. 1d), which is capable of centromere localization26. The MLL1 complex robustly methylated Borealin in the ISB complex in vitro (Fig 1b). This activity was higher than K4 methylation on free histone H3, albeit lower than that within the nucleosome core particles (NCP) (Fig. 1b). Systematic mutagenesis replacing each lysine in Borealin with arginine (R) identified K143 as the substrate lysine for MLL1 (Fig. 1c). Consistently, MLL1 methylated the Borealin peptide (137-161aa) containing K143 (Fig. 1d). To the best of our knowledge, the non-histone substrate of MLL1 has not been reported previously.
Co-crystal structure of the MLL1 SET domain and Borealin
Borealin K143 is highly conserved and shares partial sequence similarity to H3 (Extended Data Fig. 1e). To determine the MLL1-Borealin interaction at atomic resolution, we solved the co-crystal structure of MLL1 SET3785-3969 in complex with the Borealin peptide containing K143me1 (137−LQTARVKme1RC−145) (Fig. 1e–g, and Supplementary Table 6). MLL1SET adopts an open conformation when interacting with Borealin, similar to its interaction with H3K427. Specifically, V142 of Borealin makes extensive hydrophobic interactions with F3885, Y3942, and Y3944 in MLL1SET. Mutating V142 to tryptophan (W) abolished Borealin methylation by MLL1 in vitro (Fig. 1h). Although overall configuration of the MLL1SET-Borealin and MLL1SET-H3 structures overlays well with each other, orientation of the H3 and Borealin peptides in the substrate channel are slightly different (Fig. 1f). Borealin R144 makes extensive electrostatic interactions with E3872 and D3876 in the SET-I of MLL1SET (Fig. 1g), which are not involved in H3 interaction27. Mutation of D3876 to glutamic acid (E) in MLL1SET reduced Borealin methylation without affecting H3K4 methylation on the NCP (Fig. 1i).
KMT2 family enzymes have disparate activities for Borealin
We next performed in vitro methylation assays for KMT2B, KMT2C/D and KMT2F/G on Borealin. Interestingly, they had divergent activities for Borealin (Fig. 2a and 2b). KMT2B, the closest paralog of KMT2A, was able to methylate Borealin at K143 in vitro and this activity was abolished by K143R mutation (Fig. 2a). In contrast, KMT2C and SET1A could not methylate Borealin while KMT2D and SET1B had robust activity on K143R mutant, suggesting different substrate specificity. Borealin was also methylated by G9a and EZH2 at sites other than K143 in vitro (Fig. 2b).
Fig. 2 |. MLL family HMTs have divergent activities on Borealin.
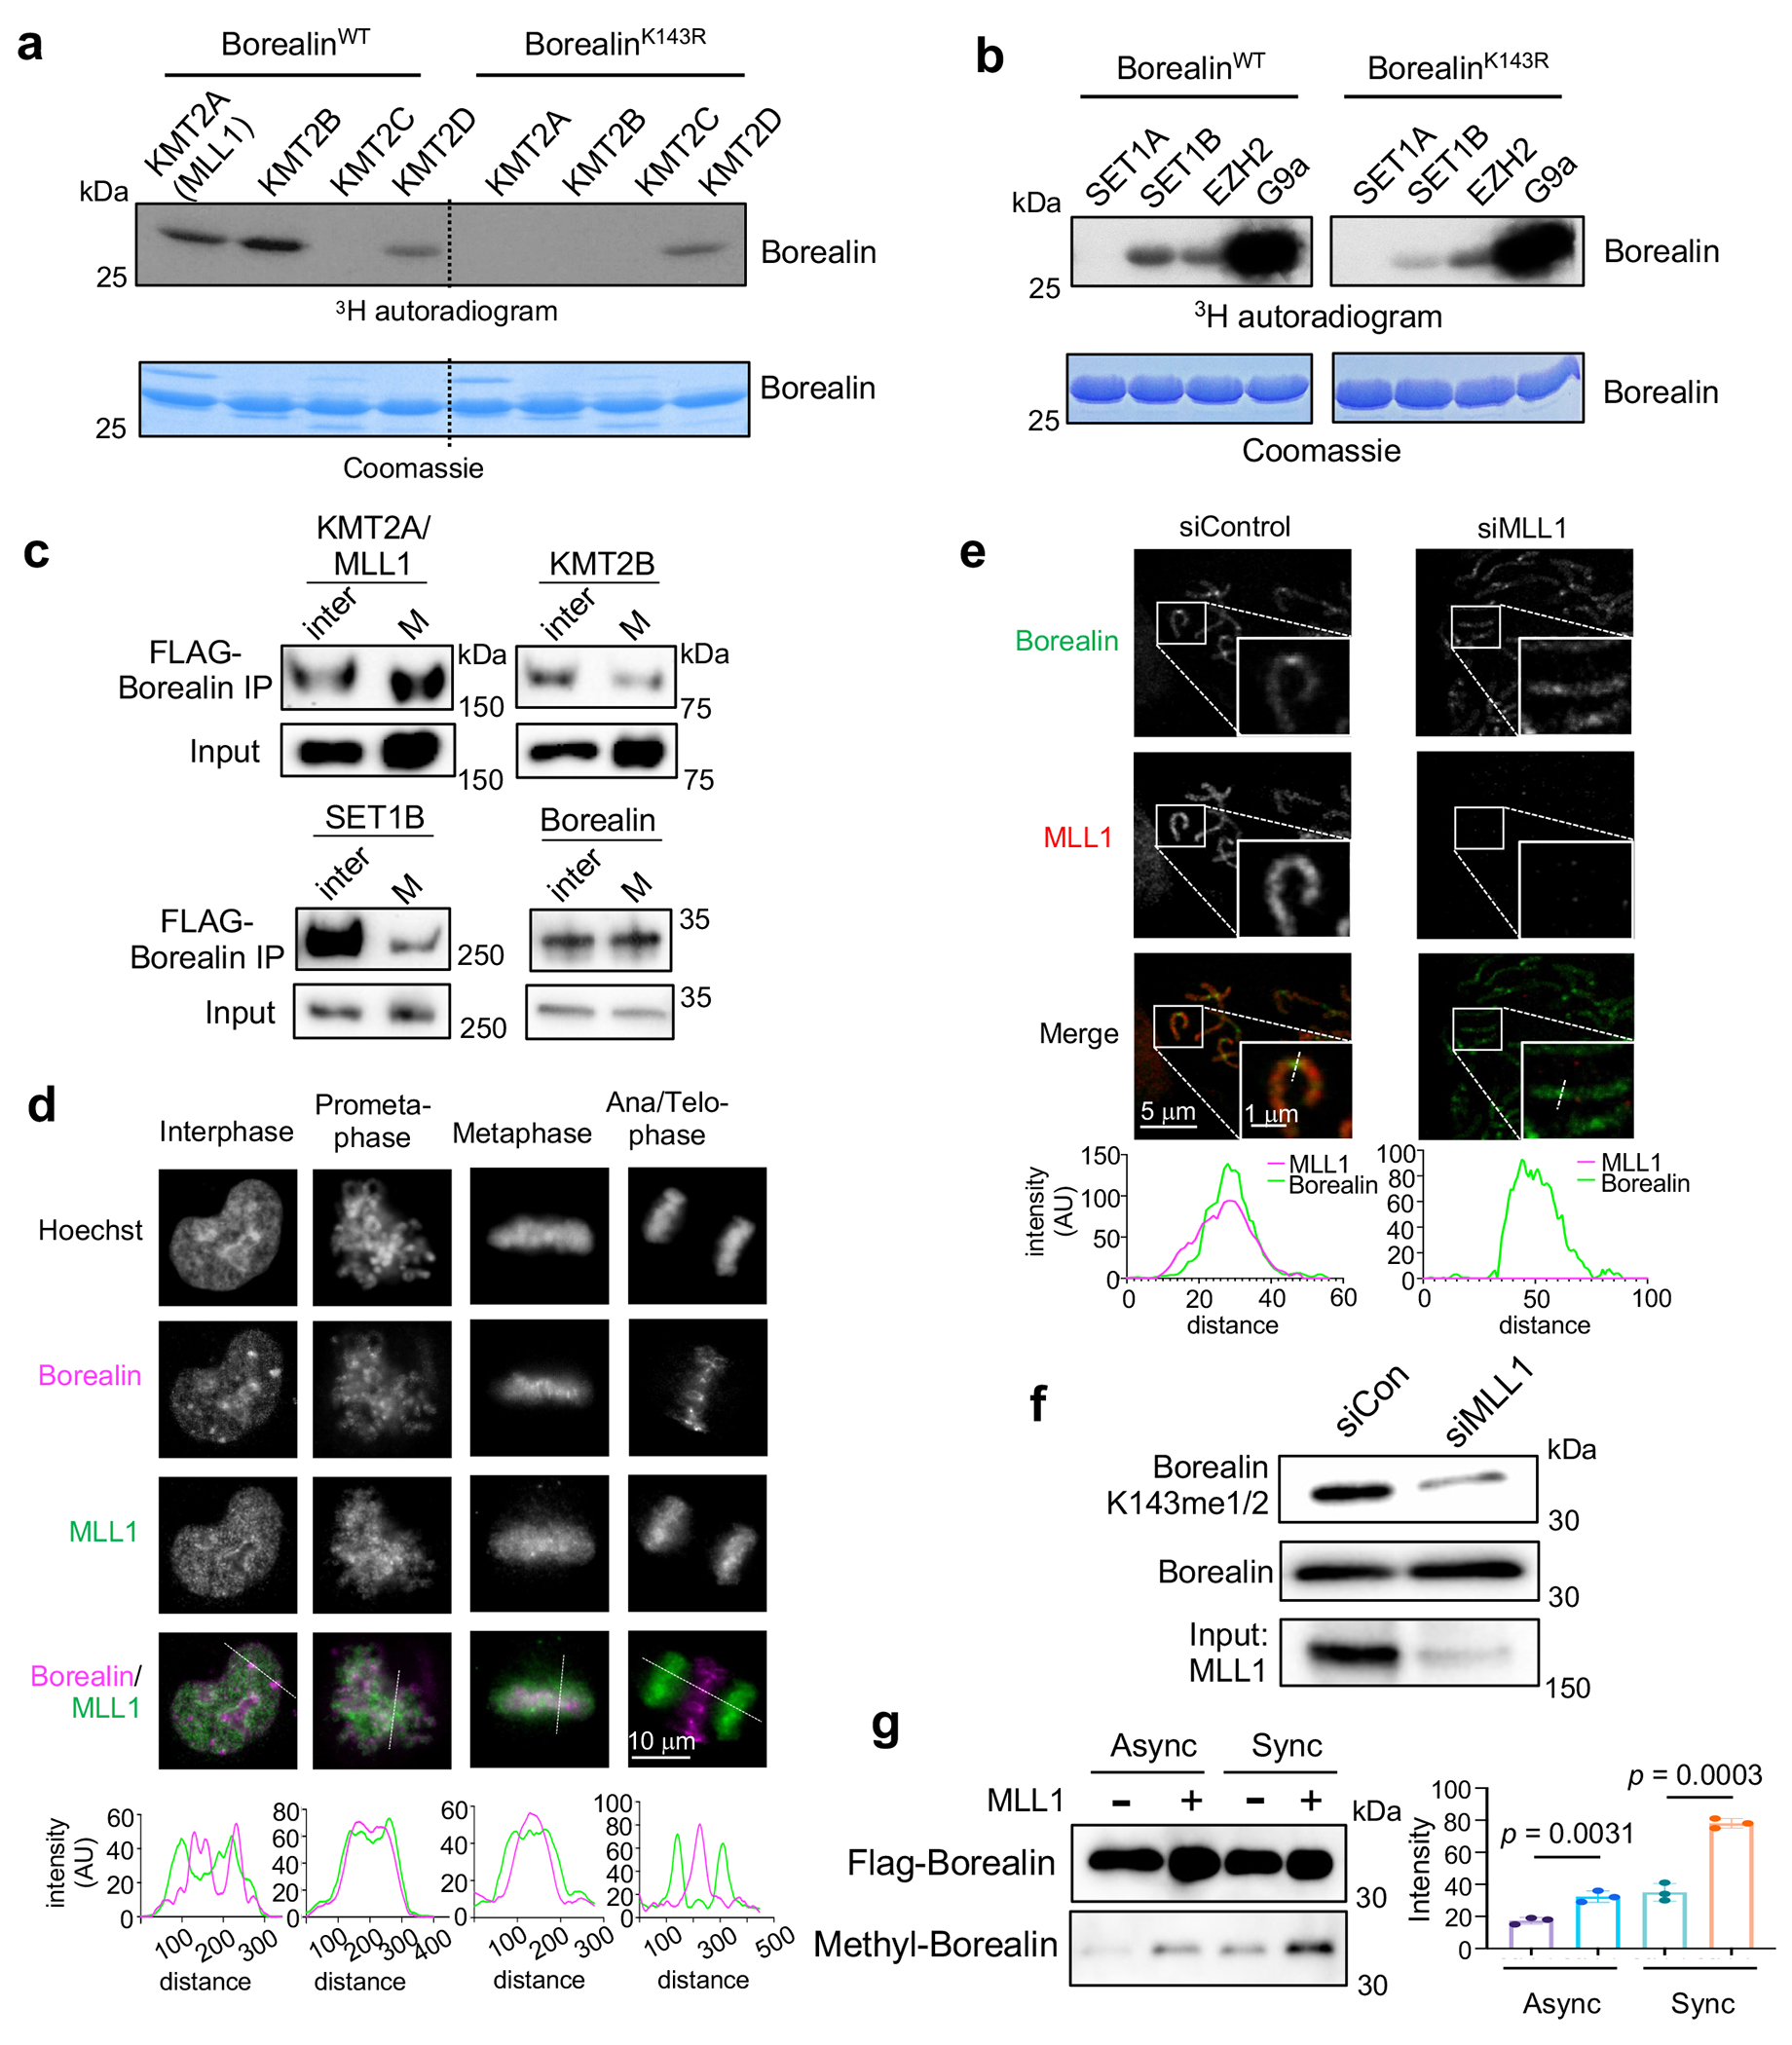
(a) and (b) In vitro methylation assay using indicated KMT enzymes on top. Either WT or K143R mutant Borealin were used as the substrate. Coomassie stain of Borealin proteins was shown in lower panels. This experiment is independently repeated three times with similar results.
(c) Immunoblots for FLAG-Borealin immunoprecipitated from asynchronized or mitotically synchronized HeLa cells. Antibodies were indicated on top. Inter, interphase, M, mitosis. Representative results from two independent experiments were presented.
(d) Immunofluorescence for Borealin and MLL1 in HeLa cells at interphase or different mitotic stages as indicated on top. DNA was stained by Hoechst. The one-dimension (1D) line graphs of MLL1 (green) and Borealin (magenta) signals were shown at bottom. The viewpoint was indicated by dash line. Scale bar, 10 μm. This experiment is independently repeated three times with similar results.
(e) Immunofluorescence for Borealin and MLL1 on mitotic chromosomes of synchronized HeLa cells treated with control or MLL1 siRNA. The 1D line graphs of MLL1 (magenta) and Borealin (green) signals were shown on right. The viewpoint was indicated by dash line in the inset. Scale bar, 5 μm (whole images) and 1 μm (insets). This experiment is independently repeated two times with similar results.
(f) Immunoblot for antibodies indicated on left for mitotically synchronized HeLa cells treated with control or MLL1 siRNA. This experiment is independently repeated two times with similar results.
(g) Immunoblot for Borealin or methylated Borealin in asynchronized or mitotically synchronized 293T cells with or without transient overexpression of MLL1 as indicated on top. Quantification of methyl-Borealin after normalization against input was shown on the right. Data are presented as mean values +/− SEM. The p-value for n = 3 independent experiments was calculated using two-tailed unpaired Student’s t-test.
To examine whether MLL1 and KMT2B were able to methylate Borealin K143 in cells, we expressed FLAG-Borealin in HeLa cells and performed IP experiment in either asynchronized or nocodazole-arrested mitotic cells. MLL1/KMT2A was significantly enriched in FLAG IP in cells synchronized at M phase (Fig. 2c), consistent with their colocalization on the pro-metaphase and metaphase chromosomes (Fig. 2d and 2e). In contrast, KMT2B or SET1B mostly interacted with Borealin in asynchronized interphase cells (Fig. 2c). Next, we generated a highly specific polyclonal antibody for Borealin K143me1/2 (Extended Data Fig. 1f). Immunoblot using this antibody showed that Borealin K143me HeLa cells dependent on MLL1 (Fig. 2f). Knocking down KMT2D, EZH2, or G9a did not affect cellular Borealin K143me (Extended Data Fig. 1g–h). Transient overexpression of MLL1 in 293T cells led to an increase of Borealin methylation in asynchronized cells, which was further elevated in nocodazole synchronized metaphase cells (Fig. 2g). As expected, increase of MLL1-mediated methylation was not observed for Borealin K143R mutant (Extended Data Fig. 2a). These results suggest that Borealin K143 is specifically methylated by MLL1 in cells.
Borealin K143me by MLL1 regulates ISB condensate in vitro
Inner centromeric CPC exists in a gel-like phase-separated state, crucial for CPC hydrodynamics and correction of aberrant kinetochore-microtubule attachment21. As previously reported by Trivedi et al., phase separation of the ISB complex requires the intrinsically disordered region (IDR) (139-160aa) in Borealin21. To test whether Borealin K143me by MLL1 affects ISB condensates in vitro, we examined whether MLL1 partitions into the ISB coacervates. To this end, we mixed the CF555-labelled MLL1 complex (containing MLL1SET, WDR5, ASH2L, RbBP5 and DPY30) with phase-separated ISB. Although the MLL1 complex did not undergo phase separation by itself under this condition, it was readily enriched in the ISB droplets (Fig. 3a). Next, we examined whether Borealin methylation by MLL1 affected the ISB phase diagram, which depends on salt and ISB concentration21. The in vitro methylation assays were carried out under conditions that did not induce ISB phase separation. The reaction mixes were subject to 1:2, 1:5 or 1:10 serial dilution to induce phase separation. The phase separated droplets were observed for 4μM methylated ISB in 60mM salt (KCl) solution whereas unmethylated ISB (MLL alone, no SAM) was still in a homogeneous state (Fig. 3b). Borealin methylation by MLL1 significantly reduced saturation concentration of ISB (Fig. 3c). The coacervates formed by methylated ISB were slightly larger in size as compared to unmodified Borealin (Fig. 3d). As controls, MLL1 methylation did not affect LLPS of the ISB complex containing Borealin K143R mutant (Fig. 3b–d). These results suggest that Borealin K143me by MLL1 modulates ISB condensates in vitro.
Fig. 3 |. Borealin K143 methylation by MLL1 regulates CPC phase separation in vitro.
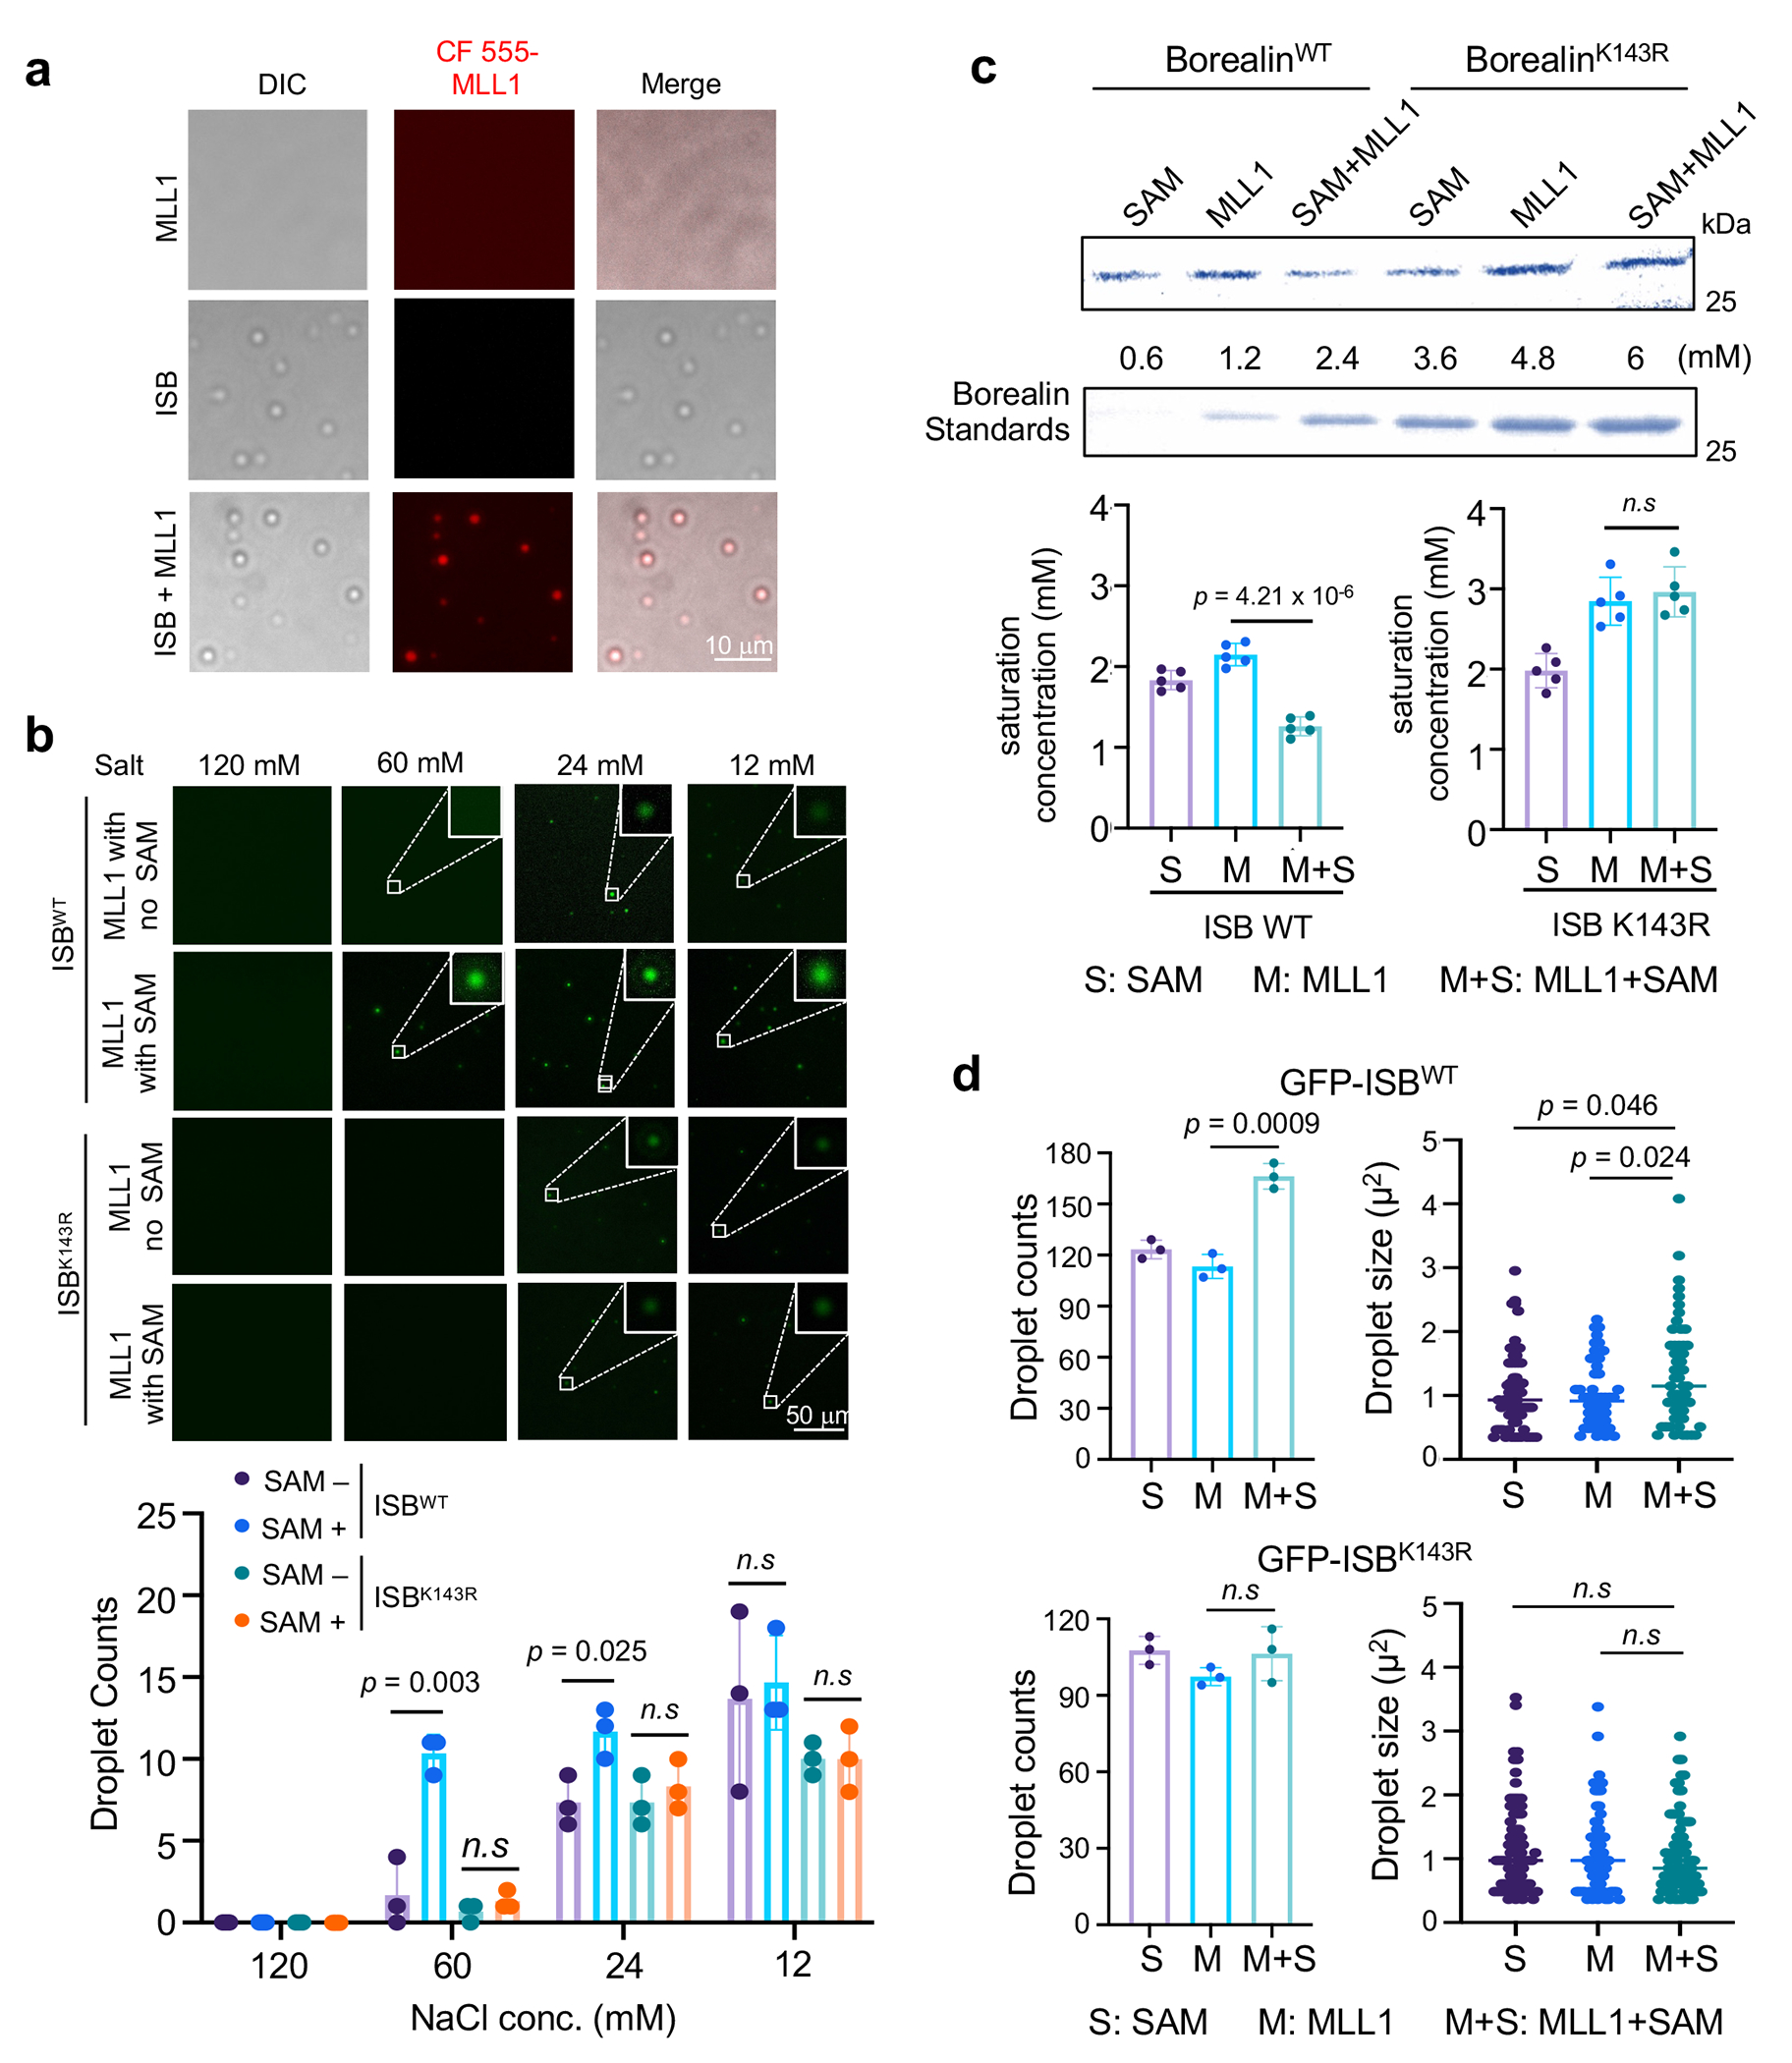
(a) Representative micrographs from three independent experiments showing enrichment of the CF-555 labeled MLL1 core complex (CF555-MLL1) in the ISB coacervates. MLL1 (0.5 μM), ISB (10 μM), or both were incubated in the partitioning buffer containing 50 mM Tris-HCl pH7.5, 150 mM NaCl, 1 mM DTT and 5% PGE-3350. Scale bar, 10 μm. This experiment is independently repeated three times with similar results.
(b) Immunofluorescence for droplet formation of the GFP-ISBWT or GFP-ISBK143R complex under indicated salt concentrations. Scale bar, 50 μm. Quantification of GFP-ISB droplets is shown on bottom. Average results from three independent experiments were presented with +/− SEM. The p-values were calculated using two-tailed unpaired Student’s t-test. n.s, p > 0.05.
(c) Coomassie stain of Borealin protein of ISB complex in the soluble phase after sedimentation of ISB droplets. A gradient of Borealin in high salt buffer is shown as a reference of protein concentration. About 6 μM ISB complex was incubated with SAM alone (S), MLL1 core complex alone (M) or both (M+S) in the HMT buffer for overnight to allow Borealin methylation. Phase separation of ISB was induced by lowering salt concentration and the liquid droplets were separated from the soluble fraction by sedimentation. The saturation concentration of ISB was quantified for ISBWT or ISBK143R on bottom. Data are presented as mean values +/− SEM. The p-value for n = 5 independent experiments was calculated using two-tailed unpaired Student’s t-test. n.s, p > 0.05.
(d) Quantification of GFP-ISBWT or GFP-ISBK143R droplet size after HMT assay and induction of phase separation as described in (c). Average values of droplet count from n = 3 independent expeiments with +/− SEM were shown on the left. Droplet size was measured for at least 96 droplets per condition and shown on the right. The p-value was calculated using two-tailed unpaired Student’s t-test. n.s, p > 0.05. The lines represent mean value.
Borealin K143me by MLL1 regulates LLPS of CPC in cells
To investigate the function of Borealin K143me in cells, we established the GFP/HA-tagged wildtype (WT) and K143R Borealin HeLa cell lines (Extended Data Fig. 2b). Tagged-Borealin proteins were expressed at the level of endogenous Borealin, which was simultaneously removed by siRNAs targeting 3’UTR of the transcript (Extended Data Fig. 2c). The K143R Borealin was assembled into CPC and localized on the mitotic chromosomes, similar to WT Borealin (Extended Data Fig. 2d and 2e). These two cell lines, referred to as WT and K143R cells, were used in experiments described henceforth. To examine whether Borealin methylation regulates CPC phase separation in cells, we treated WT or K143R cells with 3% 1,6-Hexanediol, an aliphatic alcohol that efficiently disrupts phase separated condensate in cells28. Compared to WT cells, K143R cells showed increased sensitivity to 1,6-Hexanediol treatment, resulting in more reduction of AurkB foci (Fig. 4a and 4b). We next examined whether Borealin methylation affects recovery of CPC condensate after ammonium acetate (AA) washout29, 21, a cell-permeable salt disrupting cellular condensates. AA treatment led to disappearance of AurkB foci (Fig. 4c, 0s), which mostly recovered within 2 minutes WT cells. Significant delay in recovery of AurkB foci after AA washout was observed for Borealin K143R or V142W cells as well as cells with MLL1 depletion (Fig. 4c, 4d and Extended Data Fig. 3a–c). Mll1Set Δ/Δ MEFs also showed defects in recovery of AurkB foci after AA washout (Extended Data Fig. 3d–f). To examine the internal hydrodynamics of the CPC condensates at inner centromeres, we performed Fluorescence Recovery After Photobleaching (FRAP) for prometaphase centromeres in WT and K143R cells. CPC condensates in K143R cells had faster recovery rate than WT cells (Fig. 4e). Faster recovery was also observed for WT cells treated with the MLL1 inhibitor MM-589 but not with the inactive enantiomer MM-599 (Fig. 4f). No additive effects were observed for MM-589 treatment in K143R cells (Fig. 4g).
Fig. 4 |. Borealin K143 methylation by MLL1 regulates centromeric CPC phase separation.
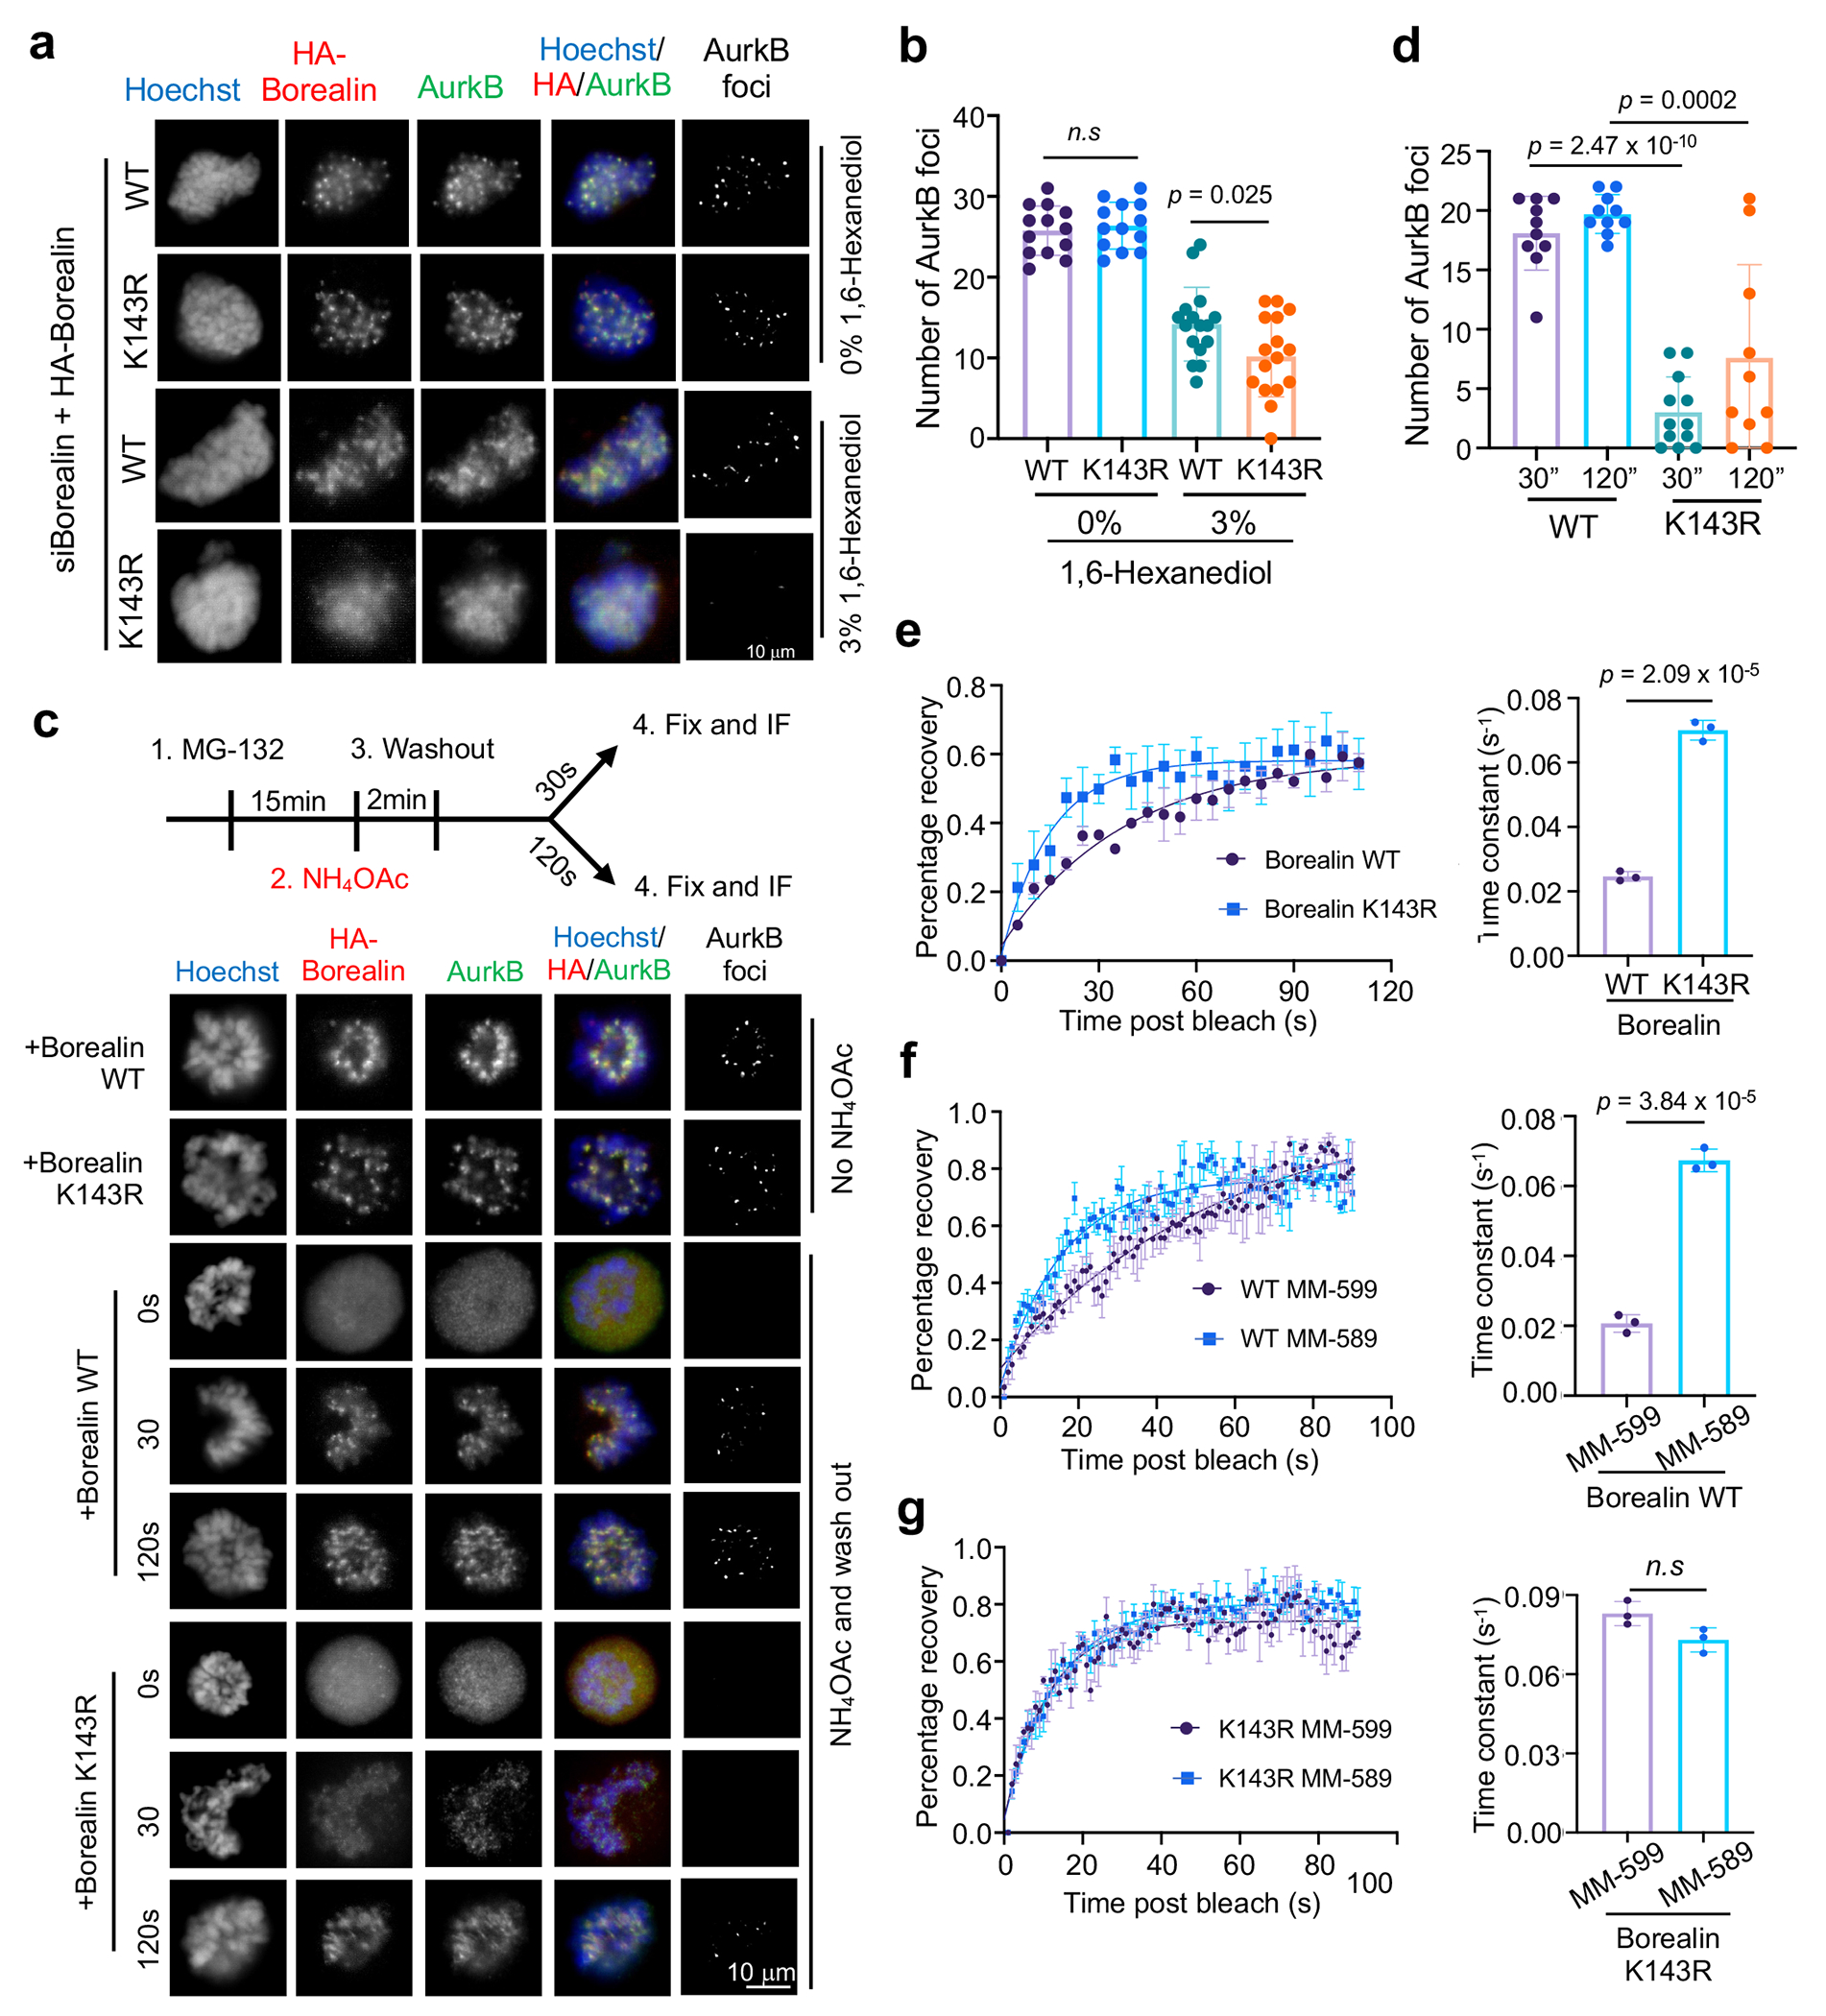
(a) Immunofluorescence for HA-Borealin and AurkB in WT or K143R cells with or without 3% 1,6-hexanediol treatment as indicated. DNA was stained by Hoechst. AurkB foci were extracted by ImageJ (see Methods). Representative images from at least three independent experiments were presented. Scale bar, 10μm.
(b) Quantification of AurkB foci in (a). A total of n = 12 cells for WT group, or n = 16 cells for K143R group were quantified for each sample indicated on bottom. Average and standard deviation (error bars) of AurkB foci from three independent experiments were presented. The p-value was calculated using two-tailed unpaired Student’s t-test. n.s., p > 0.05.
(c) Top, schematics for NH4OAc wash out experiments. Immunofluorescence for HA-Borealin and AurkB in Borealin WT or K143R cells at various time points after NH4OAc washout, as indicated on left. AurkB foci were extracted using ImageJ. Representative images from three independent experiments were presented. Scale bar, 10μm.
(d) Quantification of AurkB foci in (c). Average foci numbers from n = 10 cells were presented. Standard deviation was shown as error bar. The p value was calculated using two-tailed unpaired Student’s t-test.
(e-g) Fluorescence recovery after photo-bleaching (FRAP) for GFP-Borealin WT or GFP-Borealin K143R (e), WT GFP-Borealin cells treated with MLL1 inhibitor MM-589 or control MM-599 (f) and GFP-Borealin K143R cells treated with MLL1 inhibitor MM-589 or control MM-599 (g). Average values for at least 18 centromeric GFP-Borealin foci in 6 cells were presented. Standard deviations were presented as error bars. Time-constants were calculated from FRAP curves. The p-value was calculated using two-tailed unpaired Student’s t-test. n.s, p > 0.05.
Borealin K143R mutant has compromised CPC functions
LLPS of CPC regulates error correction of aberrant kinetochore-microtubule attachment in vitro21. To examine how Borealin K143me affects this regulation, HeLa cells were treated with Eg5 inhibitor Monastrol to induce monopolar spindles, followed by releasing into media containing MG-132 to restore bipolar alignment. K143R cells had higher levels of misaligned chromosomes as compared to WT cells (Fig. 5a), indicating defects in error correction. We next investigated how Borealin K143Rme regulates sister-chromatid or centromeric cohesion. We fixed WT and K143R cells 30 minutes after releasing from CDK1 inhibitor RO-3306 treatment to allow unperturbed tension formation at centromere. K143R cells exhibited an increase of inter-kinetochore distance under tension, as illustrated by distance between the ACA pairs (Fig. 5b). Altered centromeric cohesion was also reflected by increase of distance between the CENP-C pairs (of the X-shaped chromosomes) on metaphase spreads, from 520 nm in WT cells to 630 nm in K143R cells (Extended Data Fig. 4a). Interestingly, a small number of K143R cells carried single chromatids that were not observed in WT cells (Fig. 5c and 5d). This probably owes to precocious separation of sister chromatids as a result of impaired centromeric cohesion. Furthermore, nearly half of the inspected chromosomes in K143R cells had “closed arm” morphology, as compared to ~20% in WT cells (Fig. 5c and 5d). The unresolved chromosome arm cohesion was indicative of defects in the cohesion removal pathway that depends on CPC activity in prophase19,30.
Figure 5 |. Borealin K143 methylation by MLL1 is required for error-free mitosis.
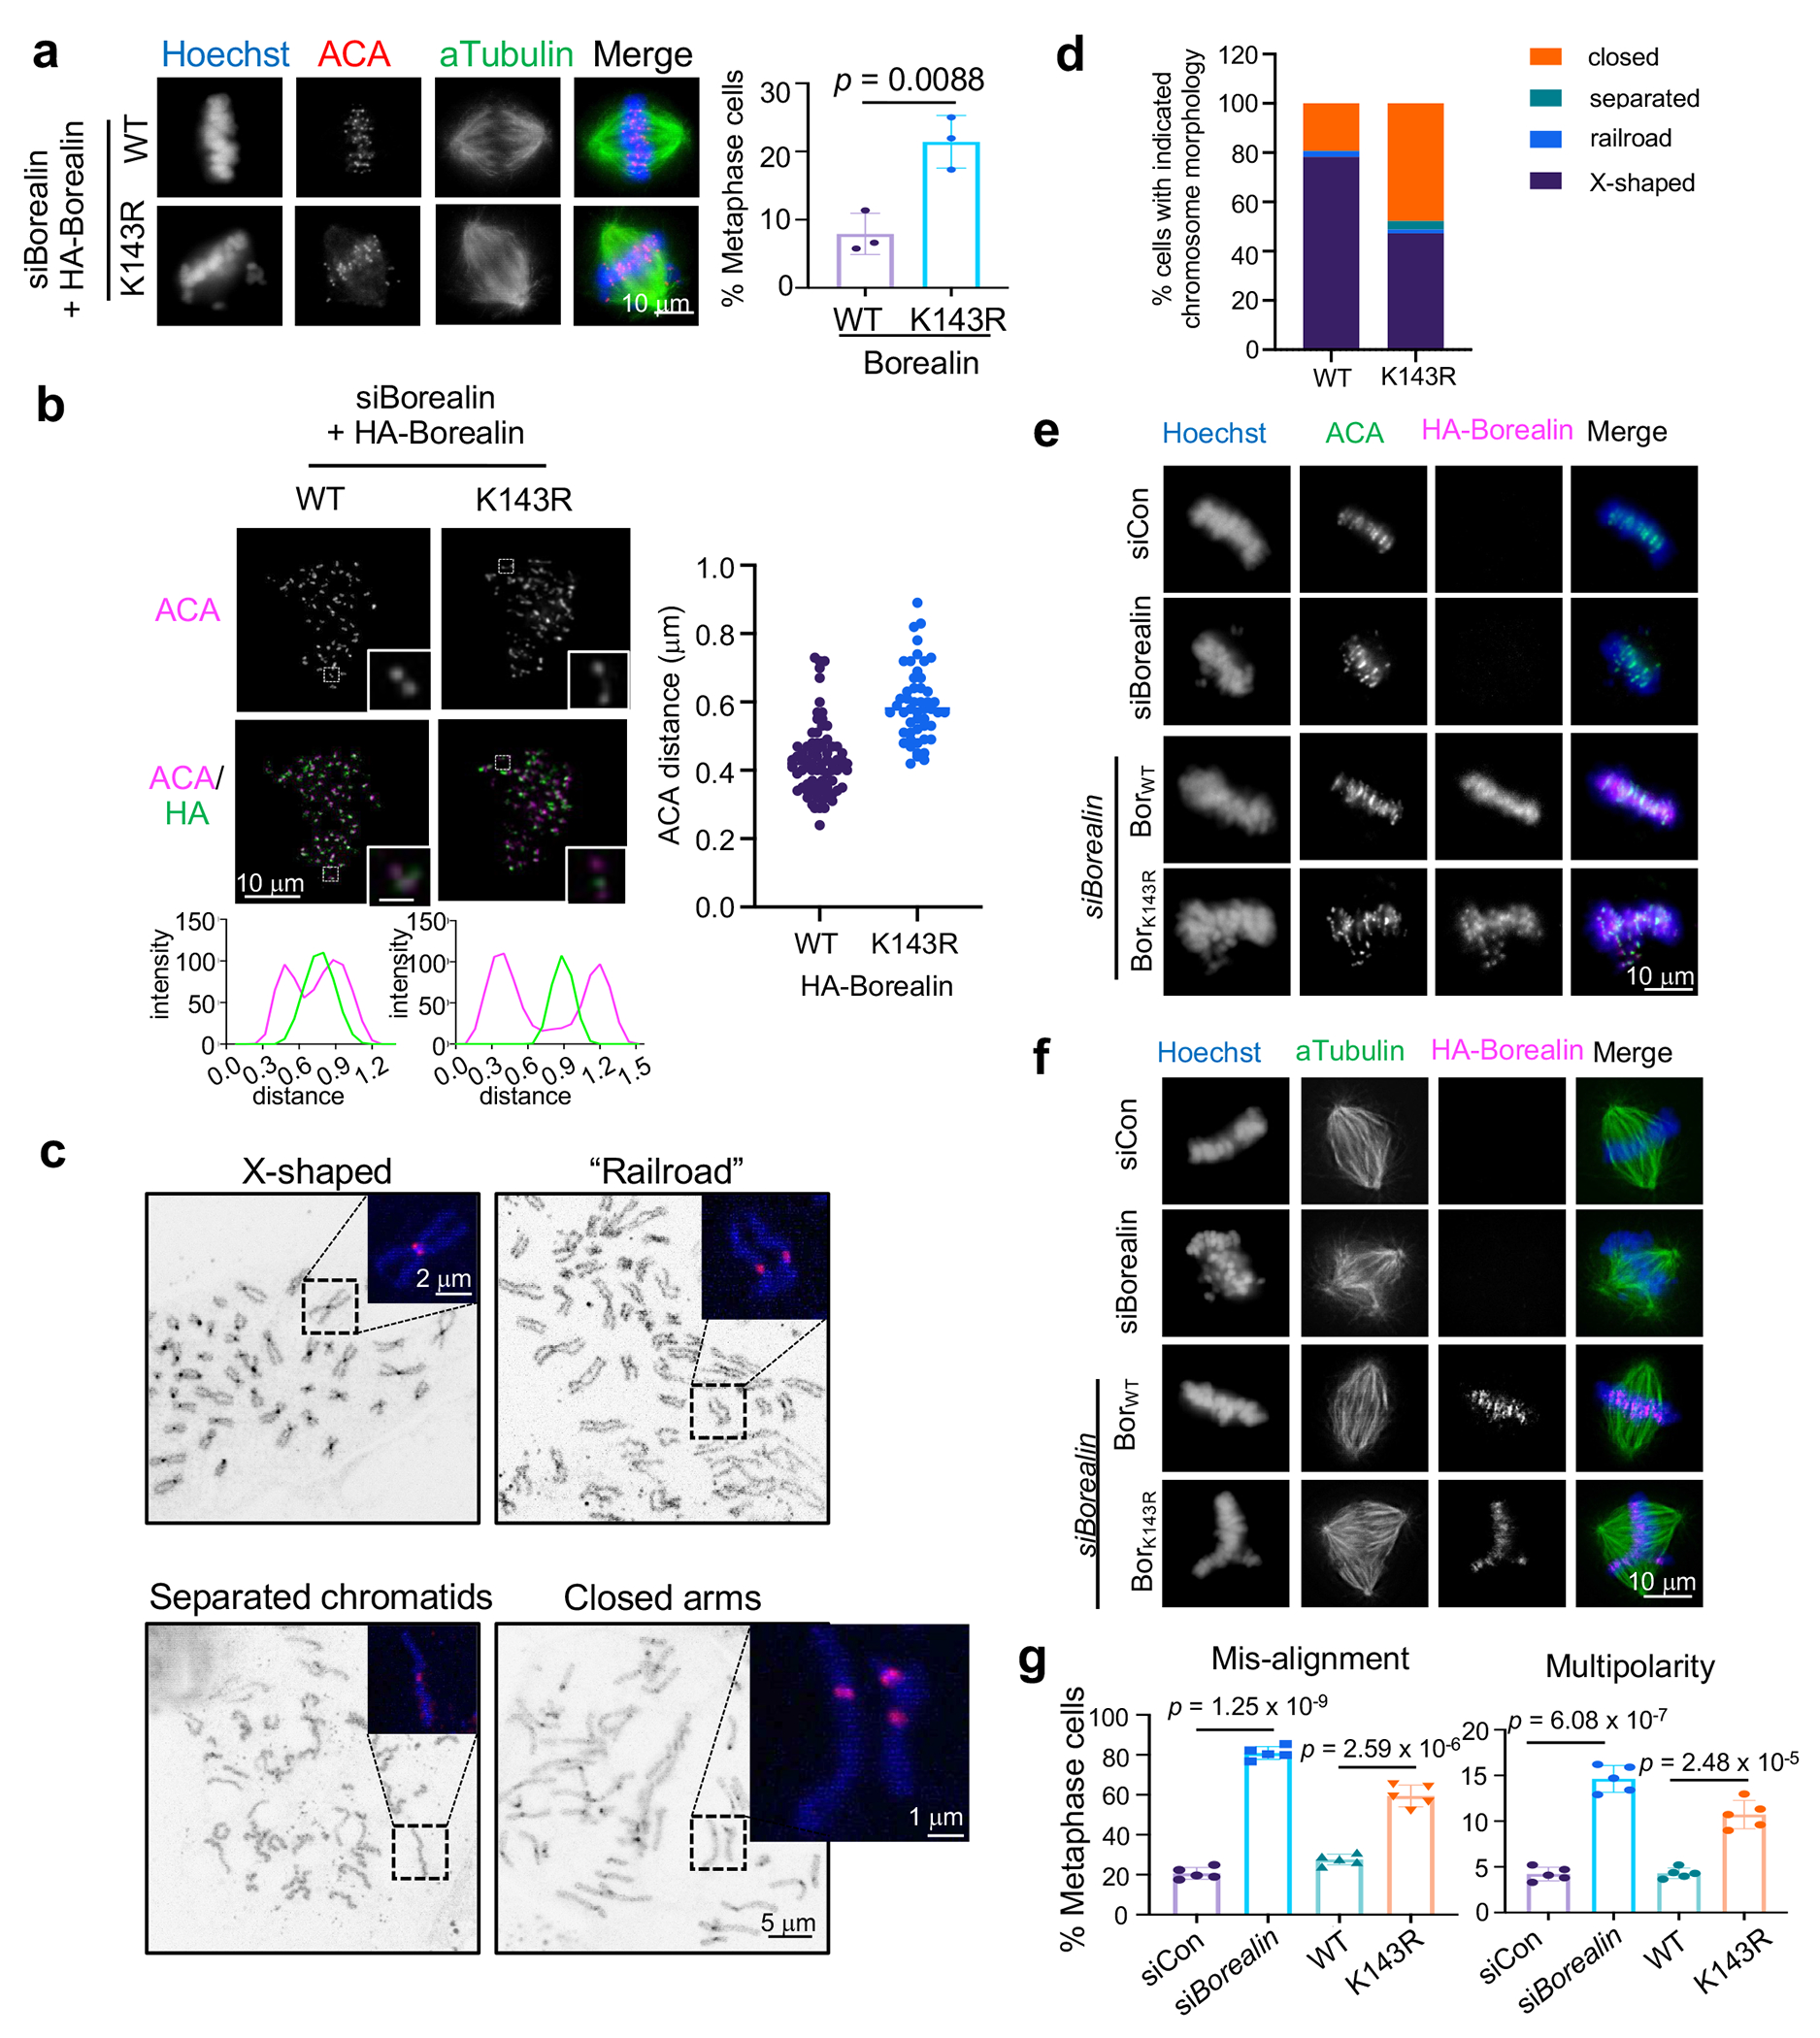
(a) Immunofluorescence for ACA and αTubulin in WT and K143R cells from Monastrol wash-out assay. DNA was stained with Hoechst. Representative images from three independent experiments were presented. Scale bar, 10 μm. Quantification of percentage of cells with mis-aligned chromosomes is shown on bottom. Average results from three independent experiments were presented. Standard deviation was presented as error bar. Over 250 metaphase cells were counted for each group in total. The p-value was calculated using two-tailed unpaired Student’s t-test.
(b) Immunofluorescence for ACA and HA-Borealin in prometaphase WT or K143R cells. An ACA pair (in white square) was enlarged and shown on bottom right. 1D line graphs of ACA (magenta) and HA-Borealin (green) were included on the bottom. Representative images from two independent experiments were presented. Scale bar, 10 μm (whole cells) and 1 μm (insets). Distance between ACA pairs was shown on the right with each dot representing one pair.
(c) Representative images of chromosome morphology as indicated on top. Scale bar, 5μm. Dashed square was enlarged to show CENP-C staining (pink). Scale bar, 2 or 1μm as indicated.
(d) Quantification of four categories in (c) from two independent experiments. Total cell numbers in each category: X-shaped (WT 301 vs K143R 173), railroad (WT 10 vs K143R 7), separated (WT 0 vs K143R 16), closed arm (WT 69 vs K143R 184).
(e) Immunofluorescence for ACA, HA-Borealin in cells treated with Borealin siRNA and with or without ectopic WT or K143R Borealin. DNA was stained with Hoechst. Representative images from five independent experiments were presented. Scale bar, 10 μm.
(f) Immunofluorescence for α-Tubulin and HA-Borealin in cells treated with Borealin siRNA and with or without ectopic WT or K143R Borealin as indicated on left. DNA was stained with Hoechst. Representative images from five independent experiments were presented. Scale bar, 10 μm.
(g) Quantification for (e, misalignment) and (f, multipolarity), respectively. Average and standard deviation (error bars) from five independent experiments were presented. At least 400 cells were analyzed for each group. The p-value was calculated using two-tailed unpaired Student’s t-test.
Borealin K143me by MLL1 is required for faithful mitosis
Depletion of either MLL1 or Borealin led to a wide range of mitotic defects, including prometaphase arrest, lagging chromosome in anaphase, chromosome misalignment and spindle multipolarity (Extended Data Fig. 4b–e), consistent with previous reports31, 32. To investigate which of the Borealin or MLL1 related mitotic defects were specifically regulated by Borealin K143me, we examined WT and K143R cells after removal of endogenous Borealin. The WT and K143R cells were indistinguishable in mitotic phase distribution, lagging chromosomes, and spindle assembly checkpoint (SAC) (Extended Data Fig. 4c–e). However, K143R failed to rescue defects in metaphase chromosome alignment and spindle bipolarity (Fig. 5e–g). K143R cells also had higher aneuploidy and grew slower as compared to WT cells (Extended Data Fig. 4f and 4g). Consistently, defects in chromosome alignment and spindle bipolarity were also found in Borealin V142W cells which abolished Borealin methylation by MLL1 (Fig. 1h, Extended Data Fig. 4h).
To confirm that defects in K143R cells were due to lack of Borealin K143me, we synchronized HeLa cells at the G2/M border with thymidine and CDK1 inhibitor RO-3306 before releasing them into media containing MLL1 inhibitor MM-589 (Extended Data Fig. 5a, top panel). Cells treated with MM-589, but not the inactive MM-599, showed a remarkable increase of misaligned chromosomes and spindle multipolarity (Extended Data Fig. 5a). Increase of chromosome misalignment and spindle multipolarity, but not lagging chromosomes, were also found in Mll1Set Δ/Δ MEFs as compared to wild type MEFs (Extended Data Fig. 5b–d). Converging results from Borealin K143R cells, MLL1 inhibition and Mll1Set Δ/Δ MEF strongly argue that Borealin K143me by MLL1 plays a highly specific role in regulating chromosome alignment and bipolar spindle formation in mitosis. Importantly, these mitotic phenotypes were not affected by KMT2B depletion (Extended Data Fig. 5e–i), consistent with divergent non-canonical functions for the closely related KMT2 paralogs in cells.
Borealin K143me by MLL1 regulates kinetochore AurkB activity
Since AurkB is a core component of CPC and requires inter-molecule interactions for its activation17, we examined whether its activity is regulated by MLL1-mediated Borealin K143me. Phosphorylation of histone H3-S10 or CENPA-S7 in the CPC condensate21 were not changed in cells after MLL1 depletion or in K143R cells (Extended Data Fig. 6a and 6b). Instead, there was significant reduction of AurkB activity at kinetochores in K143R cells, including Knl1-pS60, Hec1-pS44, Dsn1-pS109 as well as AurkB auto-phosphorylation (AurkB-pT232) (Extended Data Fig. 6c–j). Consistently, AurkB activities at kinetochores were also reduced in MM-589 treated HeLa cells and Mll1Set Δ/Δ MEFs as compared to respective controls (Extended Data Fig. 7a–c). In contrast, knocking down KMT2B did not affect AurkB activity at kinetochores (Extended Data Fig. 7d). These results show that Borealin K143me by MLL1 regulates AurkB signaling at kinetochores (see Discussion).
CPChigh HCC shows elevated dependency on MLL1
The CPC including Borealin is frequently up regulated in cancer20. To explore whether MLL1-mediated Borealin K143me is functionally relevant in cancer, we analyzed the DepMap database (http://depmap.org/), which conducted CRISPR/Cas9 mediated gene deletion in a wide range of cancer cell lines33. A strong functional dependency on MLL1 was found only in HCC and bladder cancer (BCLA) with high levels of Borealin (Fig. 6a, Extended Data Fig. 8a, Supplementary Table 7). Furthermore, MLL1 was one of the only three (out of a total of 139) epigenetic regulators that negatively affect growth of the CPChigh HCC cell lines upon deletion (Extended Data Fig. 8b). Conversely, Borealin/Survivin were two out of four cell cycle regulators whose expression had strong correlation with MLL1 dependency in HCC (Extended Data Fig. 8c). These results suggest that MLL1 may have a specific function in HCC via Borealin K143me. Meta-analysis from five independent HCC datasets34–38 (Extended Data Fig. 8d and Supplementary Table 8) and immunohistochemistry (IHC) analysis on primary human HCC tissue microarrays (Extended Data Fig. 8e and 8f) confirmed simultaneous elevation of MLL1 and Borealin levels in a subset of HCC patients. Importantly, high MLL1 expression, but not that of other KMT2 genes, was strongly associated with poor outcome in HCC (Extended Data Fig. 8g).
Figure 6 |. MLL1 is required to maintain genome stability in CPChigh HCC cells.
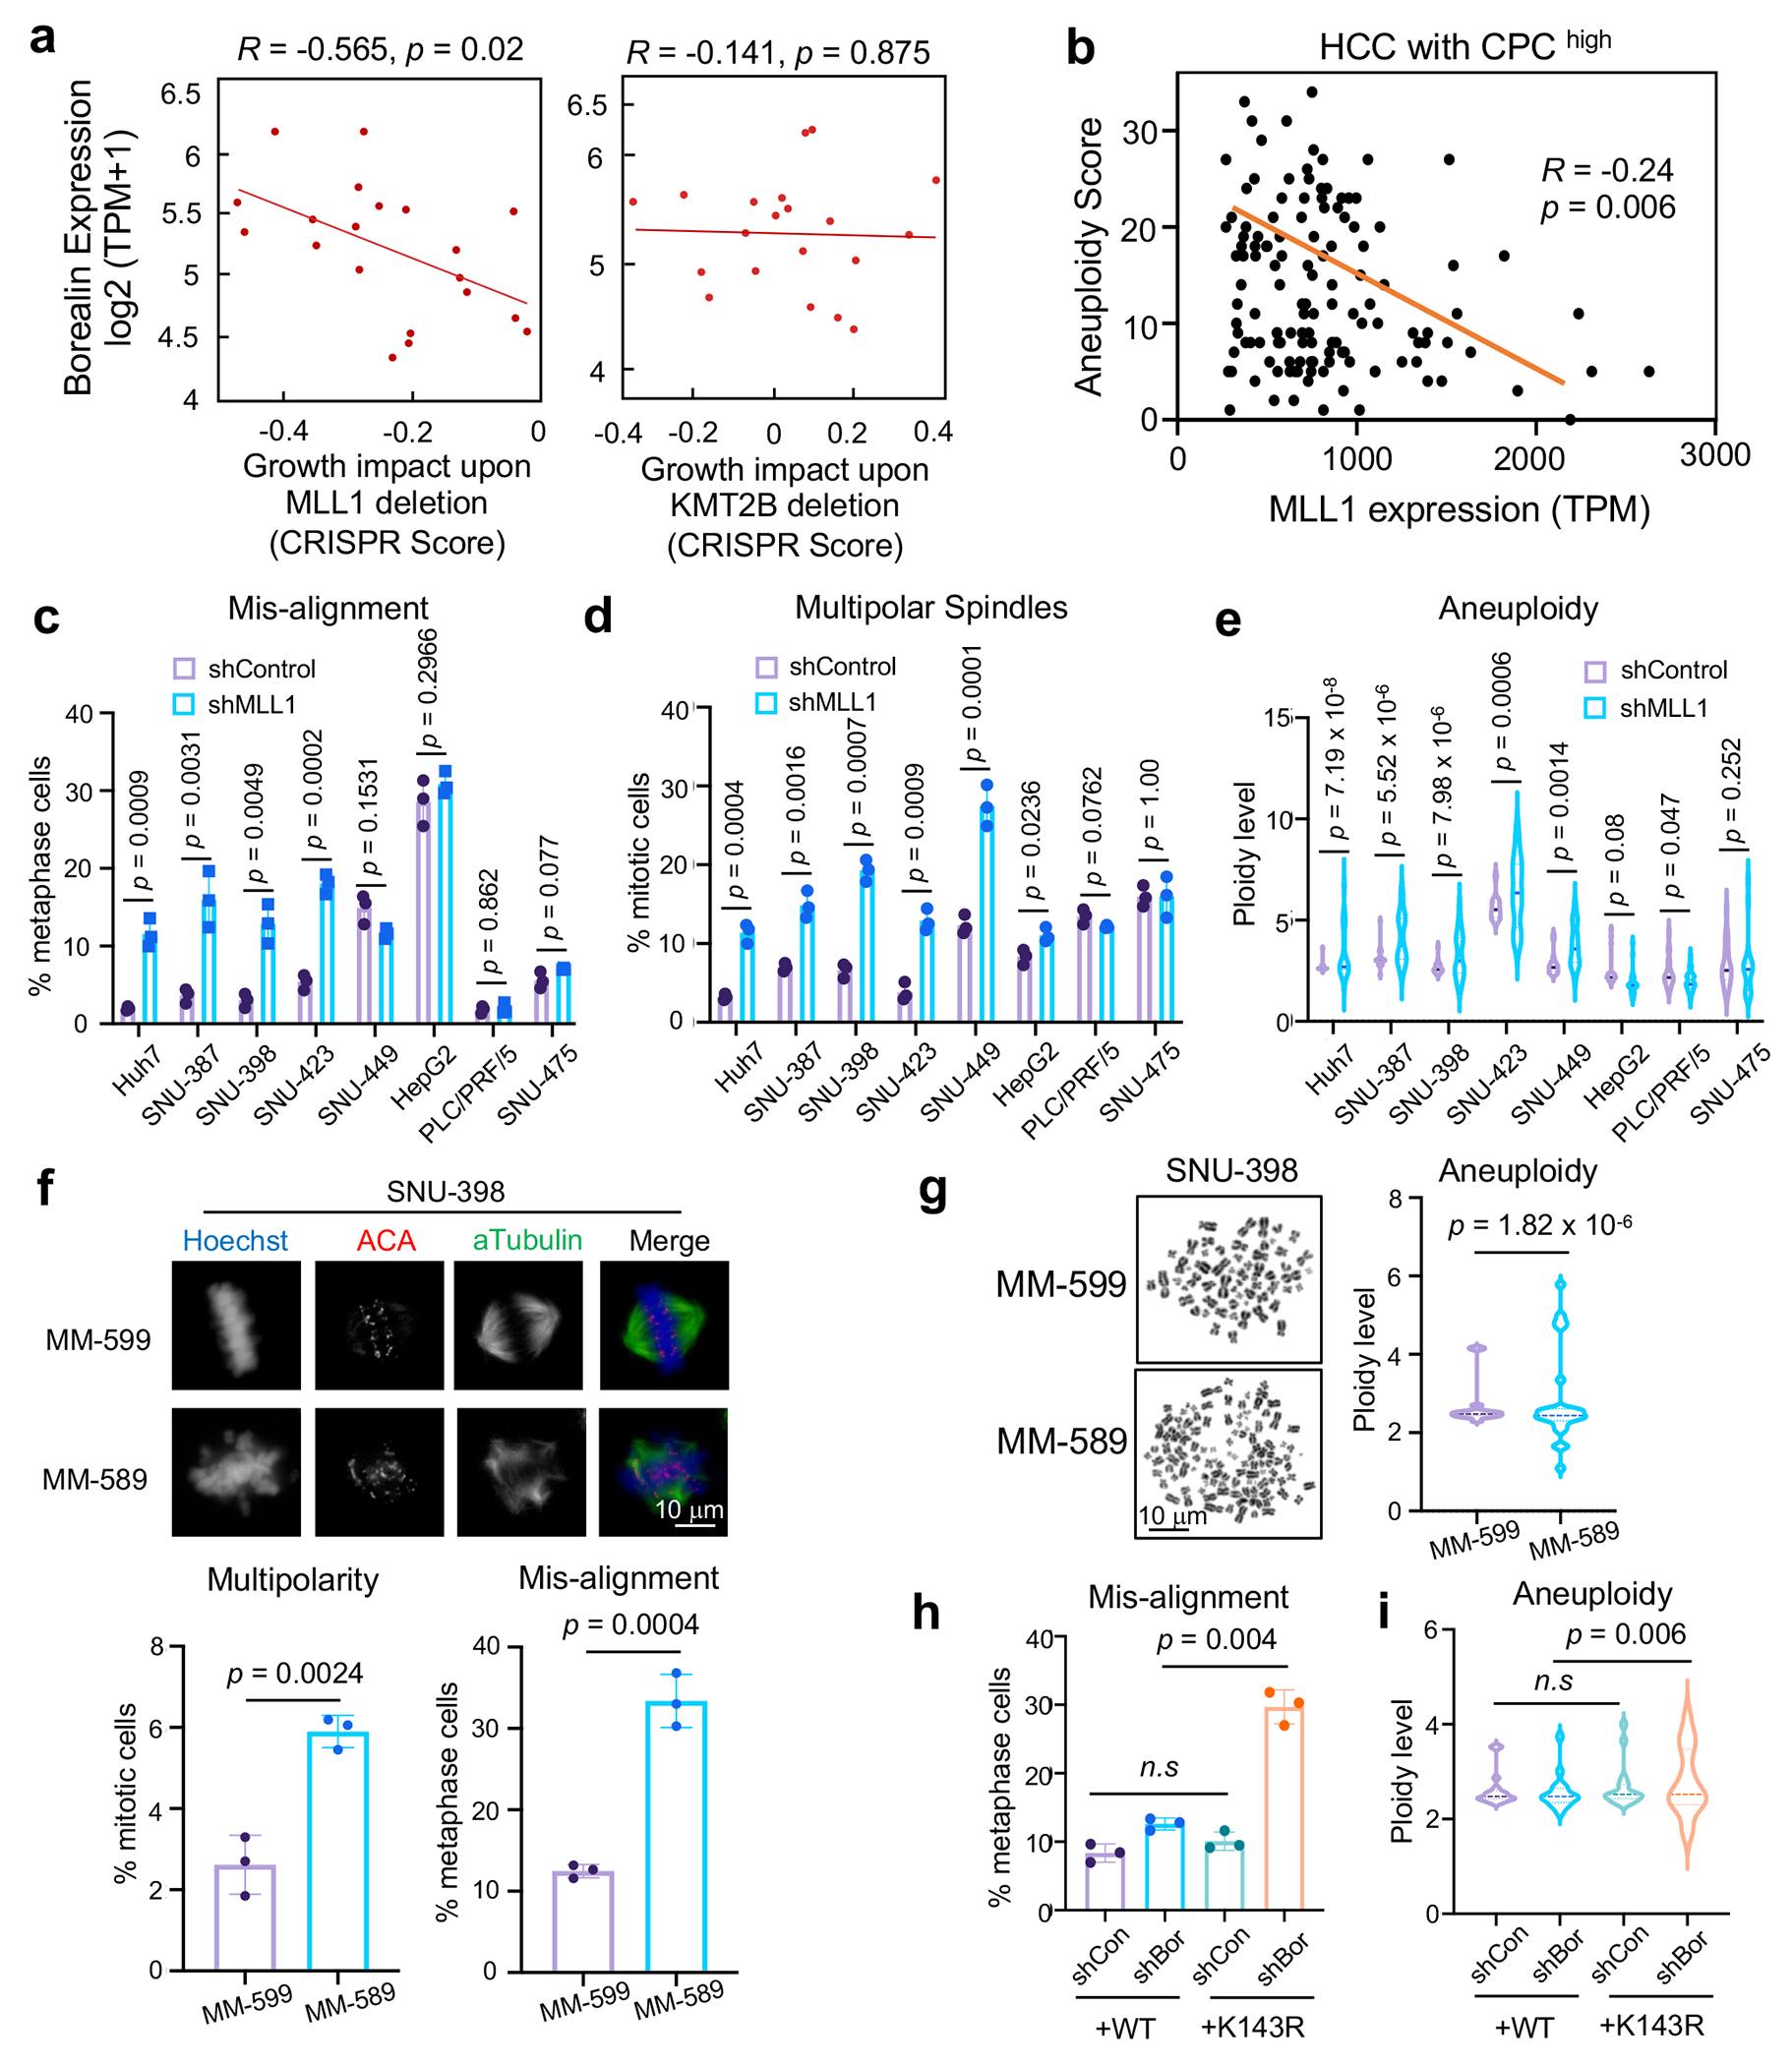
(a) Scatter plot of MLL1 (left) or KMT2B (right) dependency score vs. Borealin expression level in 20 HCC cell lines. Correlation coefficient (R) and p-values were determined by Spearman’s rank test and linear regression, respectively. X-axis, gene effect refers to growth upon deletion. Lower score means more deleterious effects on growth.
(b) Scatter plot of MLL1 expression and aneuploidy scores of HCC tumors from TCGA HCC cohort with high CPC expression (n = 196/380). Pearson correlation was performed to calculate R and p value (two-tailed).
(c-d) Percentages of metaphase cells with DNA misalignment (c) and multipolar spindles (d) for eight human HCC cell lines after control or MLL1 shRNA treatment.
(e) DNA ploidy from eight HCC cell lines treated with control or MLL1 shRNA.
(f) Immunofluorescence for ACA and αTubulin in SNU-398 cells treated with indicated compounds. DNA was visualized with Hoechst. Representative images from three independent experiments were presented. Scale bar, 10 μm. Quantification of multipolar spindles or DNA misalignment is shown on bottom.
(g) Left, representative mitotic spreads from SNU-398 cells treated with indicated compounds. Scale bar, 10 μm. Right, DNA ploidy were quantified as multiples of 23.
(h-i) Quantification of mitotic chromosome mis-alignment (h) and DNA ploidy (i) in SNU-398 cells ectopically expressing Borealin WT or K143R and treated with indicated shRNAs.
For (c-d), (f), and (h), at least 120 total cells were analyzed for each condition per experiment. Average and standard deviation (error bars) from 3 independent experiments were presented. Two-tailed unpaired Student’s t-test was performed to calculate the p-values. n.s, p > 0.05.
For (e), (g) and (i), DNA ploidy is shown as multiple of 23 (set as 1). Twenty-five cells (e), sixteen cells (g) and thirty cells (i) were scored for each condition per experiment, respectively. The central lines in the violin plot indicate mean values. Top and bottom dashed lines represent 75% and 25% quantiles, respectively. Representative results from two independent experiments were shown. The p-value was calculated using one-sided F-test. n.s, p > 0.05.
It has been reported that HCC with elevated CPC has relatively low ongoing chromosome instability39. This is consistent with the current view that while aneuploidy is common in tumor cells, excessive chromosome instability and massive aneuploidy reduce overall tumor fitness40. We postulate that CPChigh HCC may depend on Borealin K143me by MLL1 to maintain low ongoing chromosome instability for better fitness. This is supported by significant anti-correlation between MLL1 expression and aneuploidy score in CPChigh HCC in TCGA dataset (Fig. 6b). No such correlation was found in CPClow HCC from the same cohort (Extended Data Fig. 8h). To directly examine the specific function of MLL1 in CPChigh HCC, we depleted MLL1 in eight human CPChigh or CPClow HCC cell lines (Extended Data Fig. 9a). MLL1 knockdown led to significant increase of chromosome misalignment and spindle multipolarity in the CPChigh HCC cell lines (i.e., Huh-7, SNU-387, SNU-398 and SNU-423) (Fig. 6c and 6d), but not in the CPClow HCC cell lines (i.e., HepG2, PLC/PRF/5 and SUN-475). As a result, aneuploidy increased drastically upon MLL1 depletion in CPChigh, but not CPClow HCC (Fig. 6e). Additionally, MLL1 inhibition by MM-589 phenocopied MLL1 depletion and significantly increased spindle multipolarity, chromosome misalignment and aneuploidy in the SNU-398 cells (Fig. 6f and 6g). Importantly, replacing endogenous Borealin with K143R mutant in the SNU-398 cells also led to significant increase of chromosome misalignment and aneuploidy compared to cells with reinstallation of WT Borealin (Fig. 6h and 6i). MLL1 depletion by shRNAs dramatically inhibited proliferation of the CPChigh SNU-398 and Huh-7 cells (Fig. 7a and Extended Data Fig. 9b) while only modestly affected growth of the CPClow HepG2, PLC/PRF/5 and SUN-475 cells (Fig. 7b and Extended Data Fig. 9c–d). Re-installation of WT Borealin more effectively rescued growth defects than K143R after Borealin depletion in SNU-398 cells (Extended Data Fig. 9e and 9f). To examine whether MLL1 depletion specifically affected CPChigh HCC growth in vivo, we depleted MLL1 in CPChigh SNU-398 or CPClow HepG2 and PLC/PRF/5 cells expressing a GFP+ reporter and subcutaneously injected the cells into nude mice (Fig. 7c and Extended Data Fig. 10). Bioluminescence imaging was conducted on both control and MLL1 knockdown cohorts every other day. In vivo GFP images at day 1 and day 15 (SNU-398) or 21 (HepG2) were shown in Fig. 7c. Xenografts for SNU-398 cells with MLL1 depletion failed to proliferate in vivo (Fig. 7c, Extended Data Fig. 10b, upper) while control tumors rapidly reached endpoint and had to be euthanized within four weeks (Fig. 7d). In contrast, MLL1 depletion had no survival benefit for the CPClow HCC Xenograft models in vivo (Fig. 7c, 7e and Extended Data Fig. 10a, b (middle and bottom), c, d).
Figure 7 |. MLL1 is required for proliferation of CPChigh HCC cells in vitro and in vivo.
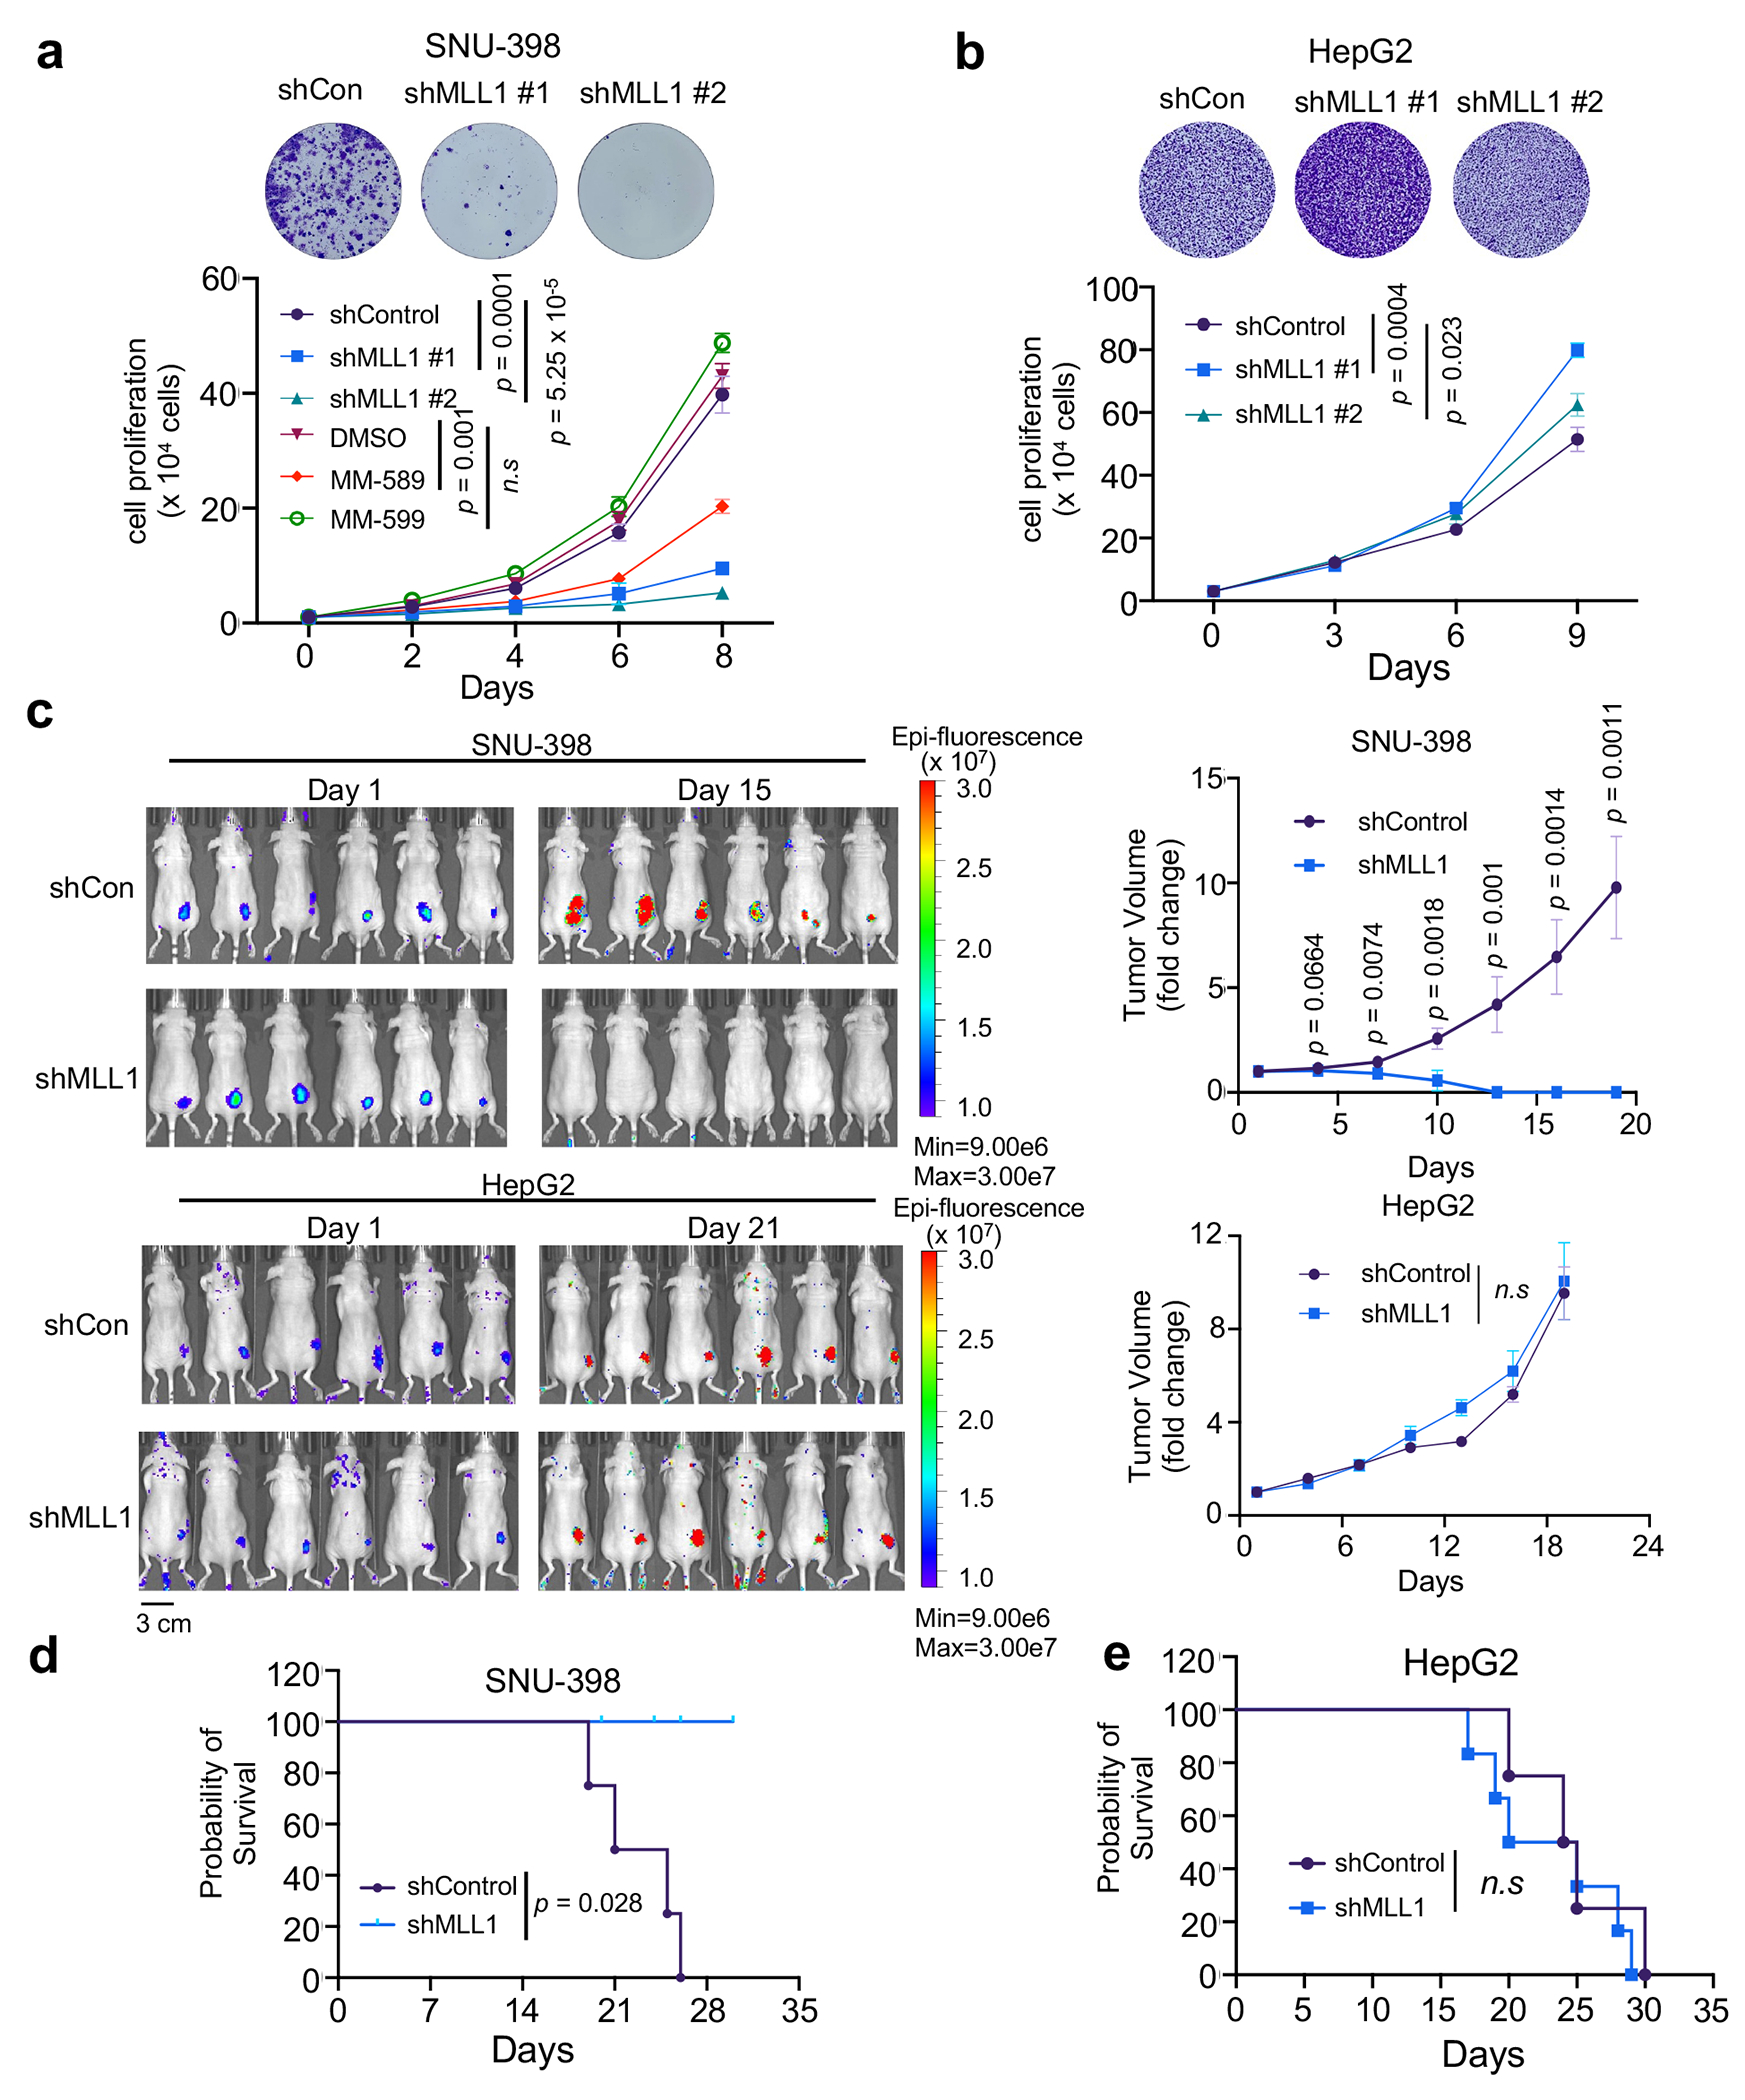
(a) and (b) Top, crystal violet stain of cell colonies of SNU-398 (a) and HepG2 (b) 72 hrs after control or MLL1 shRNA treatment. Representative images from three independent experiments were presented. Bottom, growth curves for SNU-398 (a) and HepG2 (b) cells treated with indicated shRNAs or compounds. Average results from three independent experiments were presented. Standard deviations were presented as error bars. The p-value was calculated using two-tailed unpaired Student’s t-test for cells on Day 8. n.s, p > 0.05.
(c) Bioluminescence images of SNU-398 (top) or HepG2 (bottom) xenografts at Day1 and Day15 (SNU-398) or Day 21 (HepG2) post subcutaneous injection. Control or MLL1 shRNA treatment was indicated on left. Heatmap key for bioluminescence intensity detected by IVIS Spectrum after GFP excitation is shown. Fold change of tumor volumes is shown on the right. Data were presented as average ± s.e.m of six tumors in each group. Two-tailed unpaired Student’s t-test was performed to calculate the p-values. n.s., p > 0.05.
(d) and (e) Kaplan-Meier survival curves for SNU-398 (d) and HepG2 (e) xenografts (n=8 per group). Median survival were 23 days (SNU-398) and 24.5 (HepG2) days for control mice, and 22.5 days (HepG2) for shMLL1 mice. Experimental end point is declared when tumor volume reaches 1000 mm3. The p-value was determined by log-rank test. n.s, p > 0.05.
Discussion
Previous studies show that MLL1 regulates expression of cyclin-dependent kinase inhibitors (p18 and p27) 41 or the E2F-dependent gene networks42. MLL1 also facilitates rapid initiation of transcription upon exiting the M phase43. Here we have uncovered a new paradigm by which MLL1 regulates mitosis by modulating inner centromere biomolecular condensates via Borealin K143 methylation. Interestingly, despite the shared H3K4me activity, the KMT2 family enzymes have divergent activities on Borealin. Co-crystal structure show that the Borealin peptide interacts a new set of residues (e.g. D3876) within the MLL1 SET domain that are partially conserved among the KMT2 family enzymes. Thus, it is possible the intrinsic difference in KMT2 SET domains may underlie their divergent specificity on non-canonical substrates. It will be important to investigate the distinct spectrum of non-canonical substrates for the KMT2 enzymes and how they contribute to the non-redundant functions of KMT2 in development and diseases.
The ability of MLL1 to methylate both H3K4 and Borealin K143 raises the question of how these two activities are coordinated at centromere, especially considering higher MLL1 activity towards the NCP (Fig. 1b). It is well-documented that phosphorylation of histone H3 threonine 3 (H3T3ph) by Haspin directly interacts with Survivin and recruits the CPC to inner centromeres at the onset of prophase44–46. Given the proximity of H3T3 to K4, it is likely that Survivin binding of H3T3ph blocks MLL1-H3K4 interaction. H3T3ph may also create direct steric clash in the lysine access channel of the MLL1 SET domain27. We envision that centromere specific H3T3ph provides a unique chromatin environment that skews MLL1 activity from the NCP to Borealin K143. It is consistent with the mitosis-specific functions for MLL1 and Borealin K143me. It would be interesting to further investigate the crosstalk between H3T3ph and Borealin K143me in future.
The emerging field of inner centromere phase separation represents a captivating frontier in cell cycle regulation47. Our study unveils a new role of MLL1 in regulation of LLPS of the CPC. While the impact of acetylation and other charge-altering modifications on LLPS are better understood48, the mechanism for methylation-mediated control of LLPS remains elusive. A recent study shows that PRMT1-mediated arginine methylation of FUS inhibits LLPS49, while our findings demonstrate that MLL1-mediated Borealin K143me promotes LLPS in vitro. Borealin K143me by MLL1 directly alters phase diagram and lowers saturation concentration for LLPS of the CPC. It is important to acknowledge that it is conceivable that the dynamics of centromeric CPC condensate is regulated by Borealin K143me dependent processes in cells, including multivalent effects by recruiting additional interacting proteins that partition into the CPC coacevates. How Borealin methylation regulates the biophysical properties of the CPC condensates requires future investigation. Furthermore, since Borealin is methylated by other lysine methyltransferases in vitro (e.g., G9a and EZH2) (Fig. 2b), it would also be worthwhile to investigate whether centromeric CPC condensates are subject to additional regulation by methylation.
We have made an intriguing observation that MLL1-mediated Borealin K143 methylation does not affect AurkB activity on H3-S10 and CENPA-S7 at inner centromeres. However, it affects AurkB auto-phosphorylation and phosphorylation of its substrates at kinetochores. The lack of effects on AurkB activity at inner centromere may be attributed partly to the redundant Aurora kinase A activity 50. Alternatively, the remaining AurkB activity at inner centromere in the absence of Borealin methylation is sufficient for the phosphorylation of local substrates. The precise mechanism for MLL1-mediated AurkB regulation at kinetochores remains to be fully understood. Since Borealin K143me by MLL1 alters hydrodynamics of CPC condensates at inner centromere, it may affect the diffusion of activated CPC from inner centromere to kinetochores and the consequent kinetochore activity of AurkB51. Alternatively, kinetochore and centromeric AurkB may exist in separated pools that are independently regulated52. Hence, we cannot rule out the possibility that Borealin K143me by MLL1 regulates AurkB activity at kinetochores through mechanisms unrelated to centromeric CPC phase separation. Nevertheless, our results uncover an important crosstalk between MLL1 and AurkB in mitosis.
Our findings are in contrast to a previous study that MLL1 regulates cell-cycle independent of its methyltransferase activity31. We have provided compelling evidence showing that MLL1 activity is important in regulating CPC functions in mitosis: 1) MLL1 methylates Borealin K143 and regulates LLPS of the CPC in mitotic cells; 2) deletion of the MLL1 SET domain or inhibiting MLL1 activity by MM-589 induces chromosome mis-alignment, multipolar spindle, and increased aneuploidy in multiple mouse and human cell lines; and 3) cells with the Borealin K143R mutation exhibit similar mitotic defects as cells with MLL1 SET deletion or inhibition. It is worth noting that our results are consistent with the previous study31 that MLL1 has activity-independent functions in mitosis. MLL1 depletion results in more severe mitotic defects than MLL1 SET deletion or MLL1 inhibition alone. Similarly, Borealin depletion also results in broader defects than Borealin K143R mutatant. These results suggest that Borealin K143me by MLL1, and by extension LLPS of the CPC, may have highly specific functions in mitosis.
METHODS
Ethical regulation compliance
Mouse colonies were maintained in the AALAC-accredited pathogen-free animal facility with controlled temperature, humidity, and light-dark cycle (12h) and onsite veterinarians at the University of Southern California. All animal procedures were performed with approval by the Institutional Animal Care and Use Committee (IACUC).
Cell lines
The HEK293T cell and HeLa cells were cultured in DMEM medium. The Huh-7 and PLC/PRF/5 cells were cultured in DMEM medium with 2 mM Glutamine. The SNU-387, SNU-398, SNU-423, SNU-449 and SNU-475 cells were cultured in RPMI 1640 medium with 10 mM HEPES and 1 mM Sodium Pyruvate. The HepG2 cells were cultured in EMEM medium with 1 mM Sodium Pyruvate and 2 mM Glutamine. All media were supplemented with 10% fetal bovine serum and 100 U/mL penicillin/streptomycin. The Mll1f/f; ER-Cre+/-, Mll1 Set+/+ or Mll1 SetΔ/Δ MEFs were immortalized by SV40 large T antigen. The stable MEF cell line expressing FLAG-tagged 3xMBT (wild type and D355N mutant) were generated by transfecting Mll1f/f; ER-Cre+/− MEF with pcDNA3-FLAG-3xMBT (WT or D355N) plasmids. Cells were selected by 300 μg/mL Geneticin (G-418, Gibco) for 2 weeks. Mll1 deletion was induced by 100 nM 4-Hydroxytamoxifen (4-OHT) for one week. The HeLa (Accept #2) cell lines stably expressing HA-BorealinWT-GFP or HA-BorealinK143R-GFP were generated by co-transfecting pEM791 (pRD-RIPE) and pEM784 (pCAGGS-nlCre) plasmids using Fugene HD (Promega), followed by 0.5 μg/ml Puromycin (Gibco) selection for 10 days. All cells are authenticated by morphology and tested negative for mycoplasma (LookOut Mycoplasma PCR Detection Kit, SIGMA).
SILAC and mass spectrometry
Two-way orthogonal SILAC experiments were performed. Cells were grown in SILAC media containing normal amino acids (‘light’) and modified amino acids (‘heavy’), respectively for two weeks. After SILAC, cells were lysed in RIPA buffer supplemented with 1 mM PMSF and protease inhibitor cocktail. Immunoprecipitation was done using anti-FLAG M2 Affinity Gel (SIGMA). The IP from each experiment were combined at a ratio of 1:1 by mass and resolved on SDS-PAGE. Gel pieces were excised and subjected to mass spectrometry at Taplin Mass Spectrometry Facility (Harvard University).
Protein Purification
Expression and purification of the KMT2 complexes were previously described53. The ISB or GFP-ISB complex were expressed from the tri-cistronic vector containing 6×His-INCENP1–58, Survivin and Borealin (WT or K/R mutants) or GFP-Borealin as previously described 21. For GST-tagged 3xMBT WT or D355N proteins, bacterial culture was grown in LB medium containing 100 μg/mL Ampicillin (SIGMA). After overnight induction with 0.1mM IPTG, cells were lysed in the BC150 buffer containing 150 mM NaCl, 50 mM Tris-HCl (pH 7.5), 0.05% NP-40, 1 mM PMSF, the protease inhibitor cocktail, and 10 mM DTT. For GST-pulldown experiments, GST-3xMBT WT or D355N proteins were incubated to Glutathione (GSH) Sepharose 4B beads (GE Healthcare) for 1hr at 4°C. After washes, the beads were incubated with pre-cleaned cell lysates for overnight at 4°C. The resin was washed three times with BC150 buffer. Bound proteins were eluted and analyzed by immunoblot.
In vitro lysine methyltransferase (KMT) assay
In vitro KMT assay was performed using 0.5 μM enzyme, 2 μg substrate and 100 μM cold S-adenosylmethionine (SAM, NEB) or 0.25 μCi 3H-S-adenosylmethionine (3H-SAM, PerkinElmer Inc.). The reaction was carried out at 25°C for 3 hours in the buffer containing 50mM Tris (pH 8.0), 50mM NaCl, 5mM MgSO4 and 1mM DTT. Proteins were resolved on SDS–PAGE. Methylated proteins were visualized by autoradiography as previously described54.
Generation of the Borealin-K143me1/2-specific antibody
The peptides containing amino acid 138-152 of human Borealin (QTARVK(me1/2)RCPPSKKRT) were synthesized and conjugated to KLH. The 85-day standard procedure was followed for immunizing the rabbits at Pocono Rabbit Farm & Laboratory. Antiserum was subject to negative selection against the unmodified Borealin peptide, followed by positive selection using antigen peptide containing K143 (me1/2). Dot blot was performed by directly spotting 0.5 μL antigen peptides onto the PVDF membrane (0.45 μm, Bio-Rad) and incubating with the antiserum followed by the HRP-conjugated anti-rabbit antibody (#7074 Cell Signaling).
Crystallization and X-Ray data collection
Human MLL1-SET (residues 3785-3969) in pET3a vector with the MBP tag and a tobacco etch virus (TEV) cleavage site at the N-terminus was expressed and purified as previously described27. Initial crystallization screen was carried out in a solution containing 722 μM protein, 2 mM AdoHcy at 4°C. We co-crystallized of MLL1-SET with AdoHcy and the Borealin peptide, 137−LQTARVKme1RC-145 (Genscript Biotech). Initial crystals were used for micro-seeding. Crystals were frozen in cryoprotectant consisting of 48% Tacsimate pH 7.0, 24 mM Tris-HCl pH 8.0, 120 mM NaCl and 30% glycerol. All data were collected under cryogenic conditions (105 °K) from the beamline 21ID-D at LS-CAT (Advanced Photon Source, Argonne National Laboratory, USA) using MD-2 diffractometer software. The space group and unit cell dimensions were P31 2 1 and a = 54.58 Å, b = 54.48 Å, c = 105.63 Å, α = β = 90°, γ = 120°. A single protein molecule was found in the asymmetric unit.
Structural data processing and structure determination
The raw datasets were indexed, integrated, and scaled by XDS through Xia255. Initial phases were obtained by molecular replacement using PHENIX.Phaser56 with the structure of MLL1-SET (PDB ID: 2W5Y) as a search model after truncation of the N-terminal flexible region27. The model was further improved by repeated cycles of manual model building using COOT57 and refinement using PHENIX.REFINE58. The final model had R/Rfree of 0.24 / 0.29 and the Ramachandran statistics for favored/disallowed was 100/0. Crystallographic data statistics were summarized in Supplementary Table 6. Figures were prepared using PyMOL (The PyMOL Molecular Graphics System, Version 2.5.2, Schrödinger, LLC). A stereo image of the electron density map is provided in Supplementary Figure 2. The crystal structure model has been submitted to the PDB with accession code 7U5V and a validation report from wwPDB is available in the Supplementary Data 1.
Induction of phase separation for the ISB complex and Partition of the MLL1 complex
Phase separation of the ISB or GFP-ISB complex was induced by diluting the reaction mixture with the low salt buffer containing 50 mM Tris-HCl pH 8.0, 10% Glycerol, 0.02-0.04% Triton X-100 and 1 mM DTT to the indicated salt concentrations. The MLL1 core complex containing MLL1SET, RbBP5, WDR5, ASH2L and DPY30 was labelled with CF555 using the Mix-n-Stain kit (SIGMA-Aldrich). Ten micromolar of the ISB complex, 0.5 μM labelled MLL1 core complex, or both was incubated in the partitioning buffer containing 50 mM Tris-HCl (pH7.5), 150 mM NaCl, 1 mM DTT and 5% PEG-3350 for 2 min at room temperature (RT) and imaged immediately. Droplets were imaged with a x40 objective on the Olympus IX73 microscope by DIC or fluorescence.
Measurement of saturation concentration of the ISB complex
Six micromolar of the ISBWT or ISBK143R complex was incubated with 10 μM SAM, 0.33 μM MLL1 core complex, or both in the KMT buffer at 25°C overnight. After induction of phase separation, the mixture was stand for 5 min followed by centrifuged at 1000 g for 5 min. Five microliters of the aqueous phase were analyzed by SDS-PAGE. To generate the standard curve, six micromolar of the ISB complex was added to the buffer containing 500 mM NaCl and subject to serial dilution. Saturation concentration of ISB complex was measured as previously described 21.
Immunoprecipitation and immunoblot
Cells were lysed in ice-cold lysis buffer (25 mM Tris-HCl pH 7.4, 150 mM NaCl, 1 mM EDTA, 1% NP-40, 5% glycerol, 1 mM PMSF, protease inhibitor cocktail) for 10 min, followed by brief sonication. The total cell lysate was clarified by centrifugation at 20,000 g 4°C for 30 min. Protein concentration was determined by the Bicinchoninic Acid (BCA) assay (Pierce). For immunoprecipitation, cell lysates were incubated with the antibody overnight at 4°C, followed by protein A purification (ThermoFisher) for 1hr at 4°C. For immunoblot, PVDF membranes were blocked with skim milk for 1 hour at RT and incubated with primary antibodies with gentle agitation at 4°C overnight and the HRP-conjugated secondary antibodies (rabbit #7074 or mouse #7076, Cell Signaling) for 1 hour at RT. Full list of primary and secondary antibodies including diluting conditions used in this study is provided in the Reporting Summary. Chemiluminescent signals were captured on ChemiDoc using Image Lab (Bio-Rad) and quantified using ImageJ.
Immunofluorescence and image quantification
Cells grew on the 12-mm glass coverslips and were fixed with methanol or paraformaldehyde (PFA). For methanol fixation, coverslips were rinsed in PBS and immediately submerged in ice-cold methanol and fixed at −20°C for 10 min. For PFA fixation, cells were treated with 4% PFA for 15 min at RT, followed by permeabilizing with 0.2% Triton X-100 (vol/vol) in PBS for 5 min. After fixation, cells were washed with PBS and blocked with 3% BSA in PBS with 0.01% Tween 20 (PBST0.01). Primary antibody was incubated at 4°C overnight, followed by 1hr secondary antibody (1:500) incubation at RT. Cells were counterstained with 0.5 μg/mL Hoechst (SIGMA) in PBS for 2 min and mounted using Prolong Diamond Antifade Mountant (ThermoFisher). Images were acquired on the BX43 microscope system (Olympus) using a DP73 high-performance Peltier cooled, digital color camera or on a DeltaVision OMX imaging system (GE Healthcare) using an UPlanSApo 60×/1.42 objective and a sCMOS camera (PCO). Maximum intensity projections of the deconvolved images were processed using Softworx (GE Healthcare). Quantification of fluorescent intensity was performed using ImageJ. Average pixel intensity in a circular region encompassing at least three centromere pairs was used. After background correction, the ratio of protein staining intensity relative to that of GFP-Borealin or ACA was calculated for each circular region. The means and standard deviation of a total of randomly selected 150 circular regions from 10 cells were plotted. Distance between each of 400 CENP-C pairs from 10 cells was measured using cellSens software (Olympus). To quantify AurkB foci, AurkB at inner centromere was determined by its relative position to ACA on prometaphase chromosomes (Extended Data Fig. 3a). The fluorescent images of Aurora B were background subtracted using ImageJ with a rolling ball radius of 10 pixels and sliding paraboloid, followed by two Gaussian blur filters with Sigma of 2 and 5, respectively. A second subtraction was applied between the two blurred images obtained above. AurkB foci above threshold were counted using particle algorism in ImageJ.
Cell synchronization and preparation of mitotic chromosome spread
Cells were synchronized at S-phase by double Thymidine (2 mM, SIGMA) treatment, followed by nocodazole (100 ng/mL, SIGMA) induced mitotic arrest. Alternatively, cells were treated with 9μM CDK1 inhibitor RO-3306 (Calbiochem) overnight for G2/M arrest and released into fresh medium in the presence or absence of ZM447439 (2 μM, Cayman Chemical) or MM-589/599 (20 μM). Mitotic cells were shaken off, spun down and resuspended in the hypotonic buffer (25 mM KCl and 0.27% sodium citrate) for 20 min at 37 °C. Swollen cells were broken open and chromosomes were spread on the glass slides using a Cytospin 4 (ThermoShandon). The glass slides were then fixed with 2% PFA in PBS for 10 min and permeabilized in 0.5% Triton X-100/PBS for 10 min. The chromosomes were stained with anti-MLL1 (14197S, Cell Signaling Technology, 1:200), anti-Borealin (M147-3, MBL, 1:2000), or anti-CENP-C (PD030, MBL, 1:500) antibodies and counterstained with Hoechst. The image was taken using the Olympus BX43 microscope with x60 objective. The chromosome morphologies were quantified using Prism 8 (GraphPad).
Gene knockdown
The siRNA mediated gene knockdown was performed using JetPRIME transfection reagent (Polyplus) and 50 nM siRNAs. For shRNA mediated knockdown, lentiviral particles were produced by co-transfection of 293T cells with the pLKO.1_puro or pLKO.1_P2G shRNA constructs, pCMV-VSV-G and psPAX2 in a ratio of 10:1:10 by mass using Lipofectamine 3000 transfection reagent (Invitrogen). Viral supernatant was collected at 36 and 60 hours after transfection and filtered through a 0.45 mm membrane (Millipore). Cells were transduced overnight in the presence of 8 μg/mL polybrene followed by 48-hour puromycin selection. The control or MLL1, KMT2D, EZH2, or G9a shRNAs were in the pLKO.1_P2G vectors that has a T2A-EGFP reporter at 3’ of puromycin cassette in the pLKO.1_puro vector. Sequences for siRNA and shRNA can be found in Supplementary Table 2.
Quantitative RT-PCR
RNA was isolated using TRIzol reagent (Invitrogen) and Qiagen RNeasy Isolation Kit. The cDNA was reverse transcribed using SuperScript III (Invitrogen). Real-time PCR was performed in 20μl in SYBR Green reaction mix (Reaction Biology) on the CFX96 Real-Time System (Bio-Rad) with the following condition: 95°C for 10 min, 39 cycles of 95°C for 15s and 60 °C for 1min.
Monastrol washout and cellular phase separation assays
Monastrol wash-out, 1,6-Hexanediol treatment, and NH4OAc wash-out were conducted 24 hours after Borealin or MLL1 siRNA transfection. For monastrol wash-out experiment, cells were treated with 200 μM monastrol for 1 hour and released into fresh medium with 10 μM MG-132 for 90 min before fixation. For 1,6-Hexanediol treatment, cells were arrested in metaphase using 1 μg/mL nocodazole and exposed to different concentration of 1,6-Hexanediol for 60 seconds. For NH4OAc wash-out experiment, cells were blocked in metaphase by 10 μM MG-132 for 15 min, followed by treatment of 90mM NH4OAc for 2 min. Cells were recovered in fresh medium for 30 or 120 seconds before fixation.
Fluorescence recovery after photobleaching (FRAP)
Cells were plated in the 8-well imaging chamber (μ-Slide, Ibidi) at 37 °C with 5% CO2 on the stage under LSM780 AxioObserver.Z1 inverted confocal microscope (Zeiss) or SP8 inverted confocal microscope (Leica). Imaging was captured under 63x oil objective. Individual centromeres were imaged by successive acquisition of 2.5-mm volumes at 0.5mm per step along the z axis with a zoom factor of 10. Centromeres were bleached by twenty iterations of a full power laser. The recovery was monitored every 3 sec till 2 min post bleaching. Fluorescence intensities were analyzed using ImageJ with the Plugin package from Stowers Institute59. After background subtraction, mean intensity of the region prior to photobleaching was set at 100%. Time constant was obtained by fitting individual FRAP curves60.
Flow cytometry analysis
Cells were treated with trypsin, washed with PBS and fixed in 70% ice-cold ethanol for 16 hrs. After washing with 0.1% Triton X-100/PBS (PBST0.1), cells were incubated with MPM2 antibody (Millipore 05-368) in PBST0.1 (final concentration of 5 μg/mL) for 1 hour on ice, followed by incubation with goat anti-rabbit Alexa 488 (Thermo Fisher Scientific, 1:500) for 1 hour in the dark. After RNase A treatment, DNA was stained with propidium iodide and measured on Attune NxT Flow Cytometer. Data was collected with Attune Cytometric Software (version 3.1) and processed using Floreada (floreada.io). Example of gating strategy is provided in the Supplementary Figure 1.
Meta-analysis for TCGA and DepMap datasets
RNA-seq data for MLL and Borealin along with clinical data were from the GDC Data Portal (portal.gdc.cancer.gov). The patient cohorts were divided to 50% quantiles. Pairwise Pearson correlation was performed using ggpubr package (v0.4.0) in R. Kaplan–Meier survival curves were conducted using the survival package (v3.1) in R. Meta-analysis on five individual GEO datasets (GSE57957, GSE22058, GSE25097, GSE76297 and GSE112790) 34–38 using the R package Limma61. The mean value, standard deviation and sample size of each dataset were calculated and imported into the function metacont in ‘meta’62 to obtain Standardized Mean Differences (SMDs). SMDs and the 95% confidential intervals (CIs) were displayed on forest plots. Heterogeneity across the studies was assessed using the chi-squared test of Q and the I2 statistic and the random-effects model was used for the pooling process. Gene dependency analysis was performed via DepMap portal (http://DepMap.org/portal) by specifying the CRISPR scores (DepMap Public 22Q4+ Score, Chronos) of each epigenetic regulator gene and the expression level (Expression Public 22Q4) of each cell-cycle gene in all cell lines. For Fig. 6a, Extended Fig. 8a–c, and Supplementary Table 7, the correlation coefficiency scores and P values were directly retrieved from DepMap data portal without further processing.
Cell proliferation assay and crystal violet staining
Cells were seeded in triplicate at 2 x 10⁴ cells/mL in the 6-well plates and cell counts were acquired by TC10 Automated Cell Counter (Bio-Rad). Trypan blue was used to exclude non-viable cells. For crystal violet staining, cells were washed to remove culture media and directly stained using buffer containing 0.05% crystal violet, 1% Formaldehyde, 1% methanol, 1X PBS for 20 min at RT.
Xenograft model for HCC
A balanced cohort of male and female six-week-old immunocompromised nude mice (NCI Athymic NCr- nu/nu) (Charles River Laboratories, Inc) were utilized for the Xenograft models. HCC cells transduced with lentiviral pLKO.1_P2G-based control or MLL1 shRNAs were mixed with Matrigel Basement Membrane matrix (6:4 vol/vol, Corning) and subcutaneously transplanted into the flanks of nude mice. Tumor growth was monitored using IVIS Spectrum Imaging System (PerkinElmer). GFP signals in tumors were acquired with Epi-Illumination and processed by Living Image Software (PerkinElmer). Tumor volume was calculated using the formula: Volume = (width)2 x length / 2 where length represents the largest tumor diameter and width represents the perpendicular tumor diameter. Mice were euthanized humanely at the study end points. Tumor specimens were dissected and fixed in 4% formalin for 24 hours and stored in 70% ethanol. Paraffin embedding and hematoxylin and eosin (HE) staining were performed at USC School of Pharmacy Histology Core Facility. HCC tumor identity and grades were confirmed by certificated pathologist.
Human tissue microarray and immunohistochemistry
Patient derived Tissue MicroArray (TMA) slides were directly purchased from and processed by US Biomax, Inc. The slides include 176 cases (43 females and 133 males) of human HCC and 8 cases (3 females and 5 males) of normal hepatic tissues. The age of the patients ranges from 18 to 76 years old (median age 49). For immunohistochemistry, tissue sections were deparaffinized and antigen retrieved. The slide was blocked with normal goat serum for 20 min at RT and incubated with primary antibodies overnight at 4°C. The primary antibodies include: anti-MLL1 (A300-086, Bethyl Laboratories, 1:100) 63, anti-Borealin (PA5-55771, ThermoFisher, 1:200). After incubation with biotinylated secondary antibody, the slides were developed by incubating with streptavidin–horseradish peroxidase conjugates for 20 min at 37 °C and addition of 3,3′-Diaminobenzidine (DAB) solution and countered with haematoxylin. Negative controls were processed similarly except no primary antibody. Tumors were graded on a scale of 0-3, based on percentage of immunoreactive tumor cells at 0%-10%, 11%-25%, 26%-75% and 76%-100%, respectively.
Statistics & Reproducibility
No statistical method was used to predetermine sample sizes. The sample sizes used in this study were chosen based on experience and are similar to those reported in previous publications21,60,64. No data were excluded from the analyses. For all experiments where applicable, samples/mice were randomly allocated into different control/treatment groups. The investigators were not blinded to allocation during experiments and outcome assessment. Data distribution was assumed to be normal but this was not formally tested. All values for n refer to biological replicates. Statistical analyses including Pearson correlation, log-rank, two-tailed student’s t-test, one-way ANOVA, and Fisher’s exact test were carried out using Prism 8 (GraphPad). Single-tailed F-test was carried out using Excel. The p-value of less than 0.05 was considered significant.
Extended Data
Extended Data Fig. 1 |.
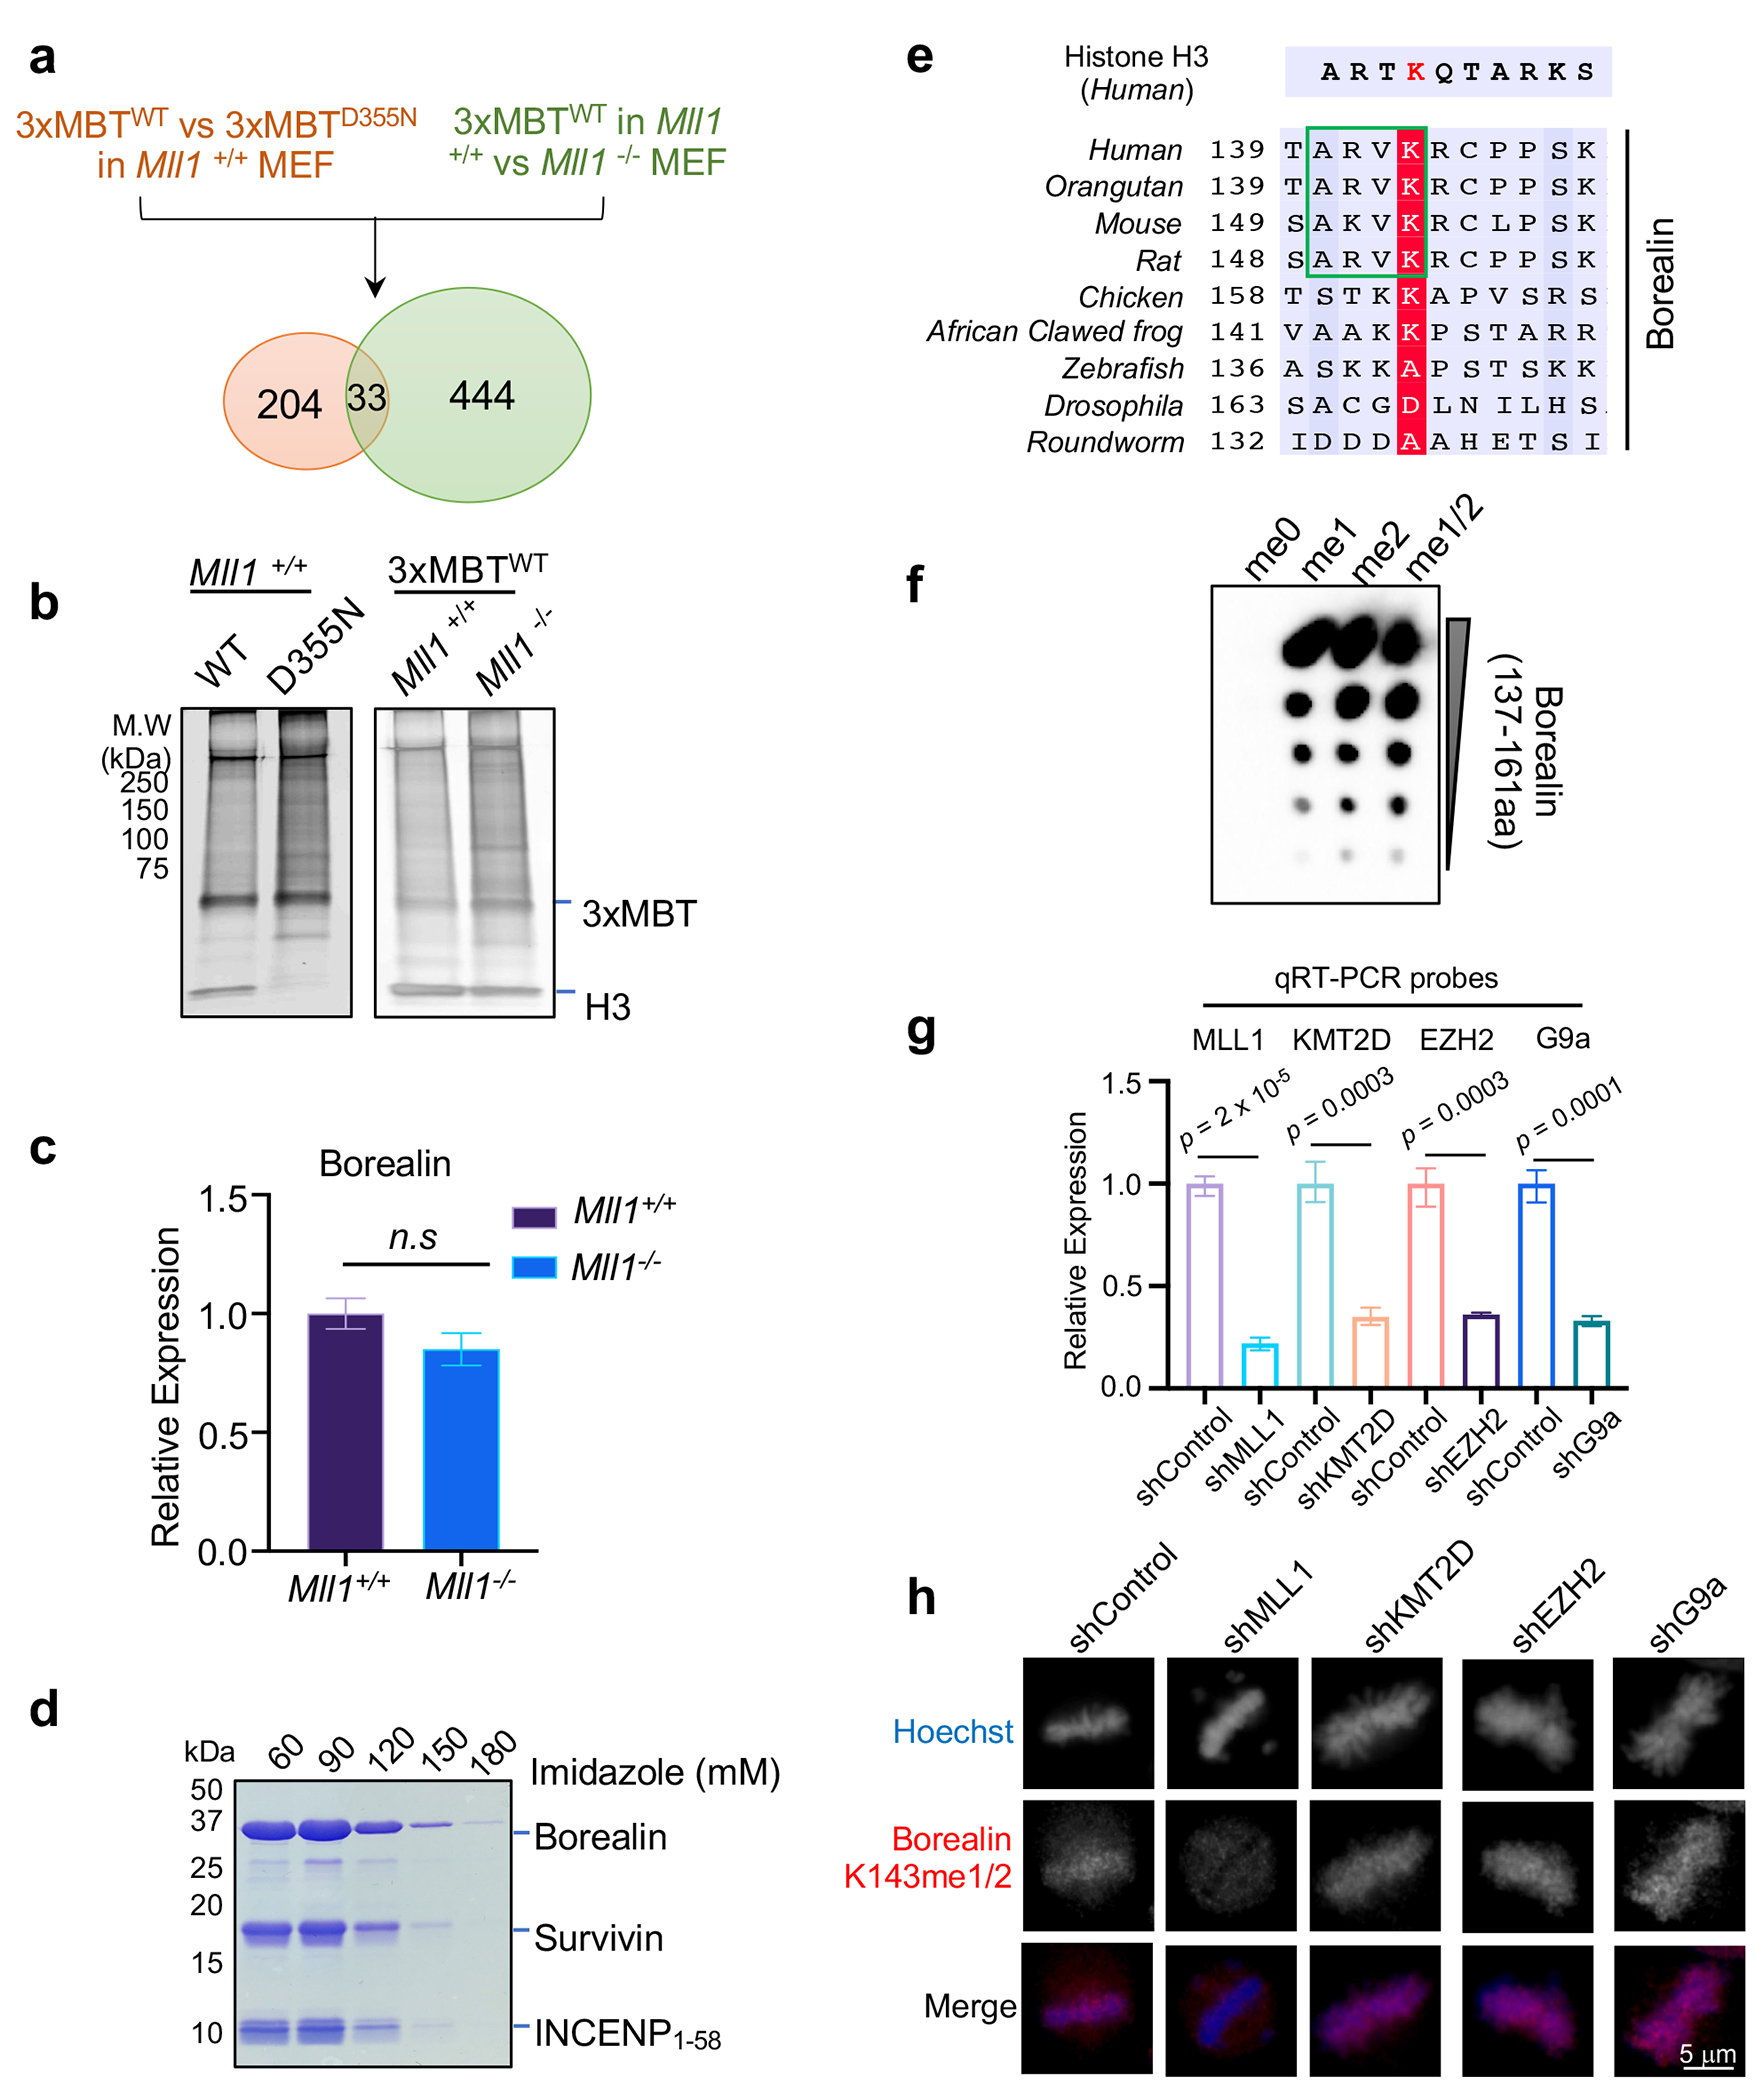
Borealin is a specific non-canonical substrate for MLL1
Extended Data Fig. 2 |.
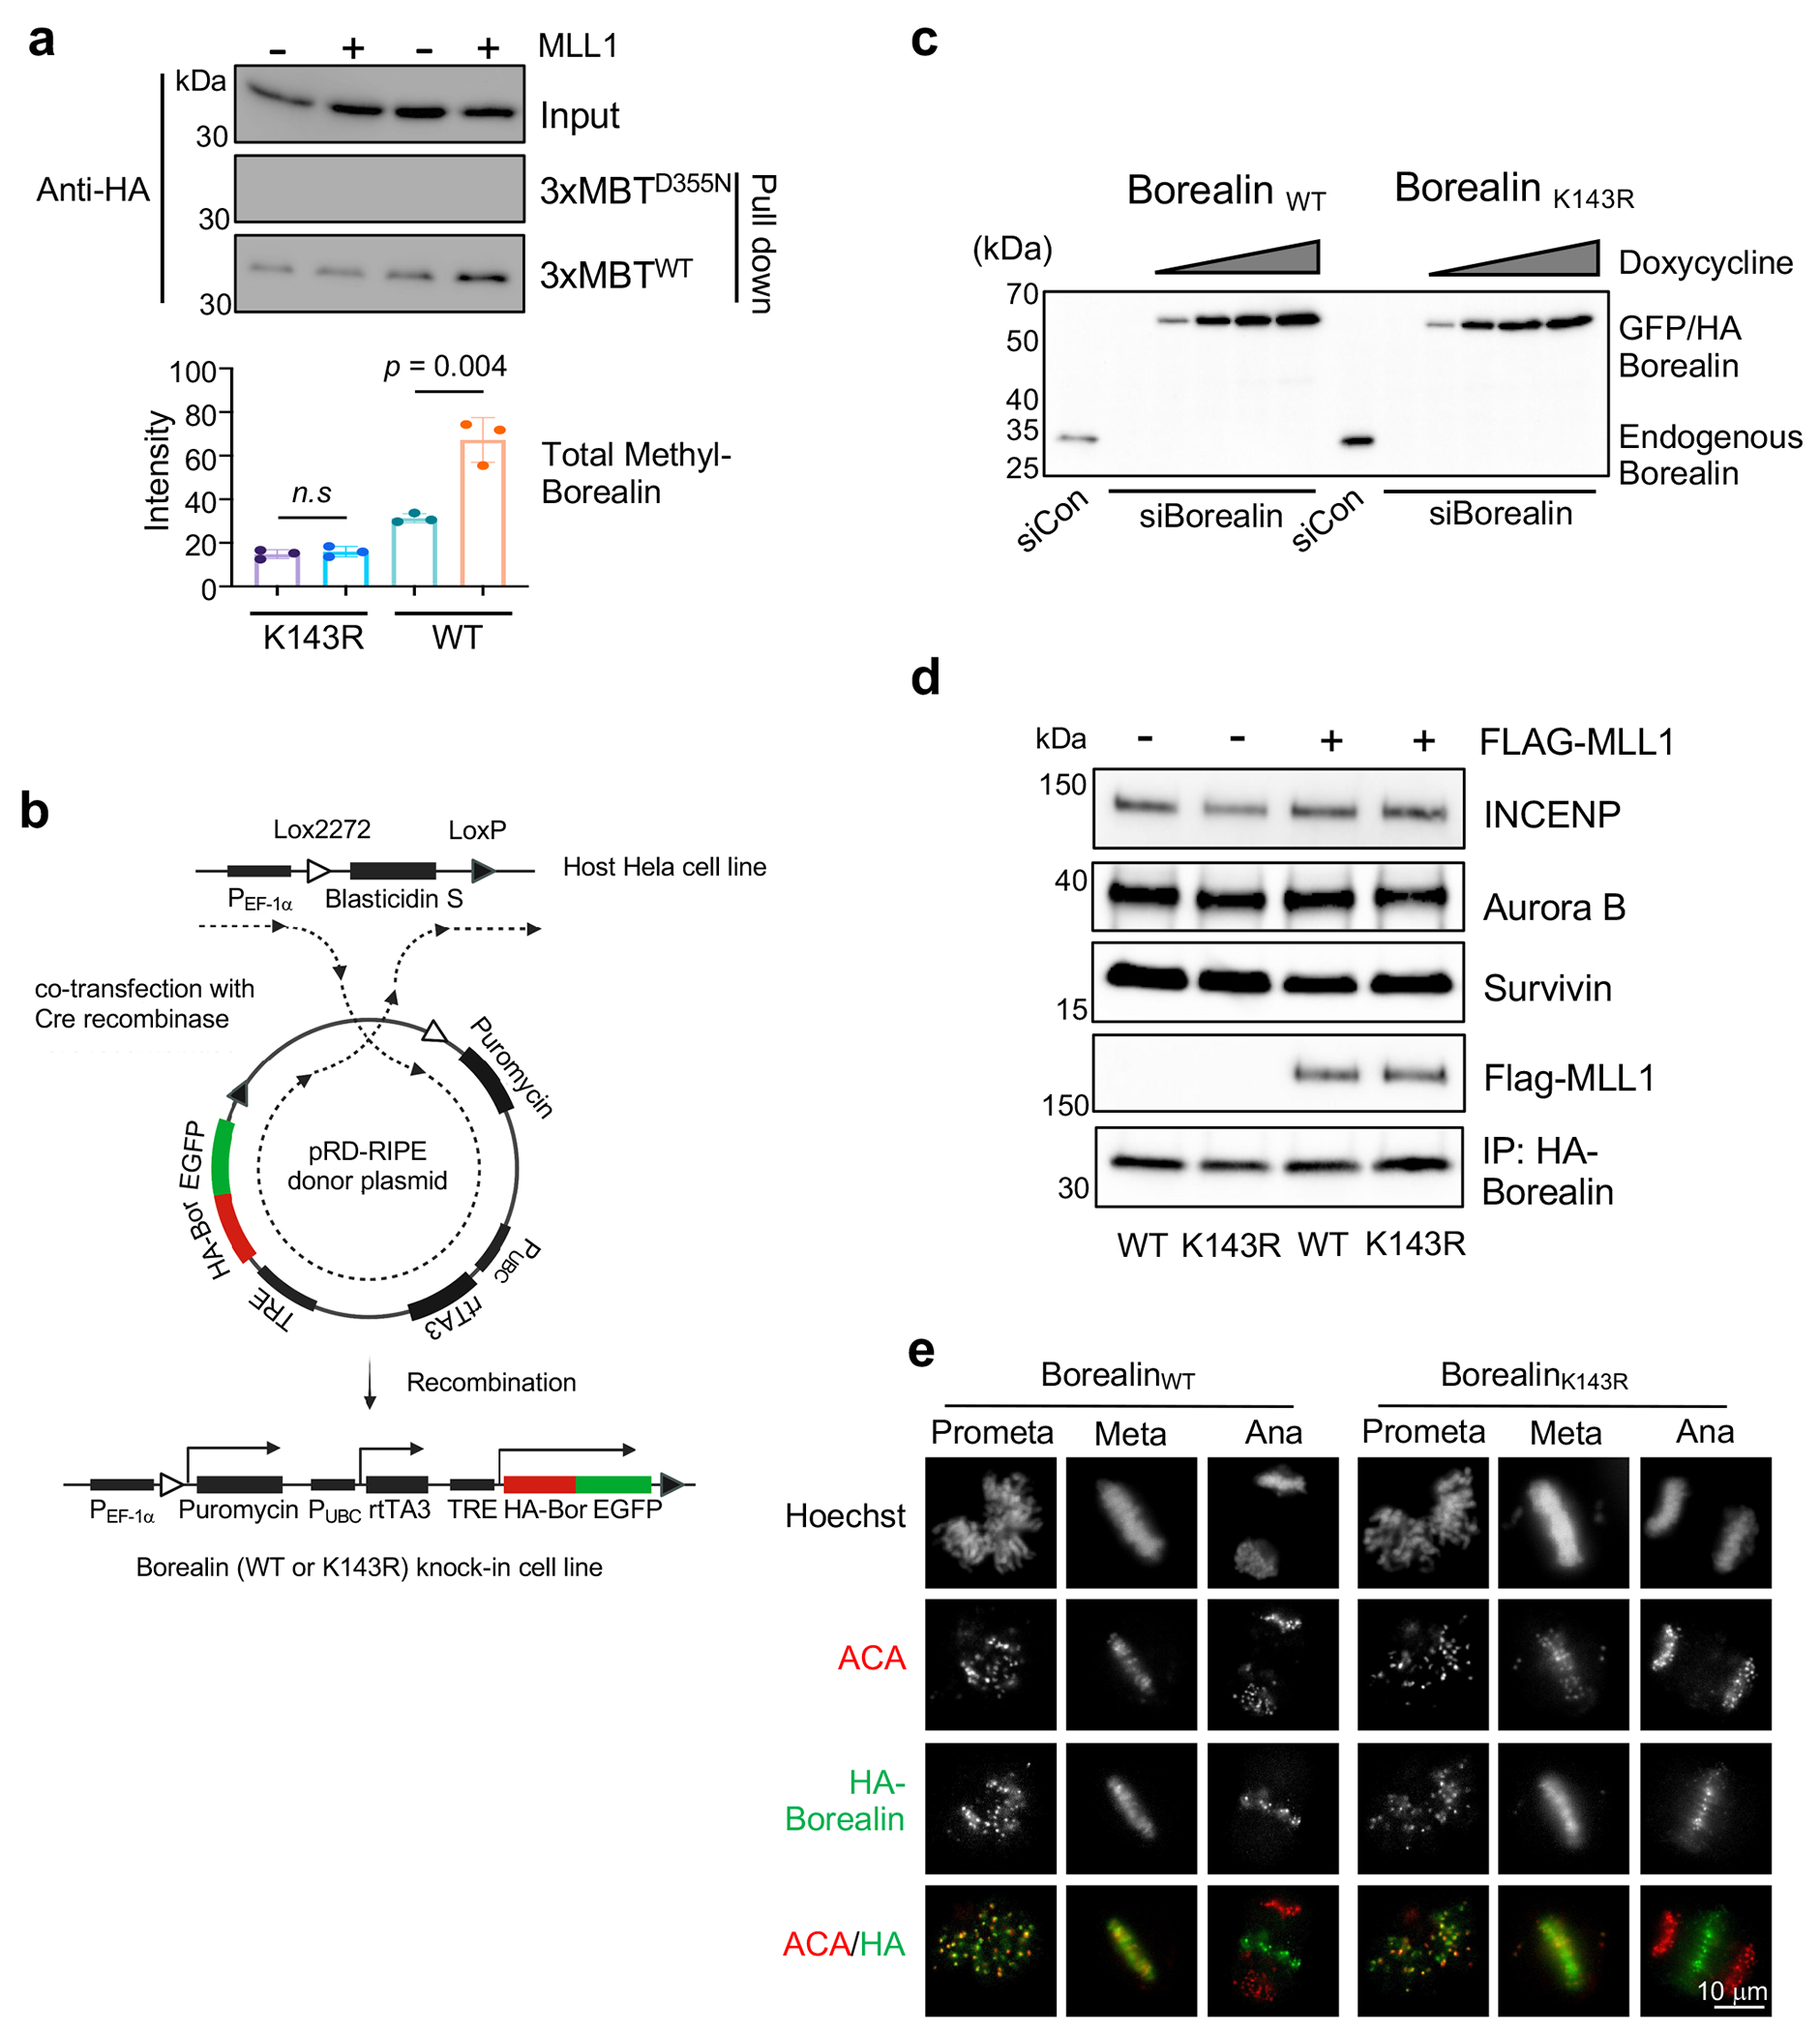
Establishing the WT and K143R Borealin HeLa cell lines
Extended Data Fig. 3 |.
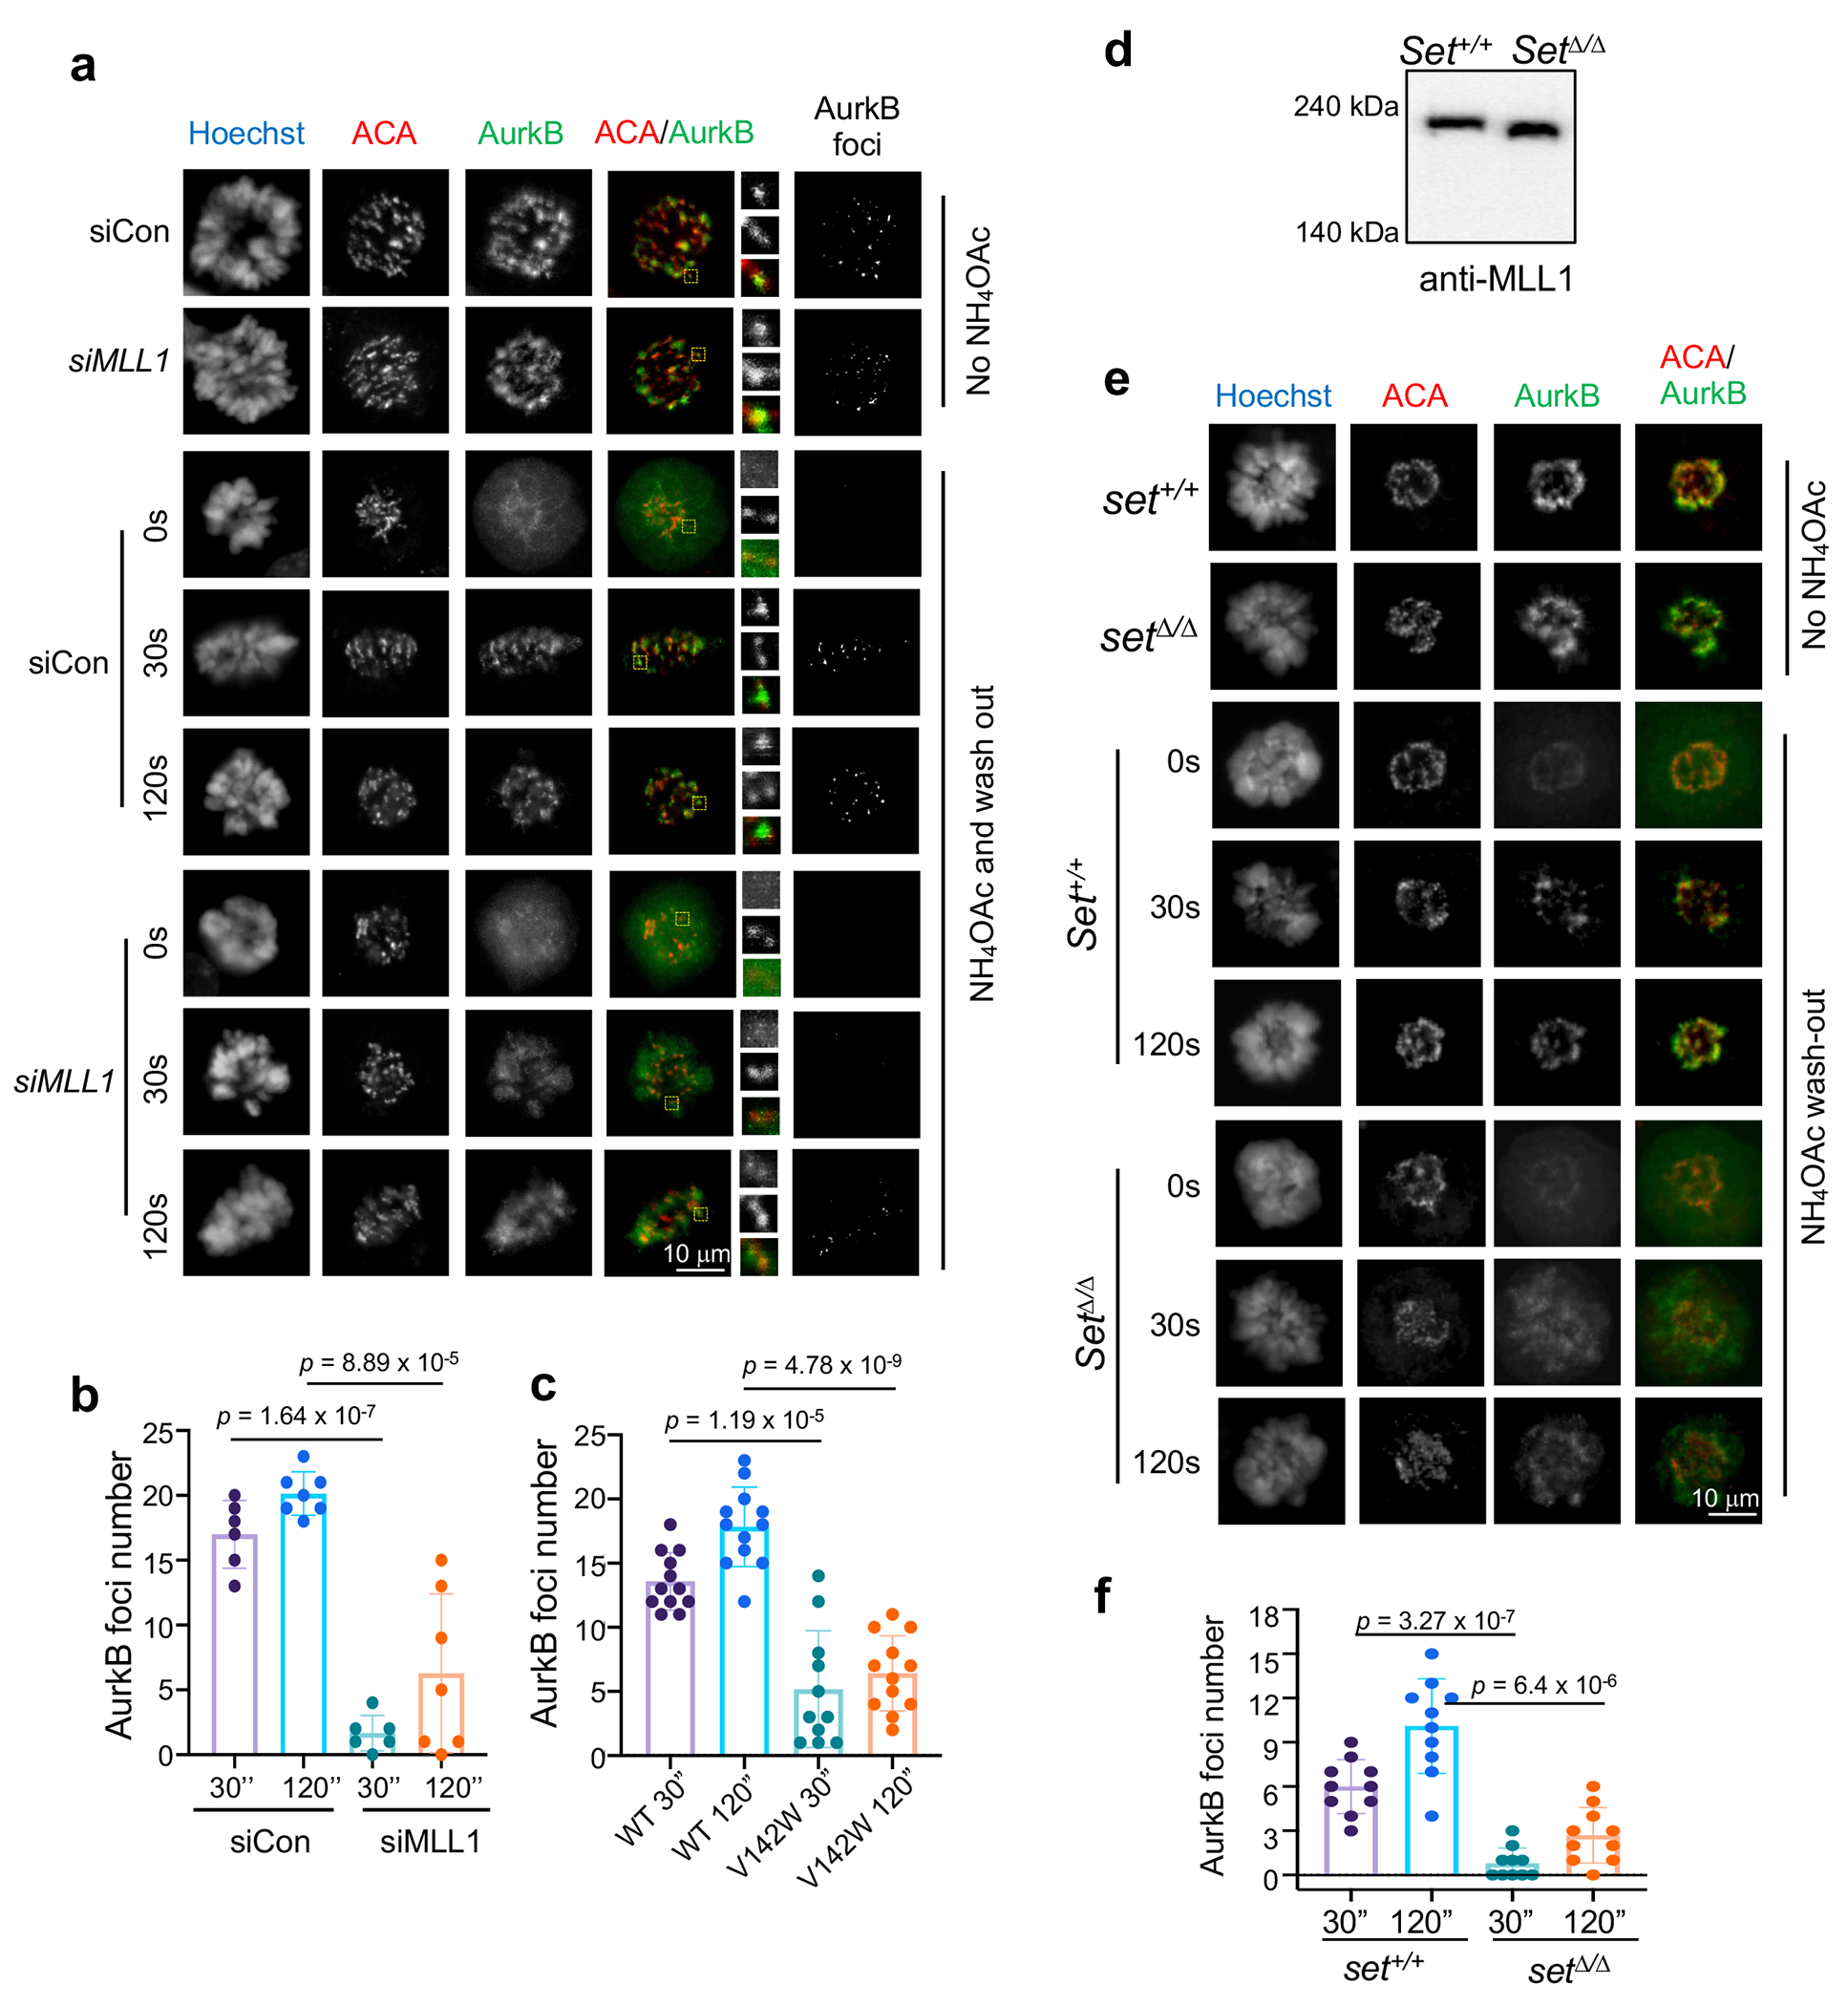
MLL1 regulates CPC phase separation
Extended Data Fig. 4 |.
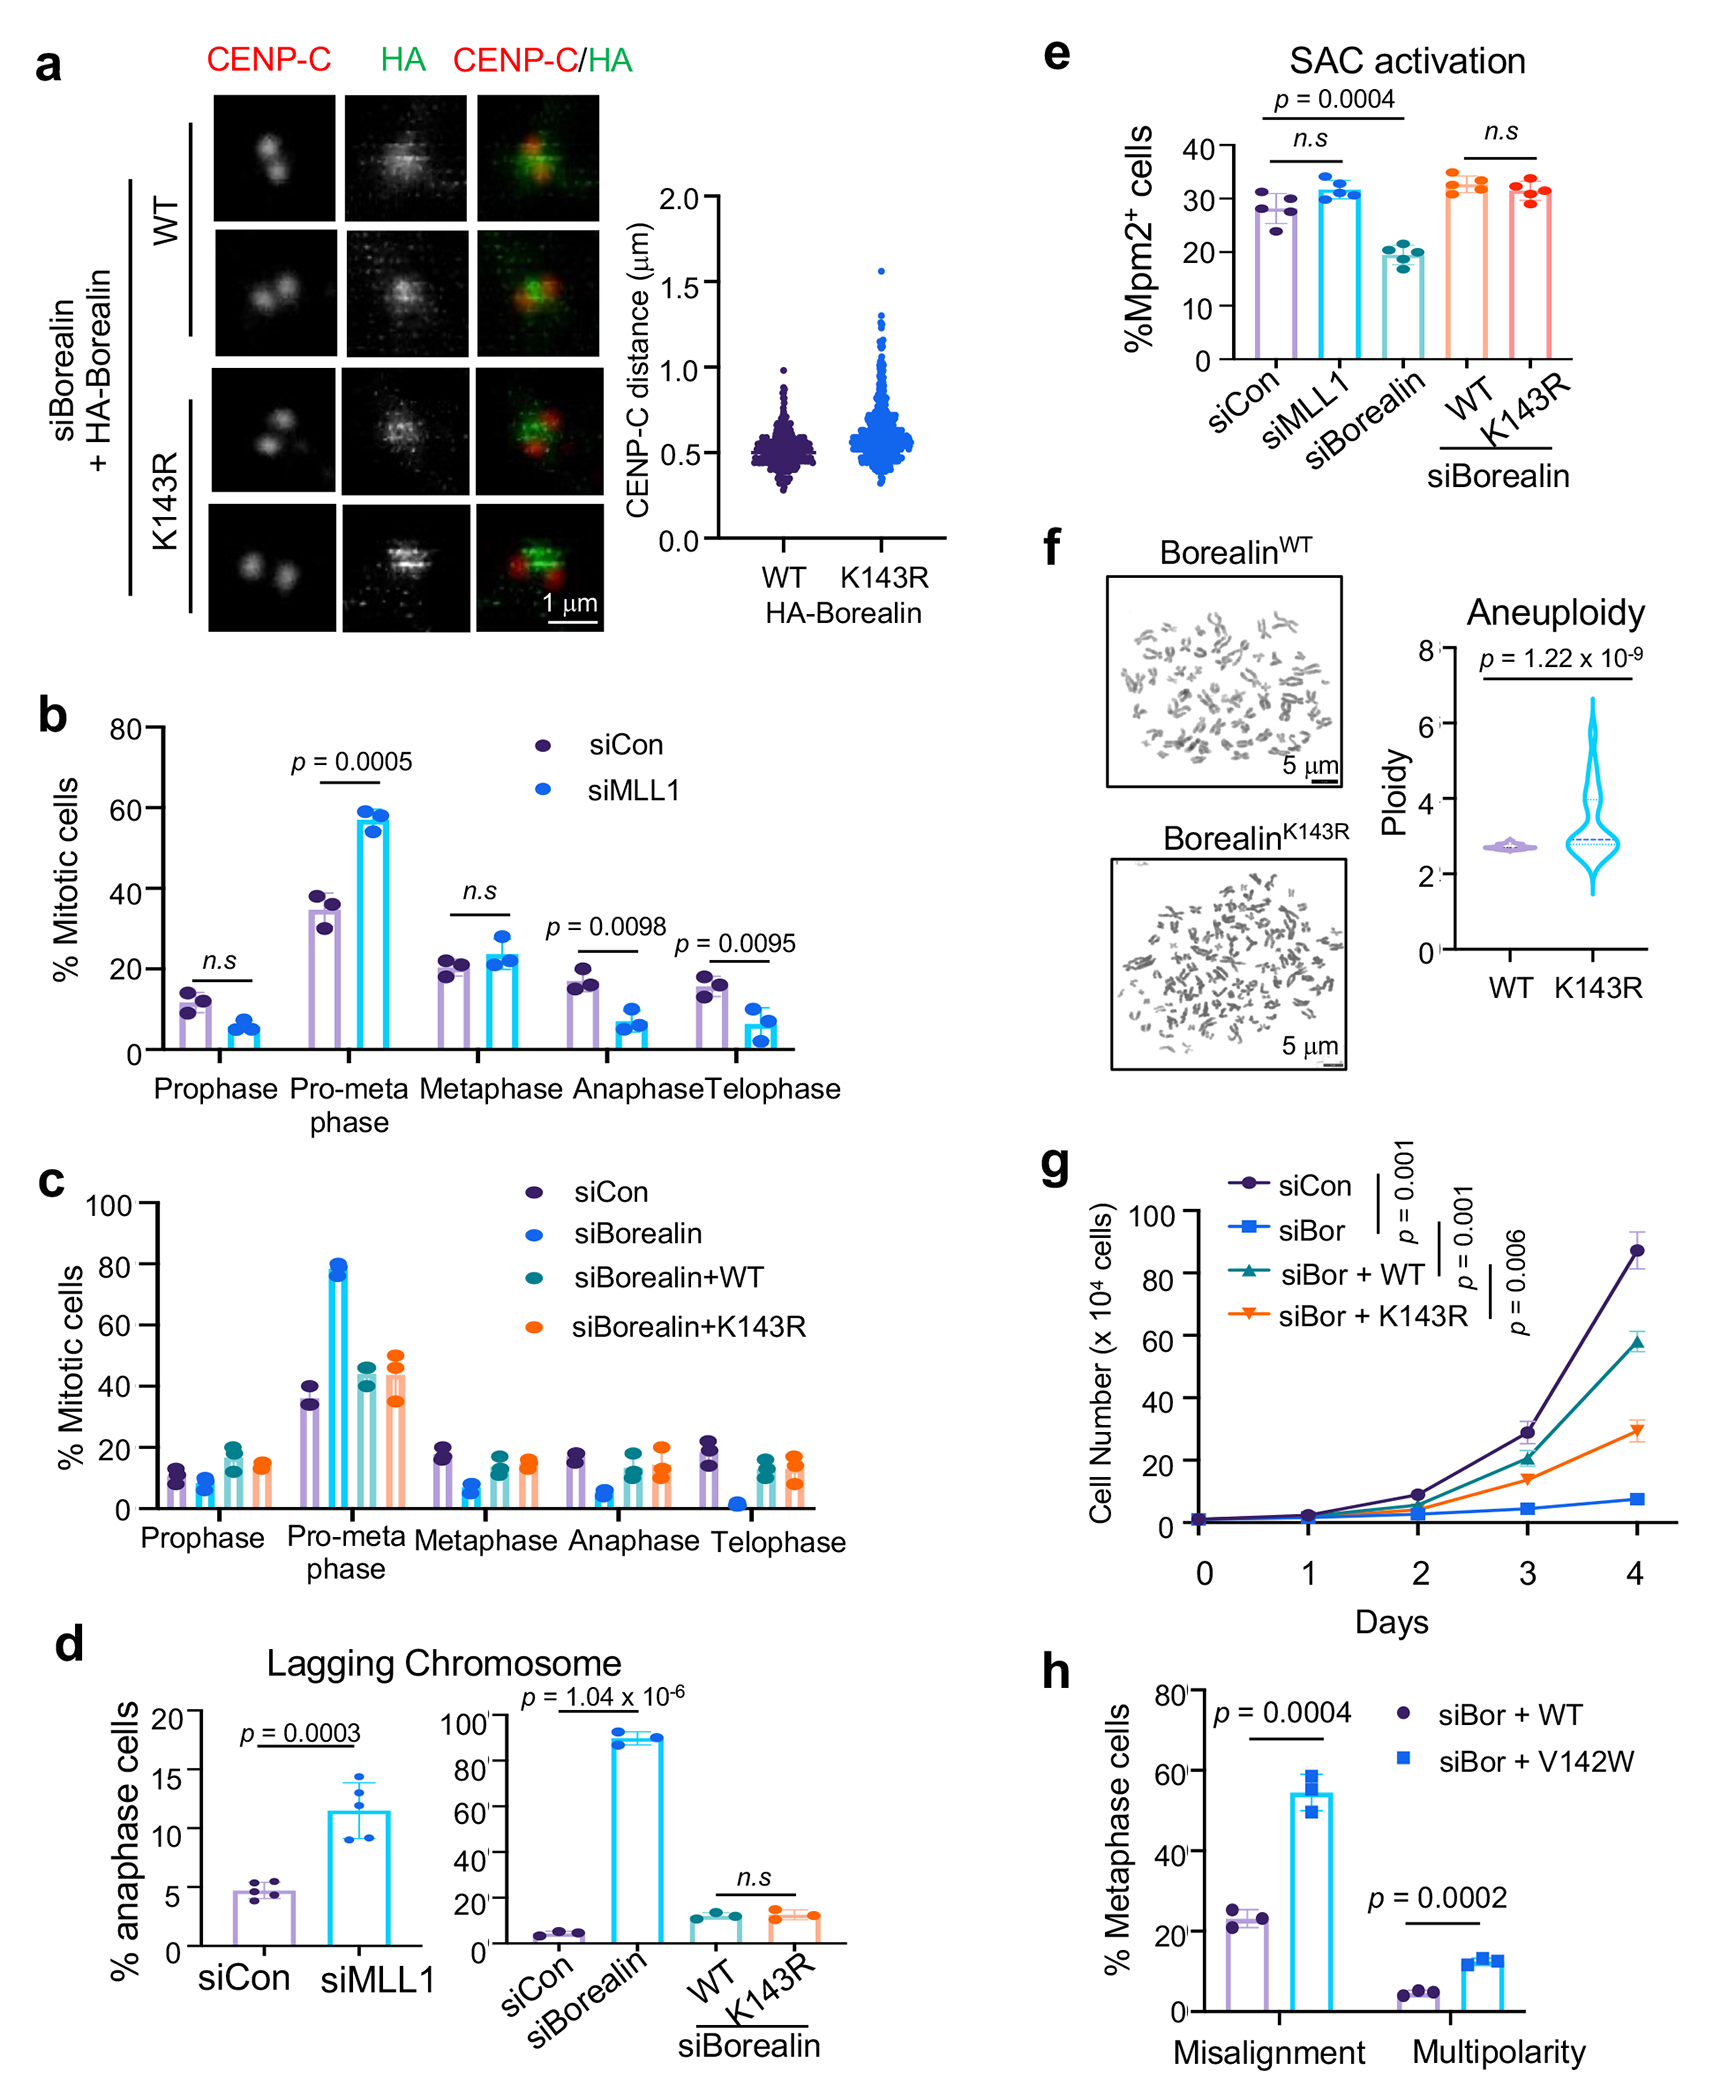
Borealin K143 methylation by MLL1 plays specific roles in faithful mitosis
Extended Data Fig. 5 |.
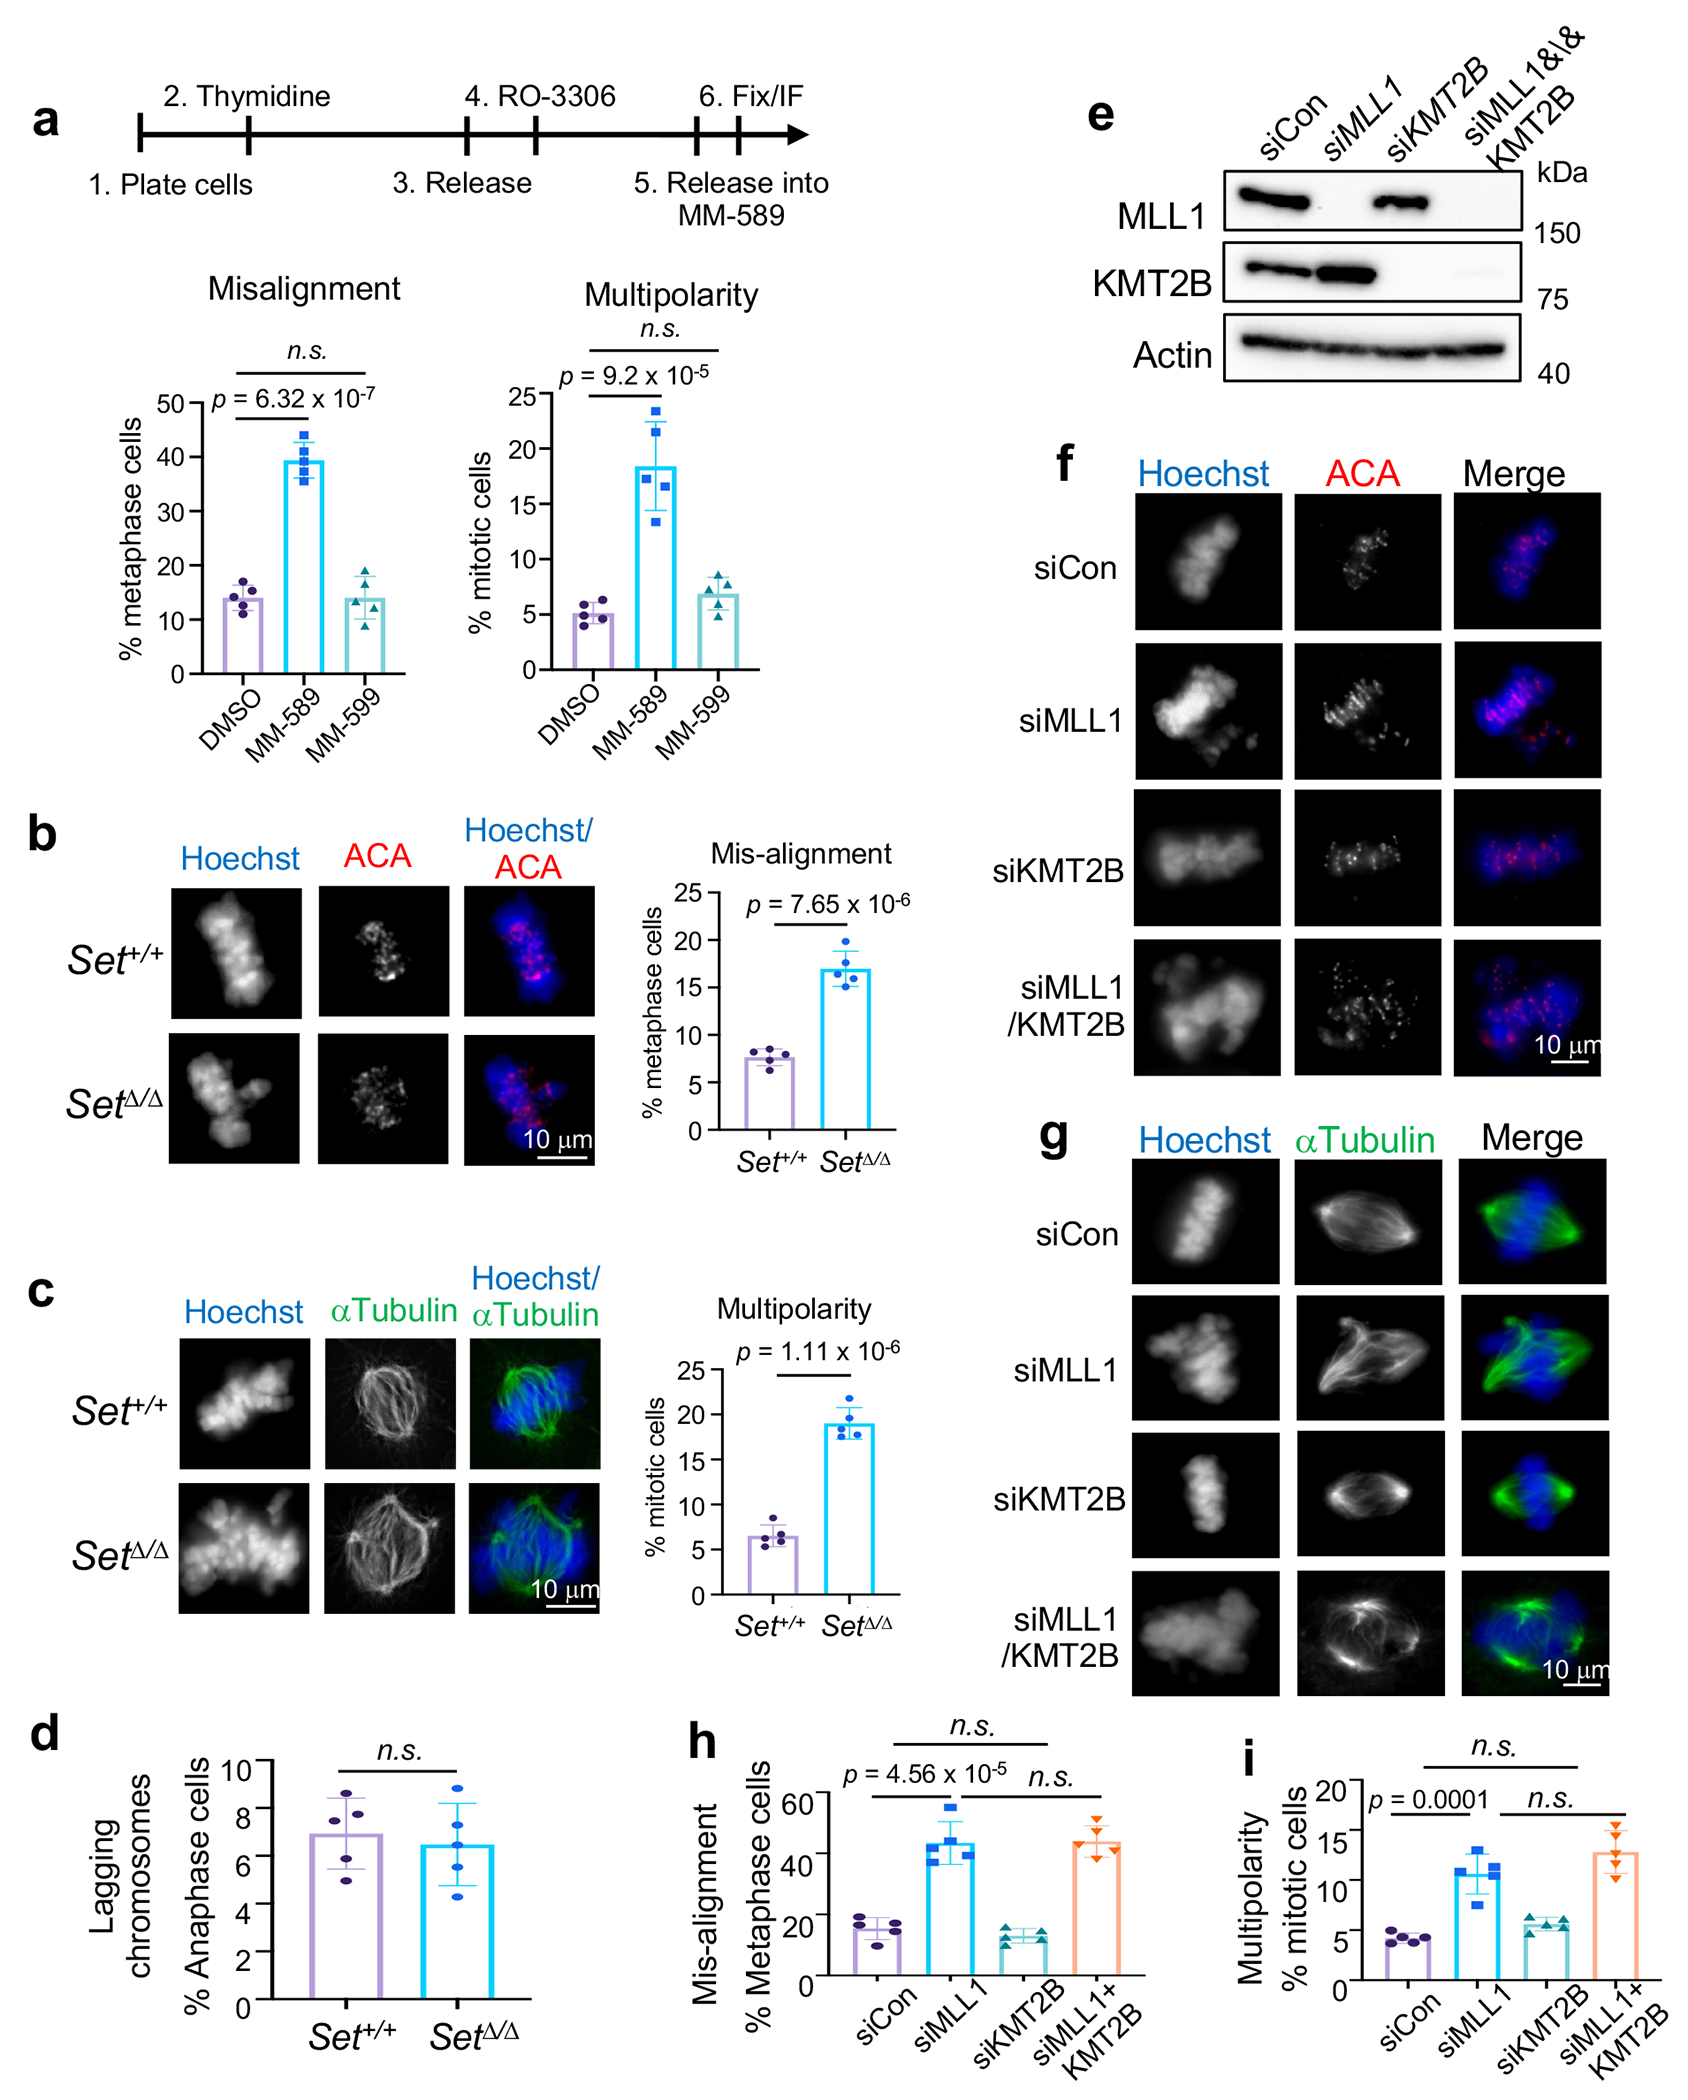
MLL1 and its methyltransferase activity are indispensable for faithful mitosis
Extended Data Fig. 6 |.
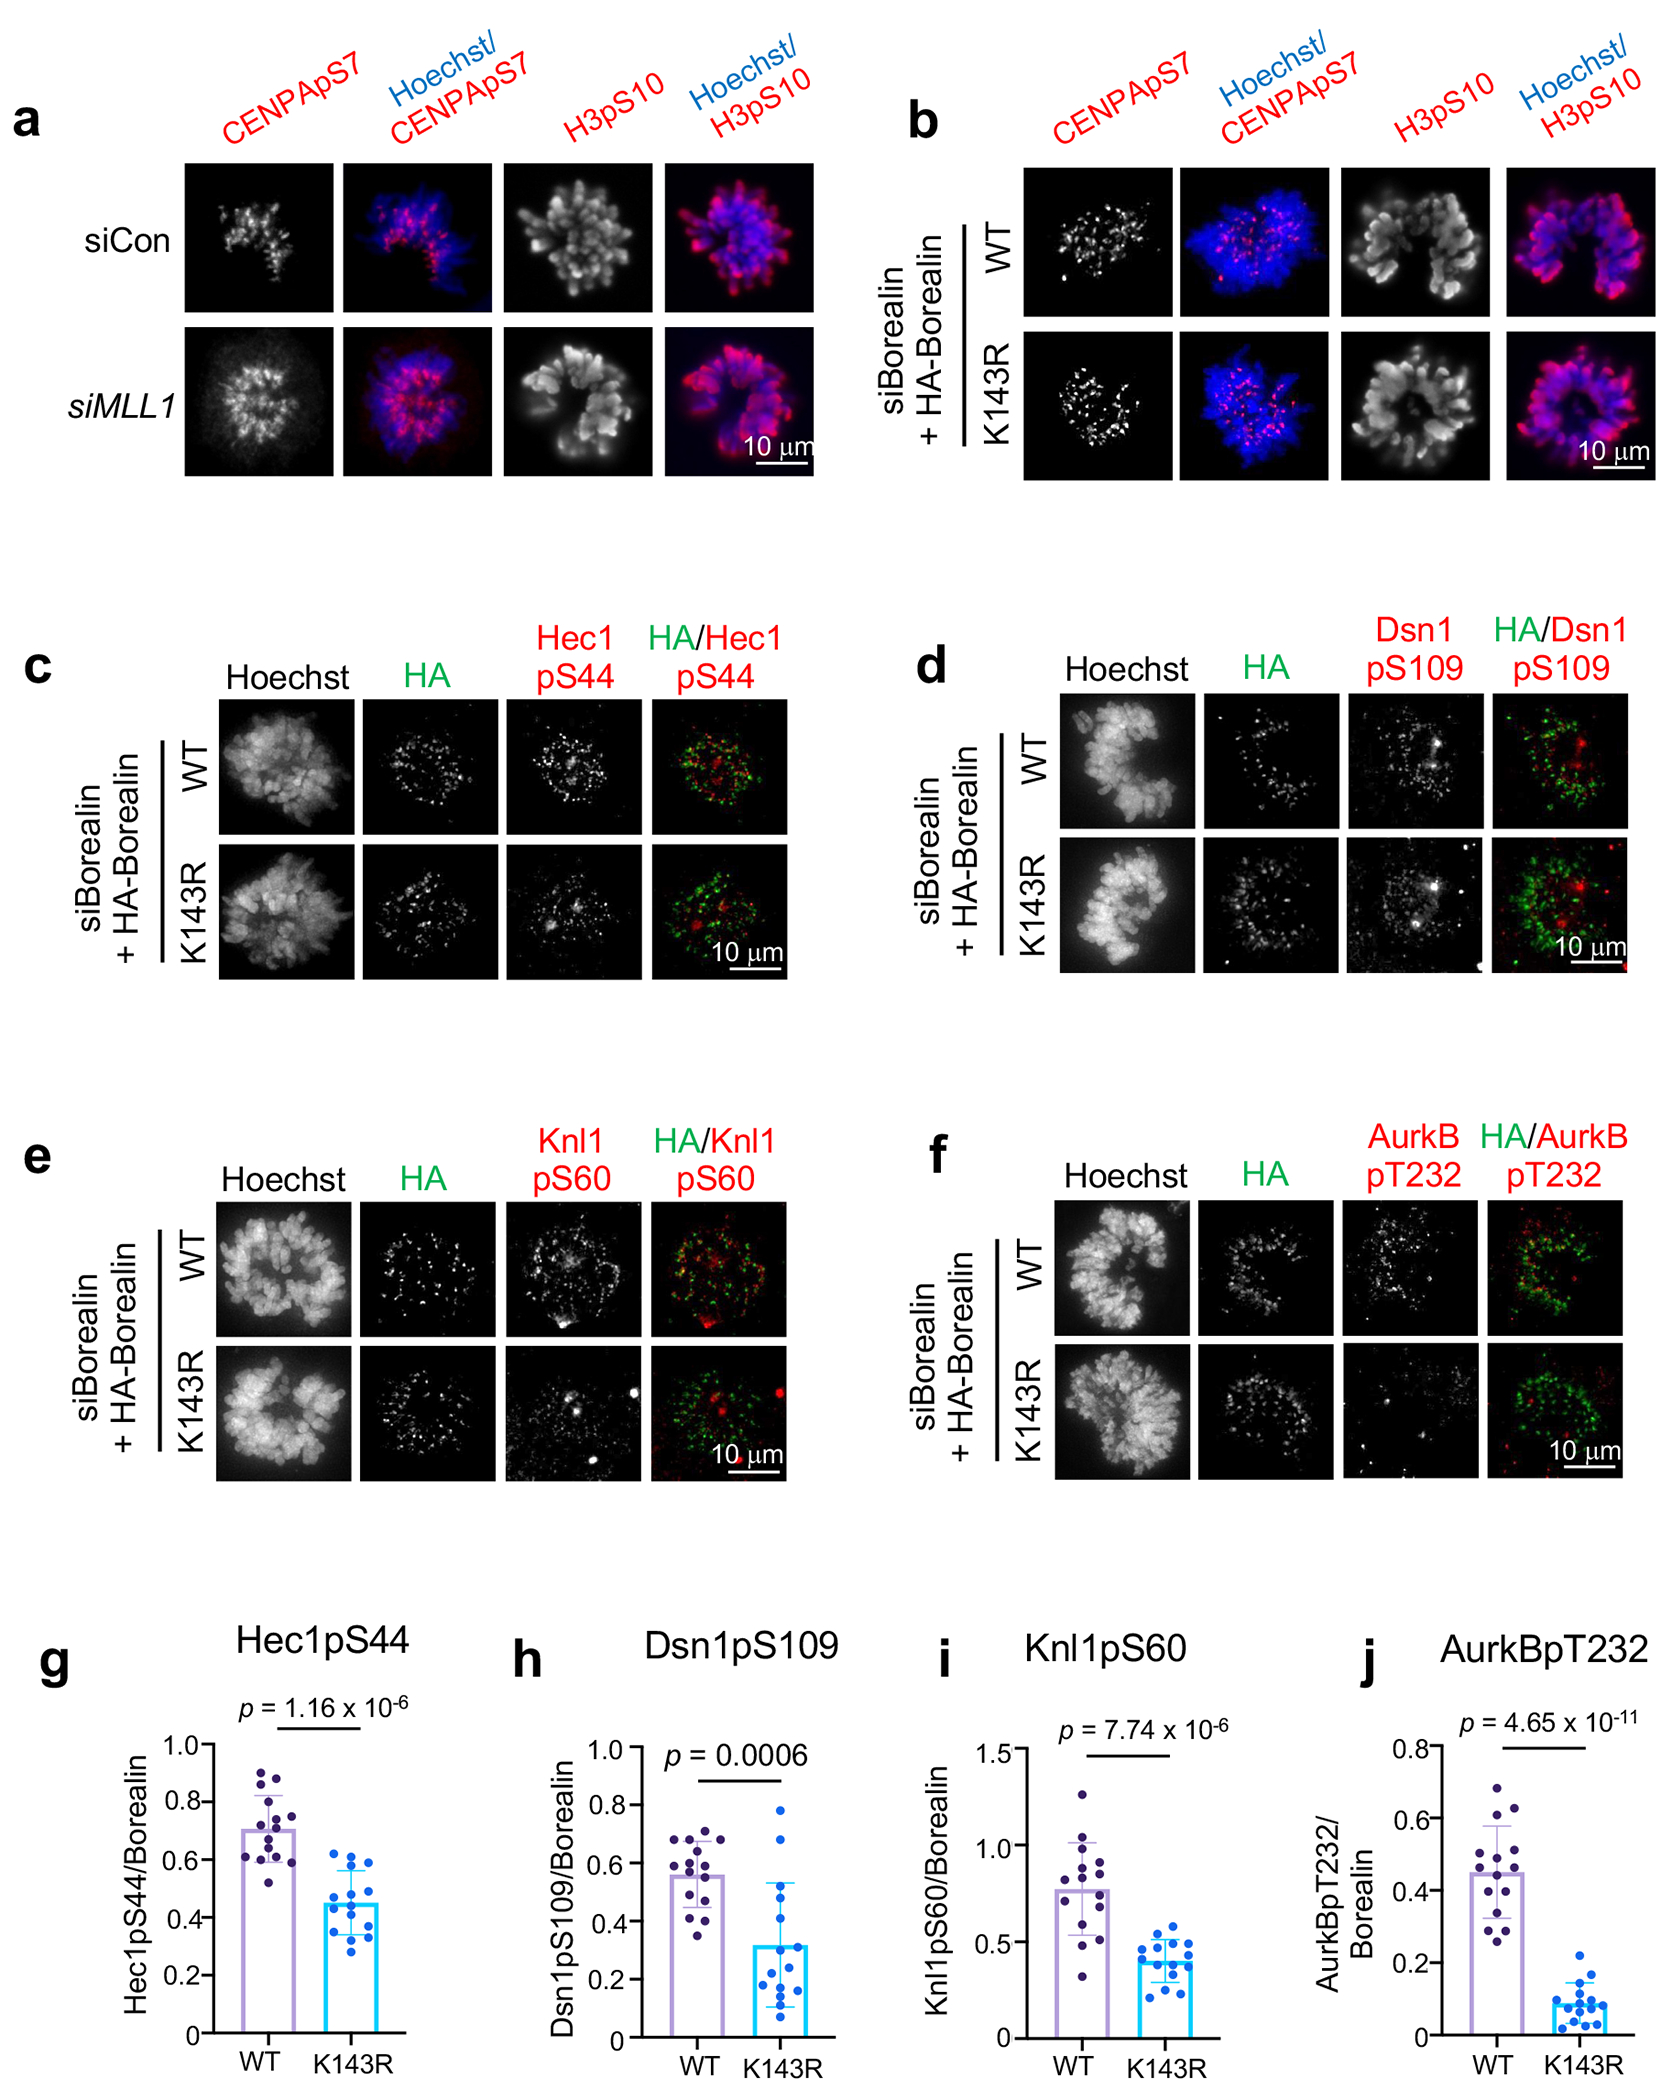
Borealin K143 methylation regulates AurkB activity at kinetochores
Extended Data Fig. 7 |.
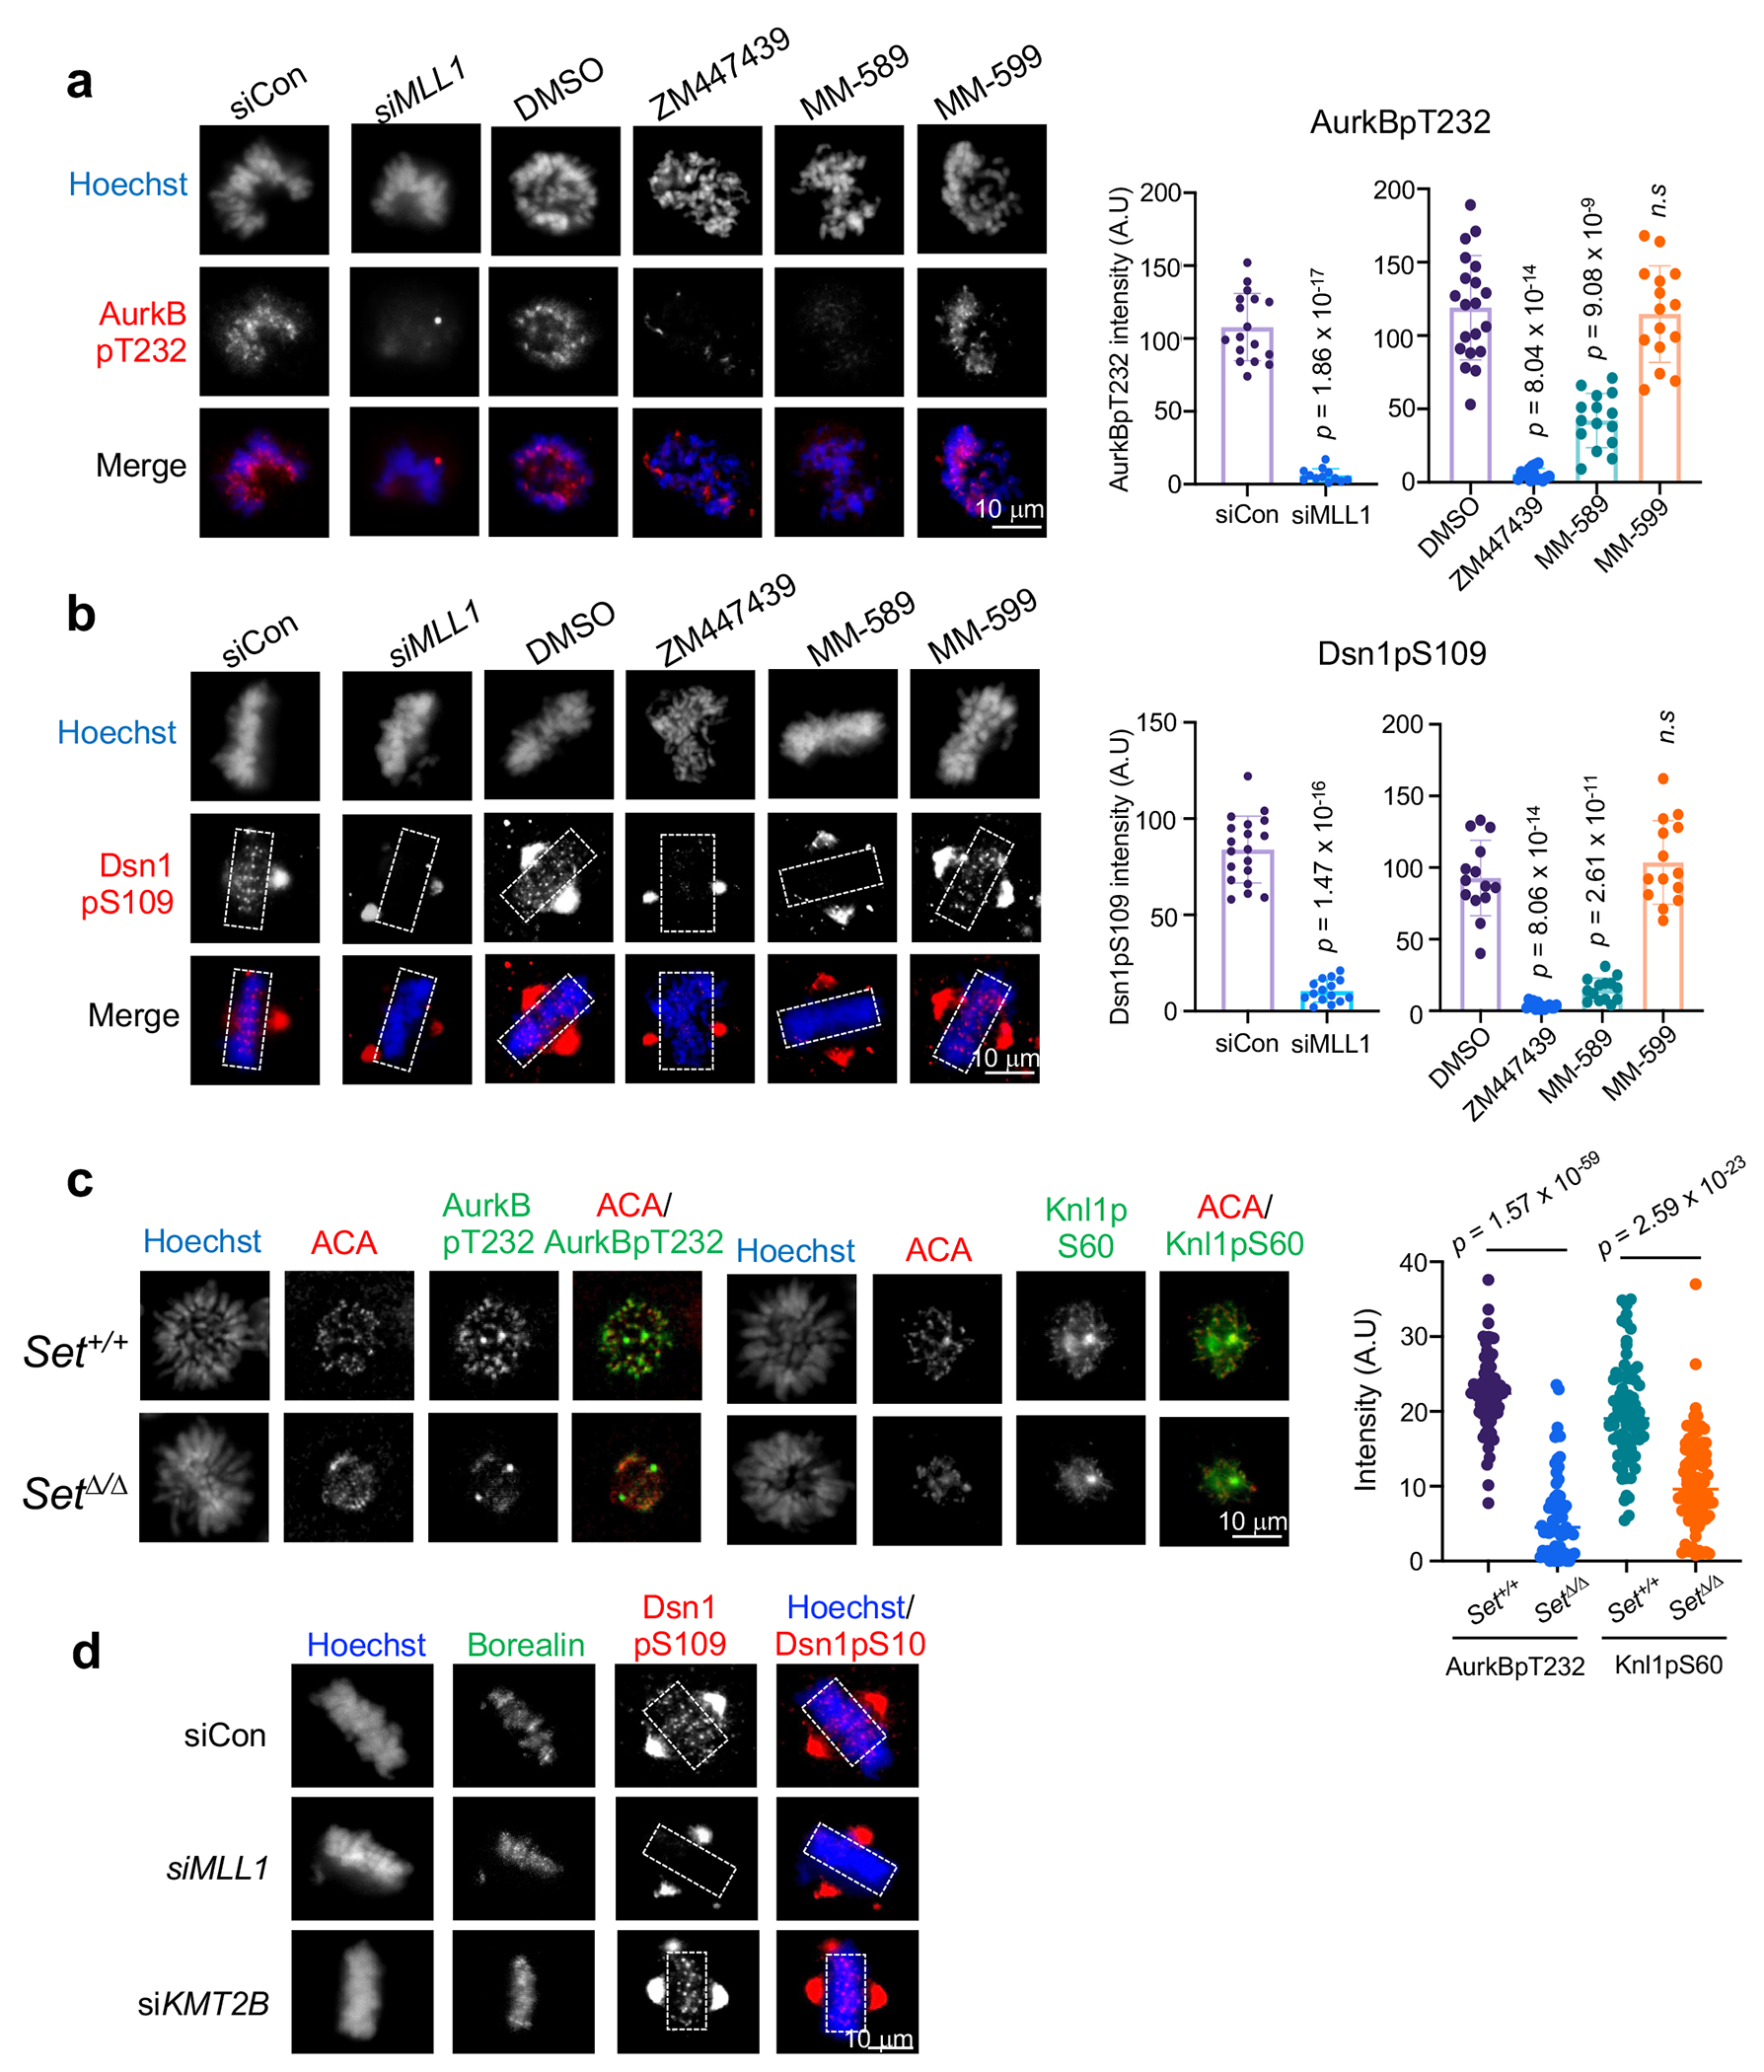
MLL1 enzymatic activity is required for AurkB kinase activity at kinetochores
Extended Data Fig. 8 |.
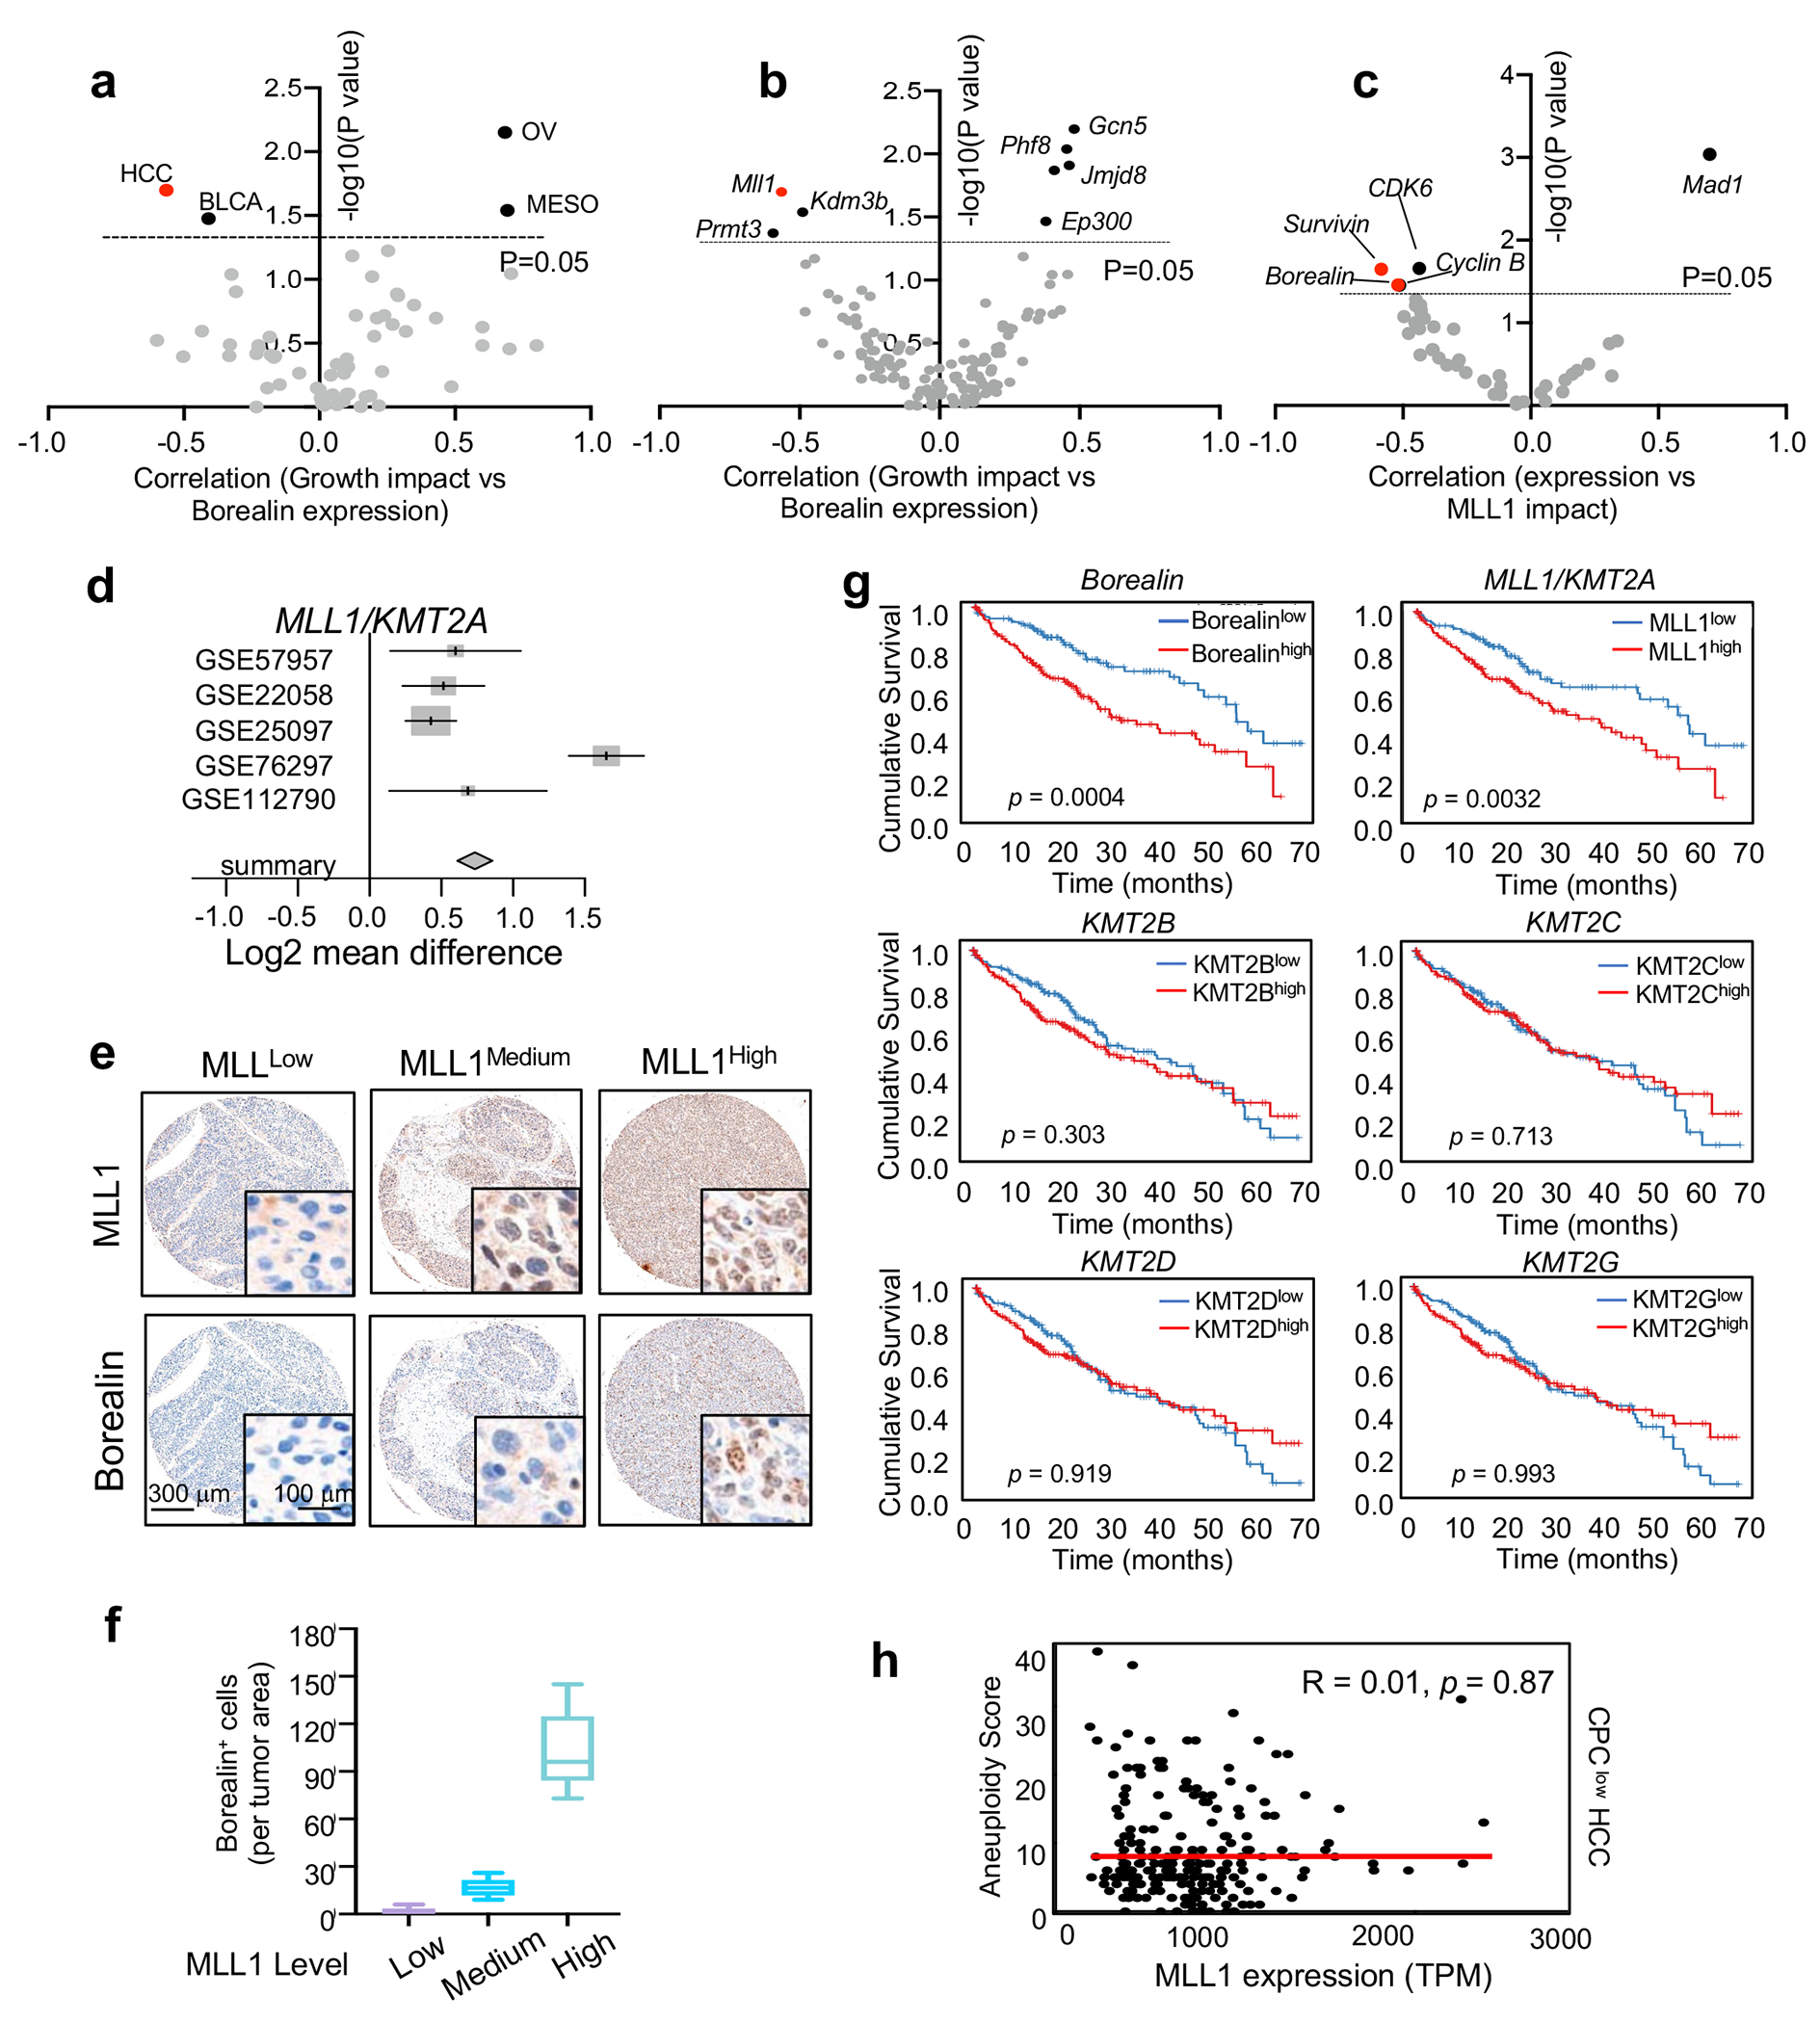
MLL1 has potential functional interplay with Borealin in CPChigh HCC
Extended Data Fig. 9 |.
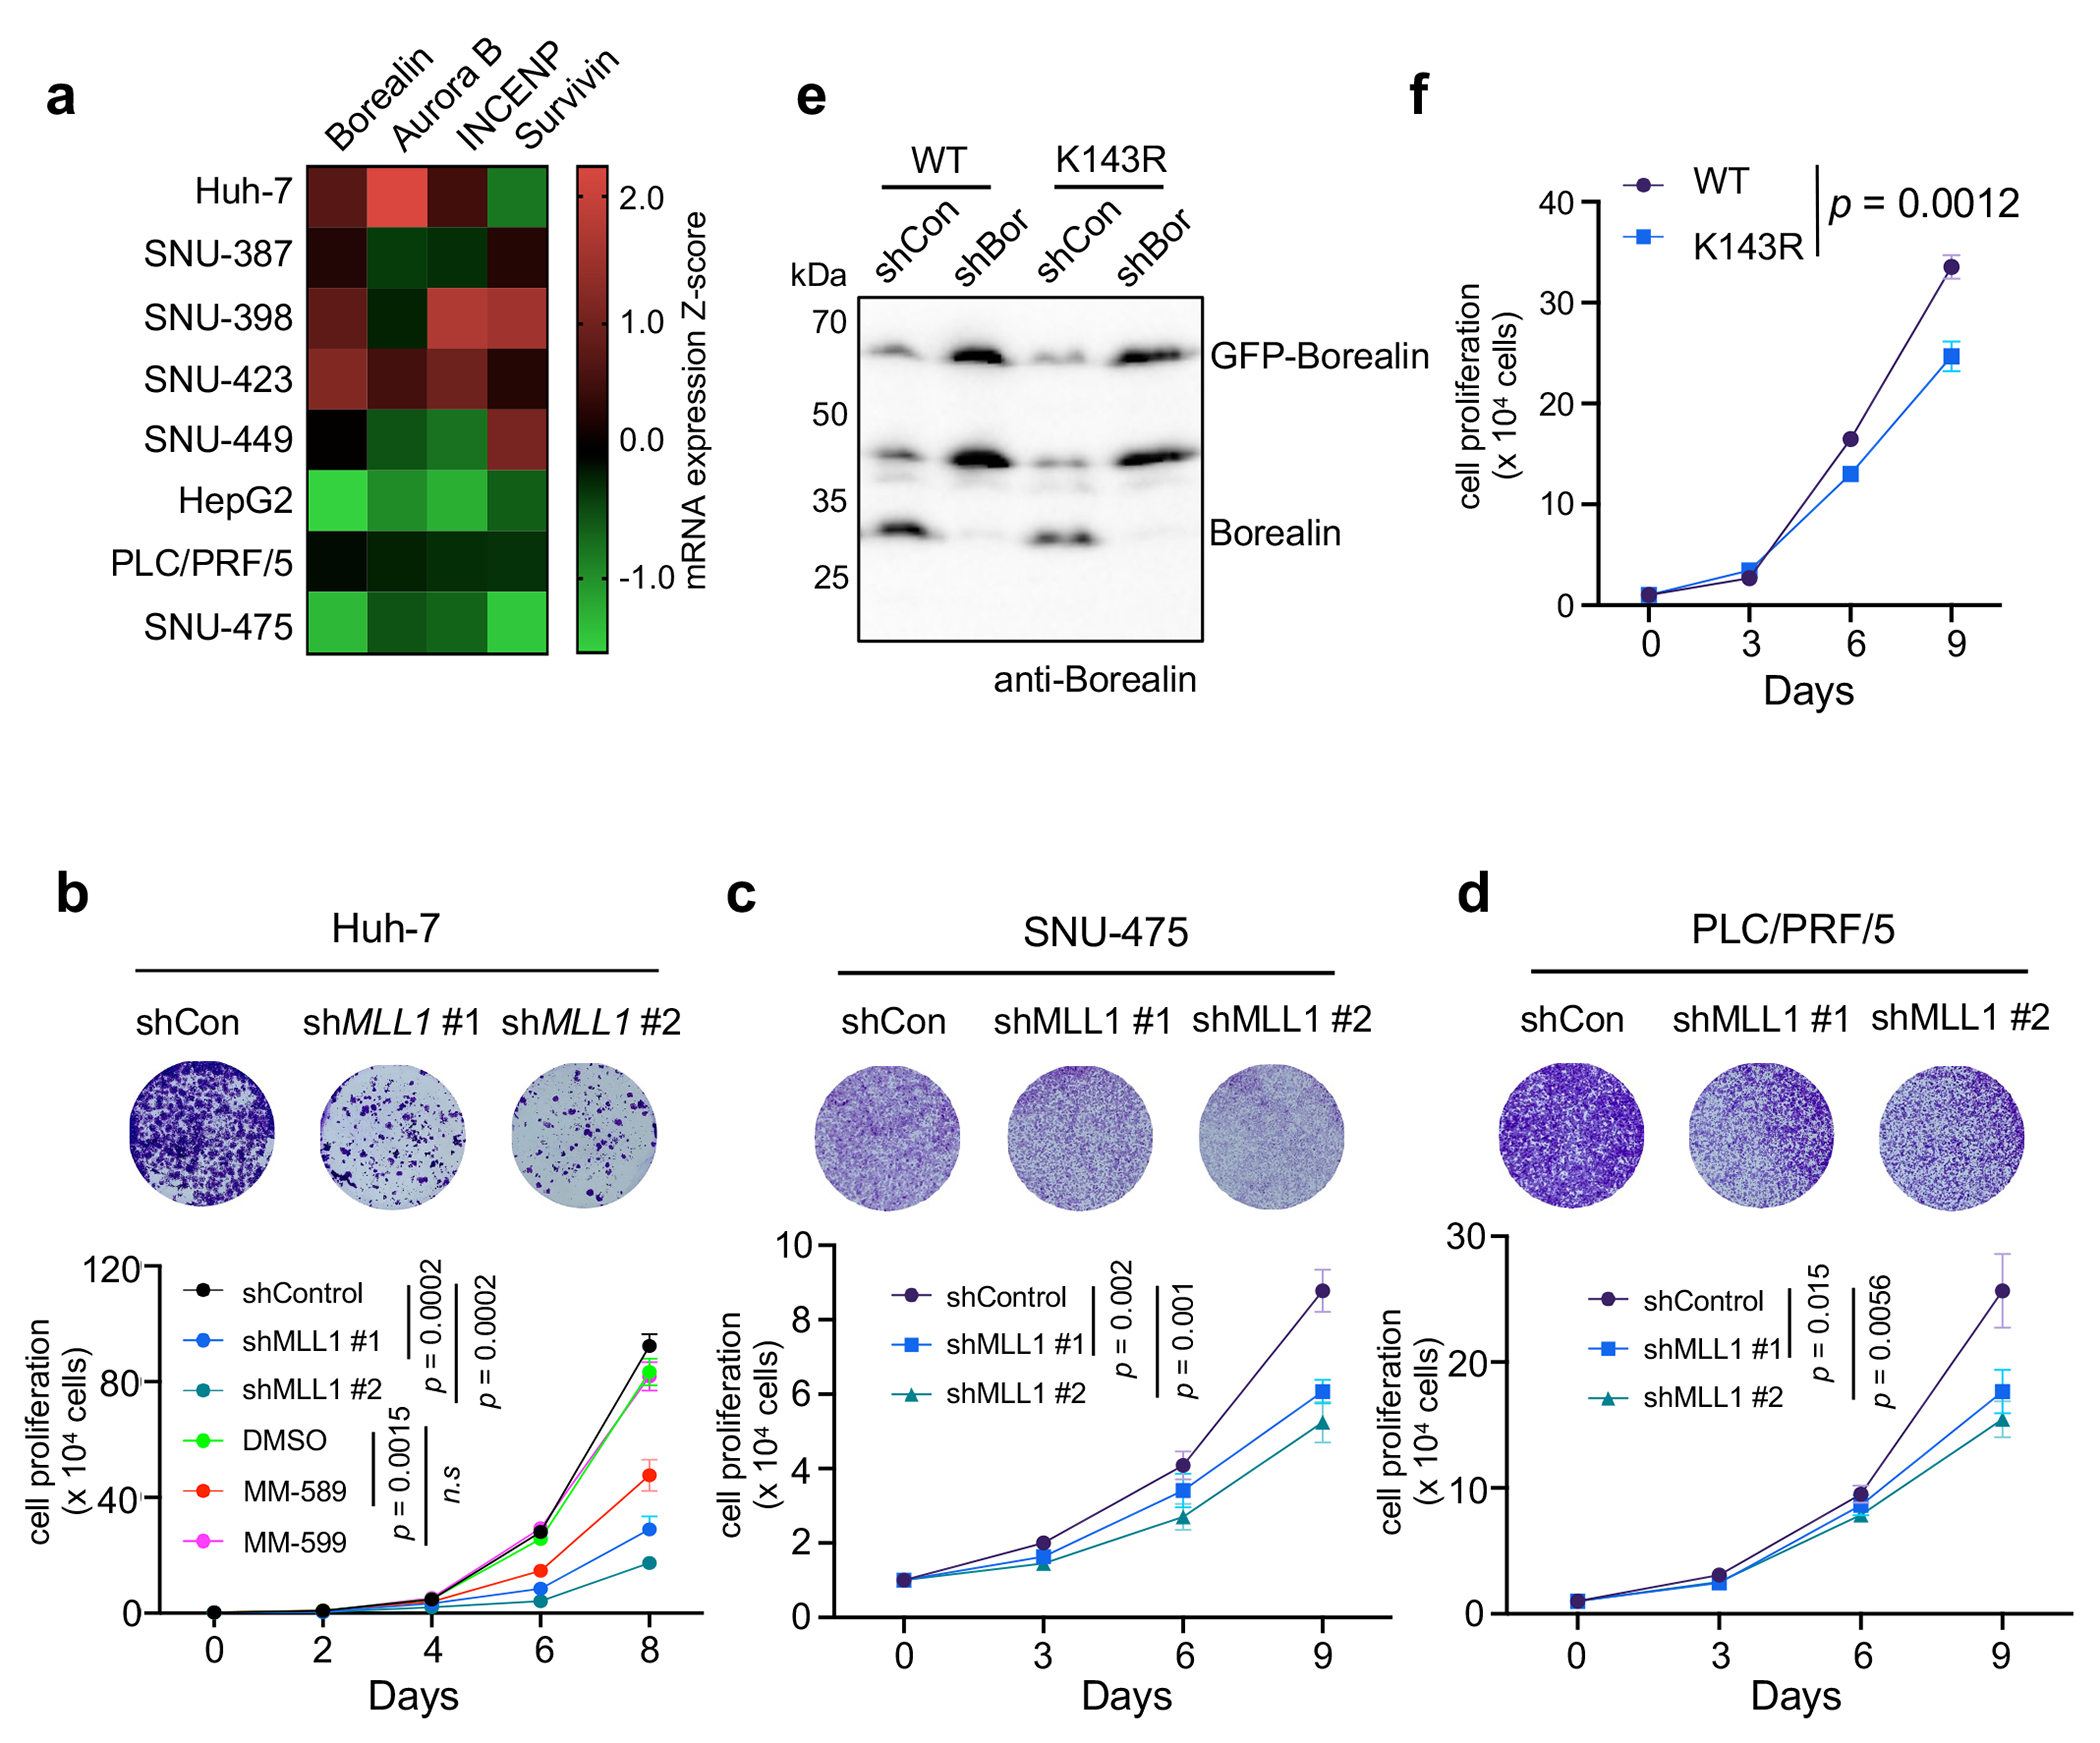
MLL1 is required for CPChigh HCC cell proliferation in vitro
Extended Data Fig. 10 |.
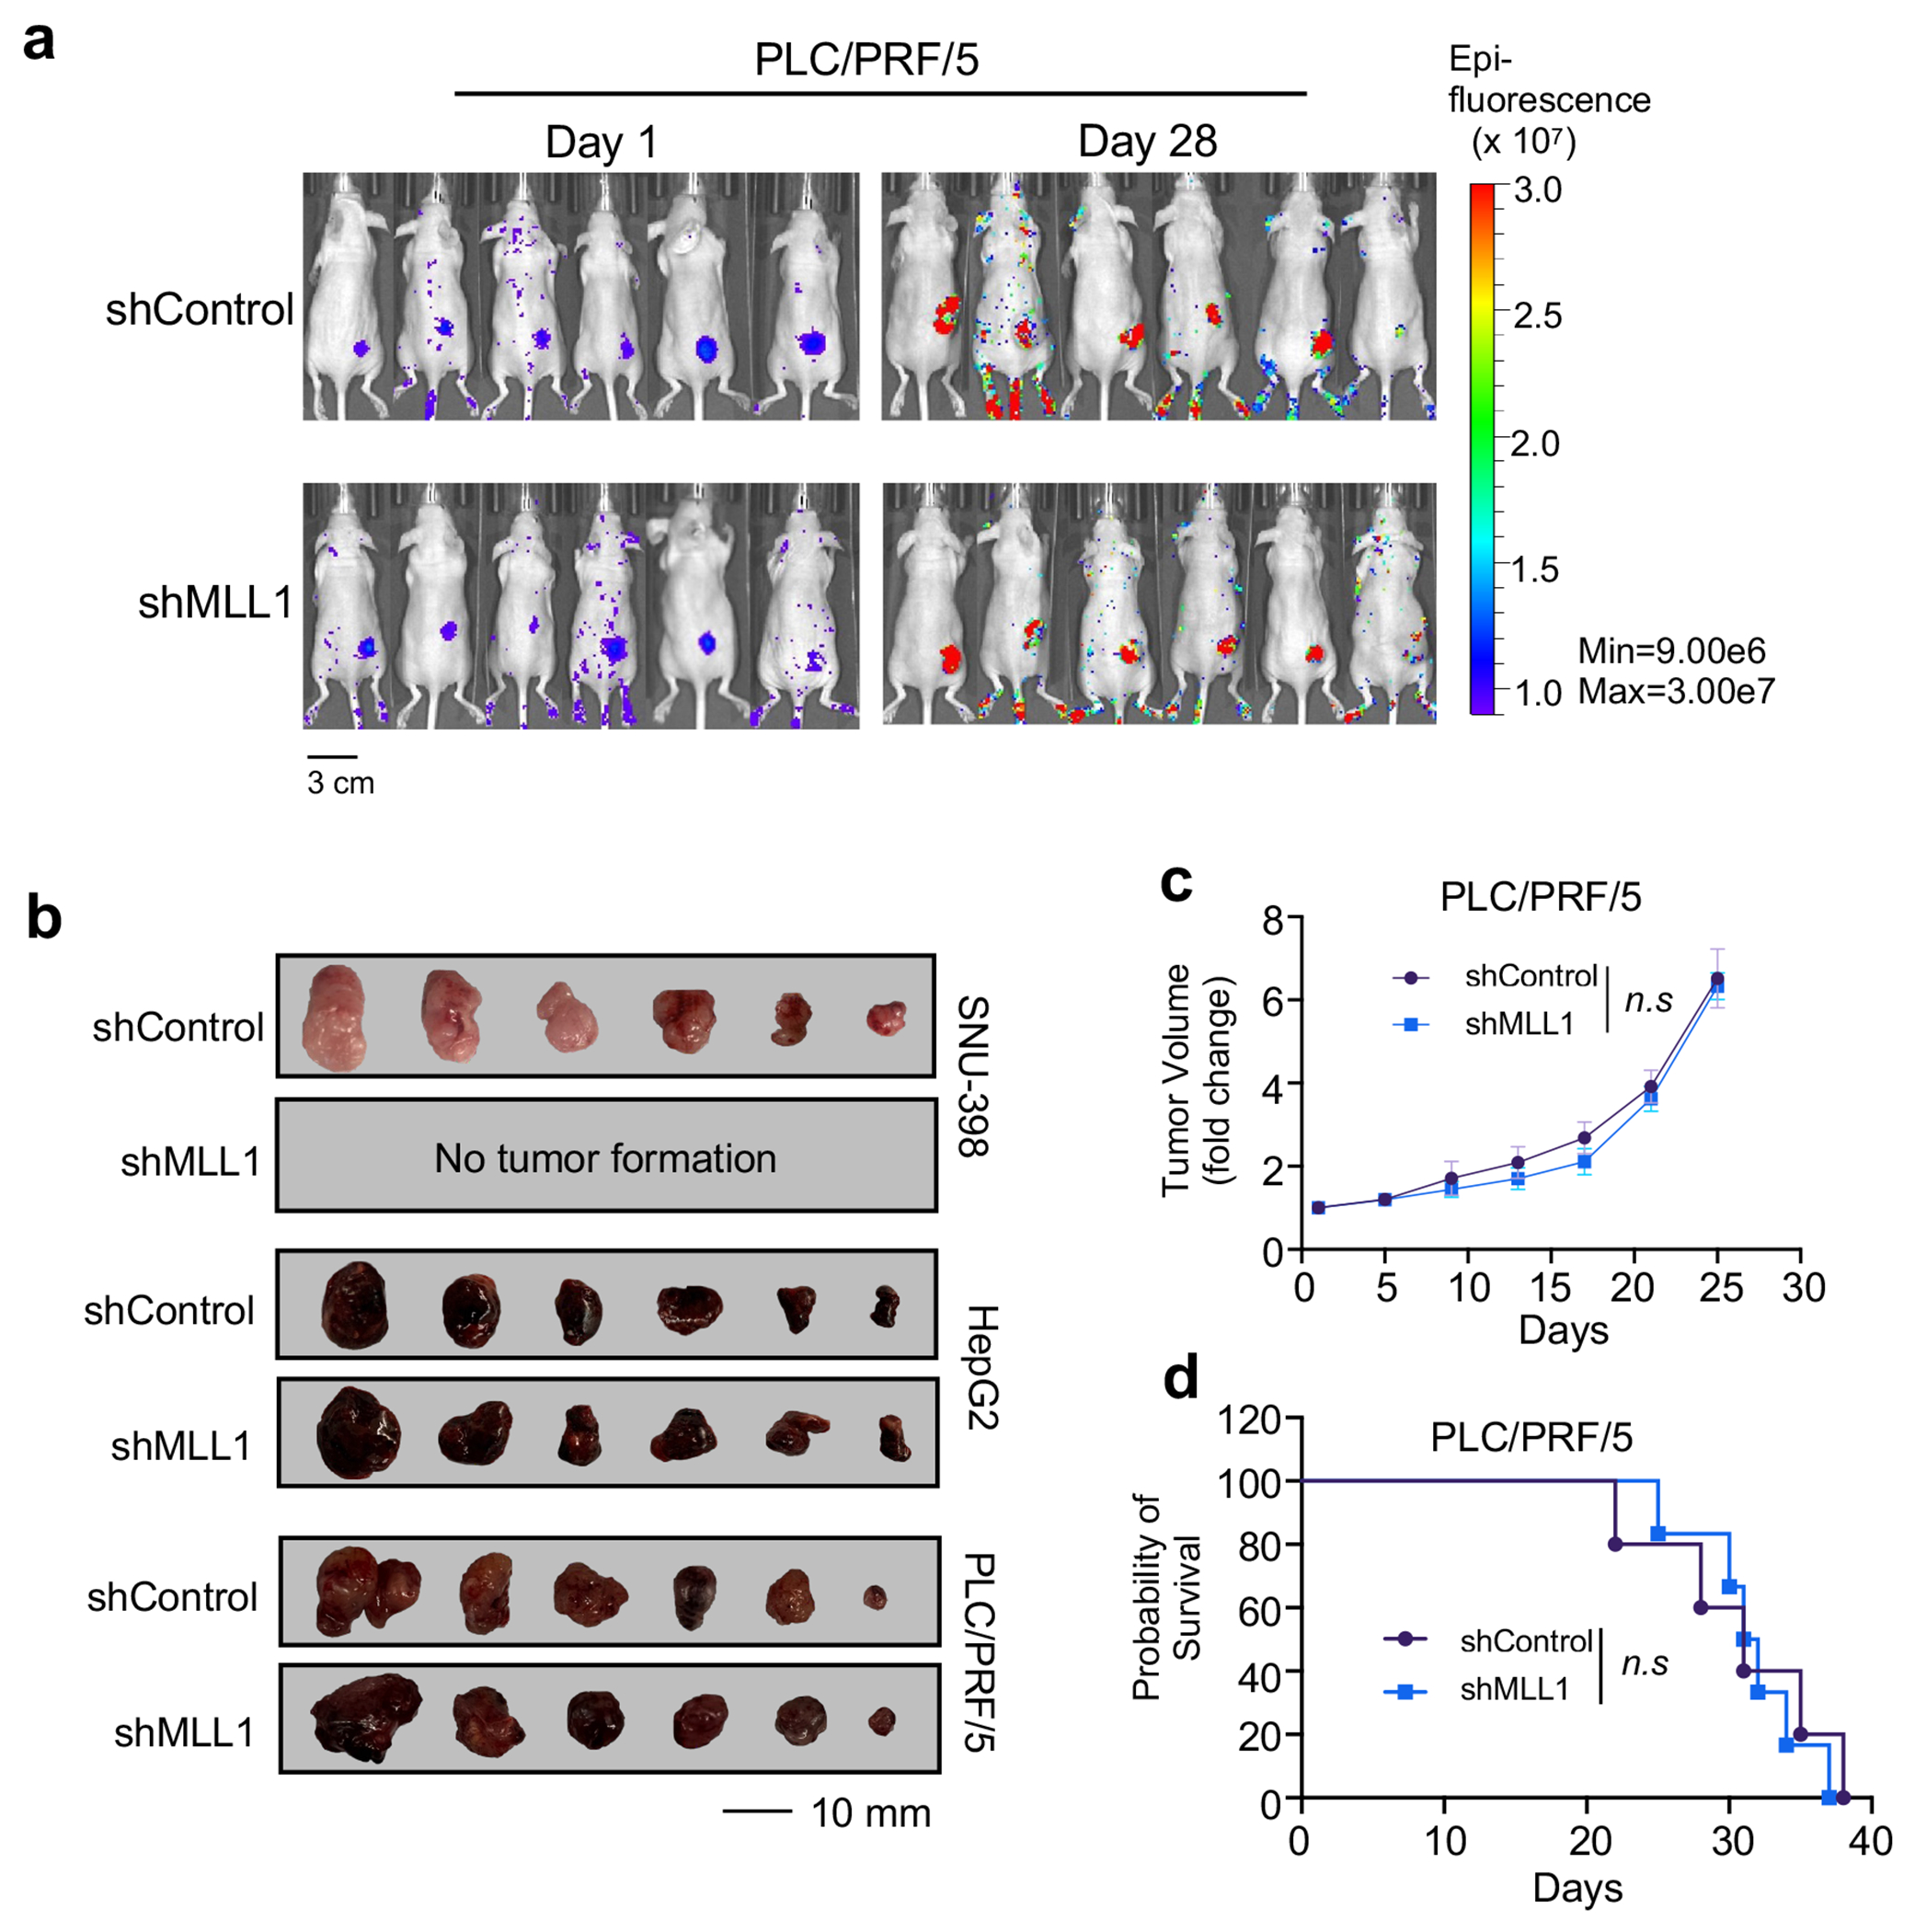
MLL1 depletion does not affect tumor growth of CPClow HCC cell lines in vivo
Supplementary Material
ACKNOWLEDGEMENTS
This work is support by the NIGMS grant (GM082856) to Y.D, NCI grant (CA250329) to Y.D and U.S.C as well as the NCI Cancer Center Shared Grant award P30CA014089 to Norris Comprehensive Cancer Center at University of Southern California. The funders had no role in study design, data collection and analysis, decision to publish or preparation of the manuscript. We are thankful for Peter Luu at USC CNI (Core Center of Excellence in Nano Imaging) for the help with DeltaVision microscopy. We are grateful for the generous gifts of the phospho-antibodies against AurkB substrates from Dr. Ian Cheeseman and Dr. Jennifer DeLuca, the Huh-7 and PLC/PRF/5 HCC cell lines from Dr. Keigo Machida, the HeLa Accept #2 cell line as well as the pEM784 and pEM791 plasmids from Dr. Ryoma Ohi, the pET28-ISB plasmid from Dr. P. Todd Stukenberg, and the pCXN2-MLL1 plasmid from Dr. Andrew Muntean.
Footnotes
- This paper does not report original code.
COMPETING INTERESTS
The authors declare no conflict of interest to this study.
DATA AVAILABILITY
Previously published data that were re-analyzed here are available under accession code GSE57957, GSE22058, GSE25097, GSE76297, GSE11279034–38.
The crystal structure model has been submitted to the PDB with accession code 7U5V and will be publicly available on the date of publication.
The human data were derived from TCGA Research Network: http://cancergenome.nih.gov/. HCC patient aneuploidy and mRNA expression profiles were available from GDC data portal (portal.gdc.cancer.org) with accession number phs000178.
CRISPR Public 20Q1 pre-computed associations were generated in DepMap portal (depmap.org/portal).
Full lists of mass spectrometry data of SILAC experiments were provided in Supplementary Table 1–4.
All original gel and microscopic images are deposited to Mendeley and are publicly available with the DOI: 10.17632/jx3b22f6ft.1. Unprocessed gel images and all data presented in graphs are available as Source Data files.
All other data supporting the findings of this study are available from the corresponding author on reasonable request.
REFERENCES
- 1.Rao RC & Dou Y Hijacked in cancer: the KMT2 (MLL) family of methyltransferases. Nat Rev Cancer 15, 334–346 (2015). 10.1038/nrc3929 [DOI] [PMC free article] [PubMed] [Google Scholar]
- 2.Lauberth SM et al. H3K4me3 interactions with TAF3 regulate preinitiation complex assembly and selective gene activation. Cell 152, 1021–1036 (2013). 10.1016/j.cell.2013.01.052 [DOI] [PMC free article] [PubMed] [Google Scholar]
- 3.Calo E & Wysocka J Modification of enhancer chromatin: what, how, and why? Mol Cell 49, 825–837 (2013). 10.1016/j.molcel.2013.01.038 [DOI] [PMC free article] [PubMed] [Google Scholar]
- 4.Tanny JC Chromatin modification by the RNA Polymerase II elongation complex. Transcription 5, e988093 (2014). 10.4161/21541264.2014.988093 [DOI] [PMC free article] [PubMed] [Google Scholar]
- 5.Wang H. et al. H3K4me3 regulates RNA polymerase II promoter-proximal pause-release. Nature 615, 339–348 (2023). 10.1038/s41586-023-05780-8 [DOI] [PMC free article] [PubMed] [Google Scholar]
- 6.Sims RJ 3rd et al. Recognition of trimethylated histone H3 lysine 4 facilitates the recruitment of transcription postinitiation factors and pre-mRNA splicing. Mol Cell 28, 665–676 (2007). 10.1016/j.molcel.2007.11.010 [DOI] [PMC free article] [PubMed] [Google Scholar]
- 7.Yan J. et al. Histone H3 lysine 4 monomethylation modulates long-range chromatin interactions at enhancers. Cell Res 28, 204–220 (2018). 10.1038/cr.2018.1 [DOI] [PMC free article] [PubMed] [Google Scholar]
- 8.Sun Y. et al. HOXA9 Reprograms the Enhancer Landscape to Promote Leukemogenesis. Cancer Cell 34, 643–658.e645 (2018). 10.1016/j.ccell.2018.08.018 [DOI] [PMC free article] [PubMed] [Google Scholar]
- 9.Dorighi KM et al. Mll3 and Mll4 Facilitate Enhancer RNA Synthesis and Transcription from Promoters Independently of H3K4 Monomethylation. Mol Cell 66, 568–576.e564 (2017). 10.1016/j.molcel.2017.04.018 [DOI] [PMC free article] [PubMed] [Google Scholar]
- 10.Milne TA et al. MLL targets SET domain methyltransferase activity to Hox gene promoters. Mol Cell 10, 1107–1117 (2002). 10.1016/s1097-2765(02)00741-4 [DOI] [PubMed] [Google Scholar]
- 11.Wang P. et al. Global analysis of H3K4 methylation defines MLL family member targets and points to a role for MLL1-mediated H3K4 methylation in the regulation of transcriptional initiation by RNA polymerase II. Mol Cell Biol 29, 6074–6085 (2009). 10.1128/mcb.00924-09 [DOI] [PMC free article] [PubMed] [Google Scholar]
- 12.Douillet D. et al. Uncoupling histone H3K4 trimethylation from developmental gene expression via an equilibrium of COMPASS, Polycomb and DNA methylation. Nat Genet 52, 615–625 (2020). 10.1038/s41588-020-0618-1 [DOI] [PMC free article] [PubMed] [Google Scholar]
- 13.Yu BD, Hess JL, Horning SE, Brown GA & Korsmeyer SJ Altered Hox expression and segmental identity in Mll-mutant mice. Nature 378, 505–508 (1995). 10.1038/378505a0 [DOI] [PubMed] [Google Scholar]
- 14.Glaser S. et al. The histone 3 lysine 4 methyltransferase, Mll2, is only required briefly in development and spermatogenesis. Epigenetics Chromatin 2, 5 (2009). 10.1186/1756-8935-2-5 [DOI] [PMC free article] [PubMed] [Google Scholar]
- 15.Lee J. et al. Targeted inactivation of MLL3 histone H3-Lys-4 methyltransferase activity in the mouse reveals vital roles for MLL3 in adipogenesis. Proc Natl Acad Sci U S A 105, 19229–19234 (2008). 10.1073/pnas.0810100105 [DOI] [PMC free article] [PubMed] [Google Scholar]
- 16.Xu J. et al. Subtype-specific 3D genome alteration in acute myeloid leukaemia. Nature 611, 387–398 (2022). 10.1038/s41586-022-05365-x [DOI] [PMC free article] [PubMed] [Google Scholar]
- 17.Carmena M, Wheelock M, Funabiki H & Earnshaw WC The chromosomal passenger complex (CPC): from easy rider to the godfather of mitosis. Nat Rev Mol Cell Biol 13, 789–803 (2012). 10.1038/nrm3474 [DOI] [PMC free article] [PubMed] [Google Scholar]
- 18.Vader G, Medema RH & Lens SM The chromosomal passenger complex: guiding Aurora-B through mitosis. J Cell Biol 173, 833–837 (2006). 10.1083/jcb.200604032 [DOI] [PMC free article] [PubMed] [Google Scholar]
- 19.Trivedi P & Stukenberg PT A Centromere-Signaling Network Underlies the Coordination among Mitotic Events. Trends Biochem Sci 41, 160–174 (2016). 10.1016/j.tibs.2015.11.002 [DOI] [PMC free article] [PubMed] [Google Scholar]
- 20.Hindriksen S, Meppelink A & Lens SM Functionality of the chromosomal passenger complex in cancer. Biochem Soc Trans 43, 23–32 (2015). 10.1042/bst20140275 [DOI] [PubMed] [Google Scholar]
- 21.Trivedi P. et al. The inner centromere is a biomolecular condensate scaffolded by the chromosomal passenger complex. Nat Cell Biol 21, 1127–1137 (2019). 10.1038/s41556-019-0376-4 [DOI] [PMC free article] [PubMed] [Google Scholar]
- 22.Poppe B. et al. Expression analyses identify MLL as a prominent target of 11q23 amplification and support an etiologic role for MLL gain of function in myeloid malignancies. Blood 103, 229–235 (2004). 10.1182/blood-2003-06-2163 [DOI] [PubMed] [Google Scholar]
- 23.Cancer Genome Atlas Research, N. Integrated genomic analyses of ovarian carcinoma. Nature 474, 609–615 (2011). 10.1038/nature10166 [DOI] [PMC free article] [PubMed] [Google Scholar]
- 24.Cancer Genome Atlas Research, N. et al. Comprehensive, Integrative Genomic Analysis of Diffuse Lower-Grade Gliomas. N Engl J Med 372, 2481–2498 (2015). 10.1056/NEJMoa1402121 [DOI] [PMC free article] [PubMed] [Google Scholar]
- 25.Moore KE et al. A general molecular affinity strategy for global detection and proteomic analysis of lysine methylation. Mol Cell 50, 444–456 (2013). 10.1016/j.molcel.2013.03.005 [DOI] [PMC free article] [PubMed] [Google Scholar]
- 26.Klein UR, Nigg EA & Gruneberg U Centromere targeting of the chromosomal passenger complex requires a ternary subcomplex of Borealin, Survivin, and the N-terminal domain of INCENP. Mol Biol Cell 17, 2547–2558 (2006). 10.1091/mbc.e05-12-1133 [DOI] [PMC free article] [PubMed] [Google Scholar]
- 27.Southall SM, Wong PS, Odho Z, Roe SM & Wilson JR Structural basis for the requirement of additional factors for MLL1 SET domain activity and recognition of epigenetic marks. Mol Cell 33, 181–191 (2009). 10.1016/j.molcel.2008.12.029 [DOI] [PubMed] [Google Scholar]
- 28.Kroschwald S, Maharana S & Simon A Hexanediol: a chemical probe to investigate the material properties of membrane-less compartments. Matters (2017). 10.19185/matters.201702000010 [DOI] [Google Scholar]
- 29.Jain A & Vale RD RNA phase transitions in repeat expansion disorders. Nature 546, 243–247 (2017). 10.1038/nature22386 [DOI] [PMC free article] [PubMed] [Google Scholar]
- 30.Nishiyama T, Sykora MM, Huis in ’t Veld PJ, Mechtler K & Peters JM Aurora B and Cdk1 mediate Wapl activation and release of acetylated cohesin from chromosomes by phosphorylating Sororin. Proc Natl Acad Sci U S A 110, 13404–13409 (2013). 10.1073/pnas.1305020110 [DOI] [PMC free article] [PubMed] [Google Scholar]
- 31.Ali A, Veeranki SN, Chinchole A & Tyagi S MLL/WDR5 Complex Regulates Kif2A Localization to Ensure Chromosome Congression and Proper Spindle Assembly during Mitosis. Dev Cell 41, 605–622.e607 (2017). 10.1016/j.devcel.2017.05.023 [DOI] [PubMed] [Google Scholar]
- 32.Gassmann R. et al. Borealin: a novel chromosomal passenger required for stability of the bipolar mitotic spindle. J Cell Biol 166, 179–191 (2004). 10.1083/jcb.200404001 [DOI] [PMC free article] [PubMed] [Google Scholar]
- 33.Tao Z, Cui Y, Xu X & Han T FGFR redundancy limits the efficacy of FGFR4-selective inhibitors in hepatocellular carcinoma. Proc Natl Acad Sci U S A 119, e2208844119 (2022). 10.1073/pnas.2208844119 [DOI] [PMC free article] [PubMed] [Google Scholar]
- 34.Burchard J. et al. microRNA-122 as a regulator of mitochondrial metabolic gene network in hepatocellular carcinoma. Mol Syst Biol 6, 402 (2010). 10.1038/msb.2010.58 [DOI] [PMC free article] [PubMed] [Google Scholar]
- 35.Sung WK et al. Genome-wide survey of recurrent HBV integration in hepatocellular carcinoma. Nat Genet 44, 765–769 (2012). 10.1038/ng.2295 [DOI] [PubMed] [Google Scholar]
- 36.Chaisaingmongkol J. et al. Common Molecular Subtypes Among Asian Hepatocellular Carcinoma and Cholangiocarcinoma. Cancer Cell 32, 57–70.e53 (2017). 10.1016/j.ccell.2017.05.009 [DOI] [PMC free article] [PubMed] [Google Scholar]
- 37.Shimada S. et al. Comprehensive molecular and immunological characterization of hepatocellular carcinoma. EBioMedicine 40, 457–470 (2019). 10.1016/j.ebiom.2018.12.058 [DOI] [PMC free article] [PubMed] [Google Scholar]
- 38.Mah WC et al. Methylation profiles reveal distinct subgroup of hepatocellular carcinoma patients with poor prognosis. PLoS One 9, e104158 (2014). 10.1371/journal.pone.0104158 [DOI] [PMC free article] [PubMed] [Google Scholar]
- 39.Sheltzer JM A transcriptional and metabolic signature of primary aneuploidy is present in chromosomally unstable cancer cells and informs clinical prognosis. Cancer Res 73, 6401–6412 (2013). 10.1158/0008-5472.can-13-0749 [DOI] [PMC free article] [PubMed] [Google Scholar]
- 40.Santaguida S & Amon A Short- and long-term effects of chromosome mis-segregation and aneuploidy. Nat Rev Mol Cell Biol 16, 473–485 (2015). 10.1038/nrm4025 [DOI] [PubMed] [Google Scholar]
- 41.Milne TA et al. Menin and MLL cooperatively regulate expression of cyclin-dependent kinase inhibitors. Proc Natl Acad Sci U S A 102, 749–754 (2005). 10.1073/pnas.0408836102 [DOI] [PMC free article] [PubMed] [Google Scholar]
- 42.Tyagi S, Chabes AL, Wysocka J & Herr W E2F activation of S phase promoters via association with HCF-1 and the MLL family of histone H3K4 methyltransferases. Mol Cell 27, 107–119 (2007). 10.1016/j.molcel.2007.05.030 [DOI] [PubMed] [Google Scholar]
- 43.Blobel GA et al. A reconfigured pattern of MLL occupancy within mitotic chromatin promotes rapid transcriptional reactivation following mitotic exit. Mol Cell 36, 970–983 (2009). 10.1016/j.molcel.2009.12.001 [DOI] [PMC free article] [PubMed] [Google Scholar]
- 44.Kelly AE et al. Survivin reads phosphorylated histone H3 threonine 3 to activate the mitotic kinase Aurora B. Science 330, 235–239 (2010). 10.1126/science.1189505 [DOI] [PMC free article] [PubMed] [Google Scholar]
- 45.Dai J, Sultan S, Taylor SS & Higgins JM The kinase haspin is required for mitotic histone H3 Thr 3 phosphorylation and normal metaphase chromosome alignment. Genes Dev 19, 472–488 (2005). 10.1101/gad.1267105 [DOI] [PMC free article] [PubMed] [Google Scholar]
- 46.Wang F. et al. Histone H3 Thr-3 phosphorylation by Haspin positions Aurora B at centromeres in mitosis. Science 330, 231–235 (2010). 10.1126/science.1189435 [DOI] [PMC free article] [PubMed] [Google Scholar]
- 47.Trivedi P & Stukenberg PT A Condensed View of the Chromosome Passenger Complex. Trends Cell Biol 30, 676–687 (2020). 10.1016/j.tcb.2020.06.005 [DOI] [PMC free article] [PubMed] [Google Scholar]
- 48.Saito M. et al. Acetylation of intrinsically disordered regions regulates phase separation. Nat Chem Biol 15, 51–61 (2019). 10.1038/s41589-018-0180-7 [DOI] [PubMed] [Google Scholar]
- 49.Hofweber M. et al. Phase Separation of FUS Is Suppressed by Its Nuclear Import Receptor and Arginine Methylation. Cell 173, 706–719.e713 (2018). 10.1016/j.cell.2018.03.004 [DOI] [PubMed] [Google Scholar]
- 50.Zeitlin SG, Barber CM, Allis CD & Sullivan KF Differential regulation of CENP-A and histone H3 phosphorylation in G2/M. J Cell Sci 114, 653–661 (2001). 10.1242/jcs.114.4.653 [DOI] [PubMed] [Google Scholar]
- 51.Welburn JP et al. Aurora B phosphorylates spatially distinct targets to differentially regulate the kinetochore-microtubule interface. Mol Cell 38, 383–392 (2010). 10.1016/j.molcel.2010.02.034 [DOI] [PMC free article] [PubMed] [Google Scholar]
- 52.Hadders MA et al. Untangling the contribution of Haspin and Bub1 to Aurora B function during mitosis. J Cell Biol 219 (2020). 10.1083/jcb.201907087 [DOI] [PMC free article] [PubMed] [Google Scholar]
METHODS-ONLY REFERENCES
- 53.Park SH et al. Cryo-EM structure of the human MLL1 core complex bound to the nucleosome. Nat Commun 10, 5540 (2019). 10.1038/s41467-019-13550-2 [DOI] [PMC free article] [PubMed] [Google Scholar]
- 54.Dou Y. et al. Regulation of MLL1 H3K4 methyltransferase activity by its core components. Nat Struct Mol Biol 13, 713–719 (2006). 10.1038/nsmb1128 [DOI] [PubMed] [Google Scholar]
- 55.Kabsch W XDS. Acta Crystallogr D Biol Crystallogr 66, 125–132 (2010). 10.1107/s0907444909047337 [DOI] [PMC free article] [PubMed] [Google Scholar]
- 56.McCoy AJ et al. Phaser crystallographic software. J Appl Crystallogr 40, 658–674 (2007). 10.1107/s0021889807021206 [DOI] [PMC free article] [PubMed] [Google Scholar]
- 57.Emsley P & Cowtan K Coot: model-building tools for molecular graphics. Acta Crystallogr D Biol Crystallogr 60, 2126–2132 (2004). 10.1107/s0907444904019158 [DOI] [PubMed] [Google Scholar]
- 58.Adams PD et al. PHENIX: a comprehensive Python-based system for macromolecular structure solution. Acta Crystallogr D Biol Crystallogr 66, 213–221 (2010). 10.1107/s0907444909052925 [DOI] [PMC free article] [PubMed] [Google Scholar]
- 59.Slaughter BD et al. Non-uniform membrane diffusion enables steady-state cell polarization via vesicular trafficking. Nat Commun 4, 1380 (2013). 10.1038/ncomms2370 [DOI] [PMC free article] [PubMed] [Google Scholar]
- 60.Bekier ME, Mazur T, Rashid MS & Taylor WR Borealin dimerization mediates optimal CPC checkpoint function by enhancing localization to centromeres and kinetochores. Nat Commun 6, 6775 (2015). 10.1038/ncomms7775 [DOI] [PMC free article] [PubMed] [Google Scholar]
- 61.Smyth GK in Bioinformatics and computational biology solutions using R and Bioconductor 397–420 (Springer, 2005). [Google Scholar]
- 62.Schwarzer G & Schwarzer MG Package ‘meta’. The R foundation for statistical computing 9 (2012). [Google Scholar]
- 63.Page A. et al. Alcohol directly stimulates epigenetic modifications in hepatic stellate cells. J Hepatol 62, 388–397 (2015). 10.1016/j.jhep.2014.09.033 [DOI] [PMC free article] [PubMed] [Google Scholar]
- 64.Broad AJ, DeLuca KF & DeLuca JG Aurora B kinase is recruited to multiple discrete kinetochore and centromere regions in human cells. J Cell Biol 219 (2020). 10.1083/jcb.201905144 [DOI] [PMC free article] [PubMed] [Google Scholar]
- 65.Wheeler DA, Roberts LR & Network TR Comprehensive and Integrative Genomic Characterization of Hepatocellular Carcinoma. Cell 169, 1327–1341.e1323 (2017). 10.1016/j.cell.2017.05.046 [DOI] [PMC free article] [PubMed] [Google Scholar]
Associated Data
This section collects any data citations, data availability statements, or supplementary materials included in this article.
Supplementary Materials
Data Availability Statement
Previously published data that were re-analyzed here are available under accession code GSE57957, GSE22058, GSE25097, GSE76297, GSE11279034–38.
The crystal structure model has been submitted to the PDB with accession code 7U5V and will be publicly available on the date of publication.
The human data were derived from TCGA Research Network: http://cancergenome.nih.gov/. HCC patient aneuploidy and mRNA expression profiles were available from GDC data portal (portal.gdc.cancer.org) with accession number phs000178.
CRISPR Public 20Q1 pre-computed associations were generated in DepMap portal (depmap.org/portal).
Full lists of mass spectrometry data of SILAC experiments were provided in Supplementary Table 1–4.
All original gel and microscopic images are deposited to Mendeley and are publicly available with the DOI: 10.17632/jx3b22f6ft.1. Unprocessed gel images and all data presented in graphs are available as Source Data files.
All other data supporting the findings of this study are available from the corresponding author on reasonable request.


