Abstract
Background:
It is increasingly recognized that interstitial lung abnormalities (ILAs) detected on CT have potential clinical implications, but automated identification of ILAs has not yet been fully established.
Purpose:
To develop and test an automated ILA probability prediction model using machine learning techniques on CT images.
Materials and Methods:
This secondary analysis of a retrospective study utilizing CT scans from patients in the Boston Lung Cancer Study collected between February 2004 and June 2017. Visual scoring of ILAs by two radiologists and a pulmonologist served as the ground truth. An automated estimation of ILAs was developed using a stepwise approach, involving slice inference (SI) and case inference (CI) models. The SI model outputs the ILA probability for each CT slice, while the CI model integrates these probabilities to generate the ILA probability for the case. For indeterminate slices and cases, both two- and three-label methods were introduced. In the case inference model tested three machine learning models (support vector machine [SVM], random forest [RF], and convolutional neural network [CNN]). Receiver operating characteristic analysis was performed to calculate the AUC.
Results:
A total of 1,382 patients (mean age 67 years ± 11 [SD], 623 men) were included. Of the 1,382 patients, ILAs were present in 104 (8%), indeterminate in 492 (36%), and absent in 786 (57%). The cohort was divided into a training set (n=96; ILA, n=48), a validation set (n=24; ILA, n=8), and the test set (n=1262; ILA, n=44). Among the models evaluated (two-label/three-label for SI models; two-label/three-label and SVM/RF/CNN for case inference models), the model using the three-label method in the SI model and the two-label method and RF in the CI model achieved the highest AUC of 0.87.
Conclusion:
The automatic model demonstrated substantial performance in estimating ILA probability, indicating its potential utility in clinical settings.
Summary statement:
The development of automatic interstitial lung abnormality identification utilized a stepwise approach, incorporating both a slice inference and a case inference model, resulting in an achieved AUC of 0.87
Introduction
Recent work has shown that interstitial lung abnormalities (ILAs) are associated with poor clinical outcomes (1,2). Including progressive respiratory symptoms (3), physiologic decline (3,4), an increased incidence of lung cancer (5,6), and higher mortality (6,7). ILAs are found at a frequency of 7% according to a recent meta-analysis (8). ILAs may be an early precursor to pulmonary fibrosis. ILAs have been studied for their epidemiology, genetics (3,4,9,10), associated blood biomarkers (11), radiologic findings (12), and histologic findings (13). These investigations have shown that ILAs are part of the spectrum associated with early pulmonary fibrosis and are very clinically important (14–16). They represent a harbinger of what will become of the lung in those areas of involvement.
Visual subjective evaluation of ILAs on chest CT, based on the Fleischner criteria, has reproducibility issues (1,2). Recent work studying this issue showed inter-reader kappa values ranging from 0.43–0.82 (6,17,18). Visual assessment of ILAs is time-consuming, thus an automated solution is preferable. To address the need for automation, various machine learning methods have been developed (19–21). While these automated methods primarily used texture and densitometry-based approaches, the potential for using a probability prediction approach has not been well established in the literature.
The objective of this study was to develop and test an automated probability prediction method, using machine learning techniques on and the Boston Lung Cancer Study chest CT exams, for the presence ILAs and then to determine its efficacy compared to human readers (current gold standard).
Materials and Methods
This study was a secondary retrospective analysis of the original Boston Lung Cancer Study. It was approved by the institutional review board (Mass General Brigham institutional review board Protocol No: 1999P004935). All subjects provided written informed consent for the original Boston Lung Cancer Study and this secondary analysis.
Study population
The Boston Lung Cancer Study is a cancer epidemiology cohort of over 12,000 lung cancer cases in Massachusetts General Hospital. It included detailed patient demographics, radiological imaging, pathology, treatments, oncogenic mutation status, bio-samples, and survival data (22).
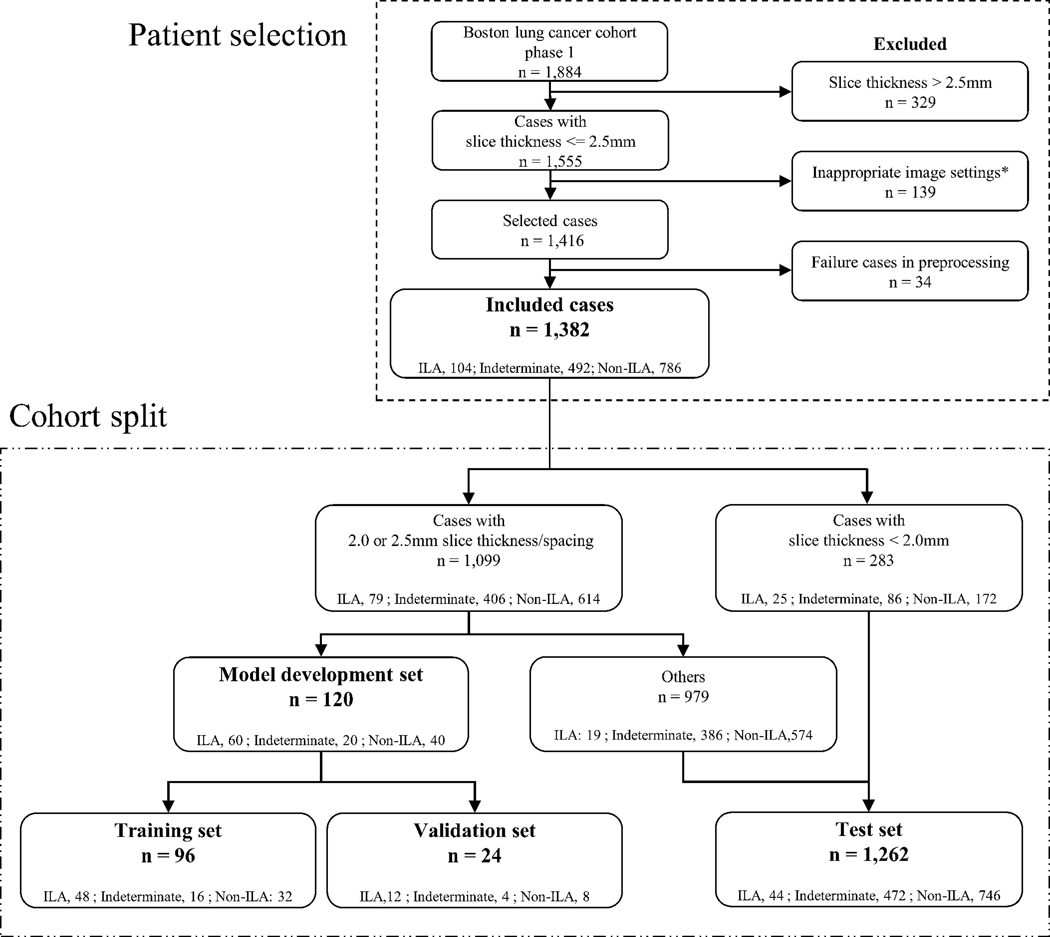
Inclusion criteria were patients diagnosed in the Boston Lung Cancer Study with CT scans available at the beginning of this study (July 2021). The method for the construction of the imaging cohort was described previously (22). Exclusion criteria for CT scans included: slice thickness > 2.5mm, non-uniform slice interval, non-uniform slice thickness, slice interval larger than slice thickness, multiple CT volumes in one series, non-axial slices, and lung kernel image. Images with a slice thickness greater than 2.5-mm were excluded due to the difficultly in assessing ILA findings in detail with thicker slices. Since most CTs were reconstructed with the soft tissue kernel, only soft tissue kernel images were included, and lung kernel images were excluded. Exams with preprocessing failures, such as lung segmentation errors, were also excluded. Patient selection is summarized in Figure 1. Demographic characteristics, including age, sex, smoking status (never, former, and current), pack-years of cigarette smoking, and cancer stage (American Joint Committee on Cancer 8th edition) were collected.
Figure 1.
Flow chart of patient selection and cohort split. In the cohort split, among the ILA patients with 2.0- or 2.5-mm slice thickness images (n=79), three-quarters of the patients of ILAs (n=60) were randomly divided into the model development set. To prepare negative patients in the model validation development set, 60 patients with 2.0- or 2.5-mm slice thickness images (indeterminate for ILA, n=20; no-ILA, n=40) were randomly divided into the model development set. The other 979 patients with 2.0- or 2.5-mm slice thickness images were included in the test set.
*Inappropriate image settings were the CTs only with following setting images: non-uniform slice interval, non-uniform slice thickness, slice interval larger than slice thickness, multiple CT volumes in one series, non-axial slices, and lung kernel image.
ILAs, interstitial lung abnormalities
CT Scan and Image Reconstruction
CT scans were performed using standard chest CT protocols with or without administration of the intravenous contrast. Of the 1,382 CT scans, 343 (24%) were non-contrast-enhanced and 1,039 (75%) were contrast-enhanced. Axial images were reconstructed with a soft tissue kernel. The other scan and reconstruction settings were as follows: tube voltage, 80–150 kvp; matrix size, 512 × 512; reconstruction diameter (field of view), 270–544 mm; pixel size, 0.527–1.0625; slice thickness, 0.6–2.5mm.
Visual Scoring of ILAs
Visual CT scoring of ILAs was performed for the research purpose using a sequential reading method previously described (supplementary material) (23,24). This visual scoring did not refer clinical radiological reports. ILAs were scored by two thoracic radiologist (reader#1 T.H. with 9 years of experience and reader#3 H.H. with >20 years of experience) and a pulmonologist (reader#2 G.M.H. with >20 years of experience). ILAs were scored using an established 3-point scale: score 0, No-ILA; score 1, Indeterminate for ILA; score 2, ILA (4,24,25).
To evaluate the intra- and inter-reader agreement, an additional reading session was performed by a thoracic radiologist (reader #4: N.W. with 11 years of experience). Reader #4 independently interpreted 50 randomly selected patients. After a 2-week interval, reader #4 performed a second interpretation session.
Development of Machine Learning Model
Figure 2 shows a schematic diagram of our proprietary automated ILA probability prediction via a stepwise approach. This approach comprises two consecutive machine learning models: the initial step involves the slice inference model, followed by the case inference model. When presented with a stack of chest CT slices forming a chest CT volume, the slice inference model produces the ILA probability for each individual slice. Subsequently, the array of ILA probabilities is fed into the case inference model to determine the ILA probability for the entire case.
Figure 2.
A schematic diagram of the automated ILA identification model
ILA, interstitial lung abnormality
Cohort Split
The cohort split is summarized in Figure 1. For the development of models, we used the patients with slice thicknesses of 2.0 or 2.5mm, which constituted the majority of the cohort and considered standard for routine chest CT examination. Homogeneous data (data with the same conditions) are considered more appropriate for model training. Among these patients (n=1,099), 79 were diagnosed with ILA based on visual scoring. Three-quarters of the patients with ILA (n=60) were randomly divided into the model development set and the rest (n=19) into the test set. To prepare negative patients in the model development set, 60 patients (indeterminate for ILA, n=20; no-ILA, n=40) were randomly selected. The ratio of indeterminate for ILA to no-ILA (1:2) was determined from the ratio in the entire cohort. Among the 120 patients in the model development set, 96 and 24 patients were randomly divided into the training and validation sets, respectively. The remaining patients without ILA and indeterminate for ILA in the group with 2.0- or 2.5-mm images (n=979) and patients with slice thickness < 2.0 mm (n=283) were used for the test set. As a result, the cohort was divided into the training (n=96), validation (n=24), and test sets (n=1,262).
Image preprocessing
As preprocessing, lung segmentation based on thresholding was performed. Then, a distance map from chest wall was generated using the result of lung segmentation. Pixel intensity normalization in the range of [−1050 HU, 150 HU] was applied to the original image. The image combined with the distance map was used as input to the following slice inference model. Detailed image preprocessing is described in the supplementary material.
Slice inference model
In developing the slice inference model, a thoracic radiologist (T.H. with 9 years of experience [reader #1 in the visual scoring for the entire cohort]) undertook the review of CT slices and conducted ground truth labeling for each slice. This process resulted in the utilization of 2,184 slices with ILA, 463 slices indeterminate for ILA, and 3,118 slices without ILA for model development. The lung slices, including those with posterior lungs or lung bases, were utilized in the model development.
To develop slice inference model, we used two methods regarding indeterminate slices: two-label and three-label method. In both methods, ILA probability was set to 1.0 for ILA slices and 0.0 for no-ILA slices. In the two-label method, ILA probability was set to 0.0 for indeterminate slices, whereas it was set to 0.5 in the three-label method. Detailed model development and ground truth labeling for each slice is described in the supplementary material.
Case inference model
The case inference model was developed to integrate the probability values generated by the slice inference model. Visual classification (No-ILA, Indeterminate for ILA, and ILA) served as the ground truth label. By feeding each slice individually to the slice inference model, a list of ILA probabilities was obtained. Given the varying number of slices among cases, cubic interpolation was applied to achieve a predefined uniform dimension.
In constructing the case inference model, three types of machine learning models—support vector machine (SVM), random forest (RF), and convolutional neural network (CNN)—were employed with grid search to optimize hyperparameters. Similar to the slice inference model, both two-label and three-label methods were used. In both approaches, ILA probability was set to 1.0 for ILA cases and 0.0 for no-ILA cases. For the two-label method, ILA probability was set to 0.0 for indeterminate cases, while in the three-label method, it was set to 0.5. Detailed model development is described in the supplementary material.
In total, we developed 12 models, encompassing two-label/three-label for slice inference models, and two-label/three-label as well as SVM/RF/CNN for case inference models.
Test and Statistical Analysis
Following model development, the models were applied to the test set, and the probability value for each case was obtained. To assess the performance, the case-based probability values were compared with visual classifications in the test set. Receiver operating characteristic (ROC) analysis was conducted, and the area under the ROC curve (AUC) was calculated. In the visual assessment, indeterminate cases were considered negative according to previous reports (22,26). Sensitivity and specificity were calculated at the threshold of 0.5 for the probability value. Additionally, another threshold was determined using the Youden index, and sensitivity and specificity were calculated accordingly. In cases where multiple values were identified as the Youden index, the value with the highest sensitivity was selected.
Intra- and inter-reader agreement of ILA scoring was assessed with a weighted kappa coefficient (κw), using the following categorization for kappa: poor (0<κw≤0.20), fair (0.20<κw≤0.40), moderate (0.40<κ≤0.60), good (0.60<κw≤0.80), and excellent (0.80<κw ≤1.00) (27). Intra-reader agreement was calculated using two sessions by reader #4 and inter-reader agreement was calculated between the score by reader #4 and the consensus score.
The statistical analyses were performed using pROC (1.18.4) library in R version 4.3.1 software (R Foundation for Statistical Computing, Vienna, Austria).
Results
Demographic characteristics and reader agreement
The original imaging cohort consisted of 1,884 patients. We excluded 329 patients due to thick slices, 139 patients due to inappropriate image settings, and 34 patients due to image preprocessing failure. Consequently, 1,382 patients were included in this study (Figure 1). The included CT scans were acquired between February 2004 and June 2017.
Of the 1,382 patients in the entire cohort (mean age 67 years ± 11 [standard deviation], 623 men [45%]), ILAs were present in 104 (8%), indeterminate in 492 (36%), and absent in 786 (57%). The demographic characteristics are summarized in Table 1. 96 patients (mean age 69 years ± 10 [standard deviation], 48 men [50%]) were used for the training and 1,262 patients (mean age 67 years ± 11 [standard deviation], 563 men [45%]) for the test.
Table 1.
Patient demographics
| Total | Training | Validation | Test | |
|---|---|---|---|---|
|
| ||||
| Characteristic | N = 1,382 | N = 96 | N = 24 | N = 1,262 |
| Age, Mean (SD) | 67 (11) | 69 (10) | 68 (12) | 67 (11) |
| Sex, n (%) | ||||
| Female | 759 (55%) | 48 (50%) | 12 (50%) | 699 (55%) |
| Male | 623 (45%) | 48 (50%) | 12 (50%) | 563 (45%) |
| Smoking Status, n (%) | ||||
| Former Smoker | 784 (59%) | 47 (51%) | 13 (54%) | 724 (59%) |
| Current Smoker | 373 (28%) | 35 (38%) | 10 (42%) | 328 (27%) |
| Never Smoker | 179 (13%) | 11 (12%) | 1 (4.2%) | 167 (14%) |
| Unknown | 46 | 3 | 43 | |
| Smoking Pack Years, Mean (SD) | 36 (29) | 41 (30) | 43 (36) | 36 (29) |
| Unknown | 108 | 7 | 101 | |
| Stage, n (%) | ||||
| Stage 0 | 1 (<0.1%) | 0 (0%) | 0 (0%) | 1 (<0.1%) |
| Stage 1 | 512 (40%) | 30 (37%) | 10 (43%) | 472 (40%) |
| Stage 2 | 122 (9.5%) | 9 (11%) | 2 (8.7%) | 111 (9.4%) |
| Stage 3 | 218 (17%) | 17 (21%) | 5 (22%) | 196 (17%) |
| Stage 4 | 361 (28%) | 21 (26%) | 5 (22%) | 335 (28%) |
| SCLC-ES | 35 (2.7%) | 3 (3.7%) | 1 (4.3%) | 31 (2.6%) |
| SCLC-LS | 38 (3.0%) | 2 (2.4%) | 0 (0%) | 36 (3.0%) |
| Unknown | 95 | 14 | 1 | 80 |
SCLC-ES, small-cell lung cancer – extensive stage; SCLC-LS, small cell lung cancer – limited stage
The intra-reader agreement was good (κw=0.74), while the inter-reader agreement and moderate (κw=0.46), respectively.
Model Performance
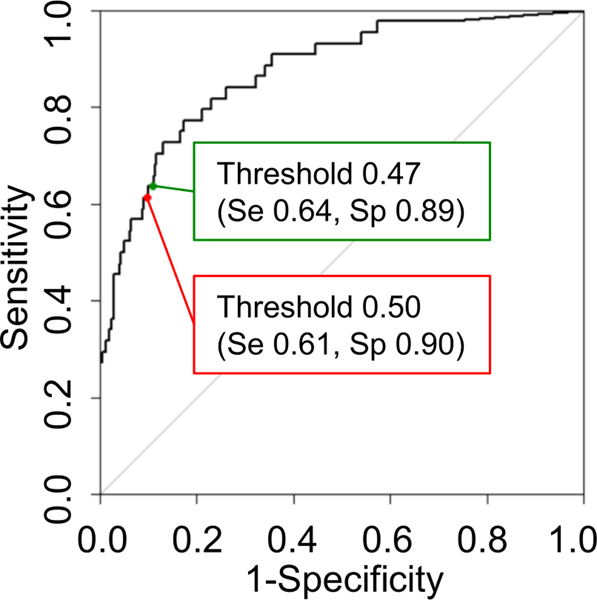
The performance (AUC, sensitivity, and specificity) of the obtained 12 models is summarized in Table 2. Sensitivity and specificity were calculated at two thresholds for the probability value (0.5 and the Youden index value). The highest performance with an AUC of 0.87 (95% confidence interval: 0.82, 0.93) was achieved using the three-label method in the slice inference model and the two-label method with a RF classifier in the case inference model. The sensitivity and specificity were 0.61 and 0.90 respectively when applying 0.5 as the threshold. When using 0.47 as the threshold, determined by Youden Index, the sensitivity and the specificity were 0.64 and 0.89 respectively. The highest sensitivity was observed in the model using the two-label method in both the slice inference model and the case inference model (sensitivity, 0.86; specificity, 0.68; threshold, 0.28 [Youden index]). The AUCs of the models using CNN were not superior to those using SVM and RF.
Table 2.
Performance measure of twelve models.
| Label types of slice inference method | Label types of case inference method | Case inference model | AUC | Sensitivity (th=0.5) | Specificity (th=0.5) | Sensitivity (th=YI) | Specificity (th=YI) | Youden Index |
|---|---|---|---|---|---|---|---|---|
| Two-label | Two-label | SVM | 0.83 [0.76, 0.91] |
0.68 [0.52, 0.81] (30/44) |
0.83 [0.81, 0.85] (1015/1218) |
0.82 [0.67, 0.92] (36/44) |
0.70 [0.68, 0.73] (854/1218) |
0.33 |
| RF | 0.84 [0.76, 0.91] |
0.75 [0.60, 0.87] (33/44) |
0.82 [0.80, 0.84] (996/1218) |
0.86 [0.73, 0.95] (38/44) |
0.68 [0.66, 0.71] (832/1218) |
0.28 | ||
| CNN | 0.77 [0.69, 0.85] |
0.73 [0.57, 0.85] (32/44) |
0.76 [0.73, 0.78] (923/1218) |
0.71 [0.55, 0.83] (31/44) |
0.76 [0.74, 0.79] (930/1218) |
0.60 | ||
| Three-label | SVM | 0.83 [0.75, 0.90] |
0.84 [0.70, 0.93] (37/44) |
0.60 [0.57, 0.63] (733/1218) |
0.82 [0.67, 0.92] (36/44) |
0.66 [0.63, 0.68] (799/1218) |
0.57 | |
| RF | 0.83 [0.75, 0.90] |
0.82 [0.67, 0.92] (36/44) |
0.75 [0.72, 0.77] (911/1218) |
0.66 [0.50, 0.80] (29/44) |
0.82 [0.79, 0.84] (994/1218) |
0.63 | ||
| CNN | 0.80 [0.74, 0.87] |
0.73 [0.57, 0.85] (32/44) |
0.72 [0.69, 0.74] (875/1218) |
0.73 [0.57, 0.85] (32/44) |
0.72 [0.69, 0.74] (874/1218) |
0.50 | ||
| Three-label | Two-label | SVM | 0.86 [0.80, 0.92] |
0.61 [0.46, 0.76] (27/44) |
0.89 [0.87, 0.91] (1083/1218) |
0.73 [0.57, 0.85] (32/44) |
0.85 [0.82, 0.87] (1029/1218) |
0.42 |
| RF | 0.87 [0.82, 0.93] |
0.61 [0.46, 0.76] (27/44) |
0.90 [0.88, 0.92] (1099/1218) |
0.64 [0.48, 0.78] (28/44) |
0.89 [0.87, 0.91] (1085/1218) |
0.47 | ||
| CNN | 0.86 [0.80, 0.93] |
0.57 [0.41, 0.72] (25/44) |
0.92 [0.91, 0.94] (1126/1218) |
0.57 [0.41, 0.72] (25/44) |
0.93 [0.91, 0.94] (1131/1218) |
0.66 | ||
| Three-label | SVM | 0.86 [0.80, 0.92] |
0.71 [0.55, 0.83] (31/44) |
0.86 [0.84, 0.88] (1051/1218) |
0.77 [0.62, 0.89] (34/44) |
0.84 [0.82, 0.86] (1020/1218) |
0.47 | |
| RF | 0.85 [0.78, 0.91] |
0.80 [0.65, 0.90] (35/44) |
0.72 [0.69, 0.74] (874/1218) |
0.71 [0.55, 0.83] (31/44) |
0.82 [0.79, 0.84] (994/1218) |
0.59 | ||
| CNN | 0.85 [0.78, 0.92] |
0.75 [0.60, 0.87] (33/44) |
0.85 [0.83, 0.87] (1040/1218) |
0.75 [0.60, 0.87] (33/44) |
0.87 [0.85, 0.88] (1054/1218) |
0.66 |
[] denotes 95% confidential interval. () denotes Numerators and denominators.
AUC, area under curve; SVM, support vector machine; RF, random forest; CNN, convolutional neural network; th, threshold; YI, Youden Index
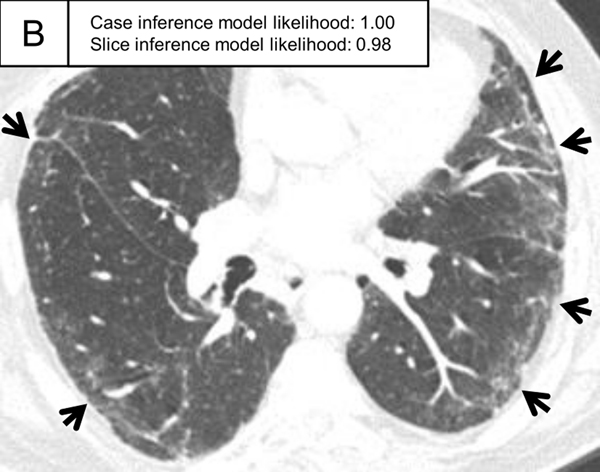
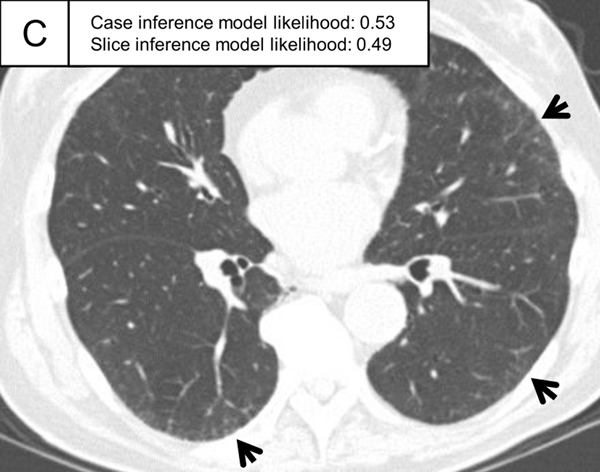
The ILA probability distribution of the best-performing AUC model (three-label method in slice inference model; two-label method and RF in case inference model) in the test set is shown in Figure 3. The distributions were shown separately for ILA, indeterminate and no ILA patients. Most ILA cases presented a probability of 1.0 (the rightmost bar), whereas indeterminate and no-ILA cases mostly presented a probability of less than 0.5, with many presenting 0.0 (the leftmost bar). The ROC curve of the best-performing AUC model is shown in Figure 4. The ILA probability distribution and ROC curves for the other 11 models are shown in the supplementary figures (The ILA probability distribution, Supplementary Figures S2-S12; ROC curves, Supplementary Figure S13). Representative cases with probability values of slice and case inference models are shown in Figure 5.
Figure 3.
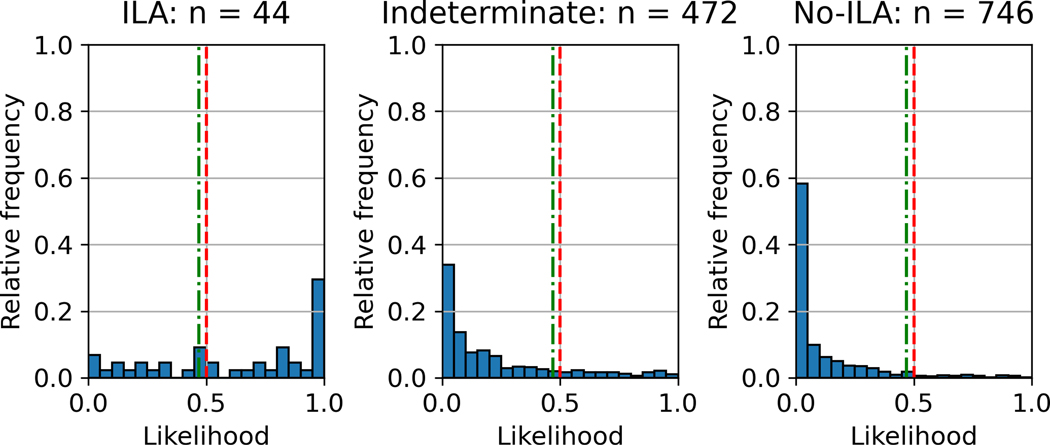
ILA probability distribution of case inference model using three-label method for slice inference model and two-label method and random forest for case inference model. The vertical axis is the relative frequency, which is the ratio of the number of cases presenting with the probability to the number of each group (ILA, n=44; indeterminate, n=472; no-ILA, n=746). The red and green lines represent the thresholds of 0.5 and the Youden index (0.47), respectively. The majority of ILA cases presented a probability of 1.0, whereas indeterminate and no-ILA cases mostly presented a probability of less than 0.5, with many presenting 0.0.
ILA, interstitial lung abnormality
Figure 4.
ROC curve for the three-label method for the slice inference model and the two-label method and random forest for the case inference model. This model achieved the AUC of 0.87. The red point represents the threshold of 0.5 with sensitivity and specificity of 0.61 and 0.90, respectively. The green point represents the threshold of the Youden index with sensitivity and specificity of 0.64 and 0.89, respectively.
ROC, receiver operating characteristic; AUC, area under the ROC curve.
Figure 5.
Representative ILA cases in the test set. (A, B) A patient with case inference model probability of 1.00. The slices showed ground-glass abnormality in the subpleural area of the bilateral lungs (arrows) and traction bronchiectasis in the lingula of the left lung (A, arrowhead). (C, D) A patient with case inference model probability of 0.53. Slight ground-glass abnormality was seen in the subpleural area of the bilateral lungs (C, arrows) and the slice inference model probability was moderate (0.49). At the lower slice level (D), ground-glass abnormality was more widespread (arrows) and the slice inference model probability (0.83) was higher than the slice in C. The probability was calculated with the model using the three-label method in the slice inference model and the two-label method and random forest in the case inference model.
ILA, interstitial lung abnormality
Discussion
In this study, we developed ILA probability prediction models using a stepwise machine learning approach in a lung cancer patient cohort. We tested two-/three-label methods for indeterminate slices or cases and tested SVM, RF, and CNN for the case inference model. Among the 12 models obtained, the integration of the three-label method within the slice inference model, coupled with a two-label approach and RF within the case inference model, achieved the highest AUC of 0.87.
Several studies have introduced machine learning into ILA identification, which segments interstitial findings (19–21). Chae et al. reported deep learning-based texture analysis for ILA identification showed an AUC of 0.99 using visual scoring for ground truth with a cut-off value of 1.8% of lung area (28). The advantages of texture analysis include quantifiable results and the criteria are clear. However, this method often loses location information, such as subpleural distribution, which requires further operations beyond simple thresholding. This study adopted a probability prediction model, which is a different approach from the texture analysis. In this approach, the axial location was taken into account to produce probabilities in the slice inference model. In addition, the annotation cost for training in texture analysis is high, whereas this approach is cost-effective since the images were simply labeled as present or absent.
When using the current algorithm in a screening setting, sensitivity is most important. The sensitivity at the threshold of the Youden index in the model with the best AUC was 0.64, which may not be sufficiently high for screening. Appropriate threshold settings need to be identified for clinical application. It is important to note that this result was based on visual scoring, a common, but imperfect method for ILA evaluation. The intra- and inter-reader agreement was not perfect (κw=0.74 and 0.46, respectively). Doyle et al. also reported that the interrater agreement was modest (kappa=0.43) (17). Determination of the best model or threshold should be based on more reliable clinical outcomes, such as survival.
In this study, the CNN-based models did not outperform RF- or SVM-based models. While RF and SVM use the probability of each slice directly as a feature, CNN generates new features through convolution and other operations. This process requires a large number of cases to generate effective features, which is limited in this study, possibly resulting in the lower performance of CNN models compared to RF and SVM models.
The model using the three-label method in the slice inference model and the two-label method in the case inference model showed the best AUC. This can be explained as follows: visually judging ILAs is usually done on a case-by-case basis, and the concept of ILA/indeterminate/no-ILA on an image-by-image basis is uncommon. Some cases of ILAs may have extensive findings in a few slices, while others may have minor findings in many slices. Given the gradations in the degree of findings, three labels may be appropriate for the slice inference model. As for the cases, some previous studies excluded indeterminate cases from the analysis or analyzed them together with no-ILA (7,22). In the test section of this study, indeterminate cases were regarded as just negative. Therefore, a two-label method may be appropriate for the case inference model. However, the differences in AUC among the models are small. As mentioned, the best method should be determined through analysis that includes external validation cohort and clinical outcomes.
This study presents several limitations. First, it relied on a single cohort without external validation, although internal validation was performed through a cohort split. Second, visual scoring was employed as the reference standard, and the study did not evaluate clinical outcomes. Third, we used thicker slice images (≥2mm) and three-quarters of the cases were contrast-enhanced CT, which might influence the ILA detection. We chose a cut-off of 2.5 mm because we could not include enough CT images with the cut-off of 1.5 mm. The contrast enhancement protocol was not unified in our cohort, which might affect the visual scoring. The images in our cohort were obtained from real clinical practice, leading to this limitation. Fourth, patients with preexisting ILD or at high risk of ILD were not excluded. According to the definition of ILAs by the Fleischner Society, abnormalities in patients with preexisting ILD or high risk of ILD are not considered ILAs. These patients should be excluded in the analysis of clinical outcomes, but our aim was to develop an automatic model for ILA identification. Lastly, the Boston Lung Cancer Study primarily consists of a lung cancer cohort, potentially impacting the accuracy of ILA identification due to the inclusion of lung nodules or masses in the CT scans. Our cancer cohort might include lymphangitis carcinomatosa or obstructive pneumonia due to cancer, which might affect visual scoring. Future research initiatives are planned to address these limitations by incorporating diverse cohorts and evaluating clinical outcomes to enhance the generalizability and robustness of the findings.
In summary, we successfully developed ILA probability prediction models, with some demonstrating high AUCs of up to 0.87. This automated approach to ILA evaluation holds promise for enhancing both clinical practice and research efforts. External validation and analysis of clinical outcomes are required in future studies.
Supplementary Material
Figure 6.
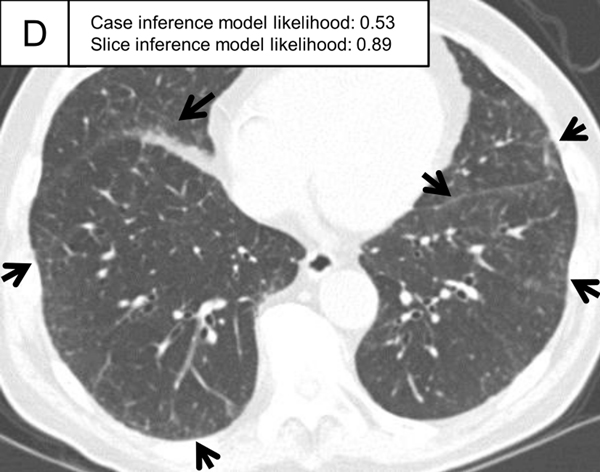
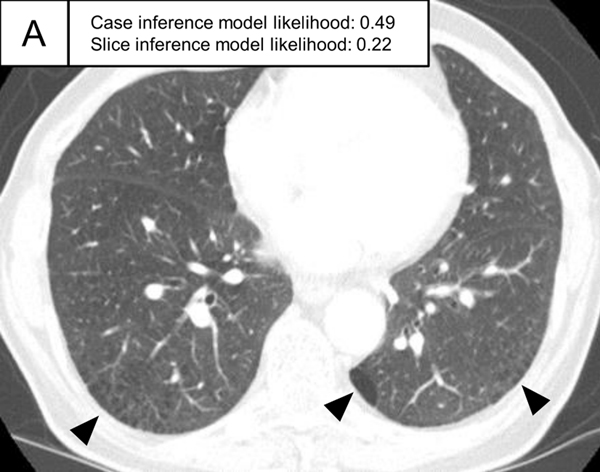
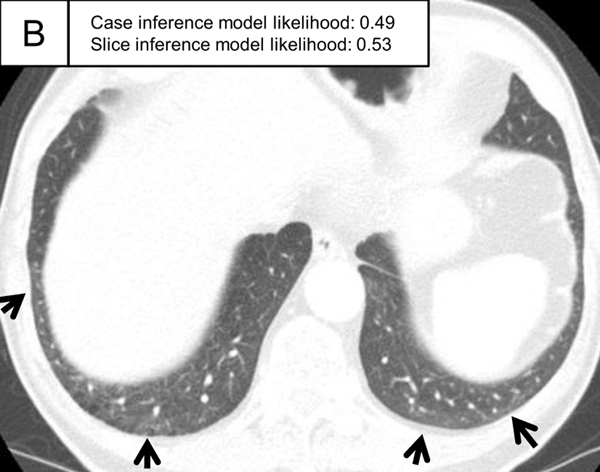
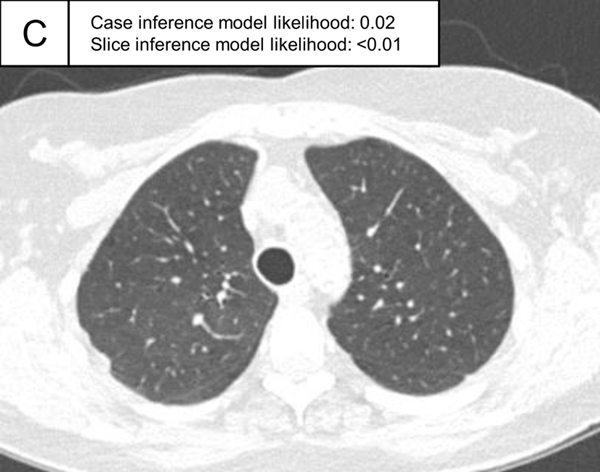
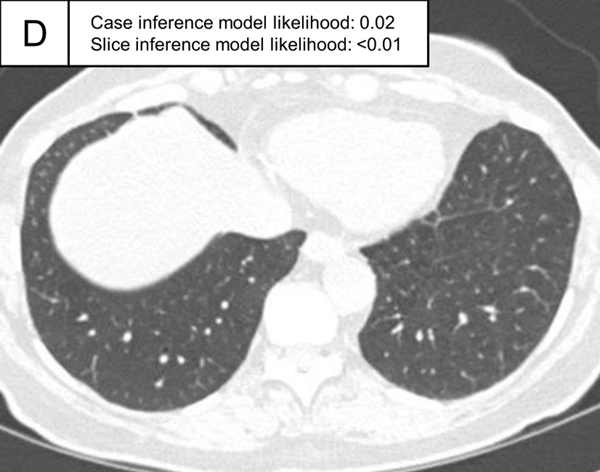
Representative cases indeterminate for ILA and without ILA in the test set. (A,B) A patient indeterminate for ILA and case inference model probability of 0.49. The slice in E showed only emphysema (non-ILA finding; triangle) and the slice inference model probability was low (0.22). The slice in F showed ground-glass abnormality (arrows), but the finding was considered as a dependent abnormality in the visual assessment. The slice inference model probability was moderate (0.49). (C,D) A patient without ILA and with case inference model probability of 0.02. There was no abnormality in the lung and the slice inference model probabilities were low (<0.01). The probabilities were calculated using the same model with Figure 5.
ILA, interstitial lung abnormality
Key Results.
In this retrospective study of 1,382 lung cancer patients, automatic interstitial lung abnormality identification was developed through a sequential process involving slice inference and case inference models.
To address indeterminate slices and cases, two- and three-label methods were introduced. The case inference model incorporated three machine learning models: support vector machine, random forest, and convolutional neural network.
AI models showed AUCs ranging from 0.77 to 0.87 and the top-performing model showed the sensitivity of 0.64 and the specificity of 0.89.
Funding information:
A.H. is supported by JP23K14837 (Grants-in-Aid for Scientific Research: KAKENHI)
M.N. is supported by NIH/NCI U01CA209414 and NIH/NCI R01CA203636.
G.M.H. is supported by grants NIH/NHLBI RO1HL111024, NIH/NHLBI R01HL130974, and NIH/NHLBI R01HL135142.
D.C.C. is supported by NIH/NCI U01CA209414
H.H. is supported by grants NIH/NCI R01CA203636, NIH/NCI U01CA209414, NIH/NHLBI R01HL111024, NIH/NHLBI R01HL135142, and NIH/NHLBI R01HL130974.
Brigham and Women’s Hospital is funded with a research grant from Canon Medical Systems Corporation.
The provisional US patent application with the serial number 63/610,842.
Abbreviations
- CNN
Convolution Neural Network
- ILAs
Interstitial Lung Abnormalities
- RF
Random Forest
- SVM
Support Vector Machine
Footnotes
Cohort overlap:
This study included patients in the Boston Lung Cancer Cohort (https://www.hsph.harvard.edu/blcs/). Some part of study population was used in previous studies, but automatic diagnosis of ILA has not been investigated.
Data and analysis:
The curation, analysis, and control of the data was performed by Akinori Hata, Takuya Hino, Noriaki Wada, Jiyeon Song, Xinan Wang, and Vladimir I. Valtchinov.
The calculated data using AI-based software was performed by Kota Aoyagi, and Masami Kawagishi.
References
- 1.Hatabu H, Hunninghake GM, Richeldi L, et al. Interstitial lung abnormalities detected incidentally on CT: a Position Paper from the Fleischner Society. Lancet Respir Med. 2020;8(7):726–737. doi: 10.1016/S2213-2600(20)30168-5. [DOI] [PMC free article] [PubMed] [Google Scholar]
- 2.Hata A, Schiebler ML, Lynch DA, Hatabu H. Interstitial Lung Abnormalities: State of the Art. Radiology. 2021;301(1):19–34. doi: 10.1148/radiol.2021204367. [DOI] [PMC free article] [PubMed] [Google Scholar]
- 3.Putman RK, Rosas IO, Hunninghake GM. Genetics and early detection in idiopathic pulmonary fibrosis. American Journal of Respiratory and Critical Care Medicine. 2014;189(7):770–778. doi: 10.1164/rccm.201312-2219PP. [DOI] [PMC free article] [PubMed] [Google Scholar]
- 4.Araki T, Putman RK, Hatabu H, et al. Development and progression of interstitial lung abnormalities in the Framingham Heart Study. American Journal of Respiratory and Critical Care Medicine. 2016;194(12):1517–1522. doi: 10.1164/rccm.201512-2523OC. [DOI] [PMC free article] [PubMed] [Google Scholar]
- 5.Axelsson G, Putman R, Aspelund T, et al. The Associations of Interstitial Lung Abnormalities with Cancer Diagnoses and Mortality. European Respiratory Journal. European Respiratory Society; 2020;56(6):1902154. doi: 10.1183/13993003.02154-2019. [DOI] [PMC free article] [PubMed] [Google Scholar]
- 6.Lee JE, Chae KJ, Suh YJ, et al. Prevalence and Long-term Outcomes of CT Interstitial Lung Abnormalities in a Health Screening Cohort. Radiology. Radiological Society of North America; 2023;306(2):e221172. doi: 10.1148/RADIOL.221172. [DOI] [PubMed] [Google Scholar]
- 7.Putman RK, Hatabu H, Araki T, et al. Association between interstitial lung abnormalities and all-cause mortality. JAMA. 2016;315(7):672–681. doi: 10.1001/jama.2016.0518. [DOI] [PMC free article] [PubMed] [Google Scholar]
- 8.Grant-Orser A, Min B, Elmrayed S, Podolanczuk AJ, Johannson KA. Prevalence, Risk Factors, and Outcomes of Adult Interstitial Lung Abnormalities: A Systematic Review and Meta-Analysis. Am J Respir Crit Care Med. 2023;208(6):695–708. doi: 10.1164/rccm.202302-0271OC. [DOI] [PMC free article] [PubMed] [Google Scholar]
- 9.Putman RK, Gudmundsson G, Araki T, et al. The MUC5B promoter polymorphism is associated with specific interstitial lung abnormality subtypes. European Respiratory Journal. European Respiratory Society; 2017;50(3). doi: 10.1183/13993003.00537-2017. [DOI] [PMC free article] [PubMed] [Google Scholar]
- 10.Putman RK, Axelsson GT, Ash SY, et al. Interstitial lung abnormalities are associated with decreased mean telomere length. European Respiratory Journal. 2022;2101814. doi: 10.1183/13993003.01814-2021. [DOI] [PMC free article] [PubMed]
- 11.Axelsson GT, Gudmundsson G, Pratte KA, et al. The Proteomic Profile of Interstitial Lung Abnormalities. American Journal of Respiratory and Critical Care Medicine. American Thoracic Society; 2022;206(3):337–346. doi: 10.1164/rccm.202110-2296OC. [DOI] [PMC free article] [PubMed] [Google Scholar]
- 12.Putman RK, Gudmundsson G, Axelsson GT, et al. Imaging patterns are associated with interstitial lung abnormality progression and mortality. American Journal of Respiratory and Critical Care Medicine. American Thoracic Society; 2019;200(2):175–183. doi: 10.1164/rccm.201809-1652OC. [DOI] [PMC free article] [PubMed] [Google Scholar]
- 13.Chae KJ, Chung MJ, Jin GY, et al. Radiologic-pathologic correlation of interstitial lung abnormalities and predictors for progression and survival. European Radiology. 2022;32(4):2713–2723. doi: 10.1007/s00330-021-08378-8. [DOI] [PubMed] [Google Scholar]
- 14.Chae KJ, Jin GY, Goo JM, Chung MJ. Interstitial Lung Abnormalities: What Radiologists Should Know. Korean J Radiol. 2021;22(3):454–463. doi: 10.3348/kjr.2020.0191. [DOI] [PMC free article] [PubMed] [Google Scholar]
- 15.Axelsson GT, Gudmundsson G. Interstitial lung abnormalities - current knowledge and future directions. Eur Clin Respir J. 2021;8(1):1994178. doi: 10.1080/20018525.2021.1994178. [DOI] [PMC free article] [PubMed] [Google Scholar]
- 16.Lee KS, Han J, Wada N, et al. Imaging of Pulmonary Fibrosis: An Update, From the AJR Special Series on Imaging of Fibrosis. AJR Am J Roentgenol. 2023; doi: 10.2214/AJR.23.29119. [DOI] [PubMed]
- 17.Doyle TJ, Washko GR, Fernandez IE, et al. Interstitial lung abnormalities and reduced exercise capacity. American Journal of Respiratory and Critical Care Medicine. 2012;185(7):756–762. doi: 10.1164/rccm.201109-1618OC. [DOI] [PMC free article] [PubMed] [Google Scholar]
- 18.Wille MMW, Thomsen LH, Dirksen A, Petersen J, Pedersen JH, Shaker SB. Emphysema progression is visually detectable in low-dose CT in continuous but not in former smokers. Eur Radiol. 2014;24(11):2692–2699. doi: 10.1007/s00330-014-3294-7. [DOI] [PubMed] [Google Scholar]
- 19.Ash SY, Harmouche R, Ross JC, et al. The Objective Identification and Quantification of Interstitial Lung Abnormalities in Smokers. Academic Radiology. Elsevier USA; 2017;24(8):941–946. doi: 10.1016/j.acra.2016.08.023. [DOI] [PMC free article] [PubMed] [Google Scholar]
- 20.Bermejo-Peláez D, Ash SY, Washko GR, San José Estépar R, Ledesma-Carbayo MJ. Classification of Interstitial Lung Abnormality Patterns with an Ensemble of Deep Convolutional Neural Networks. Sci Rep. 2020;10(1):338. doi: 10.1038/s41598-019-56989-5. [DOI] [PMC free article] [PubMed] [Google Scholar]
- 21.Kim MS, Choe J, Hwang HJ, et al. Interstitial lung abnormalities (ILA) on routine chest CT: Comparison of radiologists’ visual evaluation and automated quantification. Eur J Radiol. 2022;157:110564. doi: 10.1016/j.ejrad.2022.110564. [DOI] [PubMed] [Google Scholar]
- 22.Hida T, Hata A, Lu J, et al. Interstitial lung abnormalities in patients with stage I non-small cell lung cancer are associated with shorter overall survival: the Boston lung cancer study. Cancer Imaging. BioMed Central Ltd; 2021;21(1):14. doi: 10.1186/s40644-021-00383-w. [DOI] [PMC free article] [PubMed] [Google Scholar]
- 23.Washko GR, Lynch DA, Matsuoka S, et al. Identification of Early Interstitial Lung Disease in Smokers from the COPDGene Study. Academic Radiology. 2010;17(1):48–53. doi: 10.1016/j.acra.2009.07.016. [DOI] [PMC free article] [PubMed] [Google Scholar]
- 24.Washko GR, Hunninghake GM, Fernandez IE, et al. Lung Volumes and Emphysema in Smokers with Interstitial Lung Abnormalities. New England Journal of Medicine. Massachussetts Medical Society; 2011;364(10):897–906. doi: 10.1056/NEJMoa1007285. [DOI] [PMC free article] [PubMed] [Google Scholar]
- 25.Hunninghake GM, Hatabu H, Okajima Y, et al. MUC5B Promoter Polymorphism and Interstitial Lung Abnormalities. New England Journal of Medicine. Massachussetts Medical Society; 2013;368(23):2192–2200. doi: 10.1056/NEJMoa1216076. [DOI] [PMC free article] [PubMed] [Google Scholar]
- 26.Araki T, Dahlberg SE, Hida T, et al. Interstitial lung abnormality in stage IV non-small cell lung cancer: A validation study for the association with poor clinical outcome. Eur J Radiol Open. 2019;6:128–131. doi: 10.1016/j.ejro.2019.03.003. [DOI] [PMC free article] [PubMed] [Google Scholar]
- 27.Landis JR, Koch GG. The Measurement of Observer Agreement for Categorical Data. Biometrics. JSTOR; 1977;33(1):159. doi: 10.2307/2529310. [DOI] [PubMed] [Google Scholar]
- 28.Chae KJ, Lim S, Seo JB, et al. Interstitial Lung Abnormalities at CT in the Korean National Lung Cancer Screening Program: Prevalence and Deep Learning-based Texture Analysis. Radiology. 2023;307(4):e222828. doi: 10.1148/radiol.222828. [DOI] [PubMed] [Google Scholar]
Associated Data
This section collects any data citations, data availability statements, or supplementary materials included in this article.


