

Abstract
Methods for identifying species by using short orthologous DNA sequences, known as “DNA barcodes,” have been proposed and initiated to facilitate biodiversity studies, identify juveniles, associate sexes, and enhance forensic analyses. The cytochrome c oxidase 1 sequence, which has been found to be widely applicable in animal barcoding, is not appropriate for most species of plants because of a much slower rate of cytochrome c oxidase 1 gene evolution in higher plants than in animals. We therefore propose the nuclear internal transcribed spacer region and the plastid trnH-psbA intergenic spacer as potentially usable DNA regions for applying barcoding to flowering plants. The internal transcribed spacer is the most commonly sequenced locus used in plant phylogenetic investigations at the species level and shows high levels of interspecific divergence. The trnH-psbA spacer, although short (≈450-bp), is the most variable plastid region in angiosperms and is easily amplified across a broad range of land plants. Comparison of the total plastid genomes of tobacco and deadly nightshade enhanced with trials on widely divergent angiosperm taxa, including closely related species in seven plant families and a group of species sampled from a local flora encompassing 50 plant families (for a total of 99 species, 80 genera, and 53 families), suggest that the sequences in this pair of loci have the potential to discriminate among the largest number of plant species for barcoding purposes.
Keywords: angiosperm, internal transcribed spacer, Plummers Island, species identification, trnH-psbA
The identification of animal biological diversity by using molecular markers has recently been proposed and demonstrated on a large scale through the use of a short DNA sequence in the cytochrome c oxidase 1 (CO1) gene (1-5). These “DNA barcodes” show promise in providing a practical, standardized, species-level identification tool that can be used for biodiversity assessment, life history and ecological studies, and forensic analysis. Engineered DNA sequences also have been suggested as exact identifiers and intellectual property tags for transgenic organisms (6). A Consortium for the Barcode of Life (www.barcoding.si.edu) has been established to stimulate the creation of a database of documented and vouchered reference sequences to serve as a universal library to which comparisons of unidentified taxa can be made. Here, we propose two DNA regions for barcoding plants and provide an initial test of their utility.
DNA barcoding follows the same principle as does the basic taxonomic practice of associating a name with a specific reference collection in conjunction with a functional understanding of species concepts (i.e., interpreting discontinuities in interspecific variation). Presently, some controversy exists over the value of DNA barcoding (7), largely because of the perception that this new identification method would diminish rather than enhance traditional morphology-based taxonomy, that species determinations based solely on the amount of genetic divergence could result in incorrect species recognition, and that DNA barcoding is a means to reconstruct phylogenies when it is actually a tool to be used largely for identification purposes (8-10). In support of barcoding as a species identification process, Besansky et al. (11), Janzen (12, 13), Hebert et al. (1-4), and Kress (14) have offered arguments for the utility of DNA barcoding as a powerful framework for identifying specimens. Our objective in this paper is not to debate the validity of using barcodes for plant identification, but rather to determine appropriate DNA regions for use in flowering plants.
A portion of the mitochondrial CO1 gene was deliberately chosen for use in animal identification when DNA barcoding was proposed (1), and its broad utility in animal systems has been demonstrated in subsequent pilot studies (1-5). The taxonomic limits of CO1 barcoding in animals are not fully known, but it has proven useful to discriminate among species in most groups tested (2). The choice of a DNA region usable for barcoding has been little investigated in other eukaryotes, whereas in prokaryotes, rRNA genes are favored for identifications (e.g., ref. 15). Among plants, especially angiosperms, DNA-based identifications, although not strictly through the use of DNA barcodes, have been creatively used to reconstruct extinct herbivore diets (16, 17), to identify species of wood (18), to correlate roots growing in Texas caves with the surface flora (19), and to determine species used in herbal supplements (20). However, some of these identifications have not been entirely successful at the species level, and DNA barcoding per se has not yet been applied to plants. The primary reason that barcoding has not been applied to plants by the emerging initiative is that plant mitochondrial genes, because of their low rate of sequence change, are poor candidates for species-level discrimination. The divergence of CO1 coding regions among families of flowering plants has been documented to be only a few base pairs across 1.4 kb of sequence (21, 22). Furthermore, plants rapidly change their mitochondrial genome structure (23), thereby precluding the existence of universal intergenic spacers that otherwise would be appropriately variable unique identifiers at the species level (e.g., ref. 24).
For plant molecular systematic investigations at the species level, the internal transcribed spacer (ITS) region of the nuclear ribosomal cistron (18S-5.8S-26S) is the most commonly sequenced locus (25). This region has shown broad utility across photosynthetic eukaryotes (with the exception of ferns) and fungi and has been suggested as a possible plant barcode locus (26). Species-level discrimination and technical ease have been validated in most phylogenetic studies that employ ITS, and a large body of sequence data already exists for this region (>36,000 angiosperm sequences were available in GenBank in December 2004, although these sequences have not been filtered for taxa, so it is not certain how many species are represented). However, the limitations of this nuclear region in some taxa are well established. ITS has reduced species-level variability in certain groups (especially recently diverged taxa on islands), divergent paralogues that require cloning of multiple copies, and secondary structure problems resulting in poor-quality sequence data (25, 27). In some cases, the preferential amplification of endophytic or contaminating fungi may occur, although this can be eliminated with plant-specific primer design (28, 29).
An advantage of the ITS region is that it can be amplified in two smaller fragments (ITS1 and ITS2) adjoining the 5.8S locus, which has proven especially useful for degraded samples. The quite conserved 5.8S region in fact contains enough phylogenetic signal for discrimination at the level of orders and phyla (29), although identification at this taxonomic level is not the concern of barcoding. Alignments are trivial to optimize for 5.8S due to the few indels found in plants and fungi (30). In contrast for phylogenetic reconstruction, ITS or any rapidly evolving noncoding region can require complex sequence alignment for homology assessments. Thus, the 5.8S locus can serve as a critical alignment-free anchor point for search algorithms that make sequence comparisons for both phylogenetic and barcoding purposes. The utility of conserved regions such as 5.8S to generate a pool of nearest neighbors for refined comparisons will be critical for effective database searches, especially when comparing a sequence that has no identical match in a sequence library. GenBank blast searches with our ITS data (see below) returned correct matches for the sequences in GenBank. This success suggests that despite alignment concerns, current search algorithms will be fast and effective at using ITS for species-level identifications, given an adequate database for comparison. For all of these reasons, ITS, even with its recognized limitations, is a prime candidate as an effective locus for DNA barcoding in plants.
However, the recognition that ITS has certain functional limitations for DNA barcoding of plants is a compelling argument that a search for additional loci is warranted. For phylogenetic investigations, the plastid genome has been more readily exploited than the nuclear genome and may offer for plant barcoding what the mitochondrial genome does for animals. It is a uniparentally inherited, nonrecombining, and, in general, structurally stable genome. Universal primers are available for a number of loci and intergenic spacers that are evolving at a variety of rates. The plastid locus most commonly sequenced by plant systematists for phylogenetic purposes is rbcL, followed by the trnL-F intergenic spacer, matK, ndhF, and atpB (e.g., refs. 31-33). rbcL has been suggested as a candidate for plant barcoding (34), even though it has generally been used to determine evolutionary relationships at the generic level and above. Besides rbcL and atpB, all of the latter plastid loci have been used at the species level with various degrees of success. Most of them (except the trnL-F spacer) require full-length sequences of >1 kb to yield enough sequence length to discriminate species. Most relevant to plant barcoding, no region of the plastid genome has been found to have the high level of variation seen in most animal CO1 barcodes, although a few intergenic spacers have shown more promise than any plastid locus now in general use (33).
When evaluating other genetic loci appropriate for plant DNA barcoding, three criteria must be satisfied: (i) significant species-level genetic variability and divergence, (ii) an appropriately short sequence length so as to facilitate DNA extraction and amplification, and (iii) the presence of conserved flanking sites for developing universal primers. With regard to sequence length, we note that in CO1 barcoding systems, the 600- to 700-bp length fortuitously matches high-quality sequence data from average capillary sequencer reads, although it is expected that routine read length will improve with new technology. An important rationale for using short sequences also resides in the need to obtain useful data from potentially degraded samples found in museum specimens. Amplicon size and gene copy number have been shown to account for much of the variability of amplification success: smaller sizes and increased copy number promote greater success with PCR, presumably by increasing the likelihood that a desired sequence has been preserved (18).
Materials and Methods
Determining Suitable Regions of the Genome. To screen for appropriate levels of sequence divergence in the plastid genome, we chose two closely related flowering plant species for comparison, Atropa belladonna and Nicotiana tabacum (Solanaceae). Both species have complete sequence data available for their plastid genomes (35-37). Twenty-nine additional complete plastid genomes spread across a wide range of plant groups are also available for comparison: algae (five genera in various families), mosses and liverworts (three genera in different families), ferns and relatives (three genera in different families), gymnosperms (two species in the genus Pinus), and angiosperms (eight genera in eight different families, two genera in the Fabaceae, and four genera and several cultivars in the Poaceae). We selected Nicotiana and Atropa, even though they belong to different subfamilies of Solanaceae (38), because they represent the most closely related taxa among the genomes available in the angiosperms. The complete plastid genomes of the taxa in the Fabaceae and the Poaceae include cultivars, hybrids, and more distantly related genera. We aligned the Nicotiana and Atropa genomes, and raw divergence levels (i.e., number of base-pair discordances divided by length of sequence under consideration) were individually estimated across all genes, introns, and intergenic spacers (Fig. 1). Plastid regions with raw sequence differences ≥2% (Table 1) were categorized as the most variable segments, and therefore the most promising of the plastid genome for DNA barcoding when normalized for length. The nuclear ITS region and plastid rbcL gene were used as baseline comparisons for these chloroplast test regions (Table 1). To further narrow down the number of remaining regions usable for barcoding purposes, we applied a sequence criterion of 300-800 bp and a stable presence across multiple plastid genomes of both monocots and dicots.
Fig. 1.

Plastid genome variation between deadly nightshade (A. belladonna; shown) and tobacco (N. tabacum), adapted from Shinozaki et al. (35). Shown are a complete genome (A), loci with ≥1% sequence difference between species (B), and loci with ≥2% sequence difference between species (C). The letters in C correspond to spacer regions listed in Table 1.
Table 1. Sampled loci in plastid genomes of Atropa belladonna and Nicotiana tabacum that were found to have base-pair sequence divergences ≥2%.
| Locus | Sequence length, bp (Atropa/Nicotiana) | Indels for pairwise alignment | Percent sequence divergence between Atropa and Nicotiana |
|---|---|---|---|
| trnK-rps16 (B) | 707/685 | 6 | 4.1 |
| trnH-psbA (A) | 412/453 | 8 | 3.9 |
| rpl36-rps8 (I) | 451/426 | 4 | 3.0 |
| atpB-rbcL (H) | 815/818 | 1 | 2.8 |
| ycf6-psbM (D) | 1,091/1,135 | 9 | 2.8 |
| trnV-atpE (G) | 494/485 | 2 | 2.6 |
| trnC-ycf6 (C) | 681/670 | 4 | 2.4 |
| psbM-trnD (E) | 1,099/1,081 | 10 | 2.4 |
| trnL-F (F) | 363/357 | 2 | 2.2 |
| rbcL | 1,434/1,434 (including stop codon) | 0 | 0.83 |
| ITS | 622/628 | 7 | 13.6 |
Values for the rbcL locus and ITS region are provided for comparison. Letters in parentheses correspond to plastid regions in Fig. 1C.
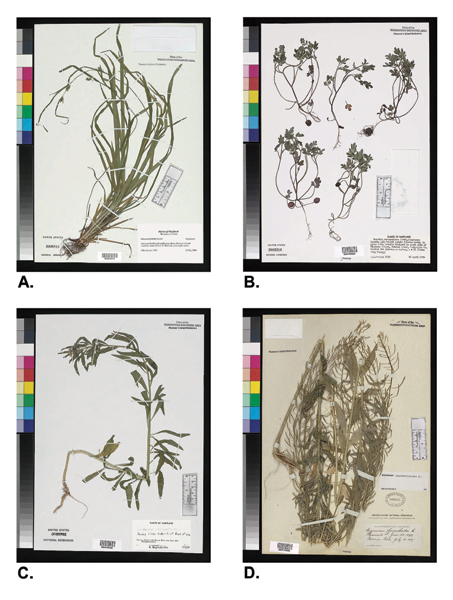
Selecting Taxa for Testing. To empirically test the regions identified as most appropriate for barcoding in our comparison of the plastid genomes of Atropa and Nicotiana (Table 1), we selected two sets of flowering plant taxa. The first taxon set consisted of 2 or 3 species in each of eight genera spread across seven families of plants for a total of 19 species (Table 2 and Table 3, which is published as supporting information on the PNAS web site). The second taxon set included a geographically circumscribed flora comprised of taxa that are not closely related but represent a broad range of angiosperms in 50 plant families, including 83 species in 72 genera (Table 3). The selection of the two taxon sets was made so as to test each locus for appropriate sequence length and divergence, primer success across a wide taxonomic spectrum, and the viability of routinely extracting DNA from dried herbarium specimens, compared with fresh or silica-dried tissue. The species in the first taxon set were selected because they represent a diverse set of species pairs across the angiosperms (including monocots and dicots) with various levels of phylogenetic distance as previously shown in research by the authors using other genetic markers (W.J.K. and K.J.W., unpublished data). In addition, high-quality DNA extractions from living plants, silica-dried tissue, and/or herbarium specimens were readily available for these taxa. The genera were not selected randomly and were not biased a priori toward low or high levels of interspecific divergence. The second taxon set was selected to represent a floristic sample that would be used in a typical plant DNA barcoding project. The samples were taken from Plummers Island, MD, a National Park Service habitat reserve in the Potomac River that has been studied and inventoried by biologists in the Washington, DC, area for >100 years, making it an appropriate test site for barcoding trials. For the Plummers Island taxa, tissue samples were taken from dried leaves only on herbarium specimens located in the U.S. National Herbarium (Smithsonian Institution) collected between 1960 and 2000 (Table 3). These samples were used to compare ITS and rbcL as standards to the best plastid regions identified in the tests of taxon set one. A smaller set of older herbarium collections of Erysimum cheiranthoides (Brassicaceae) prepared as early as 1897 were compared with more recent collections made as recently as 1997 from the same populations to empirically test the relationship between specimen preservation status, age, and DNA quality (see Fig. 2, which is published as supporting information on the PNAS web site).
Table 2. Sequence length and percent sequence divergence for nine plastid regions sampled for eight genera from taxon set one.
| Genus (family: number of species sampled) | trnH-psbA, length (bp)/% divergence | rpl36-rps8, length (bp)/% divergence | trnK-rps16, length (bp)/% divergence | trnV-atpE, length (bp)/% divergence | trnC-ycf6, length (bp)/% divergence | ycf6-psbM, length (bp)/% divergence | psbM-trnD, length (bp)/% divergence | atpB-rbcL, length (bp)/% divergence | trnL-F, length (bp)/% divergence | ITS, length (bp)/% divergence |
|---|---|---|---|---|---|---|---|---|---|---|
| Solidago (Asteraceae: 3 spp.) | 204-220/0.0, 0.0, 0.0 | 547/0.0, 0.18, 0.18 | 712-720/0.0, 0.13, 0.13 | 502-509/0.0, 0.19, 0.19 | 536-543/0.0, 0.18, 0.18 | 618/0.0, 0.0, 0.0 | Missing | Missing | 389/0.0, 0.0, 0.0 | Missing |
| Carex (Cyperaceae: 2 spp.) | 497/1.5 | 532/0.5 | Missing | Missing | 462-540/0.19 | 441/0.45 | 1,164-1,240/0.16 | 795-812/0.38 | 377/0.53 | 570 (one species only) |
| Conceveiba (Euphorbiaceae: 2 spp.) | 630-645/0.23 | 555-567/0.35 | 695-697/0.19 | 820/0.12 | 550-556/1.8 | 1,366-1,373/0.35 | 798-805/0.75 | 832/0.24 | 439-447/0.0 | 660-661/0.75 |
| Suregada (Euphorbiaceae: 2 spp.) | 427/0.47 | 543/0.18 | Missing | Missing | Missing | Missing | Missing | Missing | 396-397/0.0 | 709/0.56 |
| Alloplectus (Gesneriaceae: 3 spp.) | 330/0.30, 0.61, 0.91 | 532-543/0.0, 0.15, 0.15 | 762/0.13, 0.13, 0.32 | 598/0.0, 0.18, 0.18 | 255/0.0, 0.39, 0.39 | 1050/0.10, 0.19, 0.19, 0.29 | 713-720/0.0, 0.26, 0.26 | 857-859/0.23, 0.35, 0.47 | 342-345/0.0, 0.29, 0.29 | 626/0.0, 2.4, 2.4 |
| Heliconia (Heliconiaceae: 2 spp.) | 510/0.59 | 520/0.19 | 780/0.38 | 860/0.23 | 1,073-1,075/0.46 | 1,460-1,461/0.14 | 1,100/0.18 | 868/0.13 | 343/0.58 | Missing |
| Austrobuxus (Picrodendraceae: 2 spp.) | 567-569/1.1 | 569/0.53 | 743/0.23 | 841/0.12 | 610-612/0.57 | 983-987/0.33 | 815-821/0.41 | 760-764/0.36 | 395-407/0.24 | 647-650/4.4 |
| Psychotria (Rubiaceae: 3 spp.) | 414-430/1.3, 5.1, 5.2 | 527-535/0.56, 0.75, 2.4 | 760-785/0.76, 0.89, 1.1 | 542-567/0.53, 0.71, 0.82 | 696-717/0.14, 1.4, 1.5 | 887-908/0.22, 0.88, 0.90 | 968-980/0.41, 0.61, 0.71 | 647-662/0.75, 0.91, 2.5 | 321-336/0.0, 2.1, 2.1 | 560-562/1.7, 6.0, 7.1 |
| Mean sequence length across all species pairs (range), bp | 450 (204-645) | 543 (520-569) | 745 (695-785) | 697 (502-860) | 605 (255-1,075) | 975 (441-1,461) | 935 (713-1,240) | 796 (647-868) | 377 (321-447) | 629 (560-709) |
| Mean sequence divergence across all species pairs (range) | 1.24 (0.0-5.2) | 0.44 (0.0-2.4) | 0.37 (0.0-1.1) | 0.27 (0.0-0.82) | 0.55 (0.0-1.8) | 0.30 (0.0-0.90) | 0.38 (0.0-0.75) | 0.63 (0.13-2.5) | 0.44 (0.0-2.1) | 2.81 (0.0-7.1) |
For each genus divergence values were calculated as base pair substitution differences between species pairs. The highest divergence value for each species pair across the nine plastid regions is indicated in boldface. Values for ITS are included for comparison. Missing values are the result of poor amplification success. For the list of species sampled, voucher data, and GenBank accession numbers see Table 3.
DNA Analysis. New DNA extractions were performed with the DNeasy Plant Mini kit (Qiagen, Valencia, CA) after tissue disruption of 0.5-1 cm2 of leaf tissue in a FastPrep FP-120 bead mill (Qbiogene, Carlsbad, CA). DNA extractions followed manufacturer's protocols with the modification of buffer AP1 lysis conditions by the addition of 0.4 mg of proteinase, 15 mg of DTT, and incubation at 42°C for 12 h on a rocking platform. This method can easily be scaled up to a 96-well format for large-scale (high-throughput) barcoding purposes. Amplification by PCR used puReTaq Ready-To-Go PCR beads (Amersham Pharmacia Biosciences) and direct sequencing of purified PCR products used bigdye 3.1 software on a 3100 sequencer, both from Applied Biosystems. Universal primers for selected genes and intergenic spacers were taken from investigations described in refs. 39-41 and Table 4, which is published as supporting information on the PNAS web site. Comparative rbcL data were generated for the Plummers Island flora by splitting the gene into two overlapping fragments (1f-724r and 636f-1368r), because test amplifications on a portion of the samples netted only 31% success as a full-length fragment vs. 94% as two pieces.
Results
In our comparison of the Atropa and Nicotiana plastid genomes, the most variable regions that tentatively met the barcode criteria were nine intergenic spacers: trnK-rps16, trnH-psbA, rp136-rps8, atpB-rbcL, ycf6-psbM, trnV-atpE, trnC-ycf6, psbM-trnD, and trnL-F (listed in order of decreasing variability; Table 1 and Fig. 1). By comparison, ITS had a much higher divergence value (13.6%) than any of the plastid regions, and rbcL was by far the lowest in divergence (0.83%). Although three spacers (atpB-rbcL, ycf6-psbM, and psbM-trnD) were slightly to moderately longer than our 800-bp cutoff, we included them in our further analysis because of their high interspecific variability.
The results of our intrageneric tests across eight genera in the first taxon set demonstrated conspicuous differences between the nine plastid regions with respect to our three barcoding criteria: amplification success, sequence length, and sequence divergence. Only three regions (trnH-psbA, rp136-rpf8, and trnL-F) were successfully amplified for all eight genera and 19 species; the other regions, including ITS, could not be amplified in one or more taxa (Table 2). Sequence length in the nine plastid regions ranged from 204 to 1,240 bp, with mean length in all but two (ycf6-psbM and psbM-trnD) falling within our 300- to 800-bp optimum length criterion (Table 2). ITS had the highest between-species sequence divergence values in four of the five genera successfully amplified (Table 2), with a mean sequence divergence of 2.81% across the five genera. trnH-psbA ranked first in divergence value in six of the eight genera and in 11 of the 14 species pairs, compared with the other eight plastid regions; trnV-atpE and trnC-ycf6 ranked highest for the remaining two genera and three species pairs (Table 2). trnH-psbA ranked highest (1.24%) in mean percent sequence divergence across all genera, whereas trnV-atpE (0.29%) and ycf6-psbM (0.30%) ranked lowest (Table 2).
In our broader taxonomic sampling of the Plummers Island flora in which only herbarium material was used, none of the loci could be successfully amplified for all of the 83 species tested, which we suggest may be related to primer design or to more fundamental changes in gene structure during herbarium specimen preparation and storage (see ref. 33). Amplification success was highest for trnH-psbA (100%), followed by rbcL (5′ half; 95%), and ITS (88%, although high-quality sequence data were not obtained from all ITS amplifications). We could not detect any general correlation between specimen age and amplification success, indicating that herbarium specimens in apparently good condition and as old as 20 years can be successfully used to establish DNA-sequence reference libraries. Moreover, amplification of full-length ITS was possible (results not shown) for the five specimens of Erysimum cheiranthoides collected between 1897 and 1997 (Fig. 2), indicating that significantly older specimens also may be used.
Because of the high sequence divergence value in the majority of genera in our taxon set one and the high amplification success of the trnH-psbA spacer in all of our test samples, this region became the focus of our examination of the plastid genome for further analyses of barcoding potential. The trnH-psbA amplicon ranged from 247 to 1,221 bp, whereas the intergenic spacer alone (excluding primer-binding regions and small regions of flanking exon) ranged from 119 to 1,094 bp across 53 families of flowering plants, including both the Plummers Island species and the taxonomic groups (extremes were Thalictrum and Trillium, respectively; see Table 2 and Table 5, which is published as supporting information on the PNAS web site). Most taxa (92%) had amplicons falling between 340 and 660 bp, which is within our suggested length criterion for successful barcoding. All species in our sampling had unique trnH-psbA spacer sequences, which is very relevant to the question of using this gene for barcoding plants.
Discussion
The ITS and rbcL loci provide a baseline against which to compare other genes and intergenic spacers in our directed search for sequences to use in plant DNA barcoding. Besides ITS, those single-copy nuclear genes or their introns that are gaining prominence in species-level molecular systematics studies (e.g., leafy, waxy, pistillata, and RPB2), also were considered. However, because of the lack of universal primers (either published or with potential development by using current information) and poor success by using existing primers, these loci have been eliminated as potential barcode loci. The poor success by using existing primers is probably due to the difficulty of amplifying genes with low numbers of copies in degraded samples and the frequent need to clone PCR products before sequencing. We, therefore, turned our attention to the plastid genome in search of the most variable sequences that would also meet the criteria needed for maximum utility (i.e., variability, universal primers, and short length) and that could be used in place of or in addition to the ITS region. The significantly greater length of rbcL (usually 1,428 bp; Tables 1 and 2) causes problems because it is necessary to use four primers for double-stranded sequencing of the entire gene. Although this number of primers is equivalent to that needed if a two-loci system is used for barcoding purposes, the level of interspecific variation we observed in rbcL is less than the variation detected in either ITS or trnH-psbA alone (Table 2). Furthermore, this gene has been previously discounted for discrimination at the species level (e.g., refs. 31, 42, and 43).
We suggest that the trnH-psbA intergenic spacer is the best plastid option for a DNA barcode sequence that has good priming sites, length, and interspecific variation. In our trials across a diverse set of genera in seven plant families, three plastid regions (trnH-psbA, rp136-rpf8, and trnL-F) ranked highest with respect to amplification success and appropriate sequence length, but trnH-psbA demonstrated nearly 3 times the percentage sequence divergence of these other two regions (1.24% in trnH-psbA vs. 0.44% in both rp136-rpf8 and trnL-F; Table 2). The two spacers with the next highest mean sequence divergence after trnH-psbA (atpB-rbcL at 0.63% and trnC-ycf6 at 0.55%) could not be amplified in one or more of the test genera. In only one genus (Solidago; Asteraceae), exceptionally low sequence divergence in trnH-psbA prevented discrimination among the three species tested, although insertion/deletion differences still allowed us to distinguish among the species. This lack of sequence divergence between taxa was true for one or more species pairs in ITS and all other plastid spacers, except atpB-rbcL, in our test sample. In only 2% of our samples did homopolymer regions adversely affect sequence quality in trnH-psbA.
For a number of reasons, we refrained from a statistical test of differences among mean sequence divergences of the nine spacer regions. First, the sample size in our survey was too restricted to provide a meaningful statistical test (although the standard error of the mean of trnH-psbA does not directly overlap with the means of any of the other spacers). More importantly, as pointed out by Shaw et al. (33), genera within and between families of plants are phylogenetically nonequivalent, i.e., lineages recognized as genera may have quite different divergence rates depending on the various life history traits of the included species. Therefore, statistical comparisons between genera with respect to genetic distance are not valid or warranted at this time. Our intent in calculating these mean percent divergences across loci is to provide a qualitative evaluation of each spacer region for barcoding purposes. In this respect, we consider the high divergence value of trnH-psbA, which permits species discrimination in the largest number of taxa we tested (six of the eight genera and 11 of the 14 species pairs), as strong support for its use as a plant barcode.
The universality of trnH-psbA for differentiating among all flowering plant species clearly needs further investigation (see below), especially in taxa with extremely short spacers that may not contain enough sequence variation for species-level discrimination (e.g., Thalictrum and Solidago in our study and Minuartia in ref. 33). This spacer region also is present in other nonflowering land plants. In a search of GenBank, we found that the trnH-psbA spacer has been successfully amplified in angiosperms, gymnosperms, ferns, mosses, and liverworts, although we do not know at this time the degree of between-species divergence. Further study is needed to determine whether this plastid region is as variable in the nonflowering plants as we have shown for our test angiosperms, and therefore whether it is of broad utility as a barcode across the total spectrum of land plants.
Our findings on the properties of trnH-psbA agree with Shaw et al. (33) in their extensive survey of noncoding plastid DNA for phylogenetic purposes. By applying our barcode criteria (i.e., length considerations and universality) to the framework of their study, we conclude that trnH-psbA has greater potential for species-level discrimination than any other locus they analyzed. Similar to our results, they demonstrated that trnH-psbA amplified and sequenced easily with an average length of 465 bp across the 30 taxa they surveyed. Although this region was the second most variable of the 21 spacers they tested in terms of potentially informative characters, they ranked its utility for phylogenetic purposes as low (tier 3) because of its short length. Our analysis of the number of nucleotide substitutions within genera across all taxa in the 21 plastid regions presented by Shaw et al. (33) indicates that the trnH-psbA spacer has the highest percentage nucleotide difference (0.0135 difference per base pair), even though at least 8 of the 21 other regions showed a greater total number of nucleotide substitutions because of their longer length. The interspecific nucleotide differences in trnH-psbA ranged from 18% to 105% higher than that of the other eight most variable plastid regions. Because short sequence length is an important criterion for barcoding, the high frequency of nucleotide differences of trnH-psbA, in combination with its relatively short length, is a significant advantage. Other studies also have shown a high percentage of interspecific divergence for trnH-psbA, and in most cases, the highest in all plastid regions tested (e.g., refs. 44-48).
Despite this high level of interspecific variation, trnH-psbA has found only limited use in species-level phylogenetic reconstruction because of the short length as well as the difficulty of alignments resulting from a high number of indels (e.g., refs. 49-51). In contrast with the problems of indels for phylogenetic construction, we suspect that indels will ultimately enhance the information needed for species identifications, once the appropriate informatics tools for barcoding are developed. In the set of species we sampled, sequences were alignable within genera, but problematic above that rank. In the one case (Solidago) where sequence divergence was not sufficient to separate species, the presence of unique indels allowed easy discrimination among the taxa. Blaxter (34) advocates ease of alignment as a criterion when evaluating the utility of barcode loci. We do not consider difficulty of alignment to be a major obstacle to the applicability of either ITS or trnH-psbA for the primary purpose of DNA barcoding, i.e., identification. Although ease of alignment is desirable, it is not necessary for barcoding. Searches in GenBank by using our data from both loci with a blast search returned correct identities at both the gene and species level. blast searches are anchored and canalized by conserved regions in both loci, 5.8S in ITS and the small region of flanking exon for trnH-psbA. Intraspecific variation in both ITS and trnH-psbA is known to be relatively low, compared with interspecific variation (27, 52), although in the present study, our intraspecific sampling was insufficient to address this issue.
The extraction of DNA from specimens in herbarium collections was highly successful. This success may be due to the specimens having been air-dried and in a good state of preservation as evidenced by the generally green appearance of the leaves selected for extraction (Fig. 2). Plant voucher specimens vary in how and when they are dried after being pressed. If specimen-drying facilities are not immediately available, especially in humid tropical climates, botanists often treat pressed specimens with ethanol to temporarily preserve them against fungal attack and degradation. Alcohol has been shown to be detrimental to recovering high-quality DNA (53), although how it will affect the short sequences needed for barcoding is unknown. We are encouraged by the fact that museum specimens of insects dried from ethanol storage readily yield CO1 sequences. A more thorough investigation and optimization of methods to extract high-quality barcode DNA from herbarium collections in a high-throughput format will be critical to efficiently build a sequence-database library for plant DNA barcodes. Our positive results by using well preserved specimens indicate that the a priori selection of apparently undegraded plant samples will be an important determinant of success. Fortunately, herbaria often have more than one specimen per species among which to select for successful DNA barcoding.
We have shown here that there are gene sequences suitable for DNA barcoding of flowering plants. It may be necessary to employ more than one locus to attain species-level discrimination across all flowering plant species. Algorithms for combining barcoding sequences from two or more DNA regions to yield species-level unique identifiers are now needed. We believe that ITS and trnH-psbA serve as good starting points for large-scale testing of DNA barcoding across a large sample of angiosperms. A good test would be to expand taxon sampling through the application of both ITS and trnH-psbA to barcode the estimated 8,000 species of flowering plants of Costa Rica (54).
Supplementary Material
Acknowledgments
We thank P. Hebert and R. Olmstead for comments on the manuscript and I. Lopez for help with the illustrations. This work was supported by the Department of Botany, the Laboratories of Analytical Biology, and the office of the Associate Director for Research and Collections at the Smithsonian National Museum of Natural History, and National Science Foundation Biotic Surveys and Inventories Grant DEB-0072730 (to D.H.J.).
Author contributions: W.J.K., K.J.W., E.A.Z., L.A.W., and D.H.J. designed research; W.J.K., K.J.W., and L.A.W. performed research; K.J.W. and L.A.W. contributed new reagents/analytic tools; W.J.K., K.J.W., L.A.W., and D.H.J. analyzed data; and W.J.K., K.J.W., E.A.Z., L.A.W., and D.H.J. wrote the paper.
Abbreviations: ITS, internal transcribed spacer; CO1, cytochrome c oxidase 1.
Data deposition: The sequences reported in this paper have been deposited in the GenBank database (accession nos. DQ005959-DQ006232).
References
- 1.Hebert, P. D. N., Cywinska, A., Ball, S. L. & deWaard, J. R. (2003) Proc. R. Soc. London Ser. B 270, 313-321. [DOI] [PMC free article] [PubMed] [Google Scholar]
- 2.Hebert, P. D. N., Ratnasingham, S. & deWaard, J. R. (2003) Proc. R. Soc. London Ser. B 270, Suppl. 1, S96-S99. [DOI] [PMC free article] [PubMed] [Google Scholar]
- 3.Hebert, P. D. N., Stoeckle, M. Y., Zemlak, T. S. & Francis, C. M. (2004) PLoS Biol. 2, e312. [DOI] [PMC free article] [PubMed] [Google Scholar]
- 4.Hebert, P. D. N., Penton, E. H., Burns, J. M., Janzen, D. H. & Hallwachs, W. (2004) Proc. Natl. Acad. Sci. USA 101, 14812-14817. [DOI] [PMC free article] [PubMed] [Google Scholar]
- 5.Hogg, I. D. & Hebert, P. D. N. (2004) Can. J. Zool. 82, 1-6. [Google Scholar]
- 6.Gressel, J. & Ehrlich, G. (2002) Trends Plant Sci. 7, 642-644. [DOI] [PubMed] [Google Scholar]
- 7.Holmes, R. (2004) New Sci. 2453, 32-35. [Google Scholar]
- 8.Scotland, R., Hughes, C., Bailey, D. & Wortley, A. (2003) Syst. Biodiv. 1, 139-143. [Google Scholar]
- 9.Seberg, O., Humphries, C. J., Knapp, S., Stevenson, D. W., Peterson, G., Scharff, N. & Andersen, N. M. (2003) Trends Ecol. Evol. 18, 63-65. [Google Scholar]
- 10.Will, K. W. & Rubinoff, D. (2004) Cladistics 20, 47-55. [DOI] [PubMed] [Google Scholar]
- 11.Besansky, N. J., Severson, D. W. & Ferdig, M. T. (2003) Trends Parasitol. 19, 545-546. [DOI] [PubMed] [Google Scholar]
- 12.Janzen, D. H. (2004) Philos. Trans. R. Soc. London B 359, 731-732. [DOI] [PMC free article] [PubMed] [Google Scholar]
- 13.Janzen, D. H. (2005) in Plant Conservation: A Natural History Approach, eds. Krupnick, G. A. & Kress, W. J. (Univ. Chicago Press, Chicago), pp. ix-xiii.
- 14.Kress, W. J. (2004) Am. J. Bot. 91, 2124-2127. [Google Scholar]
- 15.Barns, S. M., Delwiche, C. F., Palmer, J. D. & Pace, N. R. (1996) Proc. Natl. Acad. Sci. USA 93, 9188-9193. [DOI] [PMC free article] [PubMed] [Google Scholar]
- 16.Poinar, H. N., Hofreiter, M., Spaulding, W. G., Martin, P. S., Stankiewicz, B. A., Bland, H., Evershed, R. P., Possnert, G. & Pääbo, S. (1998) Science 281, 402-406. [DOI] [PubMed] [Google Scholar]
- 17.Hofreiter, M., Poinar, H. N., Spaulding, W. G., Bauer, K., Martin, P. S., Possnert, G. & Pääbo, S. (2000) Mol. Ecol. 9, 1975-1984. [DOI] [PubMed] [Google Scholar]
- 18.Deguilloux, M.-F., Pemonge, M.-H. & Petit, R. J. (2002) Proc. R. Soc. London Ser. B 269, 1039-1046. [DOI] [PMC free article] [PubMed] [Google Scholar]
- 19.Jackson, R. B., Moore, L. A., Hoffmann, W. A., Pockman, W. T. & Linder, C. R. (1999) Proc. Natl. Acad. Sci. USA 96, 11387-11392. [DOI] [PMC free article] [PubMed] [Google Scholar]
- 20.Zerega, N. J. C., Mori, S., Lindqvist, C., Zheng, Q. & Motley, T. J. (2002) Eco. Bot. 56, 154-164. [Google Scholar]
- 21.Cho, Y., Mower, J. P., Qiu, Y.-L. & Palmer, J. D. (2004) Proc. Natl. Acad. Sci. USA 101, 17741-17746. [DOI] [PMC free article] [PubMed] [Google Scholar]
- 22.Cho, Y., Qiu, Y.-L., Kuhlman, P. & Palmer, J. D. (1998) Proc. Natl. Acad. Sci. USA 95, 14244-14249. [DOI] [PMC free article] [PubMed] [Google Scholar]
- 23.Adams, K. L. & Palmer, J. D. (2003) Mol. Phylogenet. Evol. 29, 380-395. [DOI] [PubMed] [Google Scholar]
- 24.Luo, H., van Coppenolle, B., Seguin, M. & Boutry, M. (1995) Mol. Breed. 1, 51-63. [Google Scholar]
- 25.Alvarez, I. & Wendel, J. F. (2003) Mol. Phylogenet. Evol. 29, 417-434. [DOI] [PubMed] [Google Scholar]
- 26.Stoeckle, M. (2003) Bioscience 53, 2-3. [Google Scholar]
- 27.Baldwin, B. G., Sanderson, M. J., Porter, J. M., Wojciechowski, M. F., Campbell, C. S. & Donoghue, M. J. (1995) Ann. Mo. Bot. Gard. 82, 247-277. [Google Scholar]
- 28.Zhang, W., Wendel, J. F. & Clark, L. G. (1997) Mol. Phylogenet. Evol. 8, 205-217. [DOI] [PubMed] [Google Scholar]
- 29.Cullings, K. W. & Vogler, D. R. (1998) Mol. Ecol. 7, 919-923. [DOI] [PubMed] [Google Scholar]
- 30.Hershkovitz, M. A. & Lewis, L. A. (1996) Mol. Biol. Evol. 13, 1276-1295. [DOI] [PubMed] [Google Scholar]
- 31.Gielly, L. & Taberlet, P. (1994) Mol. Biol. Evol. 11, 769-777. [DOI] [PubMed] [Google Scholar]
- 32.Soltis, D. E., Kuzoff, R. K., Mort, M. E., Zanis, M., Fishbein, M., Hufford, L., Koontz, J. & Orroyo, M. K. (2001) Ann. Mo. Bot. Gard. 88, 669-693. [Google Scholar]
- 33.Shaw, J., Lickey, E. B., Beck, J. T., Farmer, S. B., Liu, W., Miller, J., Siripun, K. C., Winder, C. T., Schilling, E. E. & Small, R. L. (2005) Am. J. Bot. 92, 142-166. [DOI] [PubMed] [Google Scholar]
- 34.Blaxter, M. L. (2004) Proc. R. Soc. London Ser. B 359, 669-679. [DOI] [PMC free article] [PubMed] [Google Scholar]
- 35.Shinozaki, K., Ohme, M., Tanaka, M., Wakasugi, T., Hayashida, N., Matsubayashi, T., Zaita, N., Chunwongse, J., Obokata, J., Yamaguchi-Shinozaki, K., et al. (1986) EMBO J. 5, 2043-2049. [DOI] [PMC free article] [PubMed] [Google Scholar]
- 36.Wakasugi, T., Sugita, M., Tsudzuki, T. & Sugiura, M. (1998) Plant Mol. Biol. Rep. 16, 231-241. [Google Scholar]
- 37.Schmitz-Linneweber, C., Regel, R., Du, T. G., Hupfer, H., Herrmann, R. G. & Maier, R. M. (2002) Mol. Biol. Evol. 19, 1602-1612. [DOI] [PubMed] [Google Scholar]
- 38.Olmstead, R. G., Sweere, J. A., Spangler, R. E., Bohs, L. & Palmer, J. D. (1999) in Solanaceae IV, eds. Nee, M., Lester, R. N. & Hawks, J. G. (Royal Botanic Gardens, London), pp. 111-137.
- 39.White, T. J., Bruns, T., Lee, S. & Taylor, J. (1990) in PCR Protocols: A Guide to Methods and Applications, eds. Innis, M., Gelfand, D., Sninsky, J. & White, T. (Academic, San Diego), pp. 315-322.
- 40.Sang, T., Crawford, D. J. & Stuessy, T. F. (1997) Am. J. Bot. 84, 1120-1136. [PubMed] [Google Scholar]
- 41.Tate, J. A. & Simpson, B. B. (2003) Syst. Bot. 28, 723-737. [Google Scholar]
- 42.Renner, S. S. (1999) Am. J. Bot. 86, 1301-1315. [PubMed] [Google Scholar]
- 43.Salazar, G. A., Chase, M. W., Arenas, M. A. S. & Ingrouille, M. (2003) Am. J. Bot. 90, 777-795. [DOI] [PubMed] [Google Scholar]
- 44.Azuma, H., García-Franco, J. G., Rico-Gray, V. & Thien, L. B. (2001) Am. J. Bot. 88, 2275-2285. [PubMed] [Google Scholar]
- 45.Chandler, G. T., Bayer, R. J. & Crisp, M. D. (2001) Am. J. Bot. 88, 1675-1687. [PubMed] [Google Scholar]
- 46.Mast, A. R. & Givnish, T. J. (2002) Am. J. Bot. 89, 1311-1323. [DOI] [PubMed] [Google Scholar]
- 47.Fukuda, T., Yokoyama, J. & Tsukaya, H. (2003) Int. J. Plant Sci. 164, 13-24. [Google Scholar]
- 48.Miller, J. T., Grimes, J. W., Murphy, D. J., Bayer, R. J. & Ladiges, P. Y. (2003) Syst. Bot. 28, 558-566. [Google Scholar]
- 49.Ackerfield, J. & Wen, J. (2003) Int. J. Plant Sci. 164, 593-602. [Google Scholar]
- 50.Hamilton, M. B., Braverman, J. M. & Soria-Hernanz, D. F. (2003) Mol. Biol. Evol. 20, 1710-1721. [DOI] [PubMed] [Google Scholar]
- 51.Yamashiro, T., Fukuda, T., Yokoyama, J. & Maki, M. (2004) Mol. Phylogenet. Evol. 31, 689-700. [DOI] [PubMed] [Google Scholar]
- 52.Holdregger, R. & Abbott, R. J. (2003) Am. J. Bot. 90, 931-936. [DOI] [PubMed] [Google Scholar]
- 53.Flournoy, L. E., Adams, R. P. & Pandy, R. N. (1996) BioTechniques 20, 657-660. [DOI] [PubMed] [Google Scholar]
- 54.Hammel, B. E., Grayum, M. H., Herrer, C. & Zamora, N., eds. (2003, 2004) Manual de Plantas de Costa Rica (Mo. Bot. Gard. Press, St. Louis), Vol. 1-3.
Associated Data
This section collects any data citations, data availability statements, or supplementary materials included in this article.