

Abstract
INTRODUCTION
Blood tests have the potential to improve the accuracy of Alzheimer's disease (AD) clinical diagnosis, which will enable greater access to AD‐specific treatments. This study compared leading commercial blood tests for amyloid pathology and other AD‐related outcomes.
METHODS
Plasma samples from the Alzheimer's Disease Neuroimaging Initiative were assayed with AD blood tests from C2N Diagnostics, Fujirebio Diagnostics, ALZPath, Janssen, Roche Diagnostics, and Quanterix. Outcomes measures were amyloid positron emission tomography (PET), tau PET, cortical thickness, and dementia severity. Logistic regression models assessed the classification accuracies of individual or combined plasma biomarkers for binarized outcomes, and Spearman correlations evaluated continuous relationships between individual plasma biomarkers and continuous outcomes.
RESULTS
Measures of plasma p‐tau217, either individually or in combination with other plasma biomarkers, had the strongest relationships with all AD outcomes.
DISCUSSION
This study identified the plasma biomarker analytes and assays that most accurately classified amyloid pathology and other AD‐related outcomes.
Highlights
Plasma p‐tau217 measures most accurately classified amyloid and tau status.
Plasma Aβ42/Aβ40 had relatively low accuracy in classification of amyloid status.
Plasma p‐tau217 measures had higher correlations with cortical thickness than NfL.
Correlations of plasma biomarkers with dementia symptoms were relatively low.
Keywords: A/T/N, amyloid, biomarkers, blood, glial fibrillary acidic protein, neurofilament light, plasma, p‐tau, tau
1. BACKGROUND
Blood biomarker (BBM) tests for Alzheimer's disease (AD) pathology have rapidly advanced over the past 5 years and are now being increasingly used in research studies, clinical trials, and clinical practice. 1 , 2 The high acceptability of blood collection by patients and the wide availability of blood collection for clinical care are major advantages of BBM tests compared to cerebrospinal fluid (CSF) tests and positron emission tomography (PET). 3 Moreover, the recent United States Food and Drug Administration (FDA)‐approval of AD‐specific treatments that require biomarker confirmation of amyloid pathology has greatly increased the need for biomarker testing, 4 , 5 and BBM tests may be the only modality that can enable the scale of AD biomarker testing that is necessary for widespread use of AD‐specific treatments. 6 , 7
Some of the first promising BBM assays for AD pathology evaluated the ratio of amyloid‐β peptide 42 to 40 (Aβ42/Aβ40). 8 Lower plasma Aβ42/Aβ40 is associated with amyloid pathology, likely reflecting sequestration of Aβ42 in amyloid plaques. 9 Tau is phosphorylated in response to amyloid pathology, including at positions 181 and 217, and plasma and CSF p‐tau181 and p‐tau217 levels reflect amyloid pathology even more strongly than neurofibrillary tangle pathology. 10 , 11 , 12 , 13 , 14 Glial fibrillary acidic protein (GFAP), a biomarker of astrocytic activation, is also elevated in amyloid positive individuals, likely indicating a response to amyloid pathology. 15 Additionally, neurofilament light (NfL), a non‐specific biomarker of neuroaxonal damage, may add value to Aβ42/Aβ40 and/or p‐tau species in predicting some AD‐related outcomes. 15 , 16
Given the many different BBM analytes and assays now available, an issue that has become an obstacle for broader use of BBM tests is the widely varying levels of accuracy and validation for different BBM tests. 7 Studies have demonstrated that different tests have accuracies that range from equivalent to FDA‐approved CSF tests to not much better than chance. 17 , 18 , 19 These differences may be related to a variety of factors including the specific analyte, type of assay (e.g., mass spectrometry‐based or immunoassay), and the characteristics of the antibodies used. Differences in study cohorts may also complicate attempts to validate assays, as performance may vary depending on the composition of the cohort and reference standards. 8 Relatively few head‐to‐head studies, in which the exact same samples are analyzed with multiple tests, have been performed because these studies require a large sample volume and are expensive. 17 , 18 , 19 , 20 However, head‐to‐head studies are essential to rigorously comparing performance between tests.
The Biomarker Consortium for the Foundation for the National Institutes of Health (FNIH), which includes stakeholders from academia, industry, and patient advocacy groups, coordinated a head‐to‐head comparison of six leading plasma tests for Aβ42/Aβ40 in 2020 to determine which tests added value to covariates in classification of amyloid PET status. 17 After completion of this study, the FNIH Biomarker Consortium expanded its focus to additional plasma analytes, including p‐tau181 and p‐tau217. GFAP and NfL were included in some BBM test panels. Leading commercial tests for each analyte were identified by scientists involved in test selection for clinical trials: C2N Diagnostics’ PrecivityAD2%p‐tau217, p‐tau217, and Aβ42/Aβ40; Fujirebio Diagnostics’ Lumipulse p‐tau217 and Aβ42/Aβ40; ALZpath's Quanterix p‐tau217; Janssen's LucentAD Quanterix p‐tau217; Roche Diagnostics’ NeuroToolKit p‐tau181, Aβ42/Aβ40, GFAP, and NfL; and Quanterix's Neurology 4‐Plex p‐tau181, Aβ42/Aβ40, GFAP, and NfL. Plasma samples were provided by the Alzheimer's Disease Neuroimaging Initiative (ADNI) biorepository and a prespecified analytic plan was drafted for a head‐to‐head comparison of the plasma biomarkers with classification of amyloid PET status as the primary outcome. This analytic plan was expanded to include associations of the plasma biomarkers with tau PET, cortical thickness, and dementia severity. Data from this study are available to researchers interested in performing further studies to compare the performance of these assays, as well as to evaluate other scientific questions (adni.loni.usc.edu).
2. METHODS
2.1. Participants
The over‐arching goal of this FNIH Biomarker Consortium effort is to evaluate the longitudinal trajectories of p‐tau217, p‐tau181, and Aβ42/Aβ40 in relation to amyloid PET. Therefore, ADNI participants were selected for inclusion who had plasma samples collected within 6 months of an amyloid PET scan for three distinct timepoints. For individuals with more than three time points, plasma samples were selected that represented the earliest, latest, and an intermediate time point. Based on these selection criteria, 393 ADNI participants had at least six plasma aliquots (1179 samples total) that underwent analysis with the C2N Diagnostics PrecivityAD2 (C2N), Fujirebio Diagnostics Lumipulse (Fujirebio), ALZpath Quanterix (ALZpath), Janssen LucentAD Quanterix (Janssen), and Roche Diagnostics NeuroToolKit (Roche) assays. A seventh aliquot was available for 355 participants (1063 participant time points, two participants had a seventh plasma aliquot for only two time points), and this aliquot was used for the remaining Quanterix Neurology 4‐Plex (Quanterix) assays, which were given a lower priority due to lower accuracy reported by prior studies. 18 , 19
RESEARCH IN CONTEXT
Systematic review: Recent studies comparing the performance of plasma biomarker assays in classification of amyloid status and other Alzheimer's disease (AD) outcomes were reviewed.
Interpretation: Regardless of the specific platform, plasma p‐tau217 had the highest classification accuracies and correlations with amyloid positron emission tomography (PET), tau PET, cortical thickness, and dementia symptoms. Clinically available blood tests that include plasma p‐tau217 can be used to evaluate for AD pathology in patients with cognitive impairment and identify individuals who may benefit from new AD‐specific treatments. Additionally, these blood tests can also identify cognitively impaired or unimpaired individuals with AD pathology for inclusion in clinical trials.
Future directions: Studies are needed that examine the effects of age, sex, apolipoprotein E (APOE) genotype, comorbid medical conditions, race, and social determinants of health on plasma biomarker test performance. Future studies are underway to evaluate the longitudinal trajectories of AD blood biomarkers in relation to amyloid PET and other AD‐related outcomes.
For this current head‐to‐head study, samples were considered for inclusion if no data for the C2N PrecivityAD2, Fujirebio Lumipulse, ALZpath Quanterix, Janssen LucentAD Quanterix, and Roche NeuroToolKit assays were missing (e.g., due to quality control failures or low volume) and if clinical data were available within 1 year of the sample collection. For samples that met these criteria, the most recently collected sample was chosen from each individual in order to increase the availability of associated tau PET data. One individual was excluded due to missing data from each of the three plasma samples, yielding 392 individuals in this study. Quanterix Neurology 4‐Plex data were available for 342 of these individuals.
The current analyses utilized data from the ADNI database (adni.loni.usc.edu), which studies memory and aging in older adults, including both cognitively unimpaired and cognitively impaired individuals. ADNI was launched in 2003 as a public‐private partnership led by Principal Investigator Michael W. Weiner, MD. The primary goal of ADNI has been to test whether serial magnetic resonance imaging (MRI), PET, other biological markers, and clinical and neuropsychological assessment can be combined to measure the progression of mild cognitive impairment (MCI) and early AD. Written informed consent was obtained from each participant or their legally authorized representative. Race and sex were self‐identified.
2.2. Diagnostic and CDR variables
Participants underwent a clinical assessment within 1 year of blood collection that included a detailed interview of a collateral source, a neurological examination of the participant, the Clinical Dementia Rating (CDR) and the Clinical Dementia Rating Sum of Boxes (CDR‐SB). 21 Individuals with a CDR of 0 were categorized as “cognitively unimpaired.” Individuals with a CDR > 0 were categorized as “cognitively impaired;” this group includes individuals with mild cognitive impairment and dementia.
2.3. Plasma biomarker assays
The FNIH Biomarker Consortium project team selected assays based on recently published 22 , 23 , 24 , 25 , 26 , 27 , 28 , 29 as well as currently unpublished data presented by diagnostics companies. This included information on the analytical performance of each assay, such as the measurement range, dilutional linearity, and repeatability. Ultimately, four Aβ42/Aβ40, two p‐tau181, four p‐tau217, two GFAP, and two NfL assays were selected for this project.
Plasma was collected, processed, and stored according to ADNI protocols. Sample aliquots were pulled from the ADNI biorepository and shipped to four laboratories for analysis on dry ice. Pooled plasma controls with known higher or lower plasma p‐tau217 values as measured by the ALZpath Quanterix assay were supplied by the University of Gothenburg to be run with each lot of samples. All laboratories were blinded to information about the participants.
The C2N PrecivityAD2 liquid chromatography tandem mass spectrometry (LC‐MS) based assays for Aβ42, Aβ40, p‐tau217, and non‐phosphorylated tau217 (np‐tau217) were run in singlicate at the C2N Diagnostics commercial laboratory in St. Louis, Missouri, USA. The %p‐tau217 measure was calculated as the p‐tau217 concentration divided by the np‐tau217 concentration times 100, which is also described as the percent phosphorylation occupancy. 25 , 30 The Fujirebio Lumipulse assays for Aβ42, Aβ40, and p‐tau217 were run in singlicate with commercially available kits on a Fujirebio Lumipulse G1200 analyzer at the Indiana University National Centralized Repository for Alzheimer's Disease and Related Dementias Biomarker Assay Laboratory (NCRAD‐BAL). The Roche NeuroToolKit assays for Aβ42, Aβ40, p‐tau181, NfL, and GFAP were run in singlicate on a Cobas e 801 analyzer (Roche Diagnostics International Ltd, Rotkreuz, Switzerland) at the University of Gothenburg. The ALZpath Quanterix and Janssen LucentAD Quanterix assays for p‐tau217, as well as the Quanterix Neurology 4‐Plex E (N4PE) assays for Aβ42, Aβ40, p‐tau181 (v2.1), NfL, and GFAP, were run in duplicate on a Quanterix Simoa‐HD‐X analyzer at the Quanterix Accelerator Laboratory. Further details are included in the study methodology report, which may be accessed from the ADNI database (adni.loni.usc.edu).
2.4. CSF collection and analysis and APOE genotyping
Data on CSF biomarkers and apolipoprotein E (APOE) genotype were obtained from ADNI. CSF Aβ42, total tau, and p‐tau181 were measured using the Elecsys β‐amyloid (1‐42) CSF, Elecsys Total‐Tau CSF, and Elecsys Phospho‐Tau (181P) CSF immunoassays, respectively, on a Cobas e 601 analyzer (Roche Diagnostics International Ltd, Rotkreuz, Switzerland). APOE genotyping was performed as part of the ADNI protocol.
2.5. Amyloid PET, tau PET, and MRI variables
Amyloid PET imaging was conducted at each ADNI site following standardized protocols for florbetapir and florbetaben. 31 A global standardized uptake value ratio (SUVR) was estimated across cortical summary regions, specifically the frontal, cingulate, parietal, and lateral temporal cortices, as defined by FreeSurfer v7.1. This ratio was normalized to the whole cerebellum. To estimate the standardized global cortical Aβ burden in Centiloid units, transformations provided by the ADNI PET Core were applied to florbetaben and florbetapir. The threshold for amyloid PET positivity was set at > 20 Centiloids, which corresponds to the recommended thresholds for florbetapir (whole cerebellum‐normalized SUVR of 1.11 32 ) and florbetaben (whole cerebellum‐normalized SUVR of 1.08 33 ).
Tau PET imaging was conducted at each ADNI site following standardized protocols for flortaucipir. The four 5‐min flortaucipir PET scans were corrected for motion, averaged, smoothed to a uniform resolution of 6 mm, and co‐registered to the individual participant's accompanying T1‐weighted MRI scan. Using the CenTauR standardized masks, 34 SUVRs were estimated for regions of interest (ROIs) as defined by FreeSurfer v7.1. The mesial temporal meta‐ROI included regions with early tau PET signal (entorhinal, parahippocampus, and amygdala), and the temporal‐parietal meta‐ROI included regions with both early and later tau PET signal (the entorhinal, parahippocampus, amygdala, fusiform, inferior and middle temporal gyri). These SUVRs were normalized to the inferior cerebellar gray matter reference region, as defined by the SUIT template. 35 The derivation of cutoffs for early and late tau PET positivity are described in Appendix A.
Structural brain MRI data included a 3D MP‐RAGE or IR‐SPGR T1‐weighted 3T MRI with sagittal slices. The full cortex of each subject brain was parcellated into 41 bilateral ROIs using a volumetric Desikan‐Killiany‐Tourville atlas, using FreeSurfer v5.1 for ADNI‐GO/2 data and v6.0 for ADNI‐3 data. A composite meta‐ROI cortical thickness measurement was calculated that included the entorhinal, fusiform, parahippocampal, mid‐temporal, inferior‐temporal, and angular gyrus. 36 To address differences in image acquisition protocol and image processing, the meta‐ROI cortical thickness measure was harmonized using the ComBat‐GAM method. 37 Harmonization parameters specific to each batch were estimated using data from the cognitively unimpaired individuals, while considering normal variance due to age, and sex. The age effect was modeled as a non‐linear effect over the study age range. The estimated harmonization parameters were then applied to the full dataset. Finally, normal aging effects on the meta‐ROI cortical thickness (harmonized) was estimated within cognitively unimpaired and Aβ‐negative individuals and regressed out from the corresponding measures from all individuals (using age and quadratic age as predictors). The steps for ComBAT‐GAM harmonization and adjusting for normal effects of age utilized all available ADNI data for unbiased modeling. The derivation of cutoffs for cortical thickness abnormality are described in Appendix A.
2.6. Statistical methods
The specific ADNI datasets used by this study are listed and the annotated code used for study analyses is provided in full so that other investigators can easily replicate and extended our analyses (see Appendix B and https://github.com/WashUFluidBiomarkers/HeadToHeadBloodTestStudy 38 ). The initial submitted manuscript was posted on a pre‐print server. 39
For participant characteristics tables, the significance of differences by amyloid PET status were evaluated with Wilcoxon ranked sum tests for continuous variables and chi‐squared or Fisher exact tests for categorical variables. The percent difference by amyloid PET status in the median plasma biomarker level was calculated as the difference between the median of the amyloid PET positive and amyloid PET negative groups divided by the median for the amyloid PET negative group times 100.
Unadjusted logistic regression models for a binary outcome (amyloid PET status, tau PET status, cortical thickness status, or cognitive impairment status [CDR = 0 or CDR > 0]) were used to assess the classification accuracy of plasma biomarker analytes separately or combined within a company/assay panel. Brier scores were used to quantify the prediction accuracy of the logistic regression models. 40 Logistic regression models adjusted for the covariates of age, sex, and APOE genotype were also examined. Differences between receiver operating characteristic areas under the curves (AUCs) were evaluated using DeLong tests. 41 When multiple AUCs were compared, the significance was adjusted using the Benjamini‐Hochberg procedure. 42 Cutoff values for separate analytes that yielded the highest combined sensitivity and specificity (Youden Index) for an outcome were found. For each cutoff, the following metrics were calculated: sensitivity, specificity, overall accuracy, positive predictive value (PPV), and negative predictive value (NPV).
Spearman correlations were used to evaluate the continuous relationships of plasma biomarkers with amyloid PET Centiloid, tau PET measures, cortical thickness measure, and dementia severity as measured by the CDR‐SB. For partial Spearman correlations, analyses included covariates of age, sex, and APOE genotype. Comparisons between Spearman correlations were performed by bootstrapping. When multiple measures were compared, the significance was adjusted using the Benjamini‐Hochberg procedure. 42
3. RESULTS
3.1. Participants
The full cohort included data from 392 individuals with a median age of 78.1 years (interquartile range 72.9–83.3 years); 193 (49.2%) were female; 132 (33.7%) carried an APOE ε4 allele; 366 (93.4%) self‐identified as their race as white; 191 (48.7%) were amyloid PET positive; and 192 (49.0%) were cognitively impaired (CDR > 0), (Table 1). Of the participants with cognitive impairment, 148 (77.1%) had mild cognitive impairment or very mild dementia (CDR 0.5) and 44 (22.9%) had dementia (CDR 1 or higher), (see Tables S1, S2 for characteristics of the cognitively impaired and unimpaired sub‐cohorts). Within 1 year of plasma collection, all individuals in the full cohort had amyloid PET, 188 had tau PET, 266 had structural brain MRI, and 122 had Elecsys data for both CSF p‐tau181 and Aβ42 (see Tables S3–S5 for characteristics of the tau PET, structural brain MRI, and CSF sub‐cohorts).
TABLE 1.
Cohort characteristics.
| Full cohort | Amyloid PET negative | Amyloid PET positive | |||||
|---|---|---|---|---|---|---|---|
| Characteristic | n = | Values | n = | Values | n = | Values | p‐value |
| Demographics | |||||||
| Age (years) | 392 | 78.1 (72.9–83.3) | 201 | 76.1 (71.8–81.9) | 191 | 79.0 (74.5–84.2) | =0.0026 |
| Sex (n, % female) | 392 | 193 (49.2%) | 201 | 98 (48.8%) | 191 | 95 (49.7%) | =0.80 |
| APOE genotype (22/23/24/33/34/44) | 392 | 1/35/6/224/108/18 | 201 | 1/29/1/133/31/6 | 191 | 0/6/5/91/77/12 | <0.0001 |
| APOE ε4 carrier status (n, % carrier) | 392 | 132 (33.7%) | 201 | 38 (18.9%) | 191 | 94 (49.2%) | <0.0001 |
| Years of education | 392 | 16 (14–18) | 201 | 16 (14–19) | 191 | 16 (14–18) | =0.10 |
| Race (Black/White/Other) | 392 | 14/366/12 | 201 | 8/184/9 | 191 | 6/182/3 | =0.22 |
| CDR (0/0.5/1+) | 392 | 200/148/44 | 201 | 124/47/3 | 191 | 76/74/41 | =0.025 |
| CDR Sum of Boxes | 392 | 0 (0–1.5) | 201 | 0 (0–1) | 191 | 1 (0–3) | <0.0001 |
| Plasma collection to CDR (years) | 392 | 0 (0–0.02) | 201 | 0 (0–0.02) | 191 | 0 (0–0.02) | =0.36 |
| Amyloid PET | |||||||
| Amyloid PET Centiloid | 392 | 19 (−2–68) | 201 | −2 (−9–6) | 191 | 69 (47–99) | <0.0001 |
| Plasma collection to amyloid PET (years) | 392 | 0.02 (0–0.04) | 201 | 0.02 (0–0.04) | 191 | 0.02 (0.003–0.04) | =0.88 |
| Tau PET | |||||||
| Early Tau PET | 188 | 1.18 (1.1–1.3) | 97 | 1.14 (1.06–1.23) | 91 | 1.28 (1.15–1.44) | <0.0001 |
| Early Tau PET positivity | 188 | 40, 21.3% | 97 | 4, 4.1% | 91 | 36, 39.6% | <0.0001 |
| Late Tau PET | 188 | 1.13 (1.07–1.2) | 97 | 1.11 (1.05–1.15) | 91 | 1.17 (1.09–1.32) | <0.0001 |
| Late Tau PET positivity | 188 | 29, 15.4% | 97 | 2, 2.1% | 91 | 27, 29.7% | <0.0001 |
| Plasma collection to tau PET (years) | 188 | 0.02 (0.003–0.09) | 97 | 0.02 (0.003–0.08) | 91 | 0.02 (0.003–0.11) | =0.54 |
| Cortical thickness | |||||||
| Cortical thickness | 266 | 2.8 (2.69–2.89) | 144 | 2.82 (2.75–2.89) | 122 | 2.76 (2.62–2.88) | =0.00284 |
| Cortical thickness positivity | 266 | 27, 10.2% | 144 | 5, 3.5% | 122 | 22, 18.0% | <0.0001 |
| Plasma collection to MRI (years) | 266 | 0.01 (0–0.04) | 144 | 0.008 (0–0.04) | 122 | 0.01 (0–0.05) | =0.053 |
| CSF Elecsys | |||||||
| CSF p‐tau181/Aβ42 | 122 | 0.0267 (0.0127‐0.0506) | 52 | 0.0127 (0.00963‐0.0162) | 70 | 0.0482 (0.0304‐0.063) | <0.0001 |
| CSF p‐tau181 (pg/mL) | 123 | 23.3 (17.7–30.9) | 52 | 19.2 (15.1–24.5) | 71 | 27.1 (22.2–36.6) | <0.0001 |
| CSF Aβ42 (pg/mL) | 125 | 860 (647–1360) | 55 | 1360 (1030–1830) | 70 | 691 (528–837) | <0.0001 |
| Plasma collection to CSF (years) | 122 | 0 (0–0.005) | 52 | 0 (0–0.005) | 70 | 0 (0–0) | =0.49 |
Note: Continuous values are presented as the median with the interquartile range. The significance of differences by amyloid PET status were evaluated with Wilcoxon's rank‐sum tests for continuous variables and chi squared or Fisher's exact tests for categorical variables. All tests were two sided and not adjusted for covariates or multiple comparisons. Please see the methods and Appendix A for definitions of early tau PET, late tau PET, and cortical thickness.
3.2. Sensitivity and variance of assays
Of the 392 samples included, 110 samples had p‐tau217 values that were below the level of detection for the C2N PrecivityAD2 assay and were assigned values of 0.65 pg/mL (half the value of the limit of detection). There were 12 samples with p‐tau217 values that were below the level of detection for the Fujirebio Lumipulse assay and were assigned values of 0.030 pg/mL. Analyte values were within range for the other assays.
The variance in measurements was assessed using aliquots of two pooled control plasma samples with known higher or lower p‐tau217 values that were run with each batch of samples. For most assays, the coefficient of variance (CV) ranged from 3% to 10% (see Appendix C). The exception was for Fujirebio Lumipulse p‐tau217, which had CVs of 11% and 34% for the higher and lower controls, respectively. The low control was near the lower limit of quantitation for the Fujirebio Lumipulse p‐tau217 assay, which may explain the higher imprecision.
3.3. Correlations between plasma biomarkers
Correlations between plasma biomarker levels across platforms were evaluated with samples from the 392 individuals (Figure 1). C2N PrecivityAD2%p‐tau217 and C2N PrecivityAD2 p‐tau217 values were highly correlated (unadjusted Spearman ρ = 0.94 [95% confidence intervals 0.93–0.95]); notably, the numerator in %p‐tau217 is p‐tau217, so a high correlation was expected. ALZpath Quanterix and Janssen LucentAD Quanterix p‐tau217 concentrations were also highly correlated (ρ = 0.94 [0.92–0.95]). Compared to C2N PrecivityAD2 p‐tau217, C2N PrecivityAD2%p‐tau217 had lower correlations with p‐tau217 concentrations as measured by the three immunoassays: ALZpath Quanterix, ρ = 0.89 versus 0.81, p = 0.0002; Fujirebio Lumipulse, ρ = 0.88 versus 0.81, p = 0.001; Janssen LucentAD Quanterix ρ = 0.88 versus 0.80, p = 0.0002. C2N PrecivityAD2%p‐tau217 had much lower correlations with Roche NeuroToolKit p‐tau181 (ρ = 0.69 [0.63–0.74]) and Quanterix Neurology 4‐Plex p‐tau181 (ρ = 0.54 [0.45–0.62]). The four Aβ42/Aβ40 measures had pairwise correlations that ranged from 0.63 to 0.43; the Fujirebio Lumipulse and Quanterix Neurology 4‐Plex had the highest correlation (ρ = 0.63 [0.55–0.70]). Roche NeuroToolKit and Quanterix Neurology 4‐Plex concentrations of GFAP and NfL were highly correlated (ρ = 0.94 [0.91–0.97] and ρ = 0.96 [0.94–0.97], respectively).
FIGURE 1.

Correlation matrix of plasma biomarker measures in the full cohort. All individuals (n = 392) had plasma biomarker measures for the C2N PrecivityAD2, Fujirebio Lumipulse, ALZpath Quanterix, Janssen LucentAD Quanterix, and Roche NeuroToolKit assays. A sub‐cohort (n = 342) additionally had plasma biomarker measures for the Quanterix Neurology 4‐Plex assays. The unadjusted Spearman correlation of plasma biomarker measures with one another is shown. Redder colors are used for higher absolute correlations, and bluer colors are used for lower absolute correlations. Black boxes represent identity.
3.4. Differences in plasma biomarkers by amyloid PET status
Differences in plasma biomarker levels associated with positive amyloid PET status were examined. Because plasma biomarker values tend to be highly skewed and therefore mean levels may overestimate the degree of abnormality for the typical amyloid PET positive individual, percent differences were calculated for the median plasma biomarker levels (Table 2). Compared to the amyloid PET negative group, median plasma p‐tau217 was higher in the amyloid PET positive group by 255% (Fujirebio Lumipulse), 245% (C2N PrecivityAD2%p‐tau217), 228% (C2N PrecivityAD2 p‐tau217), 170% (ALZpath Quanterix), and 139% (Janssen LucentAD Quanterix). The percent difference in median p‐tau181 was 66% (Roche NeuroToolKit) and 55% (Quanterix Neurology 4‐Plex). Differences in median plasma Aβ42/Aβ40 levels were much smaller in magnitude, ranging from 13% to 10% lower in the amyloid PET positive group, but were still highly significant due to low variance in values. Median plasma GFAP and NfL were higher in the amyloid PET positive group (64 to 61% for GFAP, 28% to 27% for NfL).
TABLE 2.
Plasma biomarker measures stratified by amyloid PET status.
| Full cohort | Amyloid PET negative | Amyloid PET positive | Unadjusted | Percent difference | ||||
|---|---|---|---|---|---|---|---|---|
| Characteristic | n = | Values | n = | Values | n = | Values | p‐value | |
| C2N PrecivityAD2 | ||||||||
| Aβ42 (pg/mL) | 392 | 40.1 (35.5–46.3) | 201 | 42.0 (37.2–47.5) | 191 | 39.2 (34.2–43.8) | =0.0001 | −6.7% |
| Aβ40 (pg/mL) | 392 | 441 (390–488) | 201 | 435 (385–487) | 191 | 447 (399–491) | =0.23 | 2.8% |
| Aβ42/Aβ40 | 392 | 0.0915 (0.0852–0.0997) | 201 | 0.0974 (0.0894–0.104) | 191 | 0.0871 (0.0821–0.0936) | <0.0001 | −10.6% |
| p‐tau217 (pg/mL) | 392 | 2.27 (0.65–4.29) | 201 | 1.31 (0.65–1.86) | 191 | 4.3 (2.95–6.5) | <0.0001 | 228% |
| %p‐tau217 (%) | 392 | 3.98 (1.86–7.54) | 201 | 2.20 (1.45–3.27) | 191 | 7.58 (5.24–10.5) | <0.0001 | 245% |
| np‐tau217 (pg/mL) | 392 | 54.6 (44.3–66) | 201 | 51.8 (41.4‐62.7) | 191 | 58.1 (48.7–71.7) | <0.0001 | 12.2% |
| Fujirebio Lumipulse | ||||||||
| Aβ42 (pg/mL) | 392 | 26.9 (23.4–31) | 201 | 28.1 (24.2–32.6) | 191 | 25.5 (22.2–28.8) | <0.0001 | −9.3% |
| Aβ40 (pg/mL) | 392 | 301 (267–342) | 201 | 300 (267–338) | 191 | 307 (267–345) | =0.43 | 2.3% |
| Aβ42/Aβ40 | 392 | 0.0883 (0.0804–0.0965) | 201 | 0.0944 (0.0865–0.102) | 191 | 0.082 (0.0781–0.0887) | <0.0001 | −13.1% |
| p‐tau217 (pg/mL) | 392 | 0.158 (0.089–0.326) | 201 | 0.094 (0.065–0.143) | 191 | 0.334 (0.196–0.52) | <0.0001 | 255% |
| ALZpath Quanterix | ||||||||
| p‐tau217 (pg/mL) | 392 | 0.432 (0.251–0.746) | 201 | 0.275 (0.202–0.395) | 191 | 0.741 (0.53–1.09) | <0.0001 | 170% |
| Janssen LucentAD Quanterix | ||||||||
| p‐tau217 (pg/mL) | 392 | 0.059 (0.038–0.1) | 201 | 0.041 (0.029–0.055) | 191 | 0.098 (0.069–0.143) | <0.0001 | 139% |
| Roche NeuroToolKit | ||||||||
| Aβ42 (pg/mL) | 392 | 37.7 (32.4–42.7) | 201 | 39.3 (34.2–44.9) | 191 | 36.1 (30.7–40.9) | <0.0001 | −8.1% |
| Aβ40 (ng/mL) | 392 | 0.308 (0.276–0.342) | 201 | 0.305 (0.276–0.339) | 191 | 0.310 (0.278–0.343) | =0.54 | 1.6% |
| Aβ42/Aβ40 | 392 | 0.122 (0.111–0.133) | 201 | 0.131 (0.12–0.141) | 191 | 0.115 (0.108–0.122) | <0.0001 | −12.2% |
| p‐tau181 (pg/mL) | 392 | 1.15 (0.855–1.58) | 201 | 0.922 (0.739–1.15) | 191 | 1.53 (1.15–1.95) | <0.0001 | 65.9% |
| GFAP (ng/mL) | 392 | 0.116 (0.0826–0.164) | 201 | 0.0908 (0.0712–0.126) | 191 | 0.149 (0.108–0.192) | <0.0001 | 64.1% |
| NfL (pg/mL) | 392 | 4.02 (3.11–5.39) | 201 | 3.64 (2.77–4.64) | 191 | 4.64 (3.57–6.12) | <0.0001 | 27.5% |
| Quanterix Neurology 4‐Plex | ||||||||
| Aβ42 (pg/mL) | 342 | 6.32 (5.36–7.43) | 183 | 6.68 (5.67–8.09) | 159 | 6.01 (5.04–6.87) | <0.0001 | −10.0% |
| Aβ40 (pg/mL) | 342 | 108 (91.8–130) | 183 | 106 (90–130) | 159 | 111 (93.3–130) | =0.60 | 4.7% |
| Aβ42/Aβ40 | 342 | 0.0578 (0.0518–0.0651) | 183 | 0.0617 (0.0556‐0.0678) | 159 | 0.0545 (0.0483–0.0589) | <0.0001 | −11.7% |
| p‐tau181 (pg/mL) | 342 | 20.3 (14.6–30.8) | 183 | 17.1 (12.4–22.5) | 159 | 26.5 (19.2‐36.3) | <0.0001 | 55.0% |
| GFAP (pg/mL) | 342 | 168 (114–246) | 183 | 134 (103–184) | 159 | 216 (155–283) | <0.0001 | 61.2% |
| NfL (pg/mL) | 342 | 22.9 (16.6–30.8) | 183 | 20.1 (14.4–26.7) | 159 | 25.6 (19.8–37) | <0.0001 | 27.4% |
Note: All individuals (n = 392) had plasma biomarker measures for the C2N PrecivityAD2, Fujirebio Lumipulse, ALZpath Quanterix, Janssen LucentAD Quanterix, and Roche NeuroToolKit assays. A sub‐cohort (n = 342) additionally had plasma biomarker measures for the Quanterix Neurology 4‐Plex assays. Continuous values are presented as the median with the interquartile range. The significance of unadjusted differences by amyloid PET status were evaluated with Wilcoxon's rank‐sum tests. All tests were two sided. The percent difference by amyloid PET status in the median plasma biomarker level is shown (difference in the medians for amyloid PET positive and negative groups divided by the median for the amyloid PET negative group times 100).
3.5. Classification of amyloid PET status by plasma biomarkers
The classification accuracies of individual plasma biomarkers for amyloid PET status as defined by Centiloid > 20 or ≤20 were evaluated using logistic regression models in the full cohort. With the expectation that companies may provide a panel of plasma biomarkers, models that combined plasma biomarkers from the same company were also examined (Figure 2 and Figure 3). The highest classification accuracies of amyloid PET status in the full cohort were achieved by C2N PrecivityAD2 and Fuijirebio Lumipulse models that included measures of both p‐tau217 and Aβ42/Aβ40 (Table 3). However, the C2N PrecivityAD2%p‐tau217 and Aβ42/Aβ40 combined model (receiver operating characteristic AUC 0.929 [95% confidence intervals 0.902–0.956]) was not superior to the model with %p‐tau217 alone (AUC 0.927 [0.900–0.955]), p = 0.54. For C2N PrecivityAD2%p‐tau217, a cutoff of 4.06% yielded a positive percent agreement (PPA) of 88.5%, a negative percent agreement (NPA) of 87.1%, an overall percent accuracy of 87.8%, a PPV of 86.7%, and an NPV of 88.8% for amyloid PET status (Table 4). The Fujirebio Lumipulse p‐tau217 and Aβ42/Aβ40 combined model (AUC 0.911 [0.882–0.940]) did not have significantly different performance from the C2N PrecivityAD2%p‐tau217 and Aβ42/Aβ40 combined model (p = 0.16), or the model with Fujirebio Lumipulse p‐tau217 alone (AUC 0.896 [0.864–0.928], p = 0.12), (Table 3). For Fujirebio Lumipulse p‐tau217, a cutoff of 0.158 pg/mL yielded a PPA of 84.3%, a NPA of 82.1%, an accuracy of 83.2%, a PPV of 81.7%, and a NPV of 84.6% (Table 4).
FIGURE 2.

Receiver operating characteristics area under the curve plots for amyloid PET status in the full cohort. All individuals (n = 392) had plasma biomarker measures for the C2N PrecivityAD2, Fujirebio Lumipulse, ALZpath Quanterix, Janssen LucentAD Quanterix, and Roche NeuroToolKit assays. A sub‐cohort (n = 342) additionally had plasma biomarker measures for the Quanterix Neurology 4‐Plex assays. The best performing plasma biomarker measure or combination of measures from each company is shown for unadjusted models of amyloid PET > or ≤20 Centiloids. The solid black line represents a model of covariates alone. The dotted black line represents chance classification.
FIGURE 3.

Classification accuracies of individual and combined plasma biomarker measures for key outcomes in the full cohort. All individuals (n = 392) had plasma biomarker measures for the C2N PrecivityAD2, Fujirebio Lumipulse, ALZpath Quanterix, Janssen LucentAD Quanterix, and Roche NeuroToolKit assays. A sub‐cohort (n = 342) additionally had plasma biomarker measures for the Quanterix Neurology 4‐Plex assays. The receiver operating characteristics area under the curve (AUC) point estimate (midpoint) and 95% confidence intervals are shown for classification of amyloid positron emission tomography (PET) status (> or ≤20 Centiloids), early tau PET status, cortical thickness status, and cognitive impairment status (CDR > 0 or = 0) by individual or combined plasma biomarker measures. The dashed vertical reference lines represent the AUCs for models including only covariates (age, sex, apolipoprotein E [APOE] genotype) as predictors. Please see the Methods section and Appendix A for definitions of early tau PET status and cortical thickness status.
TABLE 3.
Classification accuracies of individual and combined plasma biomarker measures for amyloid PET status defined by Centiloid > 20 or ≤20 in the full cohort.
| Unadjusted for covariates | Adjusted for covariates | ||||||
|---|---|---|---|---|---|---|---|
| Company | Analytes | AUC |
Within‐company comparisons p‐value |
Across‐company comparisons p‐value |
AUC |
Within‐company comparisons p‐value |
Across‐company comparisons p‐value |
|
C2N PrecivityAD2 |
%p‐tau217 + Aβ42/Aβ40 | 0.929 (0.902–0.956) | REFERENCE | REFERENCE | 0.932 (0.905–0.958) | REFERENCE | REFERENCE |
| %p‐tau217 | 0.927 (0.900–0.955) | =0.54 | 0.931 (0.904–0.957) | =0.59 | |||
| p‐tau217 + Aβ42/Aβ40 | 0.921 (0.893–0.950) | =0.21 | 0.926 (0.898–0.953) | =0.38 | |||
| p‐tau217 | 0.916 (0.887–0.946) | =0.11 | 0.923 (0.895–0.951) | =0.35 | |||
| Aβ42/Aβ40 | 0.751 (0.703–0.799) | <0.0001 | 0.788 (0.743–0.833) | <0.0001 | |||
|
Fujirebio Lumipulse |
p‐tau217 + Aβ42/Aβ40 | 0.911 (0.882–0.940) | REFERENCE | =0.16 | 0.913 (0.886–0.941) | REFERENCE | =0.12 |
| p‐tau217 | 0.896 (0.864–0.928) | =0.12 | 0.903 (0.873–0.932) | =0.17 | |||
| Aβ42/Aβ40 | 0.787 (0.741–0.833) | <0.0001 | 0.816 (0.774–0.859) | <0.0001 | |||
| ALZpath Quanterix | p‐tau217 | 0.885 (0.851–0.920) | =0.0006 | 0.903 (0.873–0.934) | =0.011 | ||
|
Janssen LucentAD Quanterix |
p‐tau217 | 0.882 (0.848–0.916) | =0.0006 | 0.896 (0.864–0.927) | =0.0047 | ||
|
Roche NeuroToolKit |
p‐tau181 + Aβ42/Aβ40 + GFAP + NfL | 0.873 (0.838–0.909) | REFERENCE | =0.0006 | 0.888 (0.855–0.921) | REFERENCE | =0.0047 |
| p‐tau181 + Aβ42/Aβ40 + NfL | 0.871 (0.835–0.908) | =0.67 | 0.884 (0.850–0.918) | =0.29 | |||
| p‐tau181 + Aβ42/Aβ40 | 0.871 (0.834–0.907) | =0.67 | 0.884 (0.850–0.917) | =0.29 | |||
| p‐tau181 | 0.815 (0.772–0.858) | =0.0003 | 0.851 (0.813–0.888) | =0.0011 | |||
| Aβ42/Aβ40 | 0.775 (0.728–0.823) | <0.0001 | 0.806 (0.763–0.850) | <0.0001 | |||
| GFAP | 0.758 (0.710–0.806) | <0.0001 | 0.814 (0.772–0.857) | <0.0001 | |||
| NfL | 0.677 (0.624–0.729) | <0.0001 | 0.775 (0.730–0.820) | <0.0001 | |||
|
Quanterix Neurology 4‐Plex |
p‐tau181 + Aβ42/Aβ40 + GFAP + NfL | 0.808 (0.763–0.854) | REFERENCE | <0.0001 | 0.846 (0.805–0.887) | REFERENCE | 0.0032 |
| p‐tau181 + Aβ42/Aβ40 | 0.782 (0.733–0.830) | =0.083 | 0.820 (0.775–0.864) | =0.036 | |||
| p‐tau181 + Aβ42/Aβ40 + NfL | 0.781 (0.733–0.829) | =0.053 | 0.823 (0.779–0.867) | =0.036 | |||
| GFAP | 0.756 (0.704–0.807) | =0.011 | 0.815 (0.769–0.860) | =0.016 | |||
| p‐tau181 | 0.747 (0.694–0.799) | =0.012 | 0.796 (0.750–0.843) | =0.0043 | |||
| Aβ42/Aβ40 | 0.734 (0.681–0.787) | =0.0046 | 0.786 (0.737–0.835) | =0.0022 | |||
| NfL | 0.670 (0.613–0.727) | <0.0001 | 0.769 (0.719–0.818) | <0.0001 | |||
Note: The receiver operating characteristics area under the curve (AUC) point estimate (midpoint) and 95% confidence intervals are shown for classification of amyloid PET status (> or ≤20 Centiloids) by individual or combined plasma biomarker measures. Both the unadjusted AUC and the AUC adjusted for age, sex, and APOE genotype are provided. AUCs were compared using DeLong's test. The Benjamin‐Hochberg procedure was used to adjust for multiple comparisons with the reference measure, either within a company or across companies. The AUC for a model with covariates only was 0.733 (0.684–0.782).
TABLE 4.
Classification accuracies of individual plasma biomarker measures for amyloid PET status defined by Centiloid > 20 or ≤20 in the full cohort.
| Company | Analyte | AUC | Cutoff | Brier Score | PPA | NPA | Accuracy | PPV | NPV |
|---|---|---|---|---|---|---|---|---|---|
|
C2N PrecivityAD2 |
%p‐tau217 | 0.927 (0.900–0.955) | 4.06 (%) | 0.098 | 0.885 | 0.871 | 0.878 | 0.867 | 0.888 |
| p‐tau217 | 0.916 (0.887–0.946) | 2.34 (pg/mL) | 0.107 | 0.864 | 0.871 | 0.867 | 0.864 | 0.871 | |
| Aβ42/Aβ40 | 0.751 (0.703–0.799) | 0.0924 | 0.205 | 0.717 | 0.672 | 0.694 | 0.675 | 0.714 | |
|
Fujirebio Lumipulse |
p‐tau217 | 0.896 (0.864–0.928) | 0.158 (pg/mL) | 0.129 | 0.843 | 0.821 | 0.832 | 0.817 | 0.846 |
| Aβ42/Aβ40 | 0.787 (0.741–0.833) | 0.0869 | 0.190 | 0.723 | 0.751 | 0.737 | 0.734 | 0.740 | |
| ALZpath Quanterix | p‐tau217 | 0.885 (0.851–0.920) | 0.444 (pg/mL) | 0.129 | 0.843 | 0.831 | 0.837 | 0.826 | 0.848 |
| Janssen LucentAD Quanterix | p‐tau217 | 0.882 (0.848–0.916) | 0.0615 (pg/mL) | 0.138 | 0.806 | 0.831 | 0.819 | 0.819 | 0.819 |
| Roche NeuroToolKit | p‐tau181 | 0.815 (0.772–0.858) | 1.14 (pg/mL) | 0.177 | 0.775 | 0.746 | 0.760 | 0.744 | 0.777 |
| Aβ42/Aβ40 | 0.775 (0.728–0.823) | 0.126 | 0.197 | 0.864 | 0.627 | 0.742 | 0.688 | 0.829 | |
| GFAP | 0.758 (0.710–0.806) | 0.113 (ng/mL) | 0.203 | 0.728 | 0.682 | 0.704 | 0.685 | 0.725 | |
| NfL | 0.677 (0.624–0.729) | 4.29 (pg/mL) | 0.228 | 0.592 | 0.682 | 0.638 | 0.638 | 0.637 | |
|
Quanterix Neurology 4‐Plex |
GFAP | 0.756 (0.704–0.807) | 205 (pg/mL) | 0.204 | 0.597 | 0.814 | 0.713 | 0.736 | 0.700 |
| p‐tau181 | 0.747 (0.694–0.799) | 20.5 (pg/mL) | 0.211 | 0.717 | 0.694 | 0.705 | 0.671 | 0.738 | |
| Aβ42/Aβ40 | 0.734 (0.681–0.787) | 0.0582 | 0.214 | 0.730 | 0.689 | 0.708 | 0.671 | 0.746 | |
| NfL | 0.670 (0.613–0.727) | 21.7 (pg/mL) | 0.229 | 0.686 | 0.574 | 0.626 | 0.583 | 0.677 |
Note: The receiver operating characteristics area under the curve (AUC) point estimate (midpoint) and 95% confidence intervals are shown for classification of amyloid PET status (> or ≤20 Centiloids) by plasma biomarker measures. The single cutoff for the plasma biomarker that best distinguishes amyloid PET status based on the Youden index is shown, as well as the positive percent agreement (PPA) and negative percent agreement (NPA), overall accuracy, Brier score (confidence of model prediction), positive predictive value (PPV), and negative predictive value (NPV) of the cutoff for amyloid PET status in the full cohort, which has a 48.7% rate of amyloid PET positivity based on a cutoff of > 20 Centiloids.
Compared to the C2N PrecivityAD2 combined model, the ALZpath Quanterix p‐tau217 and Janssen LucentAD Quanterix p‐tau217 models had significantly lower performance (ALZpath Quanterix AUC 0.885 [0.851–0.920]; Janssen LucentAD Quanterix AUC 0.882 [0.848–0.916]), p = 0.0006 for both versus the C2N PrecivityAD2 combined model (Table 3). For the Roche NeuroToolKit and Quanterix Neurology 4‐Plex assays, models including p‐tau181, Aβ42/Aβ40, NfL, and GFAP were most accurate (Roche NeuroToolKit AUC 0.873 [0.838–0.909]; Quanterix Neurology 4‐Plex AUC 0.808 [0.763–0.854]), but were not significantly better than models including only p‐tau181 and Aβ42/Aβ40 (Roche NeuroToolKit AUC 0.871 [0.834–0.907], p = 0.67 for the two compared to the four analyte model; Quanterix Neurology 4‐Plex AUC 0.782 [0.733–0.830], p = 0.083 for the two compared to the four analyte model), (Table 3). Findings were nearly identical for models including covariates of age, sex, and APOE genotype (Table 3).
In a sub‐cohort of 122 individuals with CSF data available, the classification accuracies of the plasma biomarker models for amyloid PET status were directly compared to CSF Elecsys p‐tau181/Aβ42. In this smaller sample, the classification accuracy of the CSF Elecsys p‐tau181/Aβ42 model (AUC 0.915 [0.864–0.967]) was not significantly different from the classification accuracies of the top performing plasma models for all six companies: C2N PrecivityAD2%p‐tau217 + Aβ42/Aβ40 (AUC 0.907 [0.851–0.963], p = 0.67); Fujirebio Lumipulse p‐tau217 + Aβ42/Aβ40 (AUC 0.897 [0.840–0.955], p = 0.58); ALZpath Quanterix p‐tau217 (AUC 0.883 [0.822–0.945], p = 0.22); Janssen LucentAD Quanterix p‐tau217 (AUC 0.858 [0.792–0.924], p = 0.12); Roche NeuroToolKit p‐tau181 + Aβ42/Aβ40 + GFAP + NfL (AUC 0.834 [0.760–0.908], p = 0.098); Quanterix Neurology 4‐Plex p‐tau181 + Aβ42/Aβ40 + GFAP + NfL (AUC 0.822 [0.740‐0.905], p = 0.13), (Tables S6, S7).
The classification accuracies of plasma biomarker models of amyloid PET status as defined by Centiloid > 20 were evaluated in the sub‐cohort of 192 individuals with cognitive impairment (CDR > 0), which is relevant to clinical practice in which biomarker testing is limited to patients with cognitive impairment (Figure 4, Table S8). Classification accuracies were slightly higher than in the full cohort: the C2N PrecivityAD2%p‐tau217 and Aβ42/Aβ40 combined model had an AUC of 0.958 [0.932–0.985] and the Fujirebio Lumipulse p‐tau217 and Aβ42/Aβ40 combined model had an AUC of 0.952 [0.925–0.980]. In the cognitively impaired sub‐cohort, a C2N PrecivityAD2%p‐tau217 cutoff of 4.85% had a PPA of 87.8%, a NPA of 92.2%, and an accuracy of 89.6%; a Fujirebio Lumipulse p‐tau217 cutoff of 0.207 pg/mL had a PPA of 85.2%, a NPA of 92.2%, and an accuracy of 88.0%; an ALZpath Quanterix p‐tau217 cutoff of 0.462 pg/mL had a PPA of 92.2%, a NPA of 84.4%, and an accuracy of 89.1%; a Janssen LucentAD Quanterix p‐tau217 cutoff of 0.0695 pg/mL had a PPA of 87.0%, a NPA of 87.0%, and an accuracy of 87.0%. (Table S9).
FIGURE 4.

Classification accuracies of individual and combined plasma biomarker measures for amyloid PET. Classification accuracies are shown for the full cohort (n = 392), cognitively impaired sub‐cohort (n = 192), and cognitively unimpaired sub‐cohort (n = 200). The receiver operating characteristics area under the curve (AUC) point estimate (midpoint) and 95% confidence intervals are shown for classification of amyloid positron emission tomography (PET) status (> or ≤20 Centiloids) by individual or combined plasma biomarker measures. The dashed vertical reference lines represent the AUCs for models including only covariates (age, sex, apolipoprotein [APOE] genotype) as predictors.
Conversely, classification accuracies were lower in the sub‐cohort of 200 individuals who were cognitively unimpaired (CDR = 0), which is relevant to clinical trials of preventative treatments (Figure 4, Tables S10, S11). The C2N PrecivityAD2%p‐tau217 model had an AUC of 0.892 [0.842–0.942] and was statistically superior to the best performing models from other companies including the Fujirebio Lumipulse combined model, which had an AUC of 0.840 [0.782–0.897], p = 0.024. If a more abnormal cutoff value were chosen for amyloid PET positivity (Centiloid > 37), the classification accuracies were similar or slightly higher for p‐tau217 and p‐tau181 models and were similar or slightly lower for Aβ42/Aβ40 models in the full cohort (Tables S12, S13), cognitively impaired sub‐cohort (Tables S14, S15), and cognitively unimpaired sub‐cohort (Tables S16, S17).
Cutoffs for amyloid status that were previously published or reported by the company were examined in the full cohort (Table S18). Notably, these cutoffs were developed in different cohorts and may have been determined using different standards for amyloid positivity than in the current study (amyloid PET Centiloid > 20). For C2N PrecivityAD2%p‐tau217, the cutoff of 4.2% for distinguishing amyloid status that was previously reported 25 was similar to the cutoff determined in the current study (4.06%), with similar accuracy for classifying amyloid PET status (86.7% for Meyer cutoff, 87.8% for current study cutoff). For ALZpath Quanterix p‐tau217, the cutoff of 0.42 pg/mL that was previously reported 26 was also similar to the cutoff determined in the current study (0.444 pg/mL), with similar accuracy (82.4% for Ashton cutoff, 83.7% for current study cutoff). , ,
3.6. Correlations between amyloid PET Centiloid and plasma biomarkers
Correlations between amyloid PET Centiloid and individual plasma biomarkers were examined with Spearman correlations because of expected non‐linearity in these relationships (Figure 5). In the full cohort, amyloid PET Centiloid had the strongest correlation with the C2N PrecivityAD2%p‐tau217 (unadjusted Spearman ρ = 0.771 [95% confidence intervals 0.735 to 0.804]), which was superior to correlations of analytes from other companies including with Fujirebio Lumipulse p‐tau217 (ρ = 0.715 [0.663 to 0.760], p = 0.011), ALZpath Quanterix p‐tau217 (ρ = 0.702 [0.649 to 0.748], p = 0.0040), and Janssen LucentAD Quanterix p‐tau217 (ρ = 0.699 [0.647 to 0.748], p = 0.0029) (Figure 6, Table 5). Correlations between amyloid PET Centiloid and p‐tau181 were much lower as compared to C2N PrecivityAD2%p‐tau217: Roche NeuroToolKit p‐tau181 (ρ = 0.547 [0.472 to 0.618], p < 0.0001) and Quanterix Neurology 4‐Plex p‐tau181 (ρ = 0.438 (0.351 to 0.512), p < 0.0001). Correlations between amyloid PET Centiloid and Aβ42/Aβ40 were also lower, ranging from a correlation of ρ = −0.531 (−0.595 to −0.455) for the Roche NeuroToolKit to ρ = −0.404 (−0.486 to −0.316) for the Quanterix Neurology 4‐Plex. Findings were similar for models including covariates of age, sex, and APOE genotype (Table 5).
FIGURE 5.

Scatterplots of plasma biomarker measures and amyloid positron emission tomography (PET) Centiloid. The best performing plasma biomarker measure from each company is shown. All individuals (n = 392) had plasma biomarker measures for the C2N PrecivityAD2, Fujirebio Lumipulse, ALZpath Quanterix, Janssen LucentAD Quanterix, and Roche NeuroToolKit assays. A sub‐cohort (n = 342) additionally had plasma biomarker measures for the Quanterix Neurology 4‐Plex assays. Point colors represent the following: blue, cognitively unimpaired and amyloid PET negative; green, cognitively impaired, and amyloid PET negative; orange, cognitively unimpaired and amyloid PET positive; red, cognitively impaired, and amyloid PET positive.
FIGURE 6.
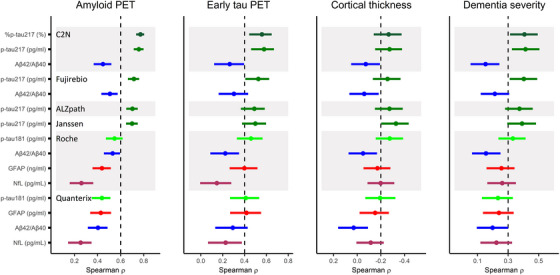
Correlations between individual plasma biomarker measures and key outcomes in the full cohort. All individuals (n = 392) had plasma biomarker measures for the C2N PrecivityAD2, Fujirebio Lumipulse, ALZpath Quanterix, Janssen LucentAD Quanterix, and Roche NeuroToolKit assays. A sub‐cohort (n = 342) additionally had plasma biomarker measures for the Quanterix Neurology 4‐Plex assays. The unadjusted Spearman correlation point estimate (midpoint) and 95% confidence intervals with plasma biomarker measures is shown for amyloid positron emission tomography (PET) Centiloid, the early tau PET measure, cortical thickness, and dementia severity by the Clinical Dementia Rating Sum of Boxes. The dashed vertical reference lines are arbitrary and presented to aide in visual interpretation.
TABLE 5.
Correlations between individual plasma biomarker measures and amyloid PET Centiloid in the full cohort.
| Unadjusted for covariates | Adjusted for covariates | ||||
|---|---|---|---|---|---|
| Company | Measure |
Spearman rho (95% CI) |
p‐value |
Partial Spearman rho (95% CI) |
p‐value |
|
C2N PrecivityAD2 |
%p‐tau217 (%) | 0.771 (0.735 to 0.804) | REFERENCE | 0.723 (0.674 to 0.767) | REFERENCE |
| p‐tau217 (pg/mL) | 0.757 (0.713 to 0.798) | =0.25 | 0.717 (0.661 to 0.762) | =0.66 | |
| Aβ42/Aβ40 | −0.447 (−0.521 to −0.372) | <0.0001 | −0.355 (−0.444 to −0.260) | <0.0001 | |
|
Fujirebio Lumipulse |
p‐tau217 (pg/mL) | 0.715 (0.663 to 0.760) | =0.011 | 0.674 (0.615 to 0.732) | =0.054 |
| Aβ42/Aβ40 | −0.507 (−0.574 to −0.433) | <0.0001 | −0.427 (−0.503 to −0.347) | <0.0001 | |
|
ALZpath Quanterix |
p‐tau217 (pg/mL) | 0.702 (0.649 to 0.748) | =0.0040 | 0.669 (0.605 to 0.725) | =0.037 |
|
Janssen LucentAD Quanterix |
p‐tau217 (pg/mL) | 0.699 (0.647 to 0.748) | =0.0029 | 0.653 (0.581 to 0.711) | =0.0099 |
|
Roche NeuroToolKit |
p‐tau181 (pg/mL) | 0.547 (0.472 to 0.618) | <0.0001 | 0.509 (0.416 to 0.589) | <0.0001 |
| Aβ42/Aβ40 | −0.531 (−0.595 to −0.455) | <0.0001 | −0.445 (−0.527 to −0.359) | <0.0001 | |
| GFAP (ng/mL) | 0.438 (0.356 to 0.516) | <0.0001 | 0.393 (0.302 to 0.477) | <0.0001 | |
| NfL (pg/mL) | 0.260 (0.159 to 0.363) | <0.0001 | 0.234 (0.133 to 0.328) | <0.0001 | |
|
Quanterix Neurology 4‐Plex |
p‐tau181 (pg/mL) | 0.438 (0.351 to 0.512) | <0.0001 | 0.386 (0.285 to 0.475) | <0.0001 |
| GFAP (pg/mL) | 0.428 (0.335 to 0.516) | <0.0001 | 0.369 (0.267 to 0.460) | <0.0001 | |
| Aβ42/Aβ40 | −0.404 (−0.486 to −0.316) | <0.0001 | −0.307 (−0.404 to −0.211) | <0.0001 | |
| NfL (pg/mL) | 0.254 (0.146 to 0.351) | <0.0001 | 0.194 (0.081 to 0.298) | <0.0001 | |
Note: The unadjusted Spearman correlation with amyloid PET Centiloid, and the partial Spearman correlation adjusting for age, sex, and APOE genotype, are shown with 95% confidence intervals. Correlations between the top performing measure and other measures were compared by bootstrapping.
In the cognitively impaired sub‐cohort, the correlation of C2N PrecivityAD2%p‐tau217 with amyloid PET Centiloid was ρ = 0.792 [0.744 to 0.832], which was not significantly different from Fujirebio Lumipulse p‐tau217 (ρ = 0.792 [0.746 to 0.829], p = 0.97), ALZpath Quanterix p‐tau217 (ρ = 0.768 [0.714 to 0.807], p = 0.35), or Janssen LucentAD Quanterix p‐tau217 (ρ = 0.744 [0.680 to 0.792], 0.087), (Figure 7, Table S19). Correlations between amyloid PET Centiloid and p‐tau181 remained lower as compared to C2N PrecivityAD2%p‐tau217: Roche NeuroToolKit p‐tau181 (ρ = 0.613 [0.519 to 0.685], p < 0.0001) and Quanterix Neurology 4‐Plex p‐tau181 (ρ = 0.512 [0.401 to 0.606], p < 0.0001). Correlations between amyloid PET Centiloid and Aβ42/Aβ40 were also low, ranging from a correlation of ρ = −0.521 (−0.636 to −0.412) for the Roche NeuroToolKit to ρ = −0.384 (−0.506 to −0.248) for the Quanterix Neurology 4‐Plex.
FIGURE 7.

Correlations between individual plasma biomarker measures and amyloid positron emission tomography (PET) Centiloid in sub‐cohorts. All individuals (n = 392) had plasma biomarker measures for the C2N PrecivityAD2, Fujirebio Lumipulse, ALZpath Quanterix, Janssen LucentAD Quanterix, and Roche NeuroToolKit assays. A sub‐cohort (n = 342) additionally had plasma biomarker measures for the Quanterix Neurology 4‐Plex assays. The unadjusted Spearman correlation point estimate (midpoint) and 95% confidence intervals are shown for amyloid PET Centiloid, the early tau PET measure, cortical thickness, and dementia severity by the Clinical Dementia Rating Sum of Boxes. The dashed vertical reference lines are arbitrary and presented to aide in visual interpretation.
In the cognitively unimpaired sub‐cohort, C2N PrecivityAD2%p‐tau217 had a significantly higher correlation with amyloid PET Centiloid (ρ = 0.679 [0.592 to 0.756]) compared to the other p‐tau217 measures: Janssen LucentAD Quanterix (ρ = 0.580 [0.477 to 0.683), p = 0.030), Fujirebio Lumipulse (ρ = 0.563 [0.447 to 0.661], p = 0.019), and ALZpath Quanterix (ρ = 0.546 [0.422 to 0.658], p = 0.0078), (Figure 7, Table S20). Correlations between amyloid PET Centiloid and p‐tau181 dropped much lower in this sub‐cohort as compared to C2N PrecivityAD2%p‐tau217: Roche NeuroToolKit p‐tau181 (ρ = 0.389 [0.253 to 0.525], p < 0.0001) and Quanterix Neurology 4‐Plex p‐tau181 (ρ = 0.293 [0.132 to 0.440], p < 0.0001). In contrast, correlations between amyloid PET Centiloid and Aβ42/Aβ40 remained relatively similar, ranging from a correlation of ρ = −0.484 (−0.584 to −0.371) for the Roche NeuroToolKit to ρ = −0.352 (−0.470 to −0.221) for the Quanterix Neurology 4‐Plex.
In a sub‐cohort with amyloid PET > 20 Centiloids, Fujirebio Lumipulse p‐tau217 had a correlation of ρ = 0.518 [0.401 to 0.615] with amyloid PET Centiloid, which was not statistically different than correlations for the C2N PrecivityAD2%p‐tau217 (ρ = 0.494 [0.366 to 0.593], p = 0.70), Janssen LucentAD Quanterix p‐tau217 (ρ = 0.509 [0.393 to 0.606], p = 0.83), or ALZpath Quanterix p‐tau217 (ρ = 0.496 [0.384 to 0.596], p = 0.62) (Figure 7, Table S21). In a sub‐cohort with amyloid PET ≤20 Centiloids, very low levels of amyloid burden had the highest correlations with Roche NeuroToolKit Aβ42/Aβ40 (ρ = −0.349 [−0.472 to −0.211]), Fujirebio Lumipulse Aβ42/Aβ40 (ρ = −0.248 [−0.372 to −0.109]), and C2N PrecivityAD2%p‐tau217 (ρ = 0.245 [0.102 to 0.379]), (Figure 7, Table S22).
3.7. Classification of tau PET status by plasma biomarkers
The classification accuracies of individual and combined plasma biomarkers for early tau PET status as defined by flortaucipir signal in the mesial temporal meta‐ROI (entorhinal, parahippocampus, and amygdala) were evaluated using logistic regression models in the full cohort (Figure 3, Tables S23, S24). The highest performing models from each company included either p‐tau217 or p‐tau181 and were not significantly different from one another: C2N PrecivityAD2%p‐tau217 (AUC 0.888 [0.836–0.940]), Fujirebio Lumipulse p‐tau217 (AUC 0.859 [0.802–0.916]), ALZpath Quanterix p‐tau217 (AUC 0.850 [0.788–0.912]), Janssen LucentAD Quanterix p‐tau217 (AUC 0.846 [0.780–0.912]), Roche NeuroToolKit p‐tau181 + Aβ42/Aβ40 + GFAP + NfL (AUC 0.874 [0.823–0.925]), and Quanterix Neurology 4‐Plex p‐tau181 + Aβ42/Aβ40 + GFAP + NfL (AUC 0.874 [0.819–0.930]). Notably, the Roche NeuroToolKit p‐tau181 (0.823 [0.755–0.891]) and Quanterix Neurology 4‐Plex p‐tau181 (0.803 [0.724–0.883]) models were not significantly different from the models combining all four analytes (p = 0.095 for difference in Roche NeuroToolKit 2 vs. 4 analyte models; p = 0.10 for difference in Quanterix Neurology 4‐Plex 2 vs. 4 analyte models).
In the cognitively impaired sub‐cohort, classification accuracies for early tau PET status were slightly higher, including for the C2N PrecivityAD2%p‐tau217 (AUC 0.921 [0.857–0.985]) and Janssen LucentAD Quanterix p‐tau217 (AUC 0.921 [0.855–0.986]) models, and again there were no significant differences between the top performing models from each company (Tables S25, S26). In the cognitively unimpaired sub‐cohort, classification accuracies were lower for the C2N PrecivityAD2%p‐tau217 (AUC 0.805 [0.707–0.903]) and Janssen LucentAD Quanterix p‐tau217 (AUC 0.677 [0.522–0.833]) models (Table S27). In the sub‐cohort with amyloid PET > 20 Centiloids, classification accuracies for models of early tau PET status were lower than in the full cohort, including for the C2N PrecivityAD2%p‐tau217 (AUC 0.792 [0.694–0.891]) and Janssen LucentAD Quanterix p‐tau217 (AUC 0.744 [0.638–0.850]) models, (Tables S28, S29).
The classification accuracies of individual and combined plasma biomarkers for late tau PET status as defined by flortaucipir signal in the temporal‐parietal meta‐ROI (entorhinal, parahippocampus, amygdala, fusiform, inferior and middle temporal gyri) were evaluated using logistic regression models in the full cohort (Table S30). The highest performing models were C2N PrecivityAD2%p‐tau217 + Aβ42/Aβ40 (AUC 0.901 [0.823–0.980]), Janssen LucentAD Quanterix p‐tau217 (AUC 0.879 [0.796–0.961]), and Fujirebio Lumipulse p‐tau217 (AUC 0.878 [0.797–0.958]). As with early tau PET, classification accuracies for late tau PET status were slightly higher in the cognitively impaired sub‐cohort (Table S31), and lower in the cognitively unimpaired sub‐cohort (Table S32) and sub‐cohort with amyloid PET > 20 Centiloids (Table S33).
3.8. Correlations between tau PET and plasma biomarkers
Correlations between the early tau PET measure and individual plasma biomarkers were examined with Spearman correlations because of expected non‐linearity in these relationships (Figure 8). In the full cohort, the early tau PET measure had the highest correlation with C2N PrecivityAD2 p‐tau217 (ρ = 0.579 [0.468 to 0.666]), which was not different from correlations with Fujirebio Lumipulse p‐tau217 (ρ = 0.526 [0.416 to 0.620], p = 0.11), but was stronger than correlations with Janssen LucentAD Quanterix p‐tau217 (ρ = 0.499 [0.384 to 0.594], p = 0.022), ALZpath Quanterix p‐tau217 (ρ = 0.490 [0.371 to 0.586], p = 0.011), Roche NeuroToolKit p‐tau181 (ρ = 0.459 [0.341 to 0.568], p = 0.0061) and Quanterix Neurology 4‐Plex p‐tau181 (0.411 [0.266 to 0.535], p = 0.013), (Figure 6, Table S34).
FIGURE 8.
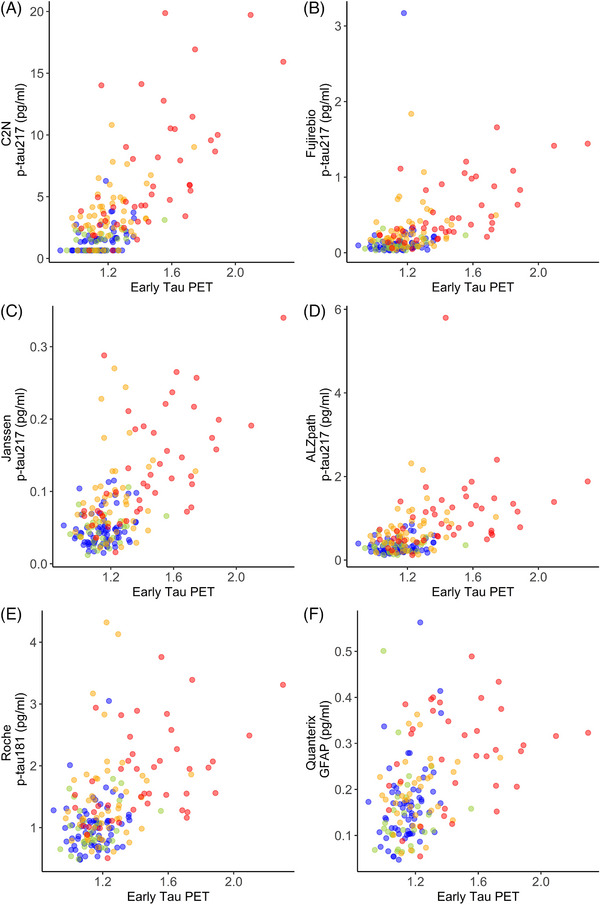
Scatterplots of plasma biomarker measures and the early tau positron emission tomography (PET) measure. The best performing plasma biomarker measure from each company is shown. All individuals (n = 188) had plasma biomarker measures for the C2N PrecivityAD2, Fujirebio Lumipulse, ALZpath Quanterix, Janssen LucentAD Quanterix, and Roche NeuroToolKit assays. A sub‐cohort (n = 161) additionally had plasma biomarker measures for the Quanterix Neurology 4‐Plex assays. Point colors represent the following: blue, cognitively unimpaired and amyloid PET negative; green, cognitively impaired, and amyloid PET negative; orange, cognitively unimpaired and amyloid PET positive; red, cognitively impaired, and amyloid PET positive.
In the cognitively impaired sub‐cohort, correlations with the early tau PET measure were stronger, including for C2N PrecivityAD2 p‐tau217 (ρ = 0.755 [0.626 to 0.833]) and Fujirebio Lumipulse p‐tau217 (ρ = 0.726 [0.591 to 0.818]), (Table S35). In the cognitively unimpaired cohort, correlations with the early tau PET measure were much weaker including for C2N PrecivityAD2 p‐tau217 (ρ = 0.401 [0.249 to 0.548]) and Fujirebio Lumipulse p‐tau217 (ρ = 0.324 [0.154 to 0.473]), (Table S36). In the sub‐cohort with amyloid PET > 20 Centiloids, correlations with the early tau PET measure were lower, but still strong for C2N PrecivityAD2 p‐tau217 (ρ = 0.600 [0.450 to 0.719]), Fujirebio Lumipulse p‐tau217 (ρ = 0.543 [0.395 to 0.663]), and Janssen LucentAD Quanterix p‐tau217 (ρ = 0.545 [0.391 to 0.676]), (Table S37).
Correlations were also examined for the late tau PET measure. In the full cohort, the late tau PET measure had similar patterns of correlations as the early tau PET measure but weaker correlations: the highest correlations were with C2N PrecivityAD2 p‐tau217 (ρ = 0.377 [0.243 to 0.507]) and Fujirebio Lumipulse p‐tau217 (ρ = 0.327 [0.187 to 0.456]), (Table S38). Patterns of correlations for the late tau PET measure were also similar but weaker than with the early tau PET measure in the cognitively impaired sub‐cohort (Table S39) and the sub‐cohort with amyloid PET > 20 Centiloids (Table S40). Correlations between the late tau PET measures and plasma biomarkers in the cognitively unimpaired sub‐cohort were not significant.
3.9. Classification of cortical thickness status by plasma biomarkers
Cortical thickness status was evaluated using logistic regression models in the full cohort (Figure 3, Tables S41, S42). As with tau PET, the highest performing models from each company included either p‐tau217 or p‐tau181 and did not vary significantly from one another in classification accuracy: Janssen LucentAD Quanterix p‐tau217 (AUC 0.849 [0.765–0.933]), Fujirebio Lumipulse p‐tau217 (AUC 0.841 [0.765–0.916]), C2N PrecivityAD2 p‐tau217 + Aβ42/Aβ40 (AUC 0.840 [0.765–0.914]), Roche NeuroToolKit p‐tau181 + Aβ42/Aβ40 + GFAP + NfL (AUC 0.838 [0.774–0.902]), ALZpath Quanterix p‐tau217 (AUC 0.833 [0.755–0.912]), and Quanterix Neurology 4‐Plex p‐tau181 + Aβ42/Aβ40 + NfL (AUC 0.783 [0.707–0.860]). In contrast, classification accuracy of cortical thickness status was lower for plasma NfL than covariates alone (AUC 0.758 [0.664–0.852] for covariates; AUC 0.743 [0.663–0.823] for Roche NeuroToolKit NfL; AUC 0.745 [0.662–0.829] for Quanterix Neurology 4‐Plex NfL). Classification accuracies were very similar in the cognitively impaired sub‐cohort (Tables S43, S44) and similar but slightly lower in the sub‐cohort with amyloid PET > 20 Centiloids (Tables S45, S46), with no significant differences between the top performing models for each company.
3.10. Correlations between cortical thickness and plasma biomarkers
Correlations between the cortical thickness measure and individual plasma biomarkers were examined with Spearman correlations. In the full cohort, the cortical thickness measure had the highest correlation with Janssen LucentAD Quanterix p‐tau217 (ρ = −0.327 [−0.436 to −0.217]), which was not different from correlations with Roche NeuroToolKit p‐tau181 (ρ = −0.275 [−0.386 to −0.165], p = 0.10) or C2N PrecivityAD2 p‐tau217 (ρ = −0.274 [−0.388 to −0.159], p = 0.79), but was higher than correlations with ALZpath Quanterix p‐tau217 (ρ = −0.273 [−0.383 to −0.166], p = 0.016), Fujirebio Lumipulse p‐tau217 (ρ = −0.256 [−0.369 to −0.138], p = 0.018), or Quanterix Neurology 4‐Plex p‐tau181 (ρ = −0.194 [−0.317 to −0.066], p = 0.010), (Table S47). Correlations between the cortical thickness measure and NfL were inferior to Janssen LucentAD Quanterix p‐tau217 (ρ = −0.198 [−0.314 to −0.085] for Roche NeuroToolKit NfL, p = 0.041; ρ = −0.114 (−0.234 to 0.000) for Quanterix Neurology 4‐Plex NfL, p = 0.0008).
In the cognitively impaired sub‐cohort, correlations with cortical thickness measure were higher, including for Janssen LucentAD Quanterix p‐tau217 (ρ = −0.425 [−0.568 to −0.277]), Fujirebio Lumipulse p‐tau217 (ρ = −0.384 [−0.520 to −0.222], and C2N PrecivityAD2 p‐tau217 (ρ = −0.356 [−0.497 to −0.196]), (Figure 6, Table S48). Correlations were even higher in the sub‐cohort with amyloid PET > 20 Centiloids, with the strongest correlations for Janssen LucentAD Quanterix p‐tau217 (ρ = −0.527 [−0.650 to −0.386]), Fujirebio Lumipulse p‐tau217 (ρ = −0.477 [−0.608 to −0.334]), and C2N PrecivityAD2 p‐tau217 (ρ = −0.458 [−0.585 to −0.317]), (Table S49).
3.11. Classification of cognitive status by plasma biomarkers
Cognitive status (CDR > 0, cognitively impaired; CDR = 0, cognitively normal) was evaluated using logistic regression models in the full cohort (Figure 3, Tables S50, S51). The classification accuracy of all models was relatively low. The highest performing model was C2N PrecivityAD2 p‐tau217 + Aβ42/Aβ40 (AUC 0.680 [0.627‐0.733]), but it was not significantly different from the top performing models from the other companies: Janssen LucentAD Quanterix p‐tau217 (AUC 0.670 [0.615–0.724], p = 0.46); Fujirebio Lumipulse p‐tau217 (AUC 0.667 [0.613–0.721], p = 0.40); ALZpath Quanterix p‐tau217 (AUC 0.664 [0.610–0.718], p = 0.40); Roche NeuroToolKit p‐tau181 + Aβ42/Aβ40 + NfL (AUC 0.648 [0.593‐0.703], p = 0.40); and Quanterix Neurology 4‐Plex p‐tau181 + Aβ42/Aβ40 + GFAP + NfL (AUC 0.635 [0.576‐0.695], p = 0.40). Classification accuracies were slightly higher in the sub‐cohort with amyloid PET > 20 Centiloids, but there was still no distinction between the top performing models (Tables S52, S53).
3.12. Correlations between dementia symptoms and plasma biomarkers
Correlations between dementia symptoms as measured by the CDR‐SB and individual plasma biomarkers were examined with Spearman correlations. In the full cohort, dementia symptoms had the highest correlation with C2N PrecivityAD2 p‐tau217 (ρ = 0.414 [0.325 to 0.505]), which was not different from correlations with Fujirebio Lumipulse p‐tau217 (ρ = 0.403 [0.311 to 0.490], p = 0.65), Janssen LucentAD Quanterix p‐tau217 (ρ = 0.391 [0.295 to 0.482], p = 0.34), or ALZpath Quanterix p‐tau217 (ρ = 0.374 [0.280 to 0.461], p = 0.074), but was stronger than correlations with Roche NeuroToolKit p‐tau181 (ρ = 0.331 [0.237 to 0.415], p = 0.0038), Roche NeuroToolKit NfL (ρ = 0.261 [0.164 to 0.351], p = 0.0022), Quanterix Neurology 4‐Plex p‐tau181 (ρ = 0.234 [0.131 to 0.332], p < 0.0001), and Quanterix Neurology 4‐Plex NfL (ρ = 0.224 [0.118 to 0.321], p = 0.0006), (Table S54). In the sub‐cohort with amyloid PET > 20 Centiloids, correlations were slightly higher and the findings were similar, with stronger correlations between dementia symptoms and p‐tau217 as compared to p‐tau181, (Table S55).
4. DISCUSSION
Head‐to‐head studies are essential to compare the performance of plasma assays and analytes. For the current study, the FNIH Biomarker Consortium sought to compare several leading commercial assays for plasma Aβ42/Aβ40, p‐tau181, and p‐tau217. Two assays for GFAP and NfL were also included. Based on CSF biomarker groupings described in the 2018 NIA‐AA AT(N) research framework for AD, 43 it might have been expected that plasma Aβ42/Aβ40 would best classify amyloid PET, that plasma p‐tau217 and p‐tau181 would be most strongly associated with tau PET, and that plasma NfL would have highest correlations with cortical thickness and dementia severity. However, the major finding of this study was that regardless of the specific assay, plasma p‐tau217 had the highest classification accuracies and correlations with all key outcomes studied—amyloid PET, tau PET, cortical thickness, and dementia severity. Thus, it is possible that research studies and clinical trials could rely on a single or limited number of BBM tests that reflect multiple aspects of AD.
The models with the highest classification accuracy for amyloid PET status included both a plasma p‐tau217 measure (%p‐tau217 for PrecivityAD2, p‐tau217 for Fujirebio Lumipulse) and Aβ42/Aβ40, although these models were not statistically superior to the p‐tau217 measure alone in either the full cohort or the cognitively impaired sub‐cohort. Both the C2N PrecivityAD2 and Fujirebio Lumipulse p‐tau217 assays had limited sensitivity, resulting in imputed values for samples with very low values (28% of samples for C2N PrecivityAD2 and 3% of samples for Fujirebio Lumipulse). The limited ability of these assays to measure very low values of p‐tau217 did not seem to affect the classification accuracy for AD outcomes such as amyloid PET status, because the thresholds for positivity were much higher than the lower limits of quantitation. Notably, C2N PrecivityAD2%p‐tau217 had the highest continuous correlation with amyloid PET burden despite limited sensitivity. In the cognitively unimpaired cohort, models including C2N PrecivityAD2%p‐tau217 had superior performance in classifying amyloid PET status and C2N PrecivityAD2%p‐tau217 had the highest correlations with amyloid PET burden. Notably, plasma Aβ42/Aβ40 had much lower classification accuracies for amyloid PET status in the full cohort, likely because of the low magnitude of change in Aβ42/Aβ40 levels associated with amyloid pathology (10‐13%) that may be related to non‐brain derived Aβ in the plasma. 44 , 45 However, in the sub‐cohort considered amyloid PET negative (≤20 Centiloids), the low level of amyloid PET signal that was present had the highest correlations with Aβ42/Aβ40, suggesting that Aβ42/Aβ40 is altered very early in the course of amyloid deposition.
In addition to superior classification of amyloid PET status, plasma p‐tau217 assays also had high classification accuracies for early tau PET status, but these accuracies were lower when only amyloid PET positive individuals were considered. Notably, levels of plasma p‐tau217 increase starting very early in the AD disease course in response to amyloid pathology at a time when neurofibrillary tangles are not yet present in high amounts, 46 , 47 indicating that plasma p‐tau217 levels do not only reflect neurofibrillary tangles. High plasma p‐tau217 levels likely mainly reflect significant amyloid burden, which is often associated with tau pathology. 48 Novel fluid biomarkers of AD, such as MTBR‐tau243 11 and N‐terminal containing tau fragments (NTA‐tau), 49 may be less associated with amyloid pathology and more reflective of tau pathology.
While plasma NfL is often used to represent neurodegeneration, measures of p‐tau217 had stronger associations with cortical thickness and cognitive impairment, although even these associations were relatively weak. Novel fluid biomarkers of AD such as MTBR‐tau243 and NTA‐tau may have stronger associations with brain structure and cognition. 11 , 49 However, structural brain changes and cognitive impairment, including in patients with AD pathology, may be complicated by the presence of other conditions such as cerebrovascular disease and non‐AD neurodegenerative diseases. Therefore, plasma biomarkers of non‐AD causes of cognitive impairment, including those that reflect cerebrovascular disease, TDP‐43, and α‐synuclein pathology, 1 could potentially be very helpful in improving prediction of brain structure and cognition.
As AD clinical trials and treatments continue to evolve, it is likely that different treatments will be targeted to individuals based on disease stage. 50 For example, the TRAILBLAZER‐ALZ2 study enrolled participants with amyloid PET Centiloids≥37 and tau PET positivity, and individuals with low/medium tau had a greater slowing of disease progression compared to individuals with high tau. 4 Plasma biomarkers including p‐tau217 will be very helpful in identifying cognitively impaired patients who are likely to benefit from specific treatments, 48 and in the future may also be helpful in identifying cognitively unimpaired individuals who are likely to progress to dementia and are candidates for preventative treatments. 51 , 52 , 53 Further, it may be possible to stage individuals with plasma biomarkers to understand their location on a disease progression model. 46 , 54
Beyond their use in research and clinical trials, AD blood tests are increasingly being used in clinical practice to assist clinicians in determining whether AD pathology is present and may be causing or contributing to a patient's cognitive impairment. 3 , 55 , 56 , 57 AD biomarker testing is now of greater importance in clinical practice to determine if patients may be candidates for new FDA‐approved AD‐specific treatments. 58 The assays examined in this study are either currently available for clinical use (C2N PrecivityAD2, Fujirebio Lumipulse, ALZpath Quanterix, and Janssen LucentAD Quanterix) or are in the process of being developed for clinical use (Roche NeuroToolKit and Quanterix Neurology 4‐Plex). In cognitively impaired individuals, the four p‐tau217 assays had a PPA, NPA, and accuracy for amyloid PET status of approximately 90%, which is similar to the performance of FDA‐approved CSF tests and is the recommended minimum performance of clinical AD blood tests. 7 , 59 Use of a two cutoff approach may enable even higher levels of accuracy. 1 , 14 It will be important for clinicians to use only accurate and well‐validated tests for clinical care, as these test results have major implications for patients and their families, and clinicians should consider the predictive value of the test after integration with all other clinical findings. 7
Limitations of the current study include a relatively small sample size for some sub‐cohorts, which affects the statistical power to discern potential differences between measures. In particular, the CSF sub‐cohort (n = 122) did not provide adequate power to definitively determine whether the blood tests had equivalent performance to CSF tests in classification of amyloid PET status. The combinations of biomarkers tested were pre‐specified and limited to a single company, with the expectation that the company would offer their analytes as a panel and did not evaluate combinations that might be possible across companies such as p‐tau217 combined with NfL or GFAP. Additionally, various methods for deriving cutoffs, such as the two cutoff approach, were not examined. 1 Further, although analyses adjusting for covariates (age, sex, APOE genotype) were provided for review, the focus of this study was on unadjusted models. Previous studies have reported that some medical conditions have major effects on plasma biomarker concentrations, including p‐tau217 and p‐tau181, 60 , 61 while other biomarker measures such as Aβ42/Aβ40 and the %p‐tau217 may be less affected. 61 , 62 Additional studies are needed that carefully examine the effects of age, sex, APOE genotype, medical conditions, medications, race, and social determinants of health on plasma biomarker levels and test performance. Another limitation of the current study is very low racial diversity; only 14 of 392 participants (4%) self‐identified as Black. In recent years, the ADNI has made major efforts to increase the diversity of their cohort, 63 but because this project only included individuals with longitudinal data, it did not benefit from more recent improvements in cohort diversity. Studies are needed to determine whether the performance of plasma biomarkers varies in different racial and ethnic groups.
While this cohort and the FNIH Biomarkers Consortium project was designed to evaluate the longitudinal trajectories of AD blood biomarkers in relation to amyloid PET, the current study was a cross‐sectional head‐to‐head comparison of leading commercially available blood tests. We expect these analyses will be helpful to other investigators and to clinicians as they seek to understand the important but increasingly complex topic of AD blood tests. Given that these plasma biomarker data will be widely available to investigators via ADNI, the current study is intended to provide a starting point for many future studies that will analyze these data in much greater detail. It is our hope that these data will accelerate the development of additional diagnostics and treatments for Alzheimer disease.
CONFLICT OF INTEREST STATEMENT
S.E.S. has served on advisory boards and/or received speaking fees from Eisai, Eli Lilly, and Novo Nordisk. She has analyzed data from C2N Diagnostics that was provided to Washington University at no cost. S.E.S. has not directly received any research or personal compensation from C2N Diagnostics or any other diagnostics companies. K.K.P., B.S., D.T., and E.G.R. have nothing to disclose. L.M.S. receives funding from the NIA for ADNI4 and from NIA for the University of Pennsylvania ADRC P30 for the Biomarker Core. H.Z. has served on scientific advisory boards and/or as a consultant for Abbvie, Acumen, Alector, Alzinova, ALZPath, Amylyx, Annexon, Apellis, Artery Therapeutics, AZTherapies, Cognito Therapeutics, CogRx, Denali, Eisai, LabCorp, Merry Life, Nervgen, Novo Nordisk, Optoceutics, Passage Bio, Pinteon Therapeutics, Prothena, Red Abbey Labs, reMYND, Roche, Samumed, Siemens Healthineers, Triplet Therapeutics, and Wave, has given lectures in symposia sponsored by Alzecure, Biogen, Cellectricon, Fujirebio, Lilly, Novo Nordisk, and Roche, and is a co‐founder of Brain Biomarker Solutions in Gothenburg AB (BBS), which is a part of the GU Ventures Incubator Program (outside submitted work). J.L.D. is an inventor on patents or patent applications of Eli Lilly and Company relating to the assays, methods, reagents, and/or compositions of matter for P‐tau assays and Aβ targeting therapeutics. J.L.D. has served as a consultant or on advisory boards for Eisai, Abbvie, Genotix Biotechnologies Inc, Gates Ventures, Karuna Therapeutics, AlzPath Inc., Cognito Therapeutics, Inc., and received research support from ADx Neurosciences, Fujirebio, AlzPath Inc., Roche Diagnostics and Eli Lilly and Company in the past 2 years. J.L.D. has received speaker fees from Eli Lilly and Company. J.L.D. is a founder and advisor for Monument Biosciences. J.L.D. has stock or stock options in Eli Lilly and Company, Genotix Biotechnologies, AlzPath Inc. and Monument Biosciences. K.F. and C.E.R. are employees of and may own stock in Biogen. G.T.B. and Z.S. are employed by Johnson & Johnson Innovative Medicine and may receive salary and stock for their employment. L.D.C. and Y.M. are employed by AbbVie Deutschland GmbH & Co. Y.L. is the co‐inventor of the technology “Novel Tau isoforms to predict onset of symptoms and dementia in Alzheimer's disease” which is in the process of licensing by C2N. J.C., M.B., and D.L.R. receive salary and company stock as compensation for their employment with Takeda Pharmaceutical Company Limited. N.J.A has received speaking fees from Eli Lilly, Biogen, Quanterix and Alamar Biosciences. E.A.M. is employed by the Alzheimer's Association. A.W.B. receives salary and company stock as compensation for his employment with AbbVie Inc. W.Z.P. was previously employed by the National Institute of Mental Health, and he is a stockholder in Merck & Co., Inc. He is a Co‐Chair Emeritus for the FNIH Biomarkers Consortium Neuroscience Steering Committee. Currently residing in Philadelphia, PA, he serves as a consultant for Karuna, Neurocrine, Neumarker, Vaaji, and receives grant support from the NIA along with stock options from Praxis Bioresearch. Author disclosures are available in the Supporting Information.
CONSENT STATEMENT
Written informed consent was obtained from each ADNI participant or their legally authorized representative.
Supporting information
Supporting Information
Supporting Information
ACKNOWLEDGMENTS
The results of the study represent results of the Foundation for the National Institutes of Health (FNIH) Biomarkers Consortium “Biomarkers Consortium, Plasma Aβ and Phosphorylated Tau as Predictors of Amyloid and Tau Positivity in Alzheimer's Disease” project. The study was made possible through the scientific and financial support of industry, academic, patient advocacy, and governmental partners. The authors are grateful for the contributions of the following project team members: Anthony Bannon (AbbVie), Michael Baratta (Takeda), Janaky Coomaraswamy (Takeda), Jeff Dage (Indiana University), Iwona Dobler (Takeda), Lei Du‐Cuny (AbbVie), Kyle Ferber (Biogen), John Hsiao (NIA), Hartmuth Kolb (formerly with Johnson and Johnson Innovative Medicine), Emily Meyers (Alzheimer's Association), Yulia Mordashova (AbbVie), William Potter, Maria Quinton (AbbVie), Dave Raunig (Takeda), Erin Rosenbaugh (FNIH), Carrie Rubel (Biogen), Ziad Saad (Johnson and Johnson Innovative Medicine), Patricia Saletti (Alzheimer's Drug Discovery Foundation), Suzanne Schindler (Washington University in St. Louis), Leslie Shaw (University of Pennsylvania), Gallen Triana‐Baltzer (Johnson and Johnson Innovative Medicine), Christopher Weber (Alzheimer's Association), Henrik Zetterberg (University of Gothenburg). Funding partners of the project include AbbVie Inc., Alzheimer's Association®, Diagnostics Accelerator at the Alzheimer's Drug Discovery Foundation, Biogen, Janssen Research & Development, LLC, and Takeda Pharmaceutical Company Limited. Private‐sector funding for the study was managed by the Foundation for the National Institutes of Health. The authors recognize C2N Diagnostics, Fujirebio Diagnostics with the Indiana University National Centralized Repository for Alzheimer's Disease and Related Dementias Biomarker Assay Laboratory (NCRAD‐BAL), Quanterix, and Roche Diagnostics with the University of Gothenburg for performing the plasma biomarker analysis in this study. Additionally, the authors are grateful to Drs Nicholas Ashton and Henrik Zetterberg and the University of Gothenburg for generating the plasma endogenous QC pools confirmed high or low for pTau217. The NCRAD‐BAL is supported by a cooperative agreement grant (U24 AG021886) awarded to NCRAD by the National Institute on Aging. Elecsys β‐amyloid (1−42) CSF, Elecsys Phospho‐Tau (181P) CSF, and Elecsys Total‐Tau CSF assays are approved for clinical use. COBAS and ELECSYS are trademarks of Roche. All other product names and trademarks are the property of their respective owners. The NeuroToolKit is a panel of exploratory prototype assays designed to robustly evaluate biomarkers associated with key pathologic events characteristic of AD and other neurological disorders, used for research purposes only and not approved for clinical use (Roche Diagnostics International Ltd, Rotkreuz, Switzerland). Finally, the authors would like to acknowledge ADNI for the plasma samples and ADNI participant data analyzed in this study. Data collection and sharing for the Alzheimer's Disease Neuroimaging Initiative (ADNI) is funded by the National Institute on Aging (National Institutes of Health Grant U19 AG024904). The grantee organization is the Northern California Institute for Research and Education. In the past, ADNI has also received funding from the National Institute of Biomedical Imaging and Bioengineering, the Canadian Institutes of Health Research, and private sector contributions through the Foundation for the National Institutes of Health (FNIH) including generous contributions from the following: AbbVie, Alzheimer's Association; Alzheimer's Drug Discovery Foundation; Araclon Biotech; BioClinica, Inc.; Biogen; Bristol‐Myers Squibb Company; CereSpir, Inc.; Cogstate; Eisai Inc.; Elan Pharmaceuticals, Inc.; Eli Lilly and Company; EuroImmun; F. Hoffmann‐La Roche Ltd and its affiliated company Genentech, Inc.; Fujirebio; GE Healthcare; IXICO Ltd.; Janssen Alzheimer Immunotherapy Research & Development, LLC.; Johnson & Johnson Pharmaceutical Research & Development LLC.; Lumosity; Lundbeck; Merck & Co., Inc.; Meso Scale Diagnostics, LLC.; NeuroRx Research; Neurotrack Technologies; Novartis Pharmaceuticals Corporation; Pfizer Inc.; Piramal Imaging; Servier; Takeda Pharmaceutical Company Limited; and Transition Therapeutics. The Biomarkers Consortium, Plasma Aβ and Phosphorylated Tau as Predictors of Amyloid and Tau Positivity in Alzheimer's Disease Project was made possible through a public‐private partnership managed by the Foundation for the National Institute of Health (FNIH) and funded by AbbVie Inc., Alzheimer's Association®, Diagnostics Accelerator at the Alzheimer's Drug Discovery Foundation, Biogen, Janssen Research & Development, LLC, and Takeda Pharmaceutical Company Limited. Statistical analyses were supported in part by National Institute on Aging grant R01AG070941 (S.E.S.). Individuals representing the funding organizations were included in the study design, analysis and interpretation of data, writing of the manuscript, and decision to submit the manuscript for publication.
ADNI Collaborators
Data used in the preparation of this article were obtained from the ADNI database (adni.loni.usc.edu). As such, the investigators within the ADNI contributed to the design and implementation of ADNI and/or provided data but did not participate in the analysis or writing of this report. A complete listing of ADNI investigators can be found at: http://adni.loni.usc.edu/wp‐content/uploads/how_to_apply/ADNI_Acknowledgement_List.pdf.
Schindler SE, Petersen KK, Saef B, et al. Head‐to‐head comparison of leading blood tests for Alzheimer's disease pathology. Alzheimer's Dement. 2024;20:8074–8096. 10.1002/alz.14315
Alzheimer's Disease Neuroimaging Initiative (ADNI): *Data used in preparation of this article were obtained from the Alzheimer's Disease Neuroimaging Initiative (ADNI) database (adni.loni.usc.edu). As such, the investigators within the ADNI contributed to the design and implementation of ADNI and/or provided data but did not participate in analysis or writing of this report. A complete listing of ADNI investigators can be found at: http://adni.loni.usc.edu/wp‐content/uploads/how_to_apply/ADNI_Acknowledgement_List.pdf
REFERENCES
- 1. Hansson O, Blennow K, Zetterberg H, Dage J. Blood biomarkers for Alzheimer's disease in clinical practice and trials. Nat Aging. 2023;3:506‐519. [DOI] [PMC free article] [PubMed] [Google Scholar]
- 2. Hampel H, Hu Y, Cummings J, et al. Blood‐based biomarkers for Alzheimer's disease: current state and future use in a transformed global healthcare landscape. Neuron. 2023;111(18):2781‐2799. [DOI] [PMC free article] [PubMed] [Google Scholar]
- 3. Hansson O, Edelmayer RM, Boxer AL, et al. The Alzheimer's Association appropriate use recommendations for blood biomarkers in Alzheimer's disease. Alzheimers Dement. 2022;18(12):2669‐2686. [DOI] [PMC free article] [PubMed] [Google Scholar]
- 4. Sims JR, Zimmer JA, Evans CD, et al. Donanemab in early symptomatic Alzheimer disease: the TRAILBLAZER‐ALZ 2 Randomized Clinical Trial. JAMA. 2023;330(6):512‐527. [DOI] [PMC free article] [PubMed] [Google Scholar]
- 5. van Dyck CH, Swanson CJ, Aisen P, et al. Lecanemab in early Alzheimer's disease. N Engl J Med. 2023;388(1):9‐21. doi: 10.1056/NEJMoa2212948 [DOI] [PubMed] [Google Scholar]
- 6. Schindler SE, Atri A. The role of cerebrospinal fluid and other biomarker modalities in the Alzheimer's disease diagnostic revolution. Nat Aging. 2023;3:460‐462. [DOI] [PMC free article] [PubMed] [Google Scholar]
- 7. Schindler SE, Galasko D, Pereira AC, et al. Acceptable performance of blood biomarker tests of amyloid pathology—recommendations from the Global CEO Initiative on Alzheimer's Disease. Nat Rev Neurol. 2024;20:426‐439. [DOI] [PubMed] [Google Scholar]
- 8. Brand AL, Lawler PE, Bollinger JG, et al. The performance of plasma amyloid beta measurements in identifying amyloid plaques in Alzheimer's disease: a literature review. Alzheimers Res Ther. 2022;14:195. [DOI] [PMC free article] [PubMed] [Google Scholar]
- 9. Patterson BW, Elbert DL, Mawuenyega KG, et al. Age and amyloid effects on human central nervous system amyloid‐beta kinetics. Ann Neurol. 2015;78:439‐453. [DOI] [PMC free article] [PubMed] [Google Scholar]
- 10. Barthélemy NR, Saef B, Li Y, et al. CSF tau phosphorylation occupancies at T217 and T205 represent improved biomarkers of amyloid and tau pathology in Alzheimer's disease. Nature Aging. 2023;3(4):391‐401. [DOI] [PMC free article] [PubMed] [Google Scholar]
- 11. Horie K, Salvado G, Barthelemy NR, et al. CSF MTBR‐tau243 is a specific biomarker of tau tangle pathology in Alzheimer's disease. Nat Med. 2023;29:1954‐1963. [DOI] [PMC free article] [PubMed] [Google Scholar]
- 12. Therriault J, Vermeiren M, Servaes S, et al. Association of phosphorylated tau biomarkers with amyloid positron emission tomography vs tau positron emission tomography. JAMA Neurol. 2023;80(2):188‐199. doi: 10.1001/jamaneurol.2022.4485 [DOI] [PMC free article] [PubMed] [Google Scholar]
- 13. Barthelemy NR, Li Y, Joseph‐Mathurin N, et al. A soluble phosphorylated tau signature links tau, amyloid and the evolution of stages of dominantly inherited Alzheimer's disease. Nat Med. 2020;26:398‐407. [DOI] [PMC free article] [PubMed] [Google Scholar]
- 14. Barthelemy NR, Salvado G, Schindler SE, et al. Highly accurate blood test for Alzheimer's disease is similar or superior to clinical cerebrospinal fluid tests. Nat Med. 2024;30(4):1085‐1095. [DOI] [PMC free article] [PubMed] [Google Scholar]
- 15. Pereira JB, Janelidze S, Smith R, et al. Plasma GFAP is an early marker of amyloid‐beta but not tau pathology in Alzheimer's disease. Brain. 2021;144:3505‐3516. [DOI] [PMC free article] [PubMed] [Google Scholar]
- 16. Aschenbrenner AJ, Li Y, Henson RL, et al. Comparison of plasma and CSF biomarkers in predicting cognitive decline. Ann Clin Transl Neurol. 2022;9:1739‐1751. [DOI] [PMC free article] [PubMed] [Google Scholar]
- 17. Janelidze S, Bali D, Ashton NJ, et al. Head‐to‐head comparison of 10 plasma phospho‐tau assays in prodromal Alzheimer's disease. Brain. 2023;146(4):1592‐1601. doi: 10.1093/brain/awac333 [DOI] [PMC free article] [PubMed] [Google Scholar]
- 18. Janelidze S, Teunissen CE, Zetterberg H, et al. Head‐to‐Head Comparison of 8 Plasma Amyloid‐β 42/40 Assays in Alzheimer Disease. JAMA Neurol. 2021;78(11):1375‐1382. doi: 10.1001/jamaneurol.2021.3180 [DOI] [PMC free article] [PubMed] [Google Scholar]; Erratum in: JAMA Neurol. 2023;80(4):422. doi: 10.1001/jamaneurol.2022.5184 [DOI] [Google Scholar]
- 19. Janelidze S, Teunissen CE, Zetterberg H, et al. Head‐to‐head comparison of 8 plasma amyloid‐beta 42/40 assays in Alzheimer disease. JAMA Neurol. 2021;78(11):1375‐1382. [DOI] [PMC free article] [PubMed] [Google Scholar]
- 20. Ashton NJ, Puig‐Pijoan A, Mila‐Aloma M, et al. Plasma and CSF biomarkers in a memory clinic: head‐to‐head comparison of phosphorylated tau immunoassays. Alzheimers Dement. 2023;19:1913‐1924. [DOI] [PMC free article] [PubMed] [Google Scholar]
- 21. Morris JC. The Clinical Dementia Rating (CDR): current version and scoring rules. Neurology. 1993;43:2412‐2414. [DOI] [PubMed] [Google Scholar]
- 22. Dore V, Doecke JD, Saad ZS, et al. Plasma p217+tau versus NAV4694 amyloid and MK6240 tau PET across the Alzheimer's continuum. Alzheimers Dement. 2022;14:e12307. [DOI] [PMC free article] [PubMed] [Google Scholar]
- 23. Therriault J, Servaes S, Tissot C, et al. Equivalence of plasma p‐tau217 with cerebrospinal fluid in the diagnosis of Alzheimer's disease. Alzheimers Dement. 2023;19:4967‐4977. [DOI] [PMC free article] [PubMed] [Google Scholar]
- 24. Triana‐Baltzer G, Moughadam S, Slemmon R, et al. Development and validation of a high‐sensitivity assay for measuring p217+tau in plasma. Alzheimers Dement. 2021;13:e12204. [DOI] [PMC free article] [PubMed] [Google Scholar]
- 25. Meyer MR, Kirmess KM, Eastwood S, et al. Clinical validation of the PrecivityAD2 blood test: a mass spectrometry‐based test with algorithm combining %p‐tau217 and Abeta42/40 ratio to identify presence of brain amyloid. Alzheimers Dement. 2024;20(5):3179‐3192. [DOI] [PMC free article] [PubMed] [Google Scholar]
- 26. Ashton NJ, Brum WS, Di Molfetta G, et al. Diagnostic accuracy of a plasma phosphorylated tau 217 immunoassay for Alzheimer disease pathology. JAMA Neurol. 2024;81:255‐263. [DOI] [PMC free article] [PubMed] [Google Scholar]
- 27. Therriault J, Ashton NJ, Pola I, et al. Comparison of two plasma p‐tau217 assays to detect and monitor Alzheimer's pathology. EBioMedicine. 2024;102:105046. [DOI] [PMC free article] [PubMed] [Google Scholar]
- 28. Benedet AL, Mila‐Aloma M, Vrillon A, et al. Differences between plasma and cerebrospinal fluid glial fibrillary acidic protein levels across the Alzheimer disease continuum. JAMA Neurol. 2021;78:1471‐1483. [DOI] [PMC free article] [PubMed] [Google Scholar]
- 29. Mattsson N, Cullen NC, Andreasson U, Zetterberg H, Blennow K. Association between longitudinal plasma neurofilament light and neurodegeneration in patients with Alzheimer disease. JAMA Neurol. 2019;76:791‐799. [DOI] [PMC free article] [PubMed] [Google Scholar]
- 30. Kirmess KM, Meyer MR, Holubasch MS, et al. The PrecivityAD test: accurate and reliable LC‐MS/MS assays for quantifying plasma amyloid beta 40 and 42 and apolipoprotein E proteotype for the assessment of brain amyloidosis. Clin Chim Acta. 2021;519:267‐275. [DOI] [PMC free article] [PubMed] [Google Scholar]
- 31. Jagust WJ, Landau SM, Koeppe RA, et al. The Alzheimer's Disease Neuroimaging Initiative 2 PET Core: 2015. Alzheimers Dement. 2015;11:757‐771. [DOI] [PMC free article] [PubMed] [Google Scholar]
- 32. Joshi AD, Pontecorvo MJ, Clark CM, et al. Performance characteristics of amyloid PET with florbetapir F 18 in patients with alzheimer's disease and cognitively normal subjects. J Nucl Med. 2012;53:378‐384. [DOI] [PubMed] [Google Scholar]
- 33. Royse SK, Minhas DS, Lopresti BJ, et al. Validation of amyloid PET positivity thresholds in centiloids: a multisite PET study approach. Alzheimers Res Ther. 2021;13:99. [DOI] [PMC free article] [PubMed] [Google Scholar]
- 34. Villemagne VL, Leuzy A, Bohorquez SS, et al. CenTauR: toward a universal scale and masks for standardizing tau imaging studies. Alzheimers Dementia. 2023;15:e12454. [DOI] [PMC free article] [PubMed] [Google Scholar]
- 35. Diedrichsen J. A spatially unbiased atlas template of the human cerebellum. Neuroimage. 2006;33:127‐138. [DOI] [PubMed] [Google Scholar]
- 36. Jack CR Jr, Wiste HJ, Weigand SD, et al. Defining imaging biomarker cut points for brain aging and Alzheimer's disease. Alzheimer's & dementia : the journal of the Alzheimer's. Association. 2017;13:205‐216. [DOI] [PMC free article] [PubMed] [Google Scholar]
- 37. Pomponio R, Erus G, Habes M, et al. Harmonization of large MRI datasets for the analysis of brain imaging patterns throughout the lifespan. Neuroimage. 2020;208:116450. [DOI] [PMC free article] [PubMed] [Google Scholar]
- 38. Schindler SE, Petersen KK, Saef B. Code for head‐to‐head study. 2024.
- 39. Schindler SE, Petersen KK, Saef B, et al. Head‐to‐head comparison of leading blood tests for Alzheimer's disease pathology. medRxiv [Preprint]. 2024:2024.06.12.24308839. doi: 10.1101/2024.06.12.24308839 [DOI] [PMC free article] [PubMed] [Google Scholar]
- 40. Redelmeier DA, Bloch DA, Hickam DH. Assessing predictive accuracy: how to compare Brier scores. J Clin Epidemiol. 1991;44:1141‐1146. [DOI] [PubMed] [Google Scholar]
- 41. DeLong ER, DeLong DM, Clarke‐Pearson DL. Comparing the areas under two or more correlated receiver operating characteristic curves: a nonparametric approach. Biometrics. 1988;44:837‐845. [PubMed] [Google Scholar]
- 42. Benjamini Y, Hochberg Y. Controlling the false discovery rate—a practical and powerful approach to multiple testing. J R Stat Soc B. 1995;57:289‐300. [Google Scholar]
- 43. Jack CR Jr, Bennett DA, Blennow K, et al. NIA‐AA Research Framework: toward a biological definition of Alzheimer's disease. Alzheimers Dement. 2018;14:535‐562. [DOI] [PMC free article] [PubMed] [Google Scholar]
- 44. Wisch JK, Gordon BA, Boerwinkle AH, et al. Predicting continuous amyloid PET values with CSF and plasma Abeta42/Abeta40. Alzheimers Dementia. 2023;15:e12405. [DOI] [PMC free article] [PubMed] [Google Scholar]
- 45. Schindler SE, Bollinger JG, Ovod V, et al. High‐precision plasma beta‐amyloid 42/40 predicts current and future brain amyloidosis. Neurology. 2019;93:e1647‐e1659. [DOI] [PMC free article] [PubMed] [Google Scholar]
- 46. Li Y, Yen D, Hendrix RD, et al. Timing of biomarker changes in sporadic Alzheimer's disease in estimated years from symptom onset. Ann Neurol. 2024;95(5):951‐965. [DOI] [PMC free article] [PubMed] [Google Scholar]
- 47. Palmqvist S, Janelidze S, Quiroz YT, et al. Discriminative accuracy of plasma phospho‐tau217 for Alzheimer disease vs other neurodegenerative disorders. JAMA. 2020;324:772‐781. [DOI] [PMC free article] [PubMed] [Google Scholar]
- 48. Mattsson‐Carlgren N, Collij LE, Stomrud E, et al. Plasma biomarker strategy for selecting patients with Alzheimer disease for antiamyloid immunotherapies. JAMA Neurol. 2024;81:69‐78. [DOI] [PMC free article] [PubMed] [Google Scholar]
- 49. Lantero‐Rodriguez J, Salvado G, Snellman A, et al. Plasma N‐terminal containing tau fragments (NTA‐tau): a biomarker of tau deposition in Alzheimer's Disease. Mol Neurodegener. 2024;19:19. [DOI] [PMC free article] [PubMed] [Google Scholar]
- 50. Therriault J, Schindler SE, Salvado G, et al. Biomarker‐based staging of Alzheimer disease: rationale and clinical applications. Nat Rev Neurol. 2024;20(4):232‐244. [DOI] [PubMed] [Google Scholar]
- 51. Mattsson‐Carlgren N, Salvado G, Ashton NJ, et al. Prediction of longitudinal cognitive decline in preclinical Alzheimer disease using plasma biomarkers. JAMA Neurol. 2023;80:360‐369. [DOI] [PMC free article] [PubMed] [Google Scholar]
- 52. Rissman RA, Langford O, Raman R, et al. Plasma Abeta42/Abeta40 and phospho‐tau217 concentration ratios increase the accuracy of amyloid PET classification in preclinical Alzheimer's disease. Alzheimers Dement. 2023;20(2):1214‐1224. [DOI] [PMC free article] [PubMed] [Google Scholar]
- 53. Janelidze S, Barthelemy NR, Salvado G, et al. Plasma phosphorylated tau 217 and abeta42/40 to predict early brain abeta accumulation in people without cognitive impairment. JAMA Neurol. 2024;81(9):947‐957. [DOI] [PMC free article] [PubMed] [Google Scholar]
- 54. Salvado G, Horie K, Barthelemy NR, et al. Disease staging of Alzheimer's disease using a CSF‐based biomarker model. Nat Aging. 2024;4(5):694‐708. [DOI] [PMC free article] [PubMed] [Google Scholar]
- 55. Johnson KA, Minoshima S, Bohnen NI, et al. Appropriate use criteria for amyloid PET: a report of the amyloid imaging task force, the society of nuclear medicine and molecular imaging, and the Alzheimer's association. Alzheimers Dement. 2013;9:e‐1‐16. [DOI] [PMC free article] [PubMed] [Google Scholar]
- 56. Shaw LM, Arias J, Blennow K, et al. Appropriate use criteria for lumbar puncture and cerebrospinal fluid testing in the diagnosis of Alzheimer's disease. Alzheimers Dement. 2018;14:1505‐1521. [DOI] [PMC free article] [PubMed] [Google Scholar]
- 57. Palmqvist S, Tideman P, Mattsson‐Carlgren N, et al. Blood biomarkers to detect alzheimer disease in primary care and secondary care. JAMA. 2024:e2413855. Epub ahead of print. doi: 10.1001/jama.2024.13855 [DOI] [PMC free article] [PubMed] [Google Scholar]
- 58. Cummings J, Apostolova L, Rabinovici GD, et al. Lecanemab: appropriate use recommendations. J Prev Alzheimers Dis. 2023;10:362‐377. [DOI] [PMC free article] [PubMed] [Google Scholar]
- 59. Jack CR Jr, Andrews JS, Beach TG, et al. Revised criteria for diagnosis and staging of Alzheimer's disease: alzheimer's Association Workgroup. Alzheimers Dement. 2024;20(8):5143‐5169. [DOI] [PMC free article] [PubMed] [Google Scholar]
- 60. Mielke MM, Dage JL, Frank RD, et al. Performance of plasma phosphorylated tau 181 and 217 in the community. Nat Med. 2022;28(7):1398‐1405. [DOI] [PMC free article] [PubMed] [Google Scholar]
- 61. Syrjanen JA, Campbell MR, Algeciras‐Schimnich A, et al. Associations of amyloid and neurodegeneration plasma biomarkers with comorbidities. Alzheimers Dement. 2022;18(6):1128‐1140. doi: 10.1002/alz.12466 [DOI] [PMC free article] [PubMed] [Google Scholar]
- 62. Janelidze S, Barthelemy NR, He Y, Bateman RJ, Hansson O. Mitigating the associations of kidney dysfunction with blood biomarkers of Alzheimer disease by using phosphorylated tau to total tau ratios. JAMA Neurol. 2023;80:516‐522. [DOI] [PMC free article] [PubMed] [Google Scholar]
- 63. Weiner MW, Veitch DP, Miller MJ, et al. Increasing participant diversity in AD research: plans for digital screening, blood testing, and a community‐engaged approach in the Alzheimer's Disease Neuroimaging Initiative 4. Alzheimers Dement. 2023;19:307‐317. [DOI] [PMC free article] [PubMed] [Google Scholar]
Associated Data
This section collects any data citations, data availability statements, or supplementary materials included in this article.
Supplementary Materials
Supporting Information
Supporting Information