Abstract
Limited availability of cytokines to sustain the antitumor activity of CAR T cells against solid tumors has emerged as a major roadblock. While numerous genetic engineering approaches are being explored to activate JAK/STAT cytokine signaling pathways in CAR T cells, no modular system exists. To overcome this limitation, we designed a leucine zipper-based chimeric cytokine receptor (ZipR) platform. For optimal ZipR signaling, two leucine zipper motifs were critical, and we successfully generated ZipRs based on common γ-chain (IL-2, IL-7, IL-21), IL-10 family (IL-10, IL-22), and IL-12 family (IL-12) cytokine receptors. ZipRs enabled T cells to survive cytokine starvation without inducing autonomous cell growth and augmented the effector function of CAR T cells in vitro in the setting of chronic antigen exposure as well as in preclinical solid tumor xenograft models. Thus, ZipRs present a modular receptor platform to provide tailored, intrinsic cytokine signaling for adoptively transferred immune cells.
Adoptive immunotherapy with CAR T cells has been transformative for the treatment of hematological malignancies, where they undergo significant expansion to kill chemotherapy resistant tumor cells and can persist for years after infusion1,2. In contrast, CAR T cell therapy for the treatment of solid tumors has been less successful3,4. Recent clinical trials have demonstrated improved outcomes, including complete responses, in solid tumor patients5–8, but responses remain limited to a subset of patients. Lack of efficacy is most likely multifactorial and includes a limited ability of CAR T cells to expand and persist post infusion. Several approaches are actively being explored to overcome this limitation, including the transgenic expression of cytokines. For example, investigators have demonstrated that transgenic expression of IL-7, IL-12, IL-15, IL-18, IL-21, or IL-23 improves the antitumor activity of CAR T cells,9–15 and early phase clinical studies with IL-15 or IL-12 expressing CAR T cells are in progress16,17.
While effective, transgenic expression of cytokines can be associated with systemic toxicities18, and the genetically modified T cells might not express the cognate cytokine receptors as they undergo activation and differentiation. To overcome these limitations, we and others have taken advantage of naturally occurring constitutively active cytokine receptors or have engineered chimeric cytokine receptors to directly activate cytokine receptor signaling pathways in a cell-intrinsic manner19–22.
Preclinical and clinical T cell therapy studies have highlighted the requirement for cytokine signaling in effective antitumor responses23,24. However, at present no modular system exists to generate constitutively active cytokine receptors. Current approaches to activate cytokine signaling in engineered cell therapies are limited by expression or downregulation of the cognate receptor25, toxicity from activation of bystander cells18, and suboptimal biodistribution26. We and others posit that a synthetic biology approach to activate diverse cytokine signaling pathways in a cell-intrinsic manner has the potential to overcome these limitations. We replaced the extracellular domains of heterodimeric cytokine receptors with leucine zippers and demonstrate that two leucine zipper motifs are critical for optimal JAK/STAT activation. ZipRs based on IL-2, IL-7, IL-21, or IL-12 receptors augment CAR T cell antitumor activity against solid tumors in vitro and in vivo. Thus, ZipRs represent a modular chimeric cytokine receptor platform that can activate a broad range of cytokine signaling pathways in a cell-intrinsic manner to improve adoptive cell therapies.
Results
Design and functional characterization of common γ chain cytokine receptor-based leucine zipper receptors
To explore the feasibility of activating the STAT5 signaling pathway without exogenous cytokines, we generated ZipRs in which the extracellular domains of the IL-2Rγ and IL-2Rβ chains were replaced with one [Zip2R(1x)] or two [Zip2R(2x)] leucine zipper motifs (Fig. 1a,b, Supplementary Data Fig. 1a). Zip2R(1x) or Zip2R(2x) expressing primary human T cells were generated by retroviral transduction, and Zip2R(2x) induced significantly higher STAT5 phosphorylation in comparison to Zip2R(1x) (Fig. 1c). Zip2R(2x)-induced pSTAT5 expression was consistent when both chains were expressed in a single construct or separately (Supplementary Data Fig. 1b). This resulted in increased viability of Zip2R(2x) T cells in comparison to Zip2R(1x) or non-transduced (NT) T cells after 7 days of cytokine starvation (Fig. 1d). Confocal microscopy revealed that Zip2R(2x) formed larger clusters than Zip2R(1x) (Fig. 1e, Extended Data Fig. 1a,b). Likewise, AlphaFold27 structural modeling of Zip2R(1x) and Zip2R(2x) revealed that only Zip2R(2x) was able to form multimeric complexes through parallel and antiparallel interaction of leucine zippers (Fig. 1f), providing a potential explanation for the observed functional differences between Zip2R(1x) and Zip2R(2x). To provide additional insight into the subcellular location of ZipRs, we performed confocal microscopy in which the SNAP/CLIP tag system was used to label individual chains of Zip2R(1x) or Zip2R(2x) (Extended Data Fig. 2a). Staining of intracellular compartments demonstrated that for Zip2R(2x), the receptor was present at the cell surface, and in the membrane of Lamp1+ lysosomes, and Rab11+ recycling endosomes, but not Rab5+ endosomes (Extended Data Fig. 2b–f). Zip2R(1x) also colocalized at the cell surface and in the membrane of Lamp1+ lysosomes, but not Rab11+ or Rab5+ endosomes (Supplementary Data Fig. 2a–e). Comparison of Zip2R(1x) and Zip2R(2x) demonstrated that Zip2R(2x) is more likely to be found at the cell surface or the membrane of Lamp1+ lysosomes (Extended Data Fig. 2g), suggesting that Zip2R(2x) accumulates at the cell surface and is destined for degradation or recycling following productive signaling.
Figure 1: Two leucine zipper motifs endow ZipRs with constitutive signal transduction.
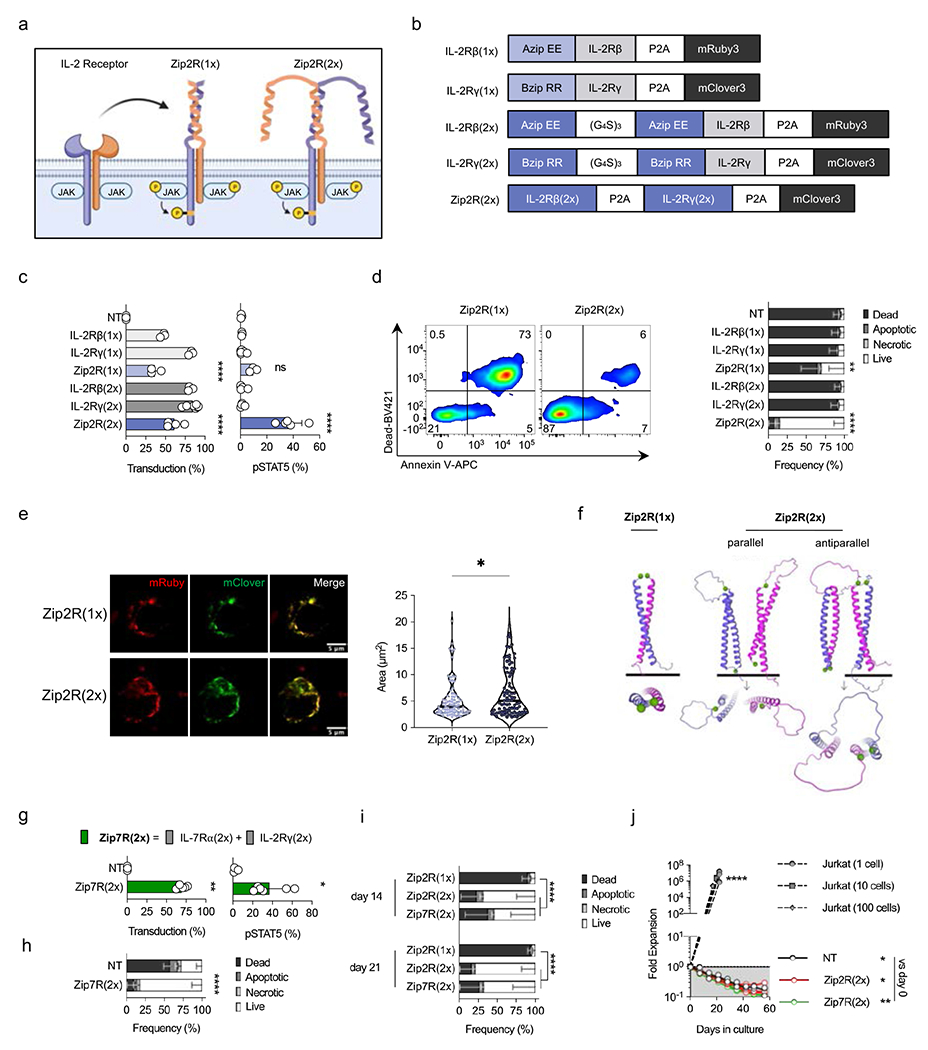
(a) Schematic of IL-2 receptor-based leucine zipper receptors (Zip2R). (b) Zip2R(1x) and Zip2R(2x) constructs. (c) Transduction efficiency of human T cells as measured by mRuby [IL-2Rβ(1x), IL-2Rβ(2x)], mClover [IL-2Rγ(1x), IL-2Rγ(2x), Zip2R(2x)], or mRuby and mClover [Zip2R(1x)] expression (left). Phosphorylated STAT5 expression in transduced human T cells (right) (N=3-6 biological replicates, mean±SD, ****p<0.0001, one-way ANOVA with Tukey’s multiple comparisons test). (d) Viability of transduced T cells after 7-day cytokine starvation as determined by flow cytometry (Dead : Viability dye+ Annexin V+; Apoptotic : Viability dye− Annexin V+; Necrotic : Viability dye+ Annexin V−; Live: Viability dye− Annexin V−) (N=3 biological replicates, mean±SD, **p<0.01, ****p<0.0001, two-way ANOVA with Tukey’s multiple comparisons test for live T cells). (e) Representative confocal microscopy images of transfected HEK293T cells (left). Colocalization area of mRuby and mClover (right) (N=80(L), N=89(R), *p<0.05, Kolmogorov-Smirnov test). (f) AlphaFold structure prediction of Zip2R(1x) and Zip2R(2x) as seen from the front and rotated 90 degrees. The starting residue, methionine, is shown as a green sphere. (g) Transduction efficiency of human T cells as measured by mClover expression (left). Phosphorylated STAT5 expression in transduced human T cells (right) (N=3-6 biological replicates, mean±SD, *p<0.05, t-test). (h) Viability of transduced T cells after 7-day cytokine starvation as determined by flow cytometry (Viability dye/Annexin V) (N=3 biological replicates, mean±SD, ****p<0.0001, two-way ANOVA with Bonferroni’s multiple comparisons test for live T cells). (i) Viability of transduced T cells after 14- or 21-day cytokine starvation as determined by flow cytometry (Viability dye/Annexin V) (N=3 biological replicates, mean±SD, ****p<0.0001, two-way ANOVA with Tukey’s multiple comparisons test for live T cells). (j) Autonomous cell outgrowth assay: 1, 10, or 100 Jurkat cells or 1.5×10⁷ Zip2R(2x) or Zip7R(2x) transduced T cells were seeded in a G-REX cell culture plate and quantified weekly (N=3, *p<0.05, **p<0.01, two-way ANOVA of log transformed data with Dunnett’s multiple comparisons test). NT = non-transduced.
Based on the functional advantage of ZipRs with 2 leucine zipper motifs we focused on this design going forward. As an alternative approach to activate STAT5 in T cells, we generated an IL-7-based ZipR [(Zip7R(2x)] for comparison. Zip7R(2x) also induced significant STAT5 phosphorylation (Fig. 1g), and enabled T cells to survive in the absence of cytokines for 7 days (Fig. 1h). Direct comparison of Zip2R(2x) and Zip7R(2x) revealed no difference in their ability to sustain T cell viability under conditions of prolonged cytokine starvation (Fig. 1i).
The increase in viability was mediated by JAK signaling since treatment with ruxolitinib, a JAK1/2 inhibitor, prevented Zip2R(2x)- and Zip7R(2x)-induced pSTAT5 expression and survival during cytokine starvation. (Extended Data Fig. 3a–e). STAT5 phosphorylation was observed in cells expressing high levels of Zip2R(2x) or Zip7R(2x) (Supplementary Data Fig. 3a), which could further be increased by the addition of exogenous IL-2- or IL-15 (Supplementary Data Fig. 3b,c). Finally, Zip2R(2x) or Zip7R(2x) did not induce significant proliferation of T cells in vitro (Supplementary Data Fig. 3d,e) or autonomous T cell growth within 60 days of culture (Fig. 1j).
Zip2R and Zip7R activate distinct signaling pathways as judged by multiplexed phosphoproteomics
Having observed no significant functional differences between Zip2R(2x) and Zip7R(2x) (hereafter denoted as Zip2R and Zip7R), we performed an unbiased phosphoproteomic analysis of T cells expressing Zip2R or Zip7R, and NT T cells ± IL-15. IL-15 was chosen for comparison since it binds to the IL-2 receptor and T cells are unresponsive to IL-7 following ex vivo culture25. Samples were subjected to multiplexed tandem mass tag (TMT) and two-dimensional liquid chromatograph-tandem mass spectrometry (LC/LC-MS/MS) phosphoproteomics. In total, we identified 31,381 unique phosphopeptides (<1% false discovery rate), which correspond to 23,934 unique phosphosites (pS: 18,765, pT: 4,329, pY:840), representing 4,554 unique phosphoproteins. After additional filtering to remove very low abundance proteins and confirmation of concordance between biological replicates,4,452 phosphoproteins were used for analysis (Fig. 2a, Supplementary Data Fig. 4a,b). Hierarchical clustering and principal component analysis (PCA) of the top 700 differentially phosphorylated proteins revealed clustering of samples based on stimulation with IL-15 or expression of Zip2R or Zip7R (Fig. 2b, Supplementary Data Fig. 4c,d). Inference of kinase activities from phosphoproteomics (IKAP)28 identified differences in activation of signaling pathways mediated by IL-15 stimulation compared to Zip2R or Zip7R signaling (Fig. 2c). Specifically,Zip2R and Zip7R induced higher phosphorylation of target proteins of cyclin dependent kinases (CDKs), mitogen activated protein kinases (MAPKs), mammalian target of rapamycin (mTOR), p21-activated kinase 1 (PAK1), proviral integration site for Moloney murine leukemia virus kinase (PIM1), and protein kinase C alpha (PRKCA), demonstrating activation of pathways associated with cell cycle, metabolism, proliferation, survival, and adhesion.
Figure 2: Zip2R and Zip7R activate distinct signaling pathways as judged by multiplexed phosphoproteomics.
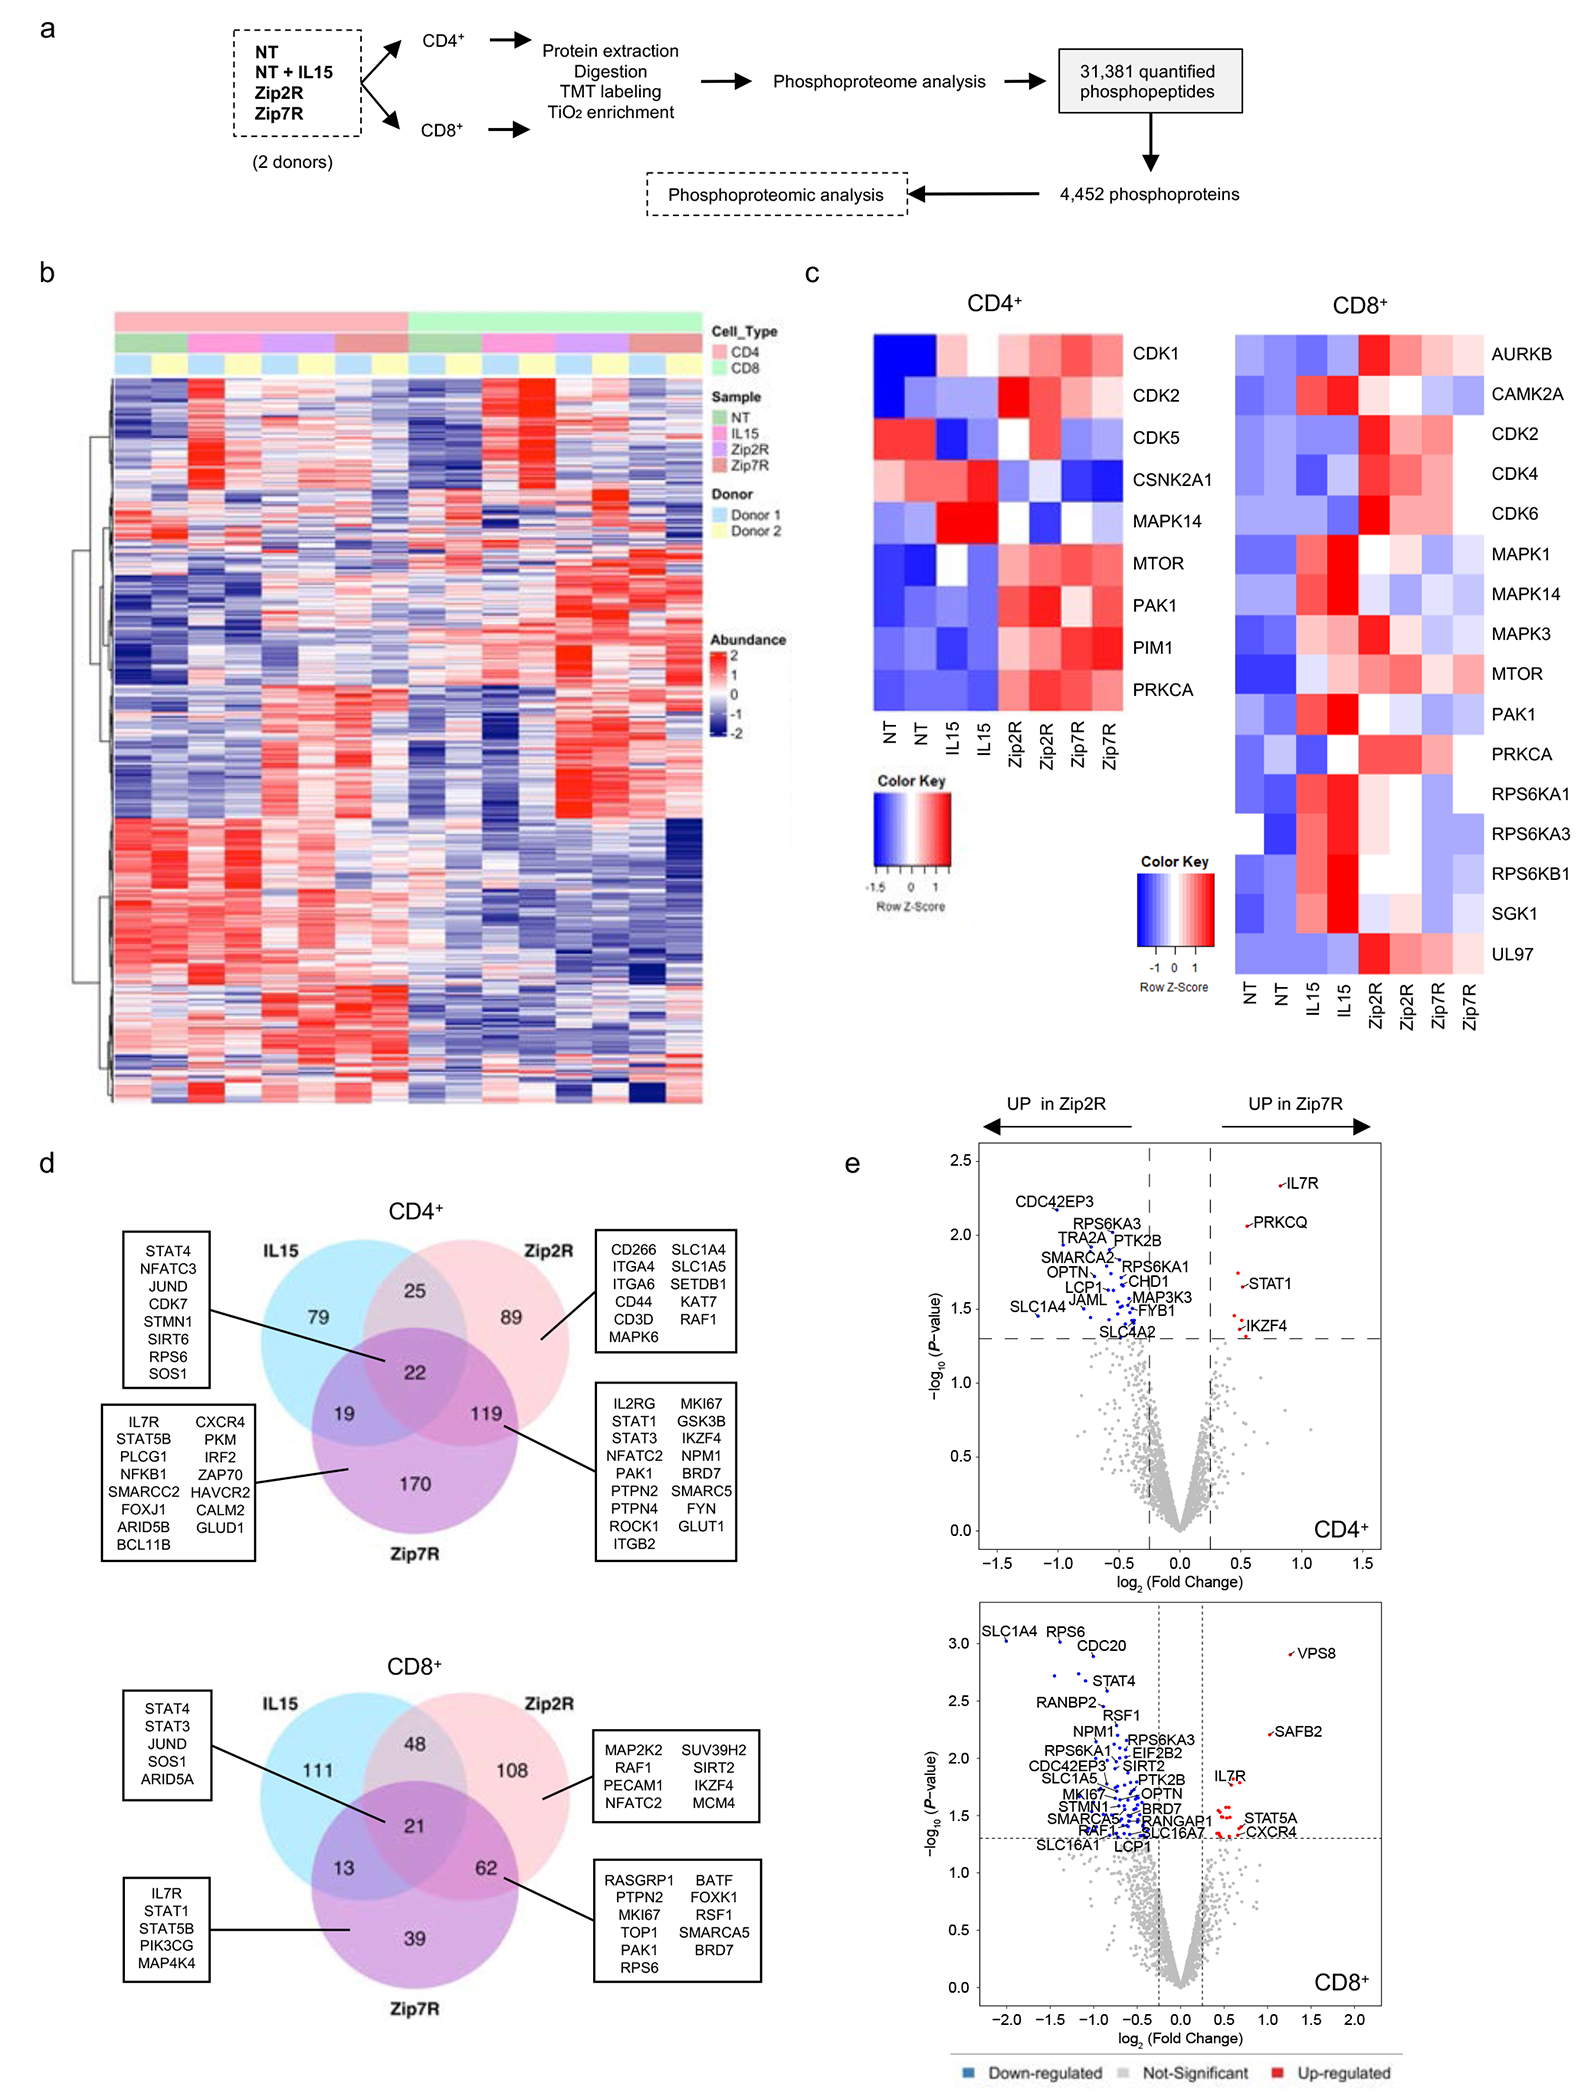
(a) Samples and experimental workflow of phosphoproteomic analysis. (b) Hierarchical clustering of top 700 differentially expressed proteins (p<0.05). (c) IKAP prediction of kinase activity in CD4+ (left) and CD8+ (right) cells. (d) Top upregulated proteins compared to NT cells in CD4+ (top) and CD8+ (bottom) cells. (e) Differentially expressed proteins in Zip7R versus Zip2R transduced CD4+ (top) and CD8+ (bottom) cells
We next focused on comparing specific phosphoproteins induced in NT+IL-15, Zip2R, and Zip7R cells, compared to NT T cells. Proteins phosphorylated by Zip2R or Zip7R signaling were not only involved in cytokine signaling (STAT, IL7R, IL2RG, MAPK) but also in diverse cellular functions including cell cycle (MKI67, CDK7, TOP1), chromatin and transcriptional regulation (NFAT, JUND, SIRT6, SETDB1, BRD7, BATF), cytoskeleton and cell adhesion (Integrins, CD44, STMN1, PECAM1), translational machinery/RNA processing and splicing (RPS6, NPM1) and metabolism (SLC1A4, SLC1A5, GLUD1, GLUT1) in CD8+ and CD4+ T cells (Fig. 2d). Further analysis of proteins differentially phosphorylated in Zip2R or Zip7R expressing T cells revealed distinct signaling cascades induced in CD4+ and CD8+ T cells, with more proteins phosphorylated by Zip2R in both T cell subsets (Fig. 2e). Based on these distinct phosphorylation patterns, we decided to explore if either molecule would augment the effector function of CAR T cells.
Zip2R and Zip7R improve CAR T cell effector function during chronic antigen exposure in vitro
In order to determine if Zip2R or Zip7R enhance the effector function of CAR T cells, we focused on T cells expressing a functional B7-H3-CAR or a nonsignaling B7-H3-CAR (ΔCARs), which binds B7-H3 and contains an intracellular domain without a signaling moiety29. We utilized B7-H3-positive A549 and LM7 cells (A549 WT, LM7 WT), and A549 and LM7 cells in which B7-H3 was knocked out (A549 B7-H3 KO, LM7 B7-H3 KO) as antigen-negative targets. B7-H3-CAR or ΔCAR T cells expressing Zip2R or Zip7R were generated by viral transduction (Fig. 3a,b). Zip2R or Zip7R expression did not significantly change the CD4:CD8 ratio, T cell subset composition (Supplementary Data Fig. 5a–d), or antigen-specific cytolytic activity (Fig. 3c,d, Extended Data Fig. 4a,b). Likewise, Zip2R or Zip7R did not change the cytokine expression profile of B7-H3-CAR T cells after a single exposure to A549 WT or LM7 WT cells (Fig. 3e, Extended Data Fig. 4c,d). To exclude the possibility that ZipRs could alter the antigen-specific activation threshold of CAR T cells, we stimulated CAR, CAR.Zip2R, or CAR.Zip7R T cells with increasing concentrations of plate-bound recombinant human B7-H3 and did not observe any differences in degranulation or IFNγ production (Supplementary Data Fig. 6a,b). For Zip2R we additionally confirmed antigen-specificity by measuring cytokine production in the presence of A549 B7-H3 KO and LM7 B7-H3 KO cells, and by expressing Zip2R in ΔCAR T cells (Fig. 3e, Extended Data Fig. 4c).
Figure 3: ZipRs improve CAR T cell effector function during chronic antigen exposure in vitro.
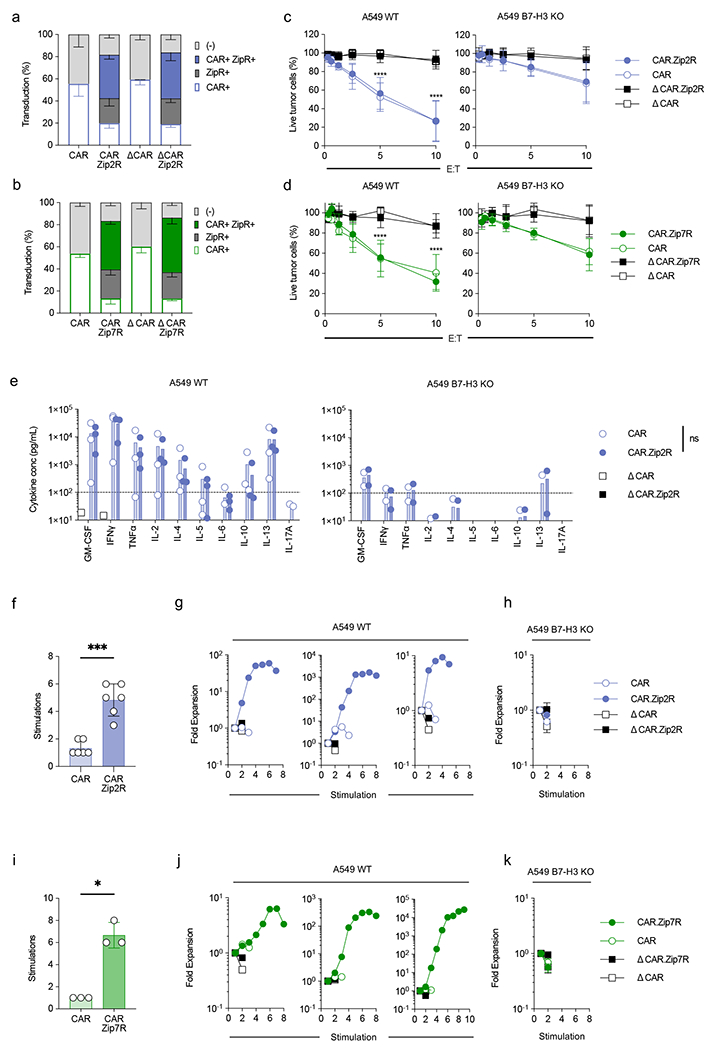
(a-b) Transduction efficiency of B7-H3-CAR and Zip2R (a) or Zip7R (b) in human T cells as measured by flow analysis for the ZipR (mClover) and CAR (anti-human F(ab’)2) (N=3-6, mean±SD). (c-d) MTS assay after 24-hour co-culture of A549 WT (left) or A549 B7-H3 KO (right) cells with CAR T cells at indicated effector:target cell (E:T) ratios (N=3-4 biological replicates, mean±SD, ****p<0.0001, two-way ANOVA with Tukey’s multiple comparisons test). (e) Cytokine production after 24-hour co-culture of A549 WT (left) or A549 B7-H3 KO (right) cells with CAR or CAR.Zip2R T cells at a 2:1 E:T measured by multiplex analysis (N=2-3 biological replicates, mean±SD). (f) Stimulations of tumor cell killing in 7-day repeat simulation assay with A549 WT cells and CAR T cells at 2:1 E:T ratio (N=6 biological replicates, mean±SD, ***p<0.001, paired t-test). (g) Three representative donors used for repeat simulation assay with A549 WT cells represented in (f). (h) Repeat stimulation assay with A549 B7-H3 KO cells and CAR T cells at 2:1 E:T (N=4, mean±SD). (i) Stimulations of tumor cell killing in 7 day repeat stimulation assay with A549 WT cells and CAR T cells at 2:1 E:T (N=3 biological replicates, mean±SD, *p<0.05, paired t-test). (j) Three representative donors used for repeat stimulation assay with A549 WT cells represented in (i). (k) Repeat stimulation assay with A549 B7-H3 KO cells and CAR T cells at 2:1 E:T (N=3, mean±SD).
We next performed repeat stimulation assays in which CAR T cells were counted and stimulated with tumor cells every 7 days to evaluate their functionality during chronic antigen exposure. Zip2R or Zip7R increased the ability of B7-H3-CAR T cells to expand and kill tumor cells after repeated stimulation with A549 WT and LM7 WT cells. In contrast, no benefit was observed after stimulation with A549 B7-H3 KO or LM7 B7-H3 KO cells or when ZipRs were expressed in ΔCAR T cells (Fig. 3f–k, Extended Data Fig. 4e–j), confirming antigen specificity. Furthermore, CAR.Zip2R T cells maintained the ability to secrete cytokines for at least 3 stimulations (Supplementary Data Fig. 7). In contrast to B7-H3-CAR T cells, the percentage of transduced CAR.Zip2R or CAR.Zip7R T cells enriched after the 2nd stimulation, and Zip2R or Zip7R also maintained CD4+ T cells (Extended Data Fig. 5a,b). To confirm the benefit of Zip2R or Zip7R signaling for another CAR, we generated functional (CAR) or nonsignaling (ΔCAR) EphA2-specific CAR T cells that expressed Zip2R or Zip7R (Extended Data Fig. 6a). Expression of Zip2R or Zip7R did not alter the CD4:CD8 ratio, the immunophenotype or the specificity of EphA2-CAR or ΔCAR T cells and improved the ability to EphA2-CAR T cells to expand in repeat stimulation assays (Extended Data Fig. 6b–e). Since EphA2- and B7-H3-CARs both contained CD28z signaling domains we compared the ability of Zip2Rs to improve the effector function of T cells expressing GPC2-CARs with a CD28z or 41BBz signaling domain and found no significant differences (Supplementary Data Fig. 8a–d).
Figure 5: Leucine zipper ectodomains enable the generation of ZipRs from diverse cytokine receptor families.
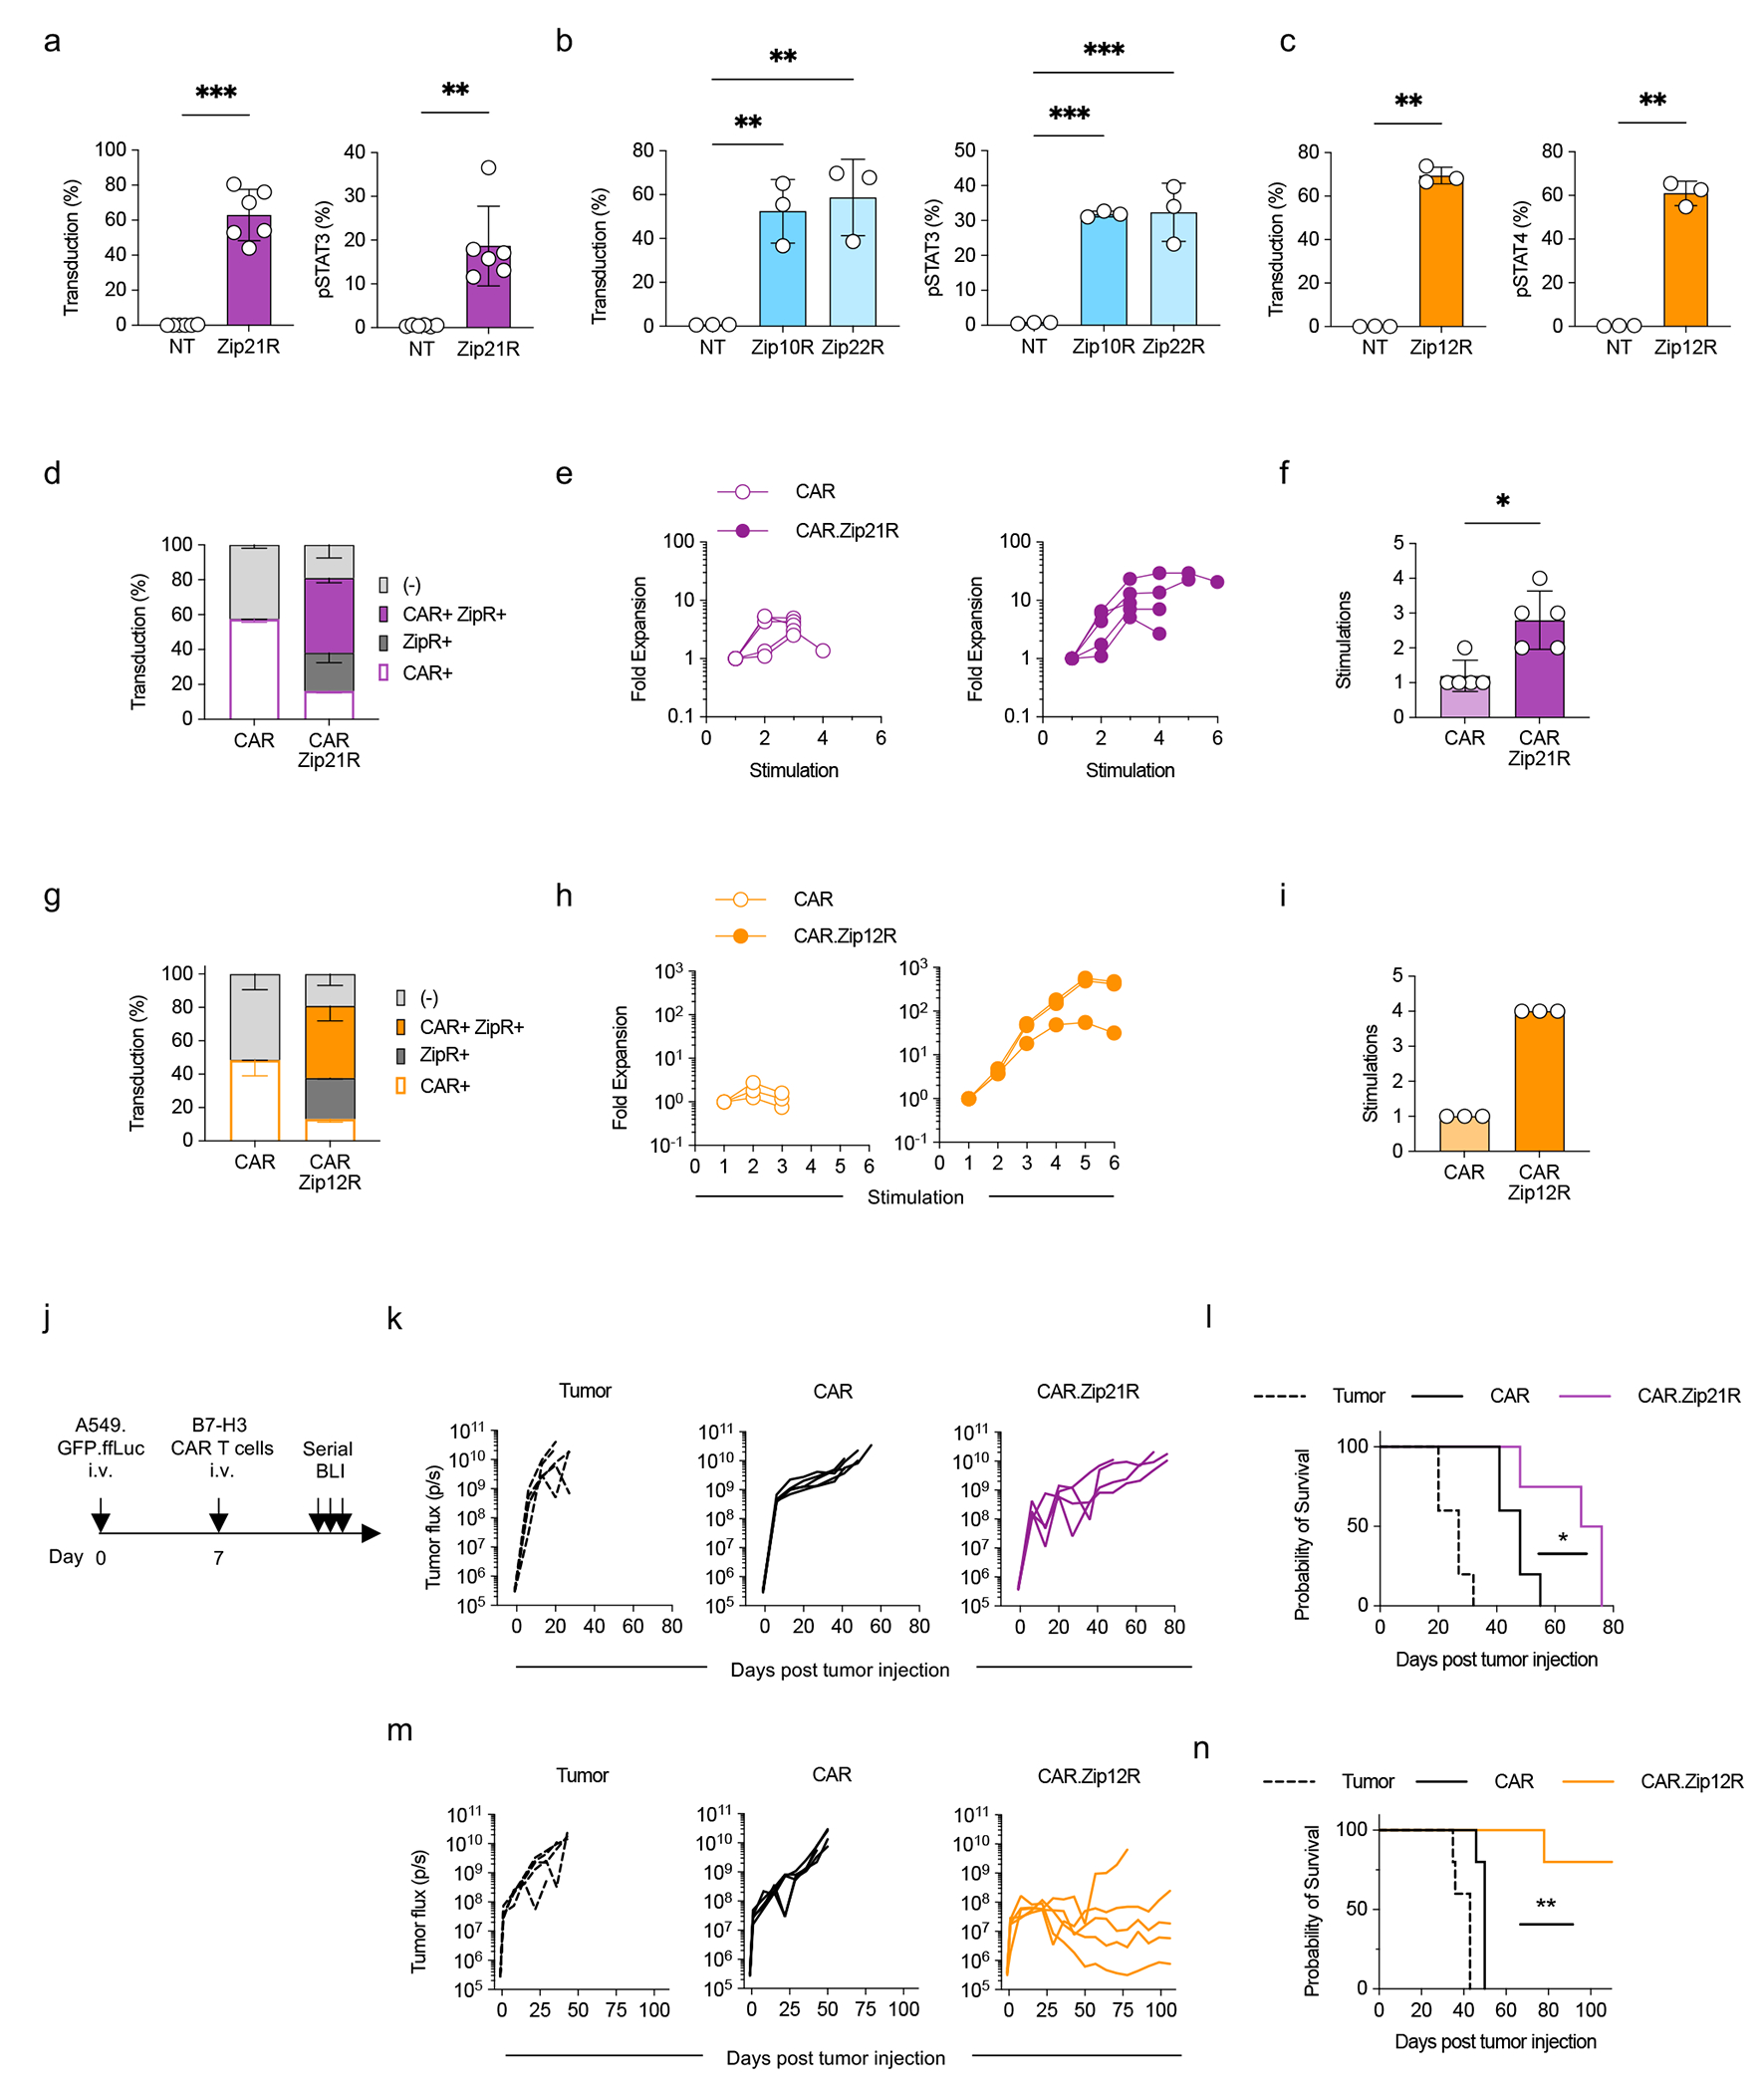
(a-c) Transduction efficiency (left) and pSTAT3 (a,b) or pSTAT4 (c) expression (right) in Zip21R (a), Zip10R or Zip22R (b), or Zip12R (c) T cells (mean±SD, **p<0.01, ***p<0.001, paired t-test (a,c), one-way ANOVA (b)). (d) Transduction efficiency of B7-H3 CAR and Zip21R in human T cells as measured by flow cytometry for ZipR (mClover) and CAR (anti-human F(ab’)2) (N=4, mean±SD). (e) Fold expansion of CAR or CAR.Zip21R T cells in repeat stimulation assay with A549 WT cells (N=5). (f) Stimulations of tumor cell killing by CAR- or CAR.Zip21R-expressing cells in repeat stimulation assay with A549 WT cells (mean±SD, *p<0.05, paired t-test). (g) Transduction efficiency of B7-H3-CAR and Zip12R in human T cells as measured by flow analysis for the ZipR (mClover) and CAR (anti-human F(ab’)2) (N=3, mean±SD). (h) Fold expansion of CAR or CAR.Zip12R T cells in repeat stimulation assay with A549 WT cells (N=3). (i) Stimulations of tumor cell killing by CAR- or CAR.Zip21R-expressing cells in repeat stimulation assay with A549 WT cells (N=3). (j) Experimental scheme of i.v. A549.GFP.ffLuc model; mice received a single i.v. dose of 3×10⁵ CAR T cells on day 7 post tumor cell injection. (k) Tumor burden in the lungs of treated mice as determined by serial bioluminescence imaging (N=4-5). (l) Kaplan-Meier survival curve (N=4-5, *p<0.05, log rank test). (m) Tumor burden in the lungs of treated mice as determined by serial bioluminescence imaging (N=5). (n) Kaplan-Meier survival curve (N=5, **p<0.001, log rank test).
ZipRs augment CAR T cell antitumor activity in vivo
We next evaluated the antitumor activity of Zip2R or Zip7R-expressing CAR T cells in our established intravenous (i.v.) A549.GFP.ffLuc (B7-H3-CAR) (Fig. 4a) or subcutaneous (s.c.) A673 (EphA2-CAR) models (Extended Data Fig. 7a). A549.GFP.ffLuc-bearing mice received a single subtherapeutic dose (3x10⁵) of B7-H3-CAR, B7-H3-CAR.Zip2R or B7-H3-CAR.Zip7R CAR T cells, and mock treated animals served as controls. CAR.Zip2R T cells induced significant tumor regression for greater than 8 weeks post infusion in comparison to B7-H3-CAR T cell treated mice (Fig. 4b,c, Supplementary Data Fig. 9) and only 1 out of 10 mice died of unknown causes 4 weeks post infusion. Improved antitumor activity of B7-H3-CAR.Zip2R T cells was confirmed in a separate experiment (Supplementary Data Fig. 10a,b). EphA2-CAR.Zip2R T cells also had significantly greater antitumor activity than EphA2-CAR.Zip7R or EphA2-CAR T cells in the A673 model for one donor, resulting in a significant survival advantage (Extended Data Fig. 7b,c). For a 2nd donor, EphA2-CARs as well as EphA2-CAR.Zip2R T cells induced complete tumor remissions; however, only mice treated with EphA2-CAR.Zip2R T cells rejected a secondary rechallenge with EphA2-positive tumor cells more than 100 days after CAR T cell injection (Extended Data Fig. 7d–f).
Figure 4: ZipRs augment CAR T cell antitumor activity in vivo.
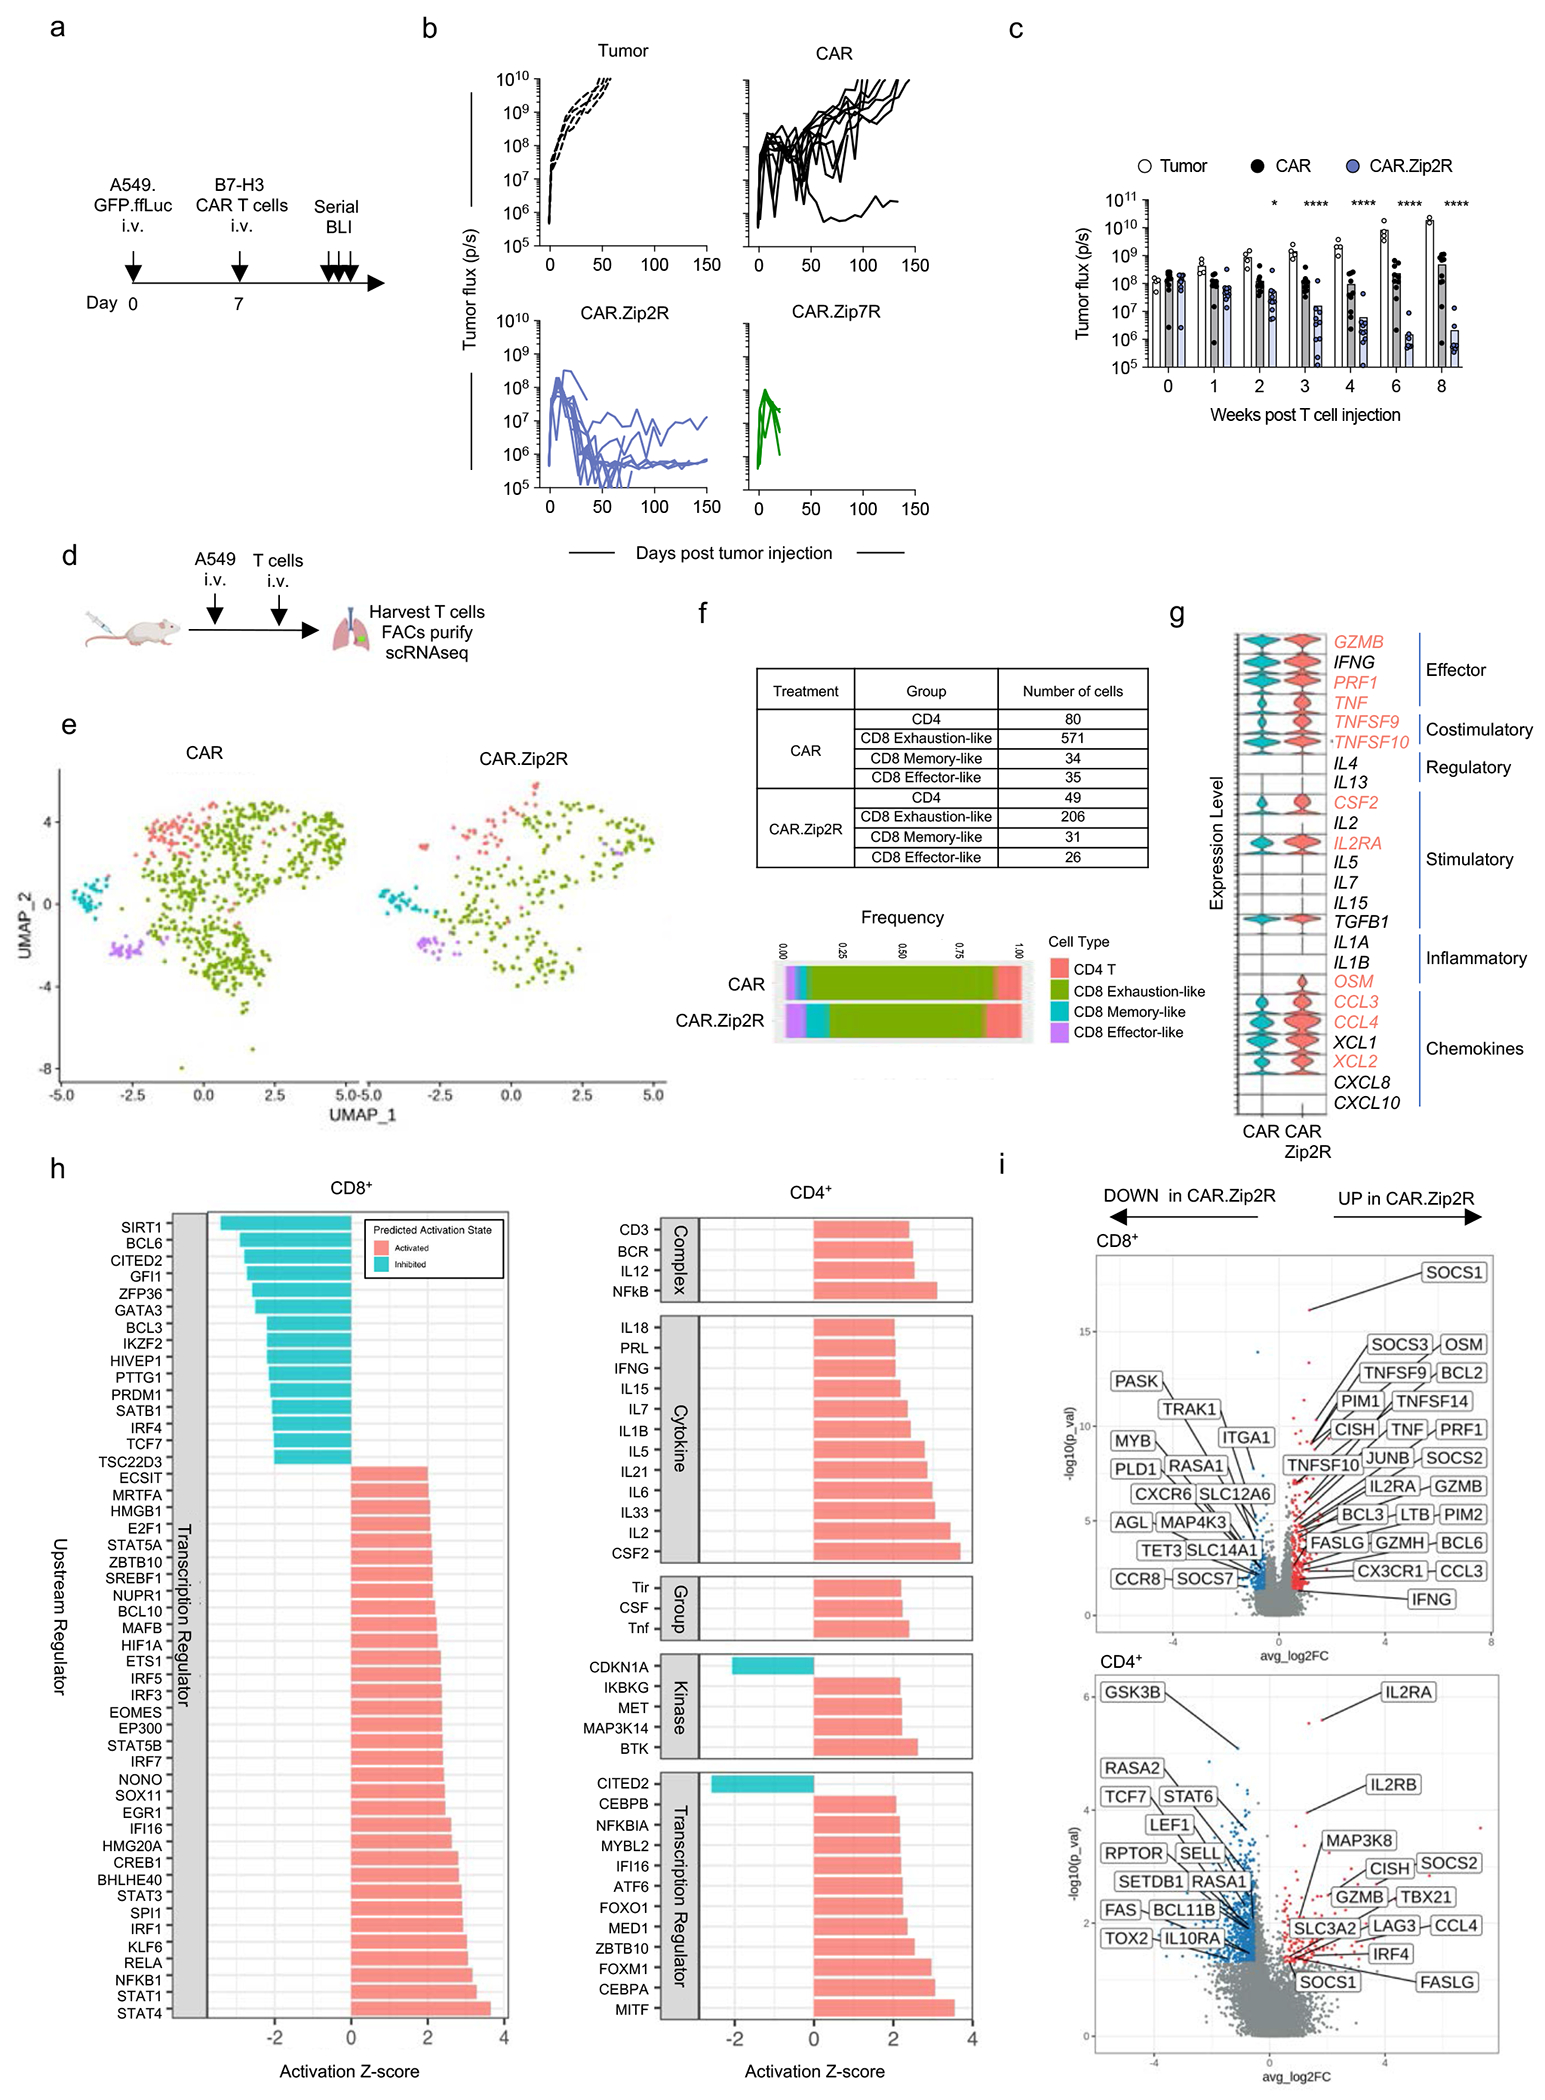
(a) Experimental scheme of i.v. A549.GFP.ffLuc model; mice received a single i.v. dose of 3×10⁵ CAR T cells on day 7 post tumor cell injection. (b) Tumor burden in the lungs as determined by serial bioluminescence imaging (N=5 [tumor and CAR.Zip7R] N=10 [CAR and CAR.Zip2R] from two donors). (c) Quantification of tumor flux in the lungs of treated mice (mean±SD, *p<0.05, ****p<0.0001, two-way ANOVA of log transformed BLI data). (d) scRNAseq experimental scheme. (e) UMAP projection of CAR or CAR.Zip2R T cells. (f) Quantification of cell population frequencies. (g) Expression of cytokines, chemokines, and surface effector markers. Red text indicates factors that are expressed log2FC > 0.5 with an adjusted p value < 0.05 for CD4+ and CD8+ CAR.Zip2R compared to CAR T cells (Wilcoxon rank sum test with Bonferroni correction). (h) Ingenuity Pathway Analysis for CD8 and CD4 CAR.Zip2R T cells. (i) DEGs with log2FC > 0.5 or < −0.5 and adjusted p value < 0.05 in CD8+ and CD4+ T cells.
Infusion of B7-H3-CAR.Zip7R T cells in the A549.GFP.ffLuc model was associated with significant toxicity, and all mice died within 2 weeks post infusion (Fig. 4b) due to T cell expansion within the lungs (Supplementary Data Fig. 11). Expansion was antigen-specific since ffLuc-expressing B7-H3-CAR.Zip7R T cells did not induce toxicity in non-tumor bearing mice (Extended Data Fig. 8a–d), and TRAC KO did not improve their safety profile (Extended Data Fig. 8e). To control CAR.Zip7R expansion and prevent toxicity in the i.v. A549 lung tumor model, we treated mice with ruxolitinib starting at day 7 post T cell injection, which significantly decreased CAR.Zip7R T cell expansion and prevented toxicity (Extended Data Fig. 8f–h).
To interrogate the mechanism of improved effector function of CAR.Zip2R T cells in vivo, we first compared the expansion of ffLuc-expressing CAR and CAR.Zip2R T cells in the i.v. A549 lung tumor model and found no significant differences (Supplementary Data Fig. 12a,b). Next, we isolated lymphocytes from the lungs of mice at peak CAR T cell expansion and analyzed their transcriptomic profiles by single cell RNA sequencing (scRNAseq) (Fig. 4d). Uniform manifold approximation and projection (UMAP) dimensionality reduction of CAR and CAR.Zip2R T cell transcriptomes denoted expanded populations of CD4, memory-like CD8, and effector-like CD8 CAR.Zip2R TILs and reduction of exhaustion-like cells (Fig. 4e,f, Supplementary Data Fig. 13). Furthermore, CAR.Zip2R T cells exhibited greater expression of effector molecules (GZMB, PRF1, TNF), costimulatory molecules (TNFSF9, TNFSF10), cytokines and chemokines (CSF2, OSM, CCL3, CCL4, XCL2), and the high-affinity IL-2Rα chain (IL2RA) suggesting a phenotypic state of heightened effector function and greater responsiveness to IL-2 (Fig. 4g). A deeper exploration of pathway regulation by Ingenuity Pathway Analysis30 and differentially expressed genes (DEGs) in CD8+ and CD4+ CAR.Zip2R T cells revealed increased signaling of cytokine receptor/JAK/STAT pathways, upregulation of effector molecules, metabolic regulation by mTOR, and signaling via diverse transcription factors known to sustain effector function (Fig. 4h,i). Overall, these results support the improved in vivo antitumor activity mediated by Zip2R which can likely be attributed to increased JAK/STAT signaling via Zip2R and maintenance of a functional effector state in both CD4+ and CD8+ CAR T cells in vivo.
Leucine zipper ectodomains enable the generation of ZipRs from diverse cytokine receptor families
To demonstrate that the leucine zipper ectodomain can be utilized to generate constitutive active cytokine receptors of additional common γ-chain cytokine or other cytokine family receptors, we generated ZipRs for the common γ-chain cytokine IL-21 (Zip21R), IL-10 family cytokines IL-10 (Zip10R) and IL-22 (Zip22R), and IL-12 family cytokine IL-12 (Zip12R). All ZipRs were functional as judged by STAT3 (Zip21R, Zip10R, Zip22R) or STAT4 (Zip12R) phosphorylation (Fig. 5a–c). We selected two ZipRs (Zip21R, Zip12R) for further functional analysis in CAR T cells. Expression of Zip21R did not change the phenotype of CAR T cells (Extended Data Fig. 9a,b), but we observed an increased proportion of naïve-like and central memory CAR.Zip12R T cells (Extended Data Fig. 9c–e). Zip21R or Zip12R improved the ability of B7-H3-CAR T cells to repetitively kill A549 cells in a repeat stimulation assay (Fig. 5d–i) without altering antigen specificity (Extended Data Fig. 9f,g), and extended survival of mice treated with a subtherapeutic dose of CAR T cells in the i.v. A549 model (Fig. 5j–n).
ZipRs endow CAR T cells with a polyfunctional effector transcription program
To broadly characterize and directly compare the transcriptomic profiles of CAR, CAR.Zip2R, CAR.Zip7R, and CAR.Zip12R T cells, we performed scRNAseq on unstimulated and chronic antigen stimulated CAR T cells that had undergone 3 weekly exposures to tumor cells (Fig. 6a,b). The EphA2-CAR was chosen for this comparison due to the ability of EphA2-CAR T cells to kill tumor cells and expand for more than one stimulation in vitro, in contrast to B7-H3-CAR T cells. UMAPs of unstimulated and stimulated samples reveal broad transcriptional changes after tumor stimulation with clusters representative of CD4 memory-like, CD4 effector-like, and CD8 CAR T cells (Fig. 6c). In comparison to CAR, CAR.Zip2R, and CAR.Zip7R T cells, CAR.Zip12R T cells demonstrated unique clusters of CD8, CD4 effector-like, and CD4 memory-like cells.
Figure 6: CAR.ZipR T cells sustain effector function through memory/survival or hybrid memory/effector transcriptional programs.
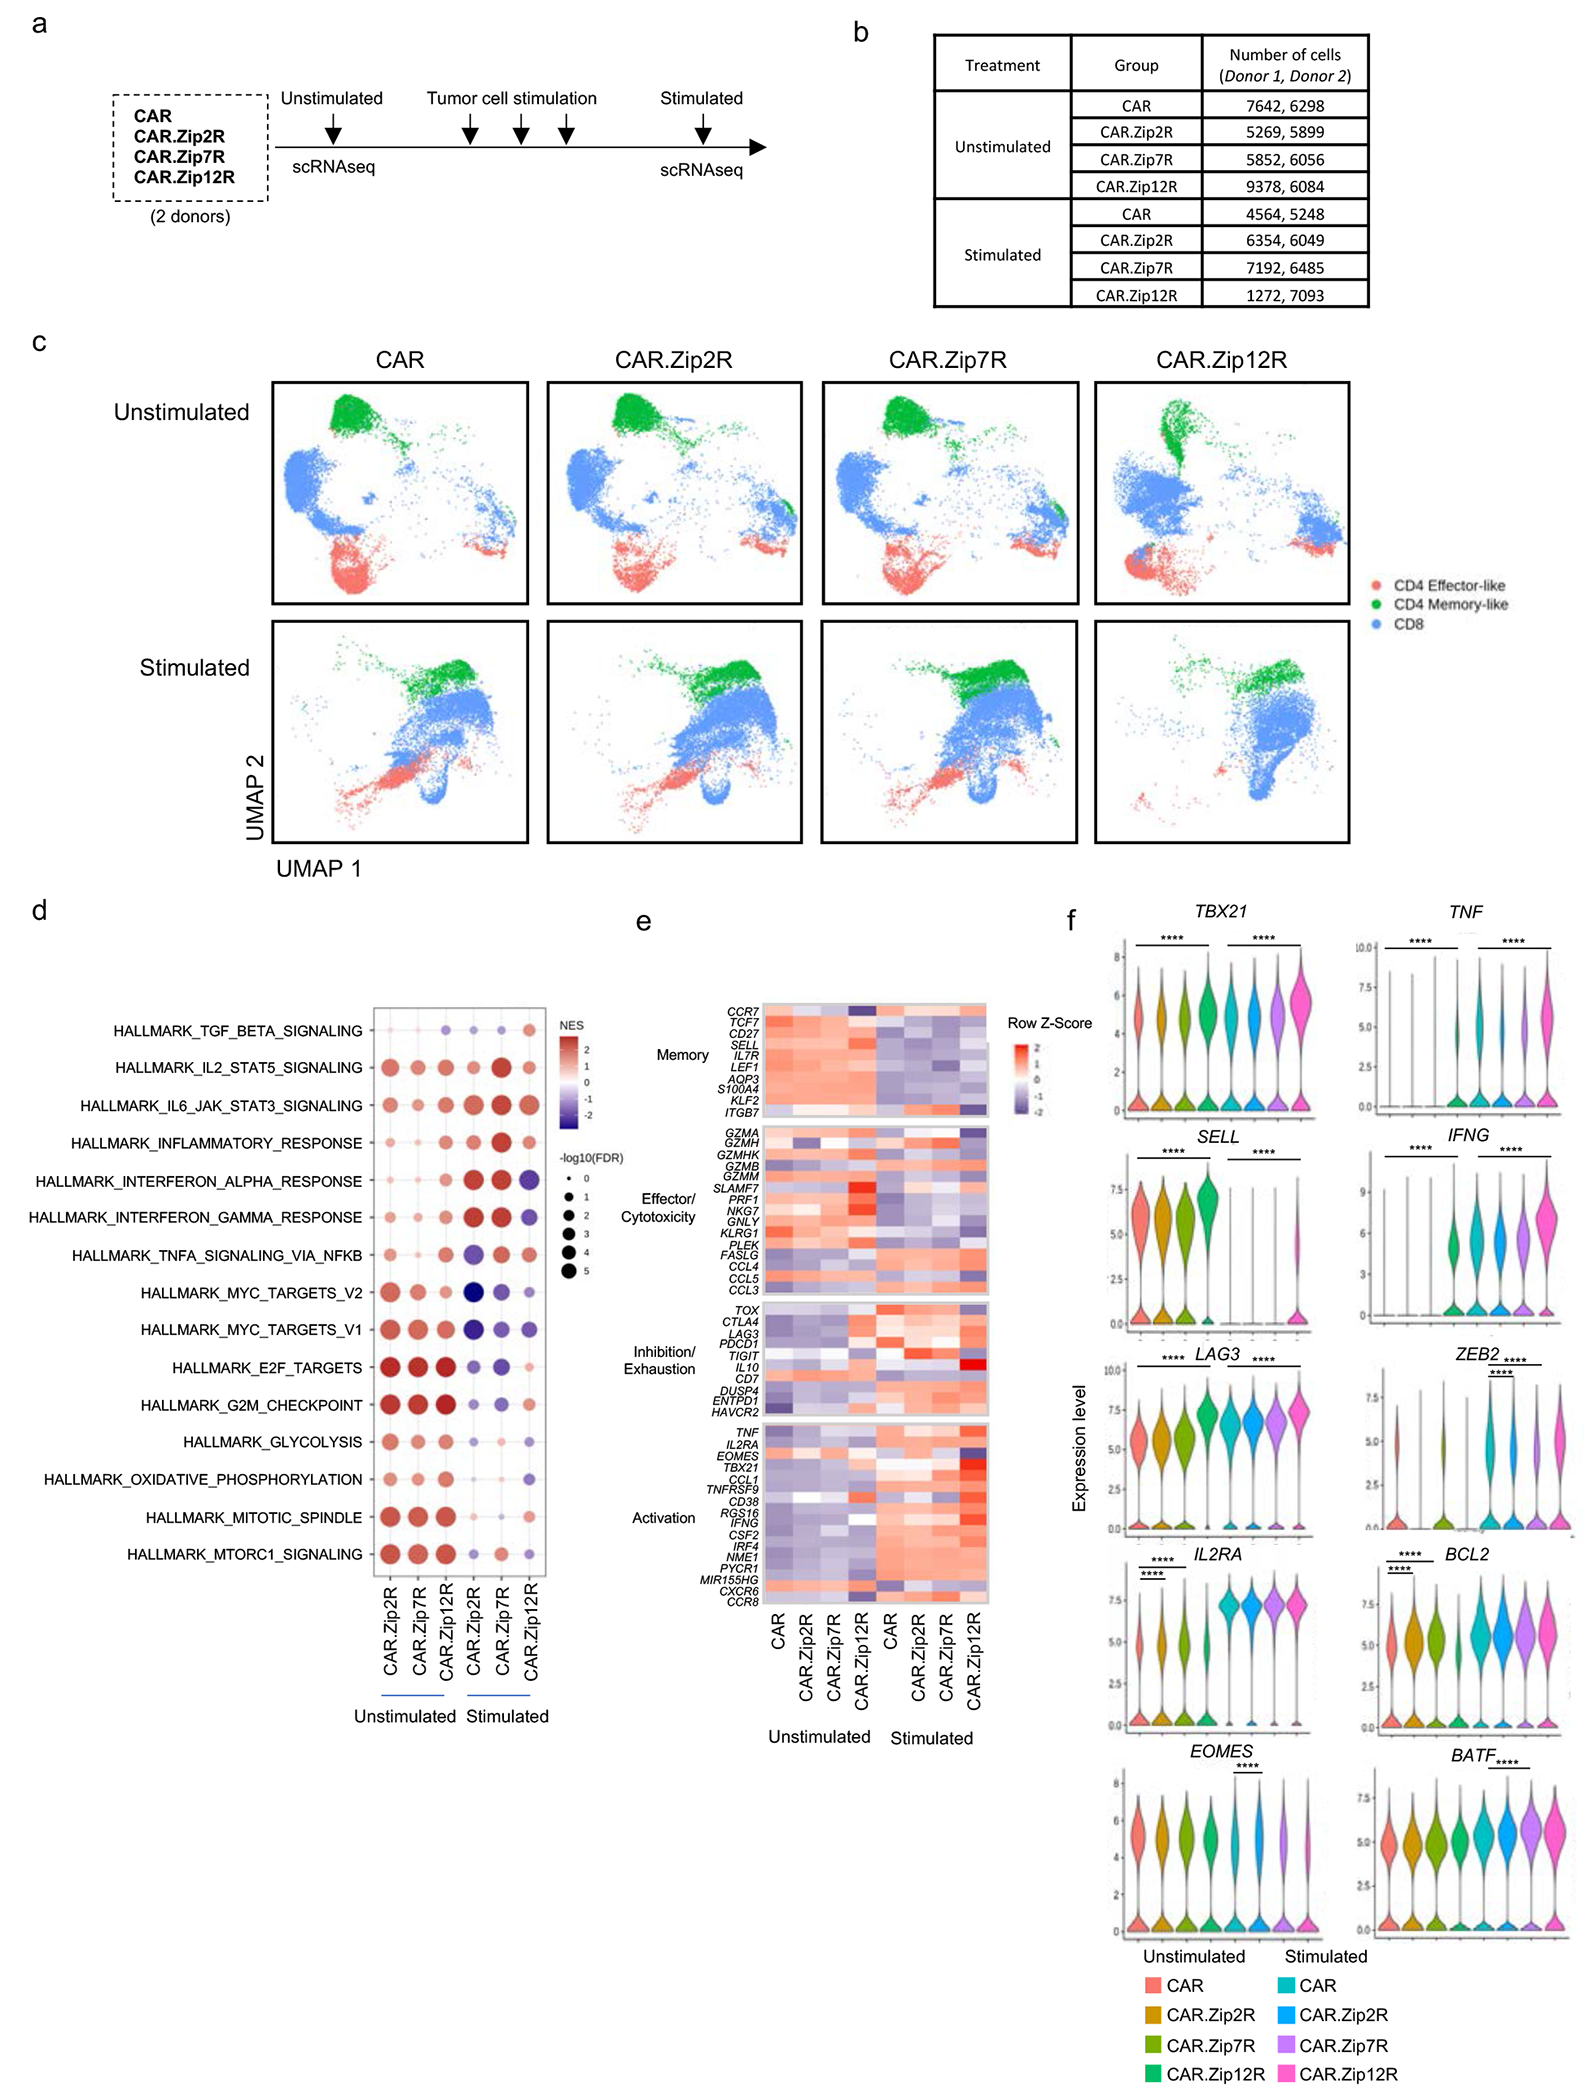
(a) scRNAseq experimental scheme. (b) Number of cells analyzed in each sample. (c) UMAP projection of unstimulated or stimulated CAR or CAR.ZipR T cell populations from two donors. (d) GSEA of unstimulated or stimulated CD8+ CAR.ZipR T cell populations in comparison to CAR T cells. (e) Expression of memory, effector/cytotoxicity, inhibition/exhaustion, and activation markers in unstimulated or stimulated CD8+ CAR and CAR.ZipR T cell populations. (f) Expression of selected genes in unstimulated or stimulated CD8+ CAR and CAR.ZipR T cell populations (Wilcoxon rank sum test with Bonferroni correction; ****adjusted p value < 0.0001 and log2FC > 0.5 or < −0.5).
Gene set enrichment analysis (GSEA) of CAR.ZipR CD8+ (Fig. 6d) and CD4+ (Extended Data Fig. 10a) T cells before and after stimulation revealed upregulation of signaling pathways indicative of proliferation, metabolic changes, and STAT signaling. In comparison to CAR, CD8+ CAR.Zip2R and CAR.Zip7R T cells expressed similar gene sets corresponding to enhanced cell cycle regulation and proliferation, metabolic regulation by mTORC1, and IL-2/STAT5 signaling before stimulation, which shifted to effector transcriptional programs dominated by an inflammatory response mediated by IL-6/STAT3, IFN, and TNFA after chronic antigen exposure. In contrast, CAR.Zip12R T cells expressed gene sets indicative of a mixed memory/effector state consisting of proliferation and cell cycle regulation, STAT5 and STAT3 signaling, and TNFA signaling via NFkB after chronic antigen exposure.
A deeper analysis of differentially expressed genes revealed a unique polyfunctional effector memory state in CAR.Zip12R CD8+ (Fig. 6e, Supplementary Data Fig. 14a) and CD4+ (Extended Data Fig. 10b, Supplementary Data Fig. 14b) T cells at baseline and following stimulation. Zip12R induced higher expression of central memory associated markers, such as SELL, which is consistent with the flow cytometric analysis of B7-H3-CAR.Zip12R T cells (Extended Data Figure 9d,e). We also observed increased expression of effector molecules (GZM, PRF1, TNF, and IFNG), and transcription factors TBX21 and IRF4 with low expression of TOXand EOMES. Following stimulation, CD8+ CAR.Zip12R T cells also had lower expression of PD1 (PDCD1) and TIGIT but higher expression of LAG3, a gene known to be upregulated by IL-1231 (Fig. 6f). These data suggest that induction of IL-12 responsive genes, including IL-1032 and TBX2133, by Zip12R function to induce effector differentiation, as suggested by greater expression of IFNG and TNFA compared to unmodified CAR T cells. However, Zip12R does not fully recapitulate physiological IL-12 signaling that induces T cell dysfunction during chronic exposure18 and may instead prevent exhaustion by downregulating TOX34 and sustain a population of memory-like CD8+ T cells, similar to the memory precursor effector cells induced by low amounts of IL-1233, via low-level constitutive TBX21 and STAT4 signaling.
In contrast, CD8+ CAR.Zip2R T cells expressed higher levels of IL2RA and BCL2 before stimulation, and after stimulation expressed higher levels of EOMES and lower levels of ZEB2. CD8+ CAR.Zip7R T cells also expressed high levels of IL2RA and BCL2 at baseline but higher levels of BATF with low ZEB2 following stimulation (Fig. 6f). This suggests that Zip2R and Zip7R induce expression of IL2RA and BCL2 via STAT535, which promote cell survival in the absence of exogenous cytokines or antigenic stimulation. Following stimulation however, the sustained effector function of CAR.Zip2R and CAR.Zip7R T cells could be explained by higher expression of EOMES36 or BATF37 and lower expression of ZEB2, which could prevent terminal differentiation and maintain memory T cell programs38. Overall, these results highlight the divergent transcriptomic profiles induced by Zip2R, Zip7R, and Zip12R in CAR T cells before and after chronic antigen stimulation that result in improved CAR T cell effector function.
Discussion
Here we describe the development of a modular leucine zipper-based receptor (ZipR) platform to provide cell-intrinsic cytokine signaling to CAR T cells. We demonstrate that ZipRs promote T cell survival and improve the effector function of CAR T cells targeting the solid tumor antigens B7-H3, EphA2, or GPC2 in vitro and in xenograft models.
As IL-2 receptor signaling is initiated via heterodimerization of the IL-2Rβ and IL-2Rγ chains during IL-2 binding, we explored the feasibility of activating the STAT5 signaling pathway of the IL-2 receptor without exogenous cytokines by replacing the extracellular domains of IL-2Rβ and IL-2Rγ with heterodimerizing leucine zipper motifs. We focused on a design with one [Zip2R(1x)] or two [Zip2R(2x)] pairs of leucine zippers, hypothesizing that one pair would activate the IL-2R pathway through heterodimerization, which would be enhanced by a second pair either by improved heterodimerization or formation of oligomeric complexes. Based on our structural modeling and confocal microscopy results, we concluded that the second leucine zipper motif allows ZipR chains to form multimeric complexes, which is required for optimal activation of ZipR downstream signaling, including phosphorylation of STATs. Other investigators have shown that a single leucine zipper motif is sufficient to homodimerize IL-6 receptor beta or erythropoietin receptor chains, or heterodimerize the GM-CSF receptor chains to initiate downstream signaling39–41. However, these studies did not explore if adding a second leucine zipper would further augment signaling strength. Additionally, JAK2 activation by growth hormone receptor homodimerization was shown to require structural repositioning of intracellular domains, in addition to proximity, in order to bring JAK2 into productive apposition to initiate downstream signaling42. Thus, it is likely that the signaling strength of ZipRs even with a single leucine zipper domain could be further optimized with structural modifications. Likewise, alternative ZipR designs could be explored by repositioning the leucine zipper motifs to the intracellular domain or designing fully intracellular ZipRs to modulate subcellular localization and downstream signaling.
Since Zip2R and Zip7R are synthetic molecules that induce STAT5 phosphorylation with lower signal strength compared to physiological cytokine stimulation, they may not fully recapitulate canonical cytokine signaling. To study the effects of ZipRs in T cells, we therefore performed an unbiased phosphoproteomic analysis, which revealed the activation of distinct signaling cascades in T cells expressing Zip2R or Zip7R compared to IL-15 stimulated T cells. These involved diverse cellular processes including cell cycle, chromatin and transcriptional regulation, cytoskeleton and cell adhesion, translational machinery/RNA processing and splicing, and metabolism. Our findings are consistent with a previous study that performed a phosphoproteomic analysis of IL-2 stimulated murine CD8+ T cells43, and highlight that merely focusing on phosphorylation of STAT molecules as a readout of engineered cytokine signaling in immune cells might not be sufficient. Likewise, comparing the phosphoproteome of the other functional ZipRs generated in this study (Zip10R, Zip12R, Zip21R, Zip22R) could provide additional insights to guide the future development of our modular receptor platform.
Expression of Zip2R or Zip7R in T cells enabled them to survive in the absence of exogenous cytokines for at least 21 days without inducing autonomous cell growth. We believe that this is an important attribute of the developed receptors since CAR T cells have to traffic to and penetrate solid tumors before they are activated by antigen-expressing tumor cells. At present it is unclear why ZipRs do not induce autonomous cell growth, but overall signaling strength might be a possible explanation based on our and other investigators experience with the transgenic expression of cytokines9,11,14,44. For example, while exogenous IL-15 at ng/mL concentrations induces T cell proliferation, IL-15 expressing CAR T cells secrete significantly lower levels of IL-15 and do not proliferate without antigen recognition11,45. Thus, since there is a ‘baseline benefit’ of ZipRs, we posit that genetically modifying ZipR T cells with an inducible safety switch such as inducible caspase 9 (iC9)46 is preferable over activation-dependent ZipRs to alleviate potential safety concerns. In addition, the FDA-approved JAK1/2 inhibitor ruxolitinib presents an attractive option as an off-the-shelf safety switch since we demonstrate that it blocks ZipR signaling in vitro and prevents Zip7R toxicity in vivo.
Significant differences were observed in the downstream pathways modulated by Zip2R and Zip7R, therefore we chose to explore both in CAR T cells. In our initial studies comparing the effector function of CAR.Zip2R or CAR.Zip7R T cells versus unmodified CAR T cells, we observed no significant differences after the first stimulation. However, CAR.Zip2R or CAR.Zip7R T cells outperformed unmodified CAR T cells in repeat stimulation assays. This finding is consistent with other genetic modifications of CAR T cells to enhance their effector function including transgenic expression of cytokines or deleting negative regulators11,47. While we did not observe significant differences between CAR.Zip2R or CAR.Zip7R T cells in vitro, CAR.Zip7R T cells induced significant toxicity due to antigen-specific T cell proliferation at lung tumor sites but not subcutaneous tumor sites in vivo. The observed toxicity was not caused by altered antigen specificity or by on-target/off-tumor reactivity because our B7-H3 CAR does not recognize murine B7-H348. Thus, as reported for GD2-CAR T cells49, tumor location can contribute to observed toxicities of adoptively transferred T cells and careful clinical monitoring may be required for both unmodified and cytokine enhanced cell therapies. While additional studies are needed to provide mechanistic insights, we believe that the identified differences in the phosphoproteome and transcriptome of Zip2R and Zip7R T cells are one potential explanation.
scRNAseq profiling of CAR and CAR.Zip2R T cells from the lungs of tumor-bearing mice revealed expansion of CD4+, CD8+ memory-like, and CD8+ effector-like cells by Zip2R and a transcriptional program indicative of STAT5 signaling, cell proliferation, and effector function. Surprisingly, in comparison to repeat stimulation assays in vitro, we did not observe enhanced proliferation of CAR.Zip2R T cells in vivo. The difference may be due to the ON-OFF-ON stimulation in vitro that allowed partial memory to form and promoted enhanced proliferation of CAR.Zip2R T cells, while constant stimulation in vivo allowed both CAR and CAR.Zip2R T cells to expand to similar levels. Nonetheless, we observed significantly improved in vivo functionality of CAR.Zip2R T cells, which cleared solid tumors with cell doses at which unmodified CAR T cells were ineffective. Thus, the improved in vivo functionality of CAR.Zip2R T cells is likely due to quality, rather than quantity of cells. In support of this view, we observed expanded populations of memory and effector CD4+ and CD8+ T cells that maintained an effector state where Zip2R cooperated with CAR-mediated antigen recognition to induce higher levels of cytotoxic effector molecules, chemokines, costimulatory molecules, and transcription factors such as JUNB and TBX21.
Finally, we generated other ZipRs from common γ-chain cytokine receptor family (IL-21: Zip21R), IL-10 family (IL-10: Zip10R; IL-22: Zip22R), and IL-12 family (IL-12: Zip12R). All ZipRs were functional as judged by their ability to phosphorylate STAT3 (IL-21, IL-10, IL-22) or STAT4 (IL-12), highlighting the modular nature of the developed receptor platform. We demonstrated for one STAT3-phosphorylating ZipR (Zip21R) and one STAT4-phosphorylating ZipR (Zip12R) that their expression in CAR T cells augmented effector function in vitro and in vivo. However, since our in vivo studies were not designed to perform a head-to-head comparison between STAT3, STAT4, and STAT5 phosphorylating ZipRs, future studies should focus on a direct comparison to identify the optimal ZipR for future clinical testing. Likewise, developing ZipRs that phosphorylate multiple STATs could have the potential to further improve CAR T cell effector function.
To interrogate the transcriptional programs induced by Zip2R, Zip7R, and Zip12R, we collected unstimulated and chronic antigen stimulated CAR or CAR.ZipR T cells for scRNAseq analysis. At baseline, CAR.Zip2R and CAR.Zip7R upregulated genes and gene sets associated with cell cycle, proliferation, IL-2/STAT5 signaling, and mTORC1. These results are in agreement with our phosphoproteomic analysis of Zip2R and Zip7R T cells that showed an increase in phosphorylated proteins involved in cell cycle regulation, proliferation, cytokine receptor/STAT signaling, and mTOR. After tumor stimulation, transcriptional programs shifted to an inflammatory effector state dominated by interferon response and IL-6/STAT3 signaling. However, Zip12R induced a unique polyfunctional effector memory transcriptional program reminiscent of Mediator kinase module KO CAR T cells50. CAR.Zip12R T cells upregulated expression of IL-12 responsive genes (IL10, LAG3), memory associated molecules (SELL, LEF1), and effector molecules (TNF, IFNG, GZM, PRF1) while expressing lower levels of TOX and TIGIT and higher levels of TBX21 in comparison to CAR T cells. In contrast, CAR.Zip2R and CAR.Zip7R T cells expressed high levels of IL2RA and BCL2 at baseline and low levels of ZEB2 after stimulation with higher EOMES induced by Zip2R and higher BATF induced by Zip7R, suggesting enhanced survival at baseline and maintenance of different effector states following stimulation. Together, these results suggest that diverse synthetic cytokine signaling pathways are beneficial to CAR T cells and that approaches to maintain CAR T cell effector states rather than stemness might be an alternative approach to improve adoptive cell therapy for solid tumors.
While not directly compared in our studies, we believe that the developed ZipR technology has several advantages compared to other constitutive active cytokine platforms. Membrane-bound cytokine platforms, such as receptor-tethered IL-721, and membrane-bound IL-1851, IL-1552, and IL-1253 all have the advantage of providing constant cytokine signaling to enhance CAR T cell effector function with a lower risk of systemic toxicity. However, these platforms rely on surface expression of their cognate receptor to function, which could be downregulated following antigen stimulation or during T cell exhaustion. Constitutive active cytokine receptors have also been described, including an IL-7 receptor (C7R)19, which is being explored in early phase clinical studies. While this receptor shares the aforementioned benefit of ZipRs, it does not have a modular design and thus cannot be tuned to differentially activate JAK/STAT signaling pathways.
In conclusion, we have developed a modular chimeric cytokine receptor platform, and its members have the potential to improve the antitumor activity not only of CAR T cells but other immune effector cells that are currently being explored for the treatment of solid tumors.
Methods
Cell lines
The A549 (lung cancer), A673 (Ewing sarcoma), Jurkat (leukemia) cell lines were purchased from ATCC. The LM7 (osteosarcoma) cell line was provided by Dr. Eugenie Kleinerman (MD Anderson Cancer Center, Houston, TX), and the LAN-1 cell line by Dr. Robert Seeger (Children’s Hospital of Los Angeles, Los Angeles, CA). The generation of A549 cells genetically modified to express an enhanced green fluorescent protein firefly luciferase molecule (A549.GFP.ffLuc), was previously described54. The generation of the B7-H3−/− LM7 cells (LM7 B7-H3 KO) by CRISPR-Cas9 technology was previously described29. We used the same approach to generate B7-H3 KO A549 cells. Once thawed, cell lines were kept in culture for a maximum of 3 months before a new reference vial was thawed. Cell lines were cultured in Dulbecco’s Modified Eagle Medium (GE Healthcare Life Sciences HyClone Laboratories) supplemented with 10% fetal bovine serum (FBS; GE Healthcare Life Sciences HyClone Laboratories) and 2 mmol/L Glutamax (Invitrogen). Cell lines were authenticated by the ATCC human short-tandem repeat profiling cell authentication service and routinely checked for mycoplasma by the MycoAlert Mycoplasma Detection Kit (Lonza).
Generation of viral vectors
The generation of the lentiviral vectors encoding the signaling B7-H3-CAR.CD28ζ (B7-H3-CAR), nonsignaling B7-H3-CAR (B7-H3-ΔCAR), and pSFG retroviral vector encoding the functional EphA2-CAR.CD28ζ (EphA2-CAR) and non-functional EphA2-CAR (EphA2-ΔCAR) were previously described29,55. Lentiviral vectors encoding GPC2-CAR.CD28ζ, GPC2-CAR.41BBζ, or GPC2-ΔCAR were generated by replacing the B7-H3-specific scFv with the GPC2-specific CT3 scFv56 in previously published vectors encoding the respective B7-H3-CARs29. Lentiviral vectors were produced by the Vector Production and Development Laboratory (St. Jude Children’s Research Hospital). The pSFG retroviral vectors encoding IL-2R²(1x), IL-2R²(2x), IL-2R³(1x), IL-2R³(2x), Zip2R, Zip7R, Zip21R, Zip12R, Zip10R and Zip22R were generated by synthesizing gene fragments (Thermo Fisher Scientific) and In-Fusion cloning (Takara Bio). They consist of (i) either one or two leucine zipper motifs57 linked by a glycine/serine linker; (ii) 15 amino acids from the extracellular domain of the indicated cytokine receptor chain; (iii) the entire transmembrane and intracellular domain from the indicated receptor chain; (iv) a P2A sequence; and (v) either mRuby or mClover. For microscopy experiments, IL-2Rβ(1x), IL-2Rβ(2x), IL-2Rγ(1x), and IL-2Rγ(2x) were directly fused at the C-terminus to either mRuby or mClover by deleting the P2A sequence. Additionally, either SNAP tag [IL-2Rγ(1x) and IL-2Rγ(2x)] or CLIP tag [IL-2Rβ(1x) and IL-2Rβ(2x)] was directly fused to the N-terminus and truncated CD20 [IL-2Rγ(1x) and IL-2Rγ(2x)] or truncated CD19 [IL-2Rβ(1x) and IL-2Rβ(2x)] was used for detection of transduction. The sequences of the final constructs were verified by sequencing (Hartwell Center, St. Jude Children’s Research Hospital, which is supported by the National Cancer Institute under Award Number P30 CA021765) and are provided as supplementary data. RD114-pseudotyped retroviral particles were generated by transient transfection of 293T cells as previously described. Supernatants were collected after 48 hours, filtered, and snap-frozen.
Generation of genetically modified T cells
Human peripheral blood mononuclear cells (PBMCs) were isolated using Lymphoprep (Abbott Laboratories) from de-identified elutriation chambers of leukapheresis products obtained from St. Jude Children’s Research Hospital’s donor center. On day 0, CD4+ and CD8+ T cells were enriched from PBMCs by immunomagnetic separation using CD4 and CD8 microbeads (Miltenyi, Germany), an LS column (Miltenyi), and a MidiMACS separator (Miltenyi). Enriched T cells were resuspended at 1×10⁶ cells/mL in RPMI 1640 (GE Healthcare) supplemented with 10% FBS (GE Healthcare), 1% GlutaMAX (Thermo Fisher Scientific) (complete RPMI), and recombinant human cytokines IL-7 (10 ng/mL) and IL-15 (5 ng/mL; Biological Resources Branch, National Cancer Institute, Frederick, MD, USA, or PeproTech, Rocky Hill, NJ, USA) and stimulated overnight on 24-well non-tissue culture-treated plates that were precoated with CD3 and CD28 antibodies (Miltenyi). For B7-H3- and GPC2-CAR.ZipR T cell generation, transduction was performed on day 1 by adding VSVG-pseudotyped LV particles (B7-H3-CAR, ΔCAR) at an MOI of 50, and protamine sulfate (4 μg/mL). 24 hours after lentiviral transduction, CAR T cells were transferred to retronectin-coated plates with retroviral particles for 2 to 4 days. For EphA2-CAR.ZipR T cell generation, activated T cells were seeded on day 1 onto retronectin (Clontech)-coated plates with an admixture of retroviral particles encoding the EphA2-CAR and a ZipR. To generate CAR or ZipR T cells the same procedure was followed with the exception of only using the respective single viral vector. Post transduction, T cells were expanded in complete RPMI in the presence of IL-7 (10 ng/mL) and IL-15 (5 ng/mL) for 7-14 days prior to performing the experiments. Non-transduced (NT) T cells were prepared similarly, except that no retrovirus was included in the retronectin wells. For all experiments with biological replicates, PBMCs from different healthy donors were used.
Fluorescence microscopy
For mRuby/mClover colocalization studies, transfected HEK293T cells were selected by fluorescence activated cell sorting before seeding on Poly-L-Lysine (Sigma) coated coverslips (Fisher Scientific). Coverslips were fixed with 4% paraformaldehyde (Electron microscopy sciences) before mounting onto slides using Fluoromount-G (ThermoFisher Scientific). For SNAP/CLIP tag imaging, coated coverslips were prepared using N1 coverslips (Fisher Scientific: #12-545-80P), which were coated with 0.01% Poly-L-Lysine (Sigma) overnight at 4°C, then washed with PBS and filled with media until T cell seeding. 200,000 T cells were plated onto precoated coverslips for 1 hour in a cell culture incubator (37°C/5%CO2). Cells were washed with cold PBS and fixed with 4% paraformaldehyde (PFA) (Electron Microscopy Sciences) for 10 minutes at room temperature. Fixed cells were washed twice with PBS and the remaining PFA was inactivated with blocking buffer (PBS-2% BSA (Sigma), 1.5M Glycine (Sigma)) for 10 min at room temperature. Cells were permeabilized by adding PBS 0.2% BSA and 0.05% saponin permeabilization buffer (Sigma) for 20 minutes at room temperature. Cells were washed twice with permeabilization buffer prior to primary antibody incubation. Coverslips were incubated at 4°C overnight. Cells were washed with permeabilization buffer and incubated with secondary antibodies for 2 hours at room temperature. Finally, cells were washed with permeabilization buffer and PBS before drying for 1 hour at room temperature. Then, coverslips were mounted onto slides using Fluoromount-G (ThermoFisher Scientific). The following antibodies and stains were used: Membrite (Biotium), LAMP1 (Clone H4A3, Abcam), Rab5a (Clone 2E8B11, ThermoFisher Scientific), Rab11 (Clone D-3, Santa Cruz), AlexaFluor 647 Goat anti-Mouse IgG (ThermoFisher Scientific), CLIP-Cell 505 (New England Biolabs), and SNAP TMR STAR (New England Biolabs).
Image acquisition and analysis:
Images were acquired on a Zeiss Axio Observer with CSU-X spinning disc or Zeiss Lsm 980 Airyscan in super-resolution mode and the processing and analysis was performed with FIJI (ImageJ) software58. To analyze colocalization, the plugin JACoP59 was used. For Pearson correlation, the image threshold was manually adjusted using single-transfected cells, in order to set a proper background discrimination. To quantify the area of the colocalized spots, the same threshold used for colocalization was applied to every image. The generated binary mask for gamma- and beta-ZipRs were intersected using the Image calculator function in FIJI. All intersects were quantified using the Analyze particle function in FIJI. The detected spots were further filtered by area (2μm-20μm).
Phosphoproteome profiling by TMT-LC/LC-MS/MS
Sixteen samples with 20 million cells per sample were analyzed by phosphoproteome profiling analysis as described previously60. In brief, transduced T cells were CD4 or CD8 selected using MACS LS columns (Miltenyi), starved of exogenous cytokines for 48 hours, then flash frozen with liquid nitrogen. IL-15 stimulated NT cells were treated with IL-15 (5ng/mL) for 15 minutes prior to being flash frozen. The mass spectrometry analysis was performed by the Center of Proteomics and Metabolomics of St. Jude Children’s Research Hospital, partially supported by Cancer Center Support Grant (P30CA021765) from the National Cancer Institute and ALSAC (American Lebanese Syrian Associated Charities). Briefly, cells were then washed with ice cold 1X PBS and lysed in fresh lysis buffer (50 mM HEPES, pH 8.5, 8 M urea, 1× PhosStop Phosphatase inhibitor (Roche), 0.5% sodium deoxycholate). Proteins were quantified by the BCA protein assay (ThermoFisher Scientific) and confirmed on a short SDS gel followed by Coomassie staining with titrated BSA as standard. About 500 μg proteins from each sample were digested with Lys-C (Wako, 1:100 w/w) for 2 hours (h) at room temperature, diluted 4 times with 50 mM HEPES, pH 8.5, and further digested with trypsin (Promega, 1:50 w/w) overnight at room temperature. The resulting peptides from each sample were desalted, labeled with TMTpro 16plex reagents (ThermoFisher Scientific), and equally pooled. The mixed TMT labeled peptides were desalted and applied for off-line fractionation by basic-pH reverse phase liquid chromatography. Peptides were separated into 41 fractions via a 1 h gradient from 15% to 55% buffer B (buffer A: 10 mM ammonium formate, pH 8; buffer B: buffer A + 95% acetonitrile) on a XBridge C18 column (3.5 μm particle size, 4.6 mm × 25 cm, Waters). TiO2-based phosphopeptide enrichment was then performed on each fraction. The phosphopeptides were reconstituted in 5% formic acid and analyzed on an Orbitrap HF mass spectrometer (ThermoFisher Scientific) after being separated on a 20 cm × 75 μm ID C18 column (CoAnn Technologies) with heating at 55°C. Peptide separation was achieved by 7-40% buffer B gradient in 2 h (buffer A: 0.2% formic acid, 3% DMSO; buffer B: buffer A + 65% acetonitrile). The mass spectrometer was set in DDA mode (60,000 resolution, 1 × 10⁶ AGC target, and 50 ms maximal ion time for MS1; top 16, 1 × 10⁵ AGC target, 170 ms maximal ion time, 1 m/z isolation window and 0.2 m/z offset, 32 NCE, and 10 second dynamic exclusion for MS2). Mass spectrometry data were processed by the hybrid JUMP software suites for improving sensitivity and specificity61,62. Briefly, acquired raw files were converted into mzXML format and searched against the Uniprot human database with static mass shift for TMT-tagged N-terminus and lysine (+304.2071453), dynamic mass shift for serine, threonine and tyrosine (+79.96633), and the search and filtering parameters were applied to achieve 1% phosphopeptide FDR using the target-decoy approach. The TMT reporter ion intensities of each peptide-spectrum match (PSM) for identified phosphopeptide were used for phosphopeptide quantification60,62.
Phosphoproteomic and IKAP analysis
For phosphoproteomics analysis, we used a systems biology algorithm called NetBID2 (data-driven Network-based Bayesian Inference of Drivers)63. First, we calculated the average abundance of all quantified phosphosites over corresponding proteins (total 4,452 proteins). Further we filtered the low abundant proteins with abundance value in the bottom 5% in more than 90% of samples. We removed donor specific batch effects with “removeBatchEffect” from limma package64. To identify proteins with differential abundance in pairwise comparisons, we used “getDE.limma.2G” from NetBID2. We identified 700 proteins which were differentially abundant at p-value < 0.05 in pairwise comparisons, which were plotted in the global heatmap analysis using the package ComplexHeatmap65. Principle component analysis (PCA) and volcano plots were generated using NetBID2. Venn diagrams were generated using VennDiagram (https://cran.r-project.org/web/packages/VennDiagram/).
IKAP analysis:
The activity of upstream kinase was computationally inferred based on the phosphorylation change of downstream substrates measured from the phosphoproteome using NetBID260. The analysis was performed for CD4 and CD8 T cells, respectively, as followed: i) identify phosphopeptides that significantly changed across treatment conditions (ANOVA p < 0.05); ii) connect upstream kinase with downstream substrate phosphopeptides based on known kinase-substrate network from the PhosphoSitePlus database66. The mapping of phosphosites between the database and phosphopeptide was achieved by extracting +/− 7 amino acids surrounding the indicated phosphosite, and only kinases with at least five substrates available were further considered; iii) inference of kinase activity using IKAP, a heuristic framework for inference of kinase activity based on known substrates28. Since IKAP is based on a gradient descent optimization algorithm, the simulation could get stuck in a local minimum. To overcome this, we repeated the simulation for 10 times, assessed the solution’s variation, and filtered kinase activity estimations that failed to converge to a stable solution; iv) The resulting inferred kinase activity was further analyzed by ANOVA (p<0.05) to identify kinases with differential activity across treatment conditions.
Flow Cytometry
A FACSCanto II and FACSSymphony A5 (BD Biosciences) instruments were used to acquire flow cytometry data, which was analyzed using FlowJo v10 (BD Biosciences). For surface staining, 3x10⁵ cells were washed with and stained in PBS (Lonza) with 1% FBS (GE Healthcare). For all experiments, matched isotypes or known negatives (e.g., NT T cells) served as gating controls. CAR detection was performed using F(ab’)2 fragment-specific antibody (B7-H3 and EphA2 CAR: anti human F(ab’)2 (polyclonal, Jackson ImmunoResearch, West Grove, PA, USA). T cells were stained with fluorochrome-conjugated antibodies using combinations of the following markers: CD4 (clone SK3, BD Biosciences), CD8 (clone SK1, BD Biosciences), CCR7 (clone 2-L1-A, BD Biosciences), CD45RA (clone HI100, BD Biosciences), CD3 (clone UCHT1, BD Biosciences), and CD45 (clone HI30, BD Biosciences). Tumor cell lines were evaluated for expression of B7-H3 using B7-H3 antibody (clone 7-517, BD Biosciences, or clone FM276, Miltenyi).
Intracellular Staining:
Intracellular staining to detect pSTAT was performed using BD Phosflow Protocol III. Briefly, 1x10⁶ T cells were lysed/fixed with 1X Lyse/Fix Buffer (BD Biosciences) for 12 minutes at 37°C. Cells were washed with PBS + 1% FBS, then permeabilized with pre-chilled Perm Buffer III (BD Biosciences). Cells were then washed three times before staining with antibodies against pSTAT5 (clone 47, BD Biosciences), pSTAT3 (clone 4/P, BD Biosciences), or pSTAT4 (clone 38, BD Biosciences).
Sorting:
For in vivo studies, cells were sorted on a BD FACS Aria III cell sorter (BD Biosciences). Cells were stained for CAR expression and mClover was used for detection of ZipR-transduced cells. DAPI (4’,6-diamidino-2-phenylindole, Thermo Fisher) was used as a viability indicator. Post sorting, cells were cultured for 48 to 72 hours in RPMI containing 20% FBS, 25 μg/mL gentamicin (Gibco), 1X penicillin–streptomycin (Gibco), and 1.5 μg/mL amphotericin B (Gibco) prior to in vivo studies. For the scRNAseq studies, CAR T cells were sorted based on CAR and mClover expression before stimulation, or based on CD3 and mClover expression after tumor stimulation.
Cytokine starvation and assessment of autonomous growth
To measure cell survival after 7 to 21 days of cytokine withdrawal, 1×10⁶ cells were plated in 1 mL complete RPMI without cytokines in tissue culture treated 48-well plates. After 7-21 days, cells were collected and stained for flow cytometry. To determine apoptosis, cells were labeled with annexin V (BD Biosciences) and eBioscience Fixable viability dye (Invitrogen). For experiments with ruxolitinib, cytokine starved T cells were exposed to indicated concentrations of ruxolinitib (Selleckchem) for 24 hours or every 48 hours for apoptosis assays. To assess the autonomous growth potential of ZipR T cells, 1.5x10⁷ Zip2R, Zip7R or NT T cells were seeded in G-REX 6-well plates (Wilson Wolf, Saint Paul, MN) in 30 mL complete RPMI. Limiting-diluted Jurkat cells were also seeded at 1 cell, 10 cells, and 100 cells/well/30 mL as positive controls. Cells were resuspended and counted weekly.
MTS assay
A CellTiter96 AQueous One Solution Cell Proliferation Assay (Promega) was utilized to assess CAR T-cell cytotoxicity. In a tissue culture-treated 96-well plate, 3,000 A549 or 20,000 LM7 cells were cocultured with serial dilutions of CAR T cells. Media only and tumor cells alone served as controls. Each condition was plated in technical triplicates. After 24 hours, the media and T cells were removed by gently pipetting up and down to avoid disrupting adherent tumor cells. CellTiter96 AQueous One Solution Reagent (phenazine ethosulfate) in complete RPMI was added to each well and incubated at 37°C for 2 hours. The absorbance at 492 nm was measured using an Infinite 200 Pro MPlex plate reader (Tecan) to quantify the viable cells in each well. Percent live tumor cells were determined by the following formula: (sample-media only)/(tumor alone-media only) × 100.
Repeat stimulation assay
1×10⁶ T cells were cocultured in complete RPMI with 5×10⁵ tumor cells in a 24-well tissue culture-treated plate. Cells were fed with fresh complete RPMI and split as needed. After 7 days, T cells were harvested, counted, and replated at the same ratio with fresh tumor cells as long as they had killed tumor cells, as determined by microscopic inspection.
Measurement of cytokine production
Cell culture supernatant was collected 24 hours after plating T cells with tumor cells for analysis of cytokine production. Cytokine production was assessed by a 13-plex human cytokine quantification kit (Millipore Sigma). Analysis was performed using a Luminex FLEXMAP 3D instrument and software (Luminex Corporation).
Xenograft mouse models
All animal experiments were approved by the St. Jude Children’s Research Hospital Institutional Animal Care and Use Committee. Xenograft experiments were performed with 6- to 10-week-old male and female NSG mice obtained from St. Jude Children’s Research Hospital NSG colony. A549 model: Mice were injected intravenously (i.v.) with 2×10⁶ A549.GFP.ffluc cells in sterile PBS. On day 7, mice received a single i.v. dose of 3×10⁵ B7-H3-CAR or B7-H3-CAR.ZipR T cells in sterile PBS. Injection of sterile PBS was used as a control. Tumor growth was monitored by weekly bioluminescence imaging and mice were euthanized when BLI measurements reached >1x10¹⁰ or when they met physical euthanasia criteria (significant weight loss, signs of distress), or when recommended by veterinary staff.
Ruxolitinib administration:
Seven days post T cell injection, ruxolitinib was administered ad libitum in modified rodent chow (Incyte) at a dose of 60 mg/kg/day until day 28.
A673 model:
Mice received subcutaneous (s.c.) injection of 2×10⁶ A673 cells in Matrigel (Corning) in the right flank. On day 7, mice received a single i.v. dose of EphA2-CAR or T cells via tail vein injection. Tumor growth was measured by weekly caliper measurements. Mice were euthanized when they met physical euthanasia criteria (significant weight loss, signs of distress), when the tumor burden reached 20% of total body mass (≥4,000 mm3), or when recommended by veterinary staff.
Pathological examinations
Tissues were fixed in 10% neutral buffered formalin, embedded in paraffin, and sectioned at 5 mm, mounted on positively charged glass slides (Superfrost Plus; Thermo Fisher), and dried at 60°C for 20 min before dewaxing and staining with hematoxylin and eosin (H&E) using standard methods. For immunohistochemical staining, tissue sections underwent antigen retrieval in a prediluted Cell Conditioning Solution (CC1) (Ventana Medical Systems) for 30 min. The following primary antibodies were used: anti-CD3-H (1:25 dilution, Cat # CME324B; Biocare Medical); and anti-CD276 (1:200, Cat # AP1027; R&D Systems); and anti-NUMA1 (1:75, Cat # LS-B11047; Lifespan Biosciences). The OmniMap anti-rabbit HRP kit (Ventana Medical Systems) was used to detect CD3-H, CD276, and NUMA1 labeling. ChromoMap DAB (Fisher Scientific) was the chromogen for CD3, CD276, and NUMA1. All sections were examined by a pathologist blinded to the experimental group assignments (author P.V.).
Bioluminescence imaging
Mice were injected intraperitoneally (i.p.) with 150 mg/kg of d-luciferin 5 to 10 minutes before imaging, anesthetized with isoflurane, and imaged with a Xenogen IVIS-200 imaging system. The photons emitted from the luciferase-expressing cells were quantified using Living Image software (Caliper Life Sciences). Mice were imaged at least once per week to track either T cells (B7-H3-CAR.Zip7R T cell experiments) or tumor burden (A549.GFP.ffluc).
scRNAseq sample preparation and data analysis
In vivo:
1×10⁶ FACS purified CAR or CAR.Zip2R T cells were injected i.v. into A549 bearing mice. At day 11 post tumor cell injection, lungs were harvested, prepared into single cell suspensions by mechanical and enzymatic digestion, and CAR or CAR.Zip2R T cells were isolated by FACS. T cells from 4 mice were pooled for analysis by scRNAseq.
In vitro:
CAR or CAR.ZipR T cells were collected and FACS purified before or after 3 stimulations with A673 tumor cells.
Library preparation:
The samples were centrifuged at 2,000 rpm for 5 min, and cells were resuspended in PBS (Thermo Fisher Scientific) plus 0.04% BSA (Amresco) with final a concentration of 1x10⁶ cells/mL and viability more than 98%. Single-cell suspensions were loaded onto a Chromium Controller according to their respective cell counts to generate 10,000 single cell gel beads in emulsion per sample. Each sample was loaded into a separate channel. The libraries were prepared using the Chromium Next GEM Single Cell 5’ v2 (Dual index) and Gel Bead Kit (10x Genomics). The cDNA was amplified (13 cycles), after which cDNA was used for preparation of a gene expression library. The cDNA content of each sample and libraries were quality-checked using a high-sensitivity DNA chip with a 2100 Bioanalyzer (Agilent Technologies). The 5’ libraries were sequenced on NovaSeq (Illumina) with paired-end reads of 26 cycles for read 1 and 90 cycles for read 2. An average of 500,000,000 reads per samples were obtained for gene expression library (> 50,000 reads per cell).
Data preprocessing:
The Cell Ranger v7.1.0 Single-Cell software suite (10x Genomics) was used to process the scRNA-seq FASTQ files. The ‘cellranger count’ command was performed to align the raw FASTQ files to the GRCh38 human reference genome and summarize the data into matrices that describe gene read counts per cell. The filtered matrices from the Cell Ranger outputs served as input to the downstream pipeline analyses.
For gene expression sequencing, the filtered count matrices were read into the R package Seurat (v4.3.0)67. Within each dataset, the processing pipeline was as follows: Samples were merged into a single Seurat object for consistent filtering, and features detected in fewer than 3 cells were removed from the dataset. Feature count and unique molecular identifier (UMI) count distributions were then visually inspected to determine appropriate cutoffs for each dataset. Cells with abnormally low features or UMI counts, or high mitochondrial read percentages (potentially dead or damaged cells) were removed. For profiling CAR T cells from the in vivo condition, a total of 1,032 cells were retained with an average of 22,139.58 genes per cell (UMI, median: 18,457.5; range: 512-71,727). For the in vitro samples, a total of 93,561 cells were retained with an average of 17,810.84 genes per cell (UMI, median: 13,745; range: 500-79,934). After quality control, libraries were normalized with NormalizeData function in Seurat R package with 1x10⁶ as the scale factor.
Cluster annotation and data visualization:
Normalized and filtered data were processed using the standard Seurat pipeline. After normalization, the top 2,000 variable genes were selected using the “vst” method in Seurat’s FindVariableFeatures function, and all the genes in the dataset were scaled using the ScaleData function. Principal Component Analysis (PCA) was then run on the variable features. The first 30 principal components (PCs) were used for the downstream K-Nearest Neighbors (KNN) and dimensionality reduction steps. Uniform Manifold Approximation and Projection (UMAP) dimensionality reduction was used as the visualization method, and Seurat’s FindClusters function was used to separate cells into unsupervised clusters, which were subsequently annotated into cell types. The object covering all cells was subsetted into CD4- and CD8-specific subtypes on the basis of expression of canonical gene markers. Specifically, CD4 and CD8 T cells were initially distinguished by CD4 and CD8A gene expression, then memory-like T cell subtype was defined using the marker gene SELL, TCF1, CCR7, LEF1, and AQP3, effector-like T cell subtype was defined using marker genes CX3CR1, GZMK, GZMH, CCL4, PRF1, GNLY, and NKG7, and exhaustion-like T cells were defined using marker genes TOX, PDCD1, TIM3, TIGIT, and RFS16. Curated violin plots or genes on UMAP that represent the expression level of genes were generated using the VlnPlot and FeaturePlot functions in Seurat. scRNAseq data will be deposited to the European Genome-phenome Archive (EGA) once the manuscript is accepted for publication.
Statistical analysis
For all experiments, the number of biological replicates and statistical analysis used are described in the figure legends. BLI data was log-transformed before analysis. For comparisons between two groups, a two-tailed t-test was used. For comparisons of three or more groups, analysis of variance (ANOVA) with Dunnett or Tukey post-test was used. Survival was assessed by the log-rank test with Bonferroni adjustment for multiple comparisons. Statistical analyses were conducted with GraphPad Prism software (GraphPad Software, San Diego, CA).
Extended Data
Extended Data Figure 1: Zip2R colocalization analysis by confocal microscopy.
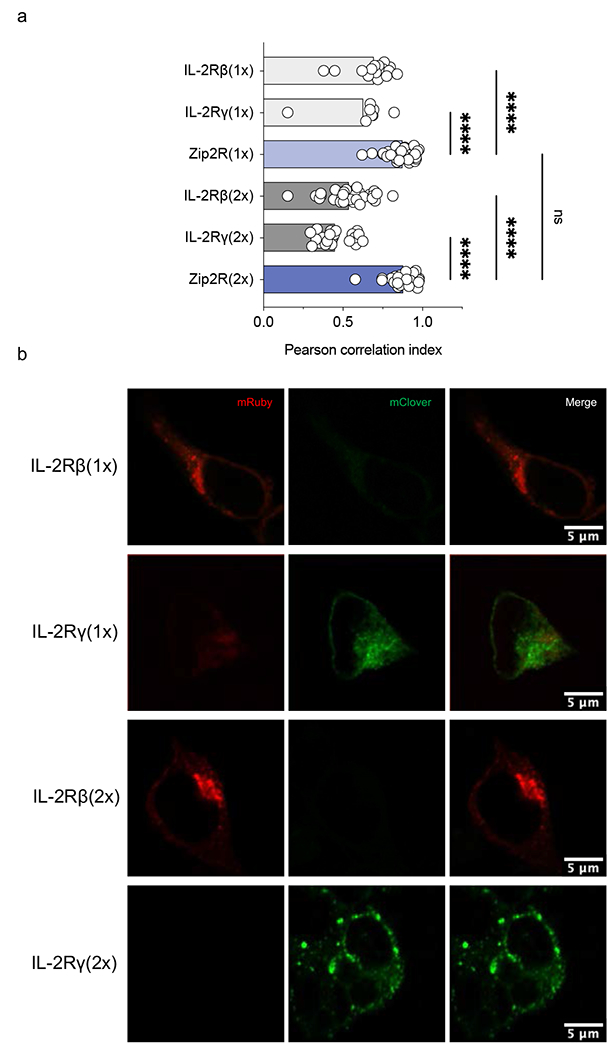
(a) Pearson correlation analysis of mRuby and mClover in HEK293T cells transfected with indicated constructs (N=8-37, ****p<0.0001, one-way ANOVA). (b) Representative images.
Extended Data Figure 2: Zip2R(2x) subcellular localization and trafficking determined by confocal microscopy.
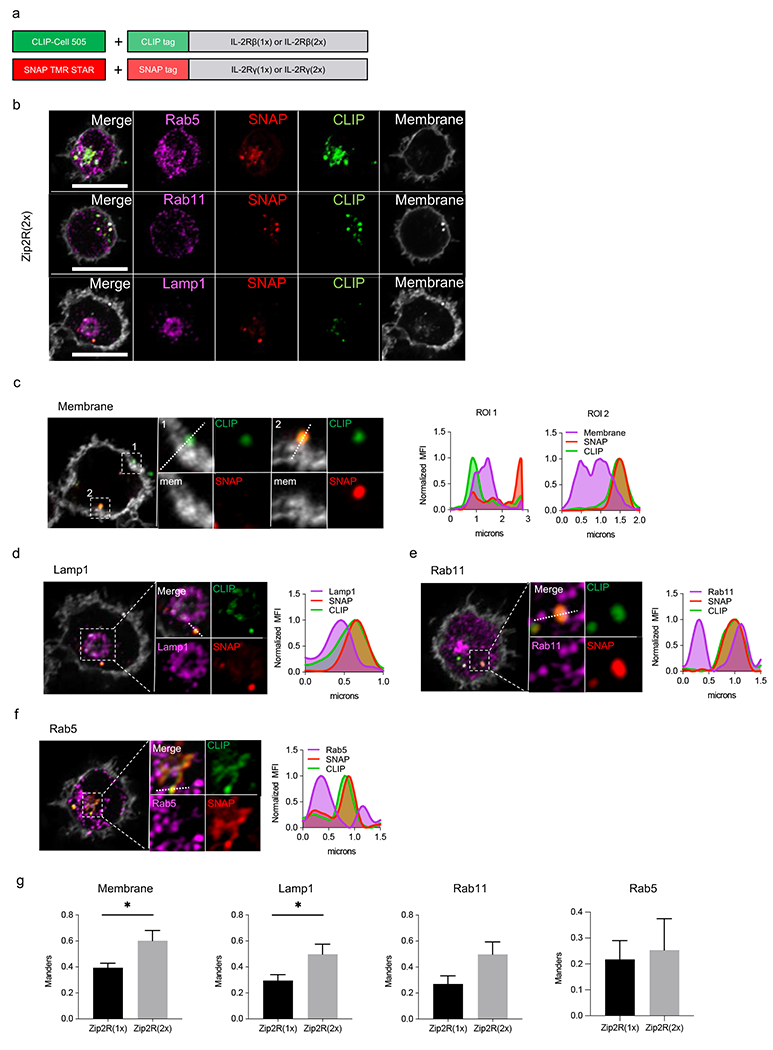
(a) Schematic of SNAP/CLIP tag system. (b) Representative images of Zip2R(2x) with endosomal markers. Scale bar = 10μm. (c-f) Representative images of Zip2R(2x) colocalization with (c) cell membrane, (d) Lamp1, (e) Rab11, and (f) Rab5. (g) Comparison of Zip2R(2x) and Zip2R(1x) colocalization with indicated subcellular markers (N=4-14, *p<0.05, t test).
Extended Data Figure 3: ZipR signaling is inhibited by ruxolitinib.
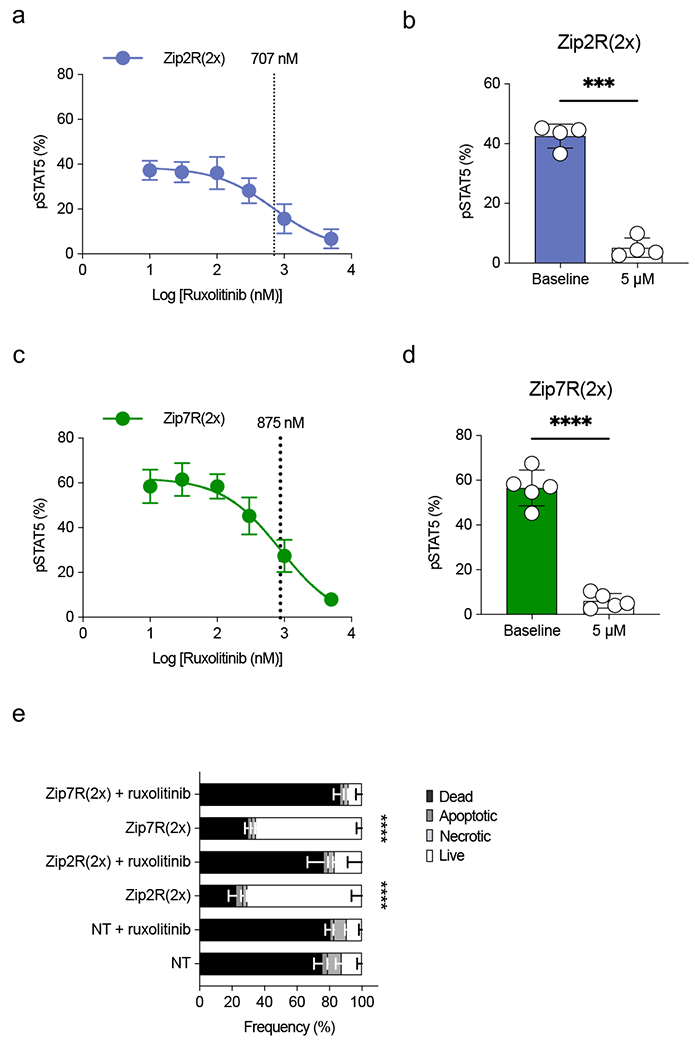
(a) pSTAT5 expression in Zip2R(2x) transduced T cells treated with increasing concentrations of ruxolitinib. IC50 is indicated with a dashed line (N=3, mean±SD). (b) pSTAT5 expression in Zip2R(2x) transduced T cells at baseline or following 24-hour incubation with 5 μM ruxolitinib (mean±SD, ***p<0.001, paired t-test). (c) pSTAT5 expression in Zip7R(2x) transduced T cells treated with increasing concentrations of ruxolitinib. IC50 is indicated with a dashed line (N=3, mean±SD). (d) pSTAT5 expression in Zip7R(2x) transduced T cells at baseline or following 24-hour incubation with 5 μM ruxolitinib (mean±SD, ***p<0.001, paired t-test). (e) Viability of untreated or 5 μM ruxolitinib-treated T cells after 7 days of cytokine starvation (Dead : Viability dye+ Annexin V+; Apoptotic : Viability dye− Annexin V+; Necrotic : Viability dye+ Annexin V−; Live: Viability dye− Annexin V−) (N=3, mean±SD, ****p<0.0001, two-way ANOVA with Bonferroni’s multiple comparisons test for live T cells).
Extended Data Figure 4: ZipRs augment CAR T cell antitumor activity against LM7 osteosarcoma without altering antigen specificity.
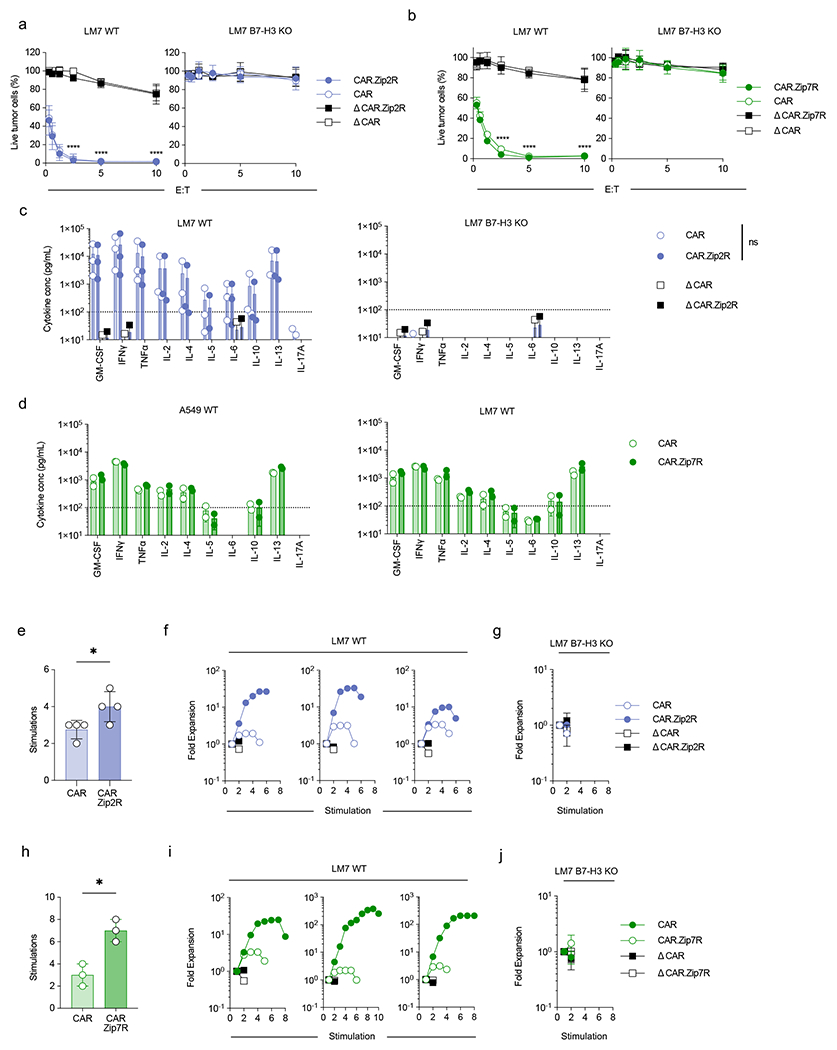
(a,b) MTS assay after 24-hour co-culture of LM7 WT (left) or LM7 B7-H3 KO (right) cells with CAR T cells at indicated effector:target cell (E:T) ratios (N=3-4 biological replicates, mean±SD, ****p<0.0001, two-way ANOVA with Tukey’s multiple comparisons test). (c) Cytokine production after 24-hour co-culture of LM7 WT (left) or LM7 B7-H3 KO (right) cells with CAR or CAR.Zip2R T cells at a 2:1 E:T measured by multiplex analysis (N=2-3 biological replicates, mean±SD, two-way ANOVA with Tukey’s multiple comparisons test). (d) Cytokine production after 24-hour co-culture of A549 WT (left) or LM7 WT (right) cells with CAR or CAR.Zip7R T cells at a 2:1 E:T measured by multiplex analysis (N=2 biological replicates, mean±SD). (e) Number of stimulations in 7 day repeat stimulation assay with LM7 WT cells and CAR T cells at 2:1 E:T (mean±SD, *p<0.05, paired t-test). (f) Fold expansion of three representative donors used in repeat stimulation assays with LM7 WT cells. Data represented in (a). (g) Repeat stimulation assay with LM7 B7-H3 KO cells and CAR T cells at 2:1 E:T (N=4, mean±SD). (h) Stimulations of tumor cell killing in 7-day repeat stimulation assay with LM7 WT cells and CAR T cells at 2:1 E:T (mean±SD, *p<0.05, paired t-test). (i) Fold expansion of three representative donors used in repeat stimulation assays with LM7 WT cells. Data represented in (d). (j) Repeat stimulation assay with LM7 B7-H3 KO cells and CAR T cells at 2:1 E:T (N=3 biological replicates, mean±SD).
Extended Data Figure 5: Phenotypic analysis of B7-H3-CAR T cells following stimulation with A549 WT.
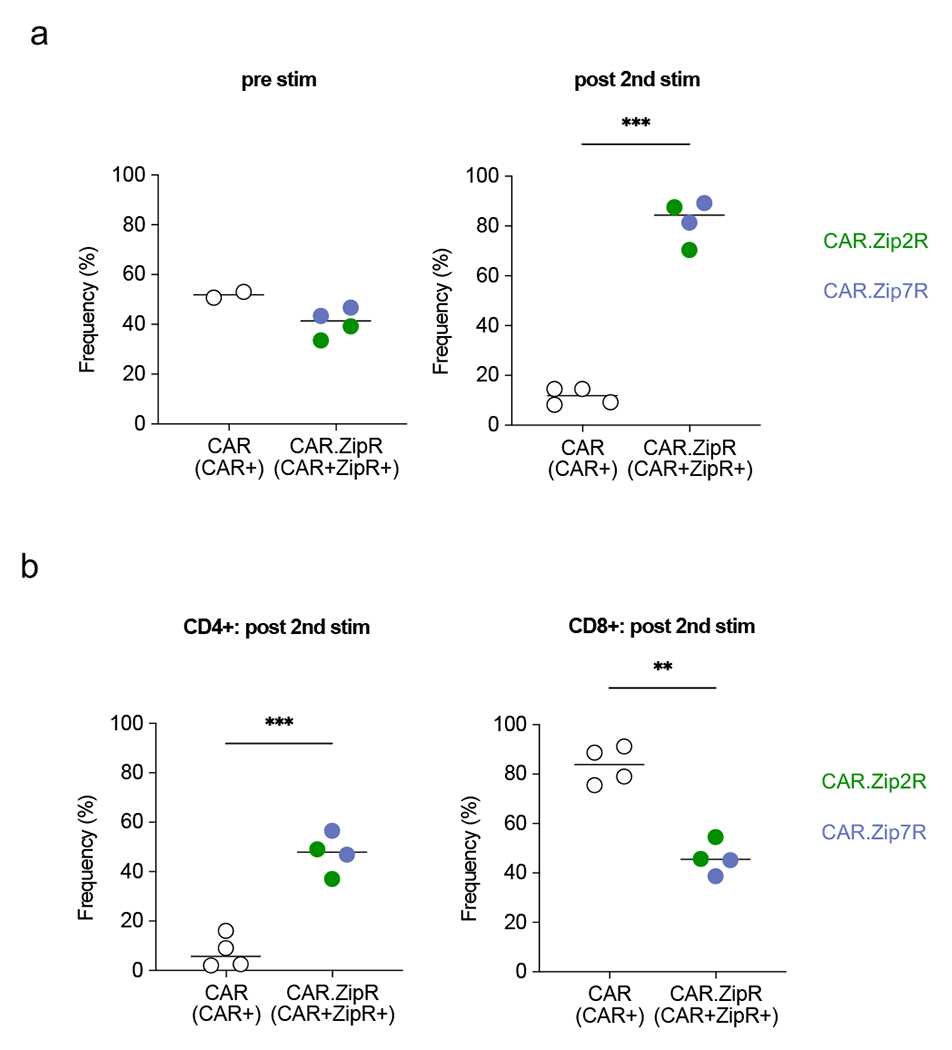
B7-H3-CAR+, CAR+Zip2R+, or CAR+Zip7R+ T cells were stimulated twice with A549 WT. CAR positive or CAR and ZipR positive T cells were quantified by flow cytometry pre and post 2nd stimulation (stim) and CD4 and CD8 positive T cells post 2nd stim (N=2 donors).
(a) Percent CAR+ or CAR+ZipR+ cells pre and post 2nd stim (ns: nonsignificant, ***p<0.001, paired t-test). (b) Percent CD4+ (left panel) or CD8+ (right panel) cells post 2nd stimulation (**p<0.01, ***p<0.001, paired t-test).
Extended Data Figure 6: Zip2R and Zip7R augment EphA2-CAR T cell antitumor activity in vitro.
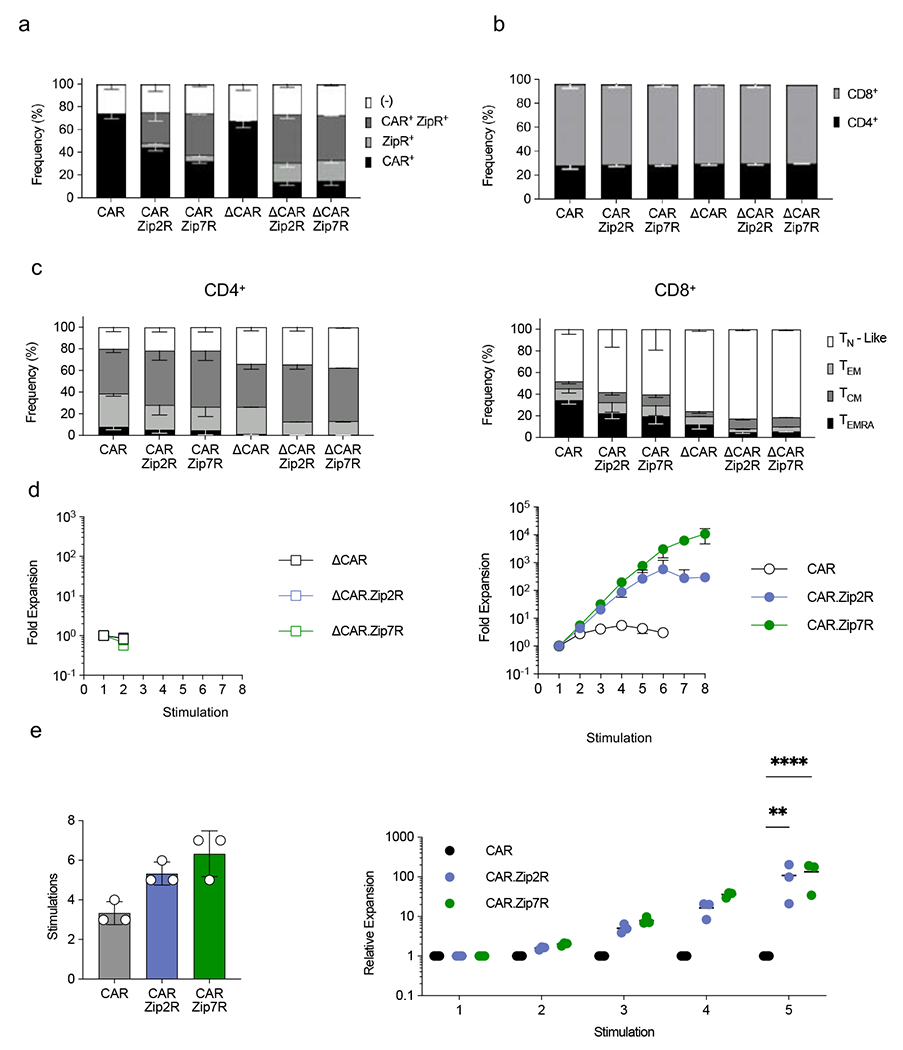
(a) Transduction efficiency of EphA2-CAR, EphA2-CAR.Zip2R, and EphA2-CAR.Zip7R T cells (N=3, mean±SD). (b) Frequency of CD4+ and CD8+ T cells transduced with indicated constructs (N=3, mean±SD). (c) Immunophenotype of CD4+ (left) or CD8+ (right) T cells with indicated constructs (TN-Like: CCR7+ CD45RA+, TEM: CCR7− CD45RA−, TCM: CCR7+ CD45RA−, TEMRA: CCR7− CD45RA+, N=3, mean±SD). (d) Fold expansion of ΔCAR (left) or CAR (right) T cells stimulated with A673 cells every 7 days (N=3, mean±SD). (e) Rounds of stimulation (left) and relative expansion compared to CAR (right) in repeat stimulation assays with A673 cells (N=3, mean±SD, **p<0.01, ****p<0.0001, two-way ANOVA with Tukey’s multiple comparisons test).
Extended Data Figure 7: Zip2R augments the antitumor activity of EphA2-CAR in the A673 model.
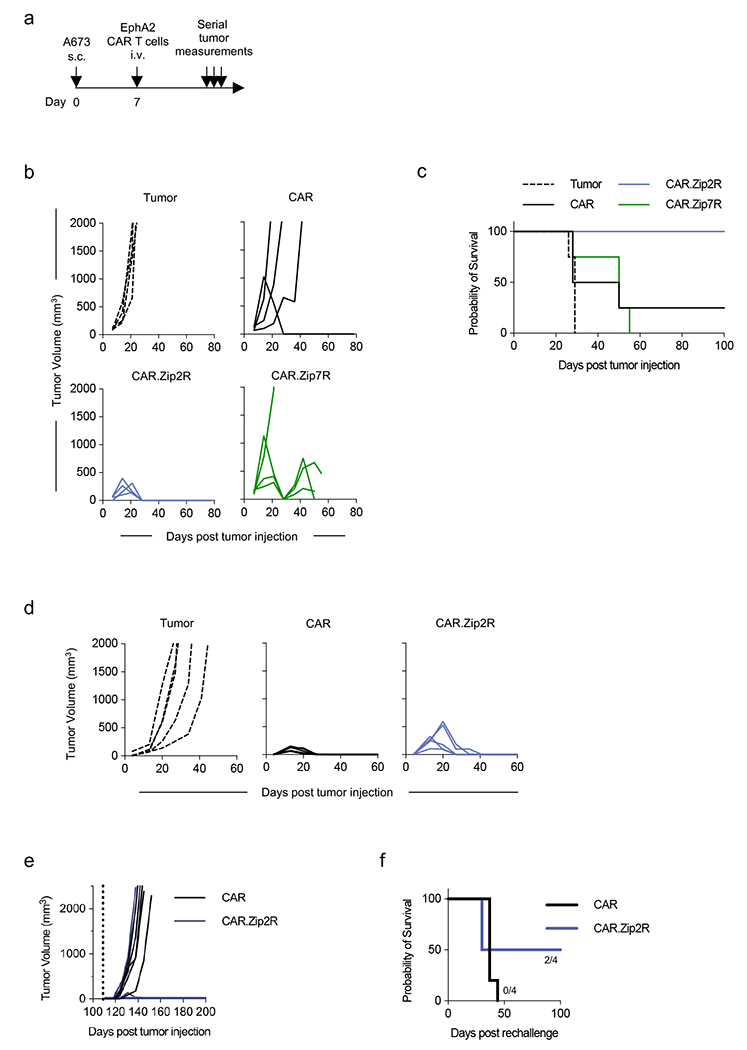
(a) Experimental scheme of s.c. A673 model; mice received a single i.v. dose of 1×10⁶ CAR T cells on day 7 post tumor cell injection. (b) Tumor volume of mice treated with indicated constructs (N=4; donor 1). (c) Kaplan-Meier survival curve (*p<0.05, log-rank test). (d) Tumor volume of mice treated with indicated constructs (N=5; donor 2). (e) Tumor volume following rechallenge (dashed line) with A673 WT cells on the contralateral flank (N=4-5; tumor rejection: CAR: 0/5; CAR.Zip2R: 2/4). (f) Kaplan Meier survival following rechallenge.
Extended Data Figure 8: Analysis of B7-H3-CAR.Zip7R T cell toxicity in vivo.
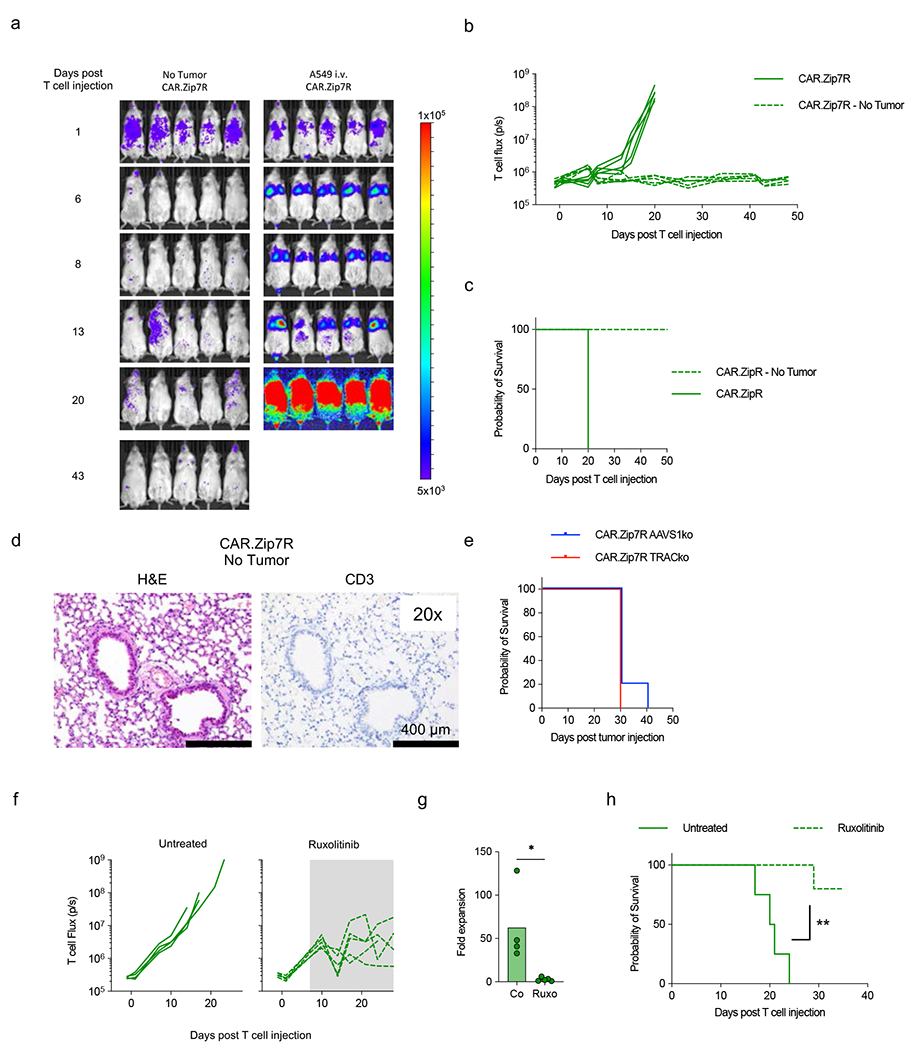
(a-d) Mice received a single i.v. dose of 3×10⁵ B7-H3.CAR.Zip7R.ffLuc T cells on day 7 post A549 cell injection; non-tumor bearing mice served as a control (N=5 per group). (a) Serial bioluminescence images. (b) Quantification of bioluminescence. (c) Kaplan-Meier survival (N=5). (d) Representative IHC of lung in non-tumor bearing mice treated with CAR.Zip7R T cells at day 48 post T cell injection. (e) Kaplan-Meier survival of A549-tumor bearing mice post i.v. injection of 3×10⁵ B7-H3-CAR.Zip7R control (AAVS1ko) or T cell receptor (TRACko) KO T cells (N=5). (f) A549 bearing mice received CAR.Zip7R.ffLuc T cells and on day 7 ruxolitinib was started (shaded area) in ½ of the mice (untreated: n=5; treated: n=5). Quantification of CAR.Zip7R.ffLuc T cell bioluminescence in untreated or ruxolitinib chow-treated mice. (g) Fold expansion on day 7 post start of ruxolitinb treatment (N=4-5, *p<0.05, Mann-Whitney U test). (h) Kaplan-Meier survival (N=4-5, **p<0.001, log rank test).
Extended Data Figure 9: Immunophenotype and antigen specificity of CAR.Zip21R or CAR.Zip12R T cells.
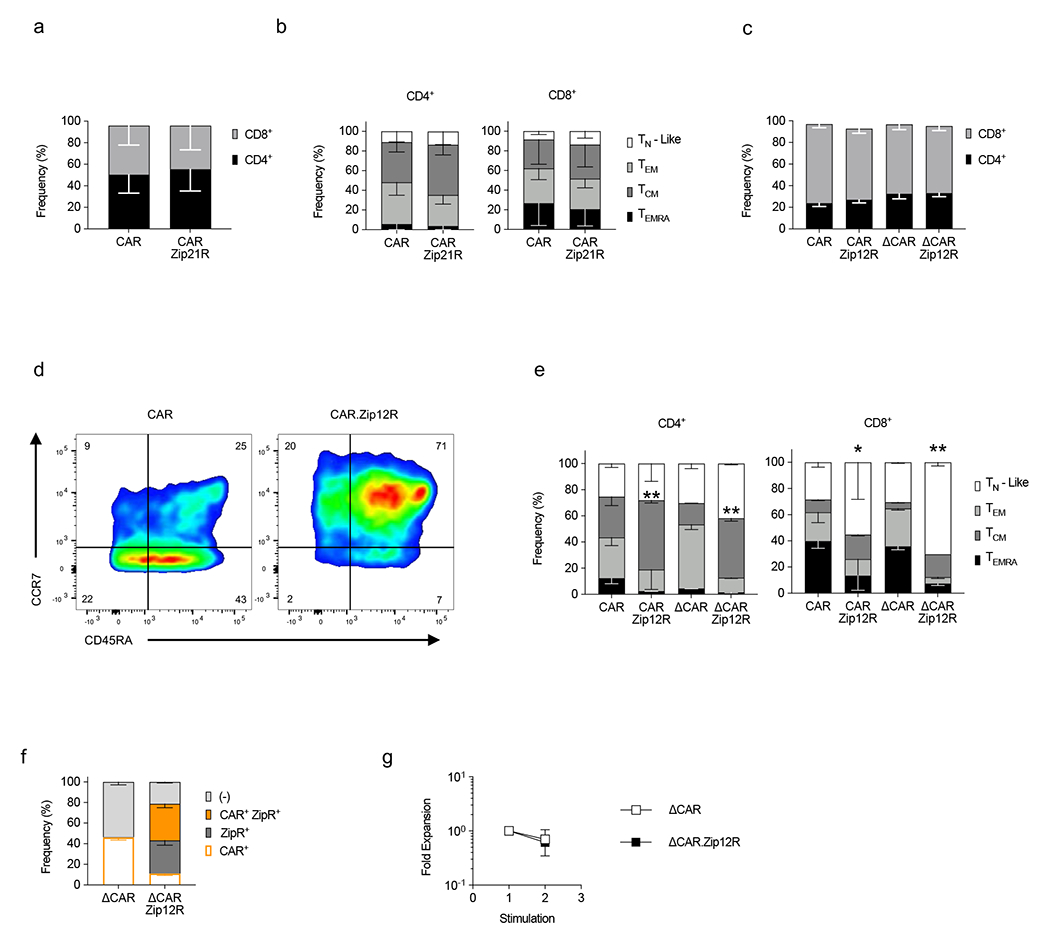
(a) Frequency of CD4+ and CD8+ CAR and CAR.Zip21R T cells (N=4, mean±SD). (b) Immunophenotype of CD4+ (left) or CD8+ (right) T cells ((TN-Like : CCR7+ CD45RA+, TEM : CCR7− CD45RA−, TCM : CCR7+ CD45RA−, TEMRA : CCR7− CD45RA+, N=4, mean±SD). (c) Frequency of CD4+ and CD8+ CAR and CAR.Zip12R T cells (N=2-3, mean±SD). (d) Representative flow cytometry plots. (e) Immunophenotype of CD4+ (left) and CD8+ (right) T cells (N=2-3, mean±SD). (f) Transduction efficiency of ΔCAR and ΔCAR.Zip12R T cells (N=2, mean±SD). (g) Fold expansion of ΔCAR and ΔCAR.Zip12R T cells stimulated with A549 WT cells every seven days (N=2, mean ± SD).
Extended Data Figure 10: Transcriptomic analysis of CD4+ CAR.ZipR T cells by scRNAseq.
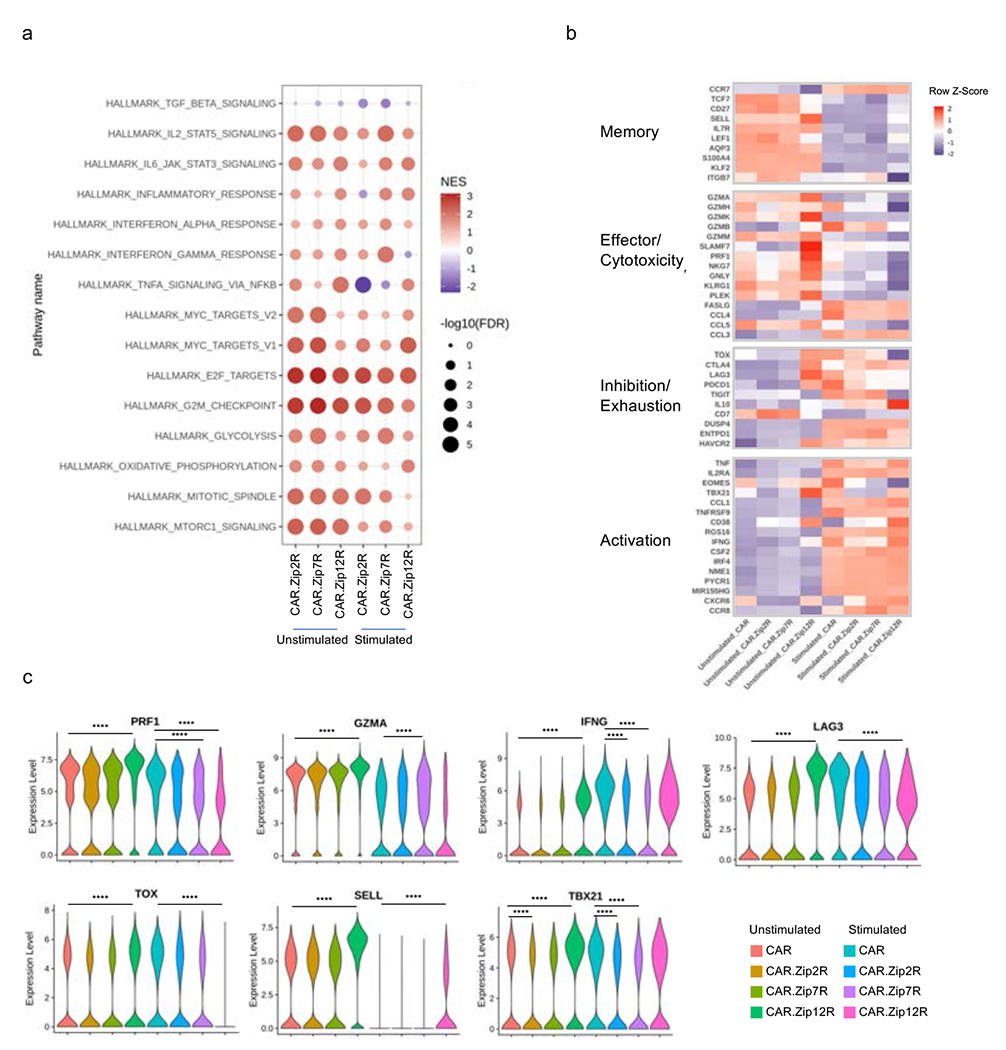
(a) GSEA of unstimulated or stimulated CD4+ CAR and CAR.ZipR T cell populations. (b) Expression of memory, effector/cytotoxicity, inhibition/exhaustion, and activation markers in unstimulated or stimulated CD4+ CAR and CAR.ZipR T cell populations. (c) Expression of selected genes in unstimulated or stimulated CD4+ CAR and CAR.ZipR T cell populations (Wilcoxon rank sum test with Bonferroni correction; ****adjusted p value < 0.0001 and log2 FC > 0.5 or < −0.5).
Supplementary Material
Acknowledgements
The authors thank Jennifer McCommon and Amanda George (St. Jude Animal Resource Center) and Carmen Coleman (St. Jude Center for In Vivo Imaging and Therapeutics) for assistance with the in vivo mouse studies. We thank Qingfei Pan for assistance with bioinformatics and figure design. We also thank Kim Nichols and Sabrin Albeituni for helpful discussion on the use of ruxolitinib. Animal imaging was performed by the St. Jude Center for In Vivo Imaging and Therapeutics, which is supported by St. Jude Children’s Research Hospital and the National Institutes of Health (NIH; P30 CA021765). We thank the Computational Structural Biology Center (CSBC) in the Department of Structural Biology for support. Cellular images were acquired at the St. Jude Cell and Tissue Imaging Center, which is supported by St. Jude Children’s Research Hospital and the National Cancer Institute (NCI; P30 CA021765). This work was supported by NCI grant F31CA250401-01A1 to M.B., grants R01NS121249 and R01NS122859 to G.K., and the American Lebanese Syrian Associated Charities (ALSAC) to J.Y., J.P., M.M.B., G.K., and S.G. The content is solely the responsibility of the authors and does not necessarily represent the official views of the NIH. The schematic shown in Figure 1a was created with BioRender (Biorender.com), for which we have a license.
Footnotes
Conflict of Interest
M.B., B.I.S., A.A.A., M.M.B., G.K., and S.G. are co-inventors on a patent application for the developed ZipReceptor technology. S.L., A.A.A, G.K. and S.G. are co-inventors on patent applications in the fields of cell or gene therapy for cancer. M.H. is an inventor on international patent application no. PCT/US2019/045338 assigned to the NIH, “High affinity monoclonal antibodies targeting glypican-2 and uses thereof”. H.C. is a consultant of Kumquat Biosciences, Inc. S.G. is a consultant of TESSA Therapeutics, a member of the Data and Safety Monitoring Board (DSMB) of Immatics, and has received honoraria from Tidal, Catamaran Bio, Sanofi, and Novartis within the last 2 years.
Code availability
The code used to analyse the cluster size of colocalized Zip receptors can be accessed in the AutomatedImageAnalysis repository at https://github.com/Jorge-Ibanez-StJude/AutomatedImageAnalysis.
Data availability
The RNA-seq data files are available through Synapse (https://www.synapse.org/#!Synapse:syn52457643). The raw and analysed datasets generated during the study are available for research purposes from the corresponding authors on reasonable request. Source data are provided with this paper.
REFERENCES
- 1.Maude SL et al. Tisagenlecleucel in Children and Young Adults with B-Cell Lymphoblastic Leukemia. N Engl J Med 378, 439–448 (2018). 10.1056/NEJMoa1709866 [DOI] [PMC free article] [PubMed] [Google Scholar]
- 2.Melenhorst JJ et al. Decade-long leukaemia remissions with persistence of CD4(+) CAR T cells. Nature 602, 503–509 (2022). 10.1038/s41586-021-04390-6 [DOI] [PMC free article] [PubMed] [Google Scholar]
- 3.Heczey A et al. CAR T Cells Administered in Combination with Lymphodepletion and PD-1 Inhibition to Patients with Neuroblastoma. Mol Ther 25, 2214–2224 (2017). 10.1016/j.ymthe.2017.05.012 [DOI] [PMC free article] [PubMed] [Google Scholar]
- 4.Lamers CH, Klaver Y, Gratama JW, Sleijfer S & Debets R Treatment of metastatic renal cell carcinoma (mRCC) with CAIX CAR-engineered T-cells-a completed study overview. Biochem Soc Trans 44, 951–959 (2016). 10.1042/BST20160037 [DOI] [PubMed] [Google Scholar]
- 5.Adusumilli PS et al. A Phase I Trial of Regional Mesothelin-Targeted CAR T-cell Therapy in Patients with Malignant Pleural Disease, in Combination with the Anti-PD-1 Agent Pembrolizumab. Cancer Discov 11,2748–2763 (2021). 10.1158/2159-8290.Cd-21-0407 [DOI] [PMC free article] [PubMed] [Google Scholar]
- 6.Qi C et al. Claudin18.2-specific CAR T cells in gastrointestinal cancers: phase 1 trial interim results. Nat Med 28, 1189–1198 (2022). 10.1038/s41591-022-01800-8 [DOI] [PMC free article] [PubMed] [Google Scholar]
- 7.Heczey A et al. Anti-GD2 CAR-NKT cells in relapsed or refractory neuroblastoma: updated phase 1 trial interim results. Nature Medicine (2023). 10.1038/s41591-023-02363-y [DOI] [PubMed] [Google Scholar]
- 8.Del Bufalo F et al. GD2-CART01 for Relapsed or Refractory High-Risk Neuroblastoma. N Engl J Med 388, 1284–1295 (2023). 10.1056/NEJMoa2210859 [DOI] [PubMed] [Google Scholar]
- 9.Markley JC & Sadelain M IL-7 and IL-21 are superior to IL-2 and IL-15 in promoting human T cell-mediated rejection of systemic lymphoma in immunodeficient mice. Blood 115, 3508–3519 (2010). 10.1182/blood-2009-09-241398 [DOI] [PMC free article] [PubMed] [Google Scholar]
- 10.Koneru M, Purdon TJ, Spriggs D, Koneru S & Brentjens RJ IL-12 secreting tumor-targeted chimeric antigen receptor T cells eradicate ovarian tumors in vivo. Oncoimmunology 4, e994446 (2015). 10.4161/2162402X.2014.994446 [DOI] [PMC free article] [PubMed] [Google Scholar]
- 11.Krenciute G et al. Transgenic Expression of IL15 Improves Antiglioma Activity of IL13Ralpha2-CAR T Cells but Results in Antigen Loss Variants. Cancer Immunol Res 5, 571–581 (2017). 10.1158/2326-6066.CIR-16-0376 [DOI] [PMC free article] [PubMed] [Google Scholar]
- 12.Batra SA et al. Glypican-3-Specific CAR T Cells Coexpressing IL15 and IL21 Have Superior Expansion and Antitumor Activity against Hepatocellular Carcinoma. Cancer Immunol Res 8, 309–320 (2020). 10.1158/2326-6066.CIR-19-0293 [DOI] [PMC free article] [PubMed] [Google Scholar]
- 13.Chmielewski M & Abken H CAR T Cells Releasing IL-18 Convert to T-Bet(high) FoxO1(low) Effectors that Exhibit Augmented Activity against Advanced Solid Tumors. Cell Rep 21, 3205–3219 (2017). 10.1016/j.celrep.2017.11.063 [DOI] [PubMed] [Google Scholar]
- 14.Ma X et al. Interleukin-23 engineering improves CAR T cell function in solid tumors. Nat Biotechnol 38, 448–459 (2020). 10.1038/s41587-019-0398-2 [DOI] [PMC free article] [PubMed] [Google Scholar]
- 15.Stach M et al. Inducible secretion of IL-21 augments anti-tumor activity of piggyBac-manufactured chimeric antigen receptor T cells. Cytotherapy 22, 744–754 (2020). 10.1016/j.jcyt.2020.08.005 [DOI] [PubMed] [Google Scholar]
- 16.Heczey A et al. Anti-GD2 CAR-NKT cells in patients with relapsed or refractory neuroblastoma: an interim analysis. Nat Med 26, 1686–1690 (2020). 10.1038/s41591-020-1074-2 [DOI] [PubMed] [Google Scholar]
- 17.O’Cearbhaill RE et al. A phase I clinical trial of autologous chimeric antigen receptor (CAR) T cells genetically engineered to secrete IL-12 and to target the MUC16ecto antigen in patients (pts) with MUC16ecto+recurrent high-grade serous ovarian cancer (HGSOC). Gynecologic Oncology 159, 42–42 (2020). [Google Scholar]
- 18.Zhang L et al. Tumor-infiltrating lymphocytes genetically engineered with an inducible gene encoding interleukin-12 for the immunotherapy of metastatic melanoma. Clin Cancer Res 21, 2278–2288 (2015). 10.1158/1078-0432.CCR-14-2085 [DOI] [PMC free article] [PubMed] [Google Scholar]
- 19.Shum T et al. Constitutive Signaling from an Engineered IL7 Receptor Promotes Durable Tumor Elimination by Tumor-Redirected T Cells. Cancer Discov 7, 1238–1247 (2017). 10.1158/2159-8290.CD-17-0538 [DOI] [PMC free article] [PubMed] [Google Scholar]
- 20.Lange S et al. A Chimeric GM-CSF/IL18 Receptor to Sustain CAR T-cell Function. Cancer Discov 11, 1661–1671 (2021). 10.1158/2159-8290.CD-20-0896 [DOI] [PMC free article] [PubMed] [Google Scholar]
- 21.Hunter MR et al. Chimeric gammac cytokine receptors confer cytokine independent engraftment of human T lymphocytes. Mol Immunol 56, 1–11 (2013). 10.1016/j.molimm.2013.03.021 [DOI] [PubMed] [Google Scholar]
- 22.Sockolosky JT et al. Selective targeting of engineered T cells using orthogonal IL-2 cytokine-receptor complexes. Science 359, 1037–1042 (2018). 10.1126/science.aar3246 [DOI] [PMC free article] [PubMed] [Google Scholar]
- 23.Kochenderfer JN et al. Lymphoma Remissions Caused by Anti-CD19 Chimeric Antigen Receptor T Cells Are Associated With High Serum Interleukin-15 Levels. J Clin Oncol 35, 1803–1813 (2017). 10.1200/JCO.2016.71.3024 [DOI] [PMC free article] [PubMed] [Google Scholar]
- 24.Yeku OO, Purdon TJ, Koneru M, Spriggs D & Brentjens RJ Armored CAR T cells enhance antitumor efficacy and overcome the tumor microenvironment. Sci Rep 7, 10541 (2017). 10.1038/s41598-017-10940-8 [DOI] [PMC free article] [PubMed] [Google Scholar]
- 25.Vera JF et al. Genetic manipulation of tumor-specific cytotoxic T lymphocytes to restore responsiveness to IL-7. Mol Ther 17, 880–888 (2009). 10.1038/mt.2009.34 [DOI] [PMC free article] [PubMed] [Google Scholar]
- 26.Agarwal Y et al. Intratumourally injected alum-tethered cytokines elicit potent and safer local and systemic anticancer immunity. Nat Biomed Eng 6, 129–143 (2022). 10.1038/s41551-021-00831-9 [DOI] [PMC free article] [PubMed] [Google Scholar]
- 27.Jumper J et al. Highly accurate protein structure prediction with AlphaFold. Nature 596, 583–589 (2021). 10.1038/s41586-021-03819-2 [DOI] [PMC free article] [PubMed] [Google Scholar]
- 28.Mischnik M et al. IKAP: A heuristic framework for inference of kinase activities from Phosphoproteomics data. Bioinformatics 32, 424–431 (2016). 10.1093/bioinformatics/btv699 [DOI] [PubMed] [Google Scholar]
- 29.Nguyen P et al. Route of 41BB/41BBL Costimulation Determines Effector Function of B7-H3-CAR.CD28zeta T Cells. Mol Ther Oncolytics 18, 202–214 (2020). 10.1016/i.omto.2020.06.018 [DOI] [PMC free article] [PubMed] [Google Scholar]
- 30.Kramer A, Green J, Pollard J Jr. & Tugendreich S Causal analysis approaches in Ingenuity Pathway Analysis. Bioinformatics 30, 523–530 (2014). 10.1093/bioinformatics/btt703 [DOI] [PMC free article] [PubMed] [Google Scholar]
- 31.Bruniquel D, Borie N, Hannier S & Triebel F Regulation of expression of the human lymphocyte activation gene-3 (LAG-3) molecule, a ligand for MHC class II. Immunogenetics 48, 116–124 (1998). 10.1007/s002510050411 [DOI] [PubMed] [Google Scholar]
- 32.Meyaard L, Hovenkamp E, Otto SA & Miedema F IL-12-induced IL-10 production by human T cells as a negative feedback for IL-12-induced immune responses. J Immunol 156, 2776–2782 (1996). [PubMed] [Google Scholar]
- 33.Joshi NS et al. Inflammation directs memory precursor and short-lived effector CD8(+) T cell fates via the graded expression of T-bet transcription factor. Immunity 27, 281–295 (2007). 10.1016/j.immuni.2007.07.010 [DOI] [PMC free article] [PubMed] [Google Scholar]
- 34.Scott AC et al. TOX is a critical regulator of tumour-specific T cell differentiation. Nature 571, 270–274 (2019). 10.1038/s41586-019-1324-y [DOI] [PMC free article] [PubMed] [Google Scholar]
- 35.Kanai T et al. Identification of STAT5A and STAT5B target genes in human T cells. PLoS One 9, e86790 (2014). 10.1371/journal.pone.0086790 [DOI] [PMC free article] [PubMed] [Google Scholar]
- 36.Pearce EL et al. Control of effector CD8+ T cell function by the transcription factor Eomesodermin. Science 302, 1041–1043 (2003). 10.1126/science.1090148 [DOI] [PubMed] [Google Scholar]
- 37.Wei J et al. Targeting REGNASE-1 programs long-lived effector T cells for cancer therapy. Nature 576, 471–476 (2019). 10.1038/s41586-019-1821-z [DOI] [PMC free article] [PubMed] [Google Scholar]
- 38.Omilusik KD et al. Transcriptional repressor ZEB2 promotes terminal differentiation of CD8+ effector and memory T cell populations during infection. J Exp Med 212, 2027–2039 (2015). 10.1084/jem.20150194 [DOI] [PMC free article] [PubMed] [Google Scholar]
- 39.Stuhlmann-Laeisz C et al. Forced dimerization of gp130 leads to constitutive STAT3 activation, cytokine-independent growth, and blockade of differentiation of embryonic stem cells. Mol Biol Cell 17, 2986–2995 (2006). 10.1091/mbc.e05-12-1129 [DOI] [PMC free article] [PubMed] [Google Scholar]
- 40.Seubert N et al. Active and inactive orientations of the transmembrane and cytosolic domains of the erythropoietin receptor dimer. Mol Cell 12, 1239–1250 (2003). 10.1016/s1097-2765(03)00389-7 [DOI] [PubMed] [Google Scholar]
- 41.Patel N, Herrman JM, Timans JC & Kastelein RA Functional replacement of cytokine receptor extracellular domains by leucine zippers. J Biol Chem 271, 30386–30391 (1996). 10.1074/jbc.271.48.30386 [DOI] [PubMed] [Google Scholar]
- 42.Brooks AJ et al. Mechanism of activation of protein kinase JAK2 by the growth hormone receptor. Science 344, 1249783 (2014). 10.1126/science.1249783 [DOI] [PubMed] [Google Scholar]
- 43.Ross SH et al. Phosphoproteomic Analyses of Interleukin 2 Signaling Reveal Integrated JAK Kinase-Dependent and -Independent Networks in CD8(+) T Cells. Immunity 45, 685–700 (2016). 10.1016/j.immuni.2016.07.022 [DOI] [PMC free article] [PubMed] [Google Scholar]
- 44.Chinnasamy D et al. Local delivery of interleukin-12 using T cells targeting VEGF receptor-2 eradicates multiple vascularized tumors in mice. Clin Cancer Res 18, 1672–1683 (2012). 10.1158/1078-0432.CCR-11-3050 [DOI] [PMC free article] [PubMed] [Google Scholar]
- 45.Chen Y et al. Eradication of Neuroblastoma by T Cells Redirected with an Optimized GD2-Specific Chimeric Antigen Receptor and Interleukin-15. Clin Cancer Res 25, 2915–2924 (2019). 10.1158/1078-0432.CCR-18-1811 [DOI] [PubMed] [Google Scholar]
- 46.Straathof KC et al. An inducible caspase 9 safety switch for T-cell therapy. Blood 105, 4247–4254 (2005). 10.1182/blood-2004-11-4564 [DOI] [PMC free article] [PubMed] [Google Scholar]
- 47.Prinzing B et al. Deleting DNMT3A in CAR T cells prevents exhaustion and enhances antitumor activity. Sci Transl Med 13, eabh0272 (2021). 10.1126/scitranslmed.abh0272 [DOI] [PMC free article] [PubMed] [Google Scholar]
- 48.Haydar D et al. Cell-surface antigen profiling of pediatric brain tumors: B7-H3 is consistently expressed and can be targeted via local or systemic CAR T-cell delivery. Neuro Oncol 23, 999–1011 (2021). 10.1093/neuonc/noaa278 [DOI] [PMC free article] [PubMed] [Google Scholar]
- 49.Mount CW et al. Potent antitumor efficacy of anti-GD2 CAR T cells in H3-K27M(+) diffuse midline gliomas. Nat Med 24, 572–579 (2018). 10.1038/s41591-018-0006-x [DOI] [PMC free article] [PubMed] [Google Scholar]
- 50.Freitas KA et al. Enhanced T cell effector activity by targeting the Mediator kinase module. Science 378, eabn5647 (2022). 10.1126/science.abn5647 [DOI] [PMC free article] [PubMed] [Google Scholar]
- 51.Blokon-Kogan D et al. Membrane anchored IL-18 linked to constitutively active TLR4 and CD40 improves human T cell antitumor capacities for adoptive cell therapy. Journal for ImmunoTherapy of Cancer 10, e001544 (2022). 10.1136/jitc-2020-001544 [DOI] [Google Scholar]
- 52.Hurton LV et al. Tethered IL-15 augments antitumor activity and promotes a stem-cell memory subset in tumor-specific T cells. Proc Natl Acad Sci U S A 113, E7788–E7797 (2016). 10.1073/pnas.1610544113 [DOI] [PMC free article] [PubMed] [Google Scholar]
- 53.Hu J et al. Cell membrane-anchored and tumor-targeted IL-12 (attIL12)-T cell therapy for eliminating large and heterogeneous solid tumors. Journal for ImmunoTherapy of Cancer 10, e003633 (2022). 10.1136/jitc-2021-003633 [DOI] [PMC free article] [PubMed] [Google Scholar]
- 54.Kakarla S et al. Antitumor effects of chimeric receptor engineered human T cells directed to tumor stroma. Mol Ther 21, 1611–1620 (2013). 10.1038/mt.2013.110 [DOI] [PMC free article] [PubMed] [Google Scholar]
- 55.Yi Z, Prinzing BL, Cao F, Gottschalk S & Krenciute G Optimizing EphA2-CAR T Cells for the Adoptive Immunotherapy of Glioma. Mol Ther Methods Clin Dev 9, 70–80 (2018). 10.1016/j.omtm.2018.01.009 [DOI] [PMC free article] [PubMed] [Google Scholar]
- 56.Li N et al. CAR T cells targeting tumor-associated exons of glypican 2 regress neuroblastoma in mice. Cell Rep Med 2, 100297 (2021). 10.1016/j.xcrm.2021.100297 [DOI] [PMC free article] [PubMed] [Google Scholar]
- 57.Moll JR, Ruvinov SB, Pastan I & Vinson C Designed heterodimerizing leucine zippers with a ranger of pis and stabilities up to 10(−15) M. Protein Sci 10, 649–655 (2001). 10.1110/ps.39401 [DOI] [PMC free article] [PubMed] [Google Scholar]
- 58.Schindelin J et al. Fiji: an open-source platform for biological-image analysis. Nat Methods 9, 676–682 (2012). 10.1038/nmeth.2019 [DOI] [PMC free article] [PubMed] [Google Scholar]
- 59.Bolte S & Cordelieres FP A guided tour into subcellular colocalization analysis in light microscopy. J Microsc 224, 213–232 (2006). 10.1111/j.1365-2818.2006.01706.x [DOI] [PubMed] [Google Scholar]
- 60.Tan H et al. Integrative Proteomics and Phosphoproteomics Profiling Reveals Dynamic Signaling Networks and Bioenergetics Pathways Underlying T Cell Activation. Immunity 46, 488–503 (2017). 10.1016/j.immuni.2017.02.010 [DOI] [PMC free article] [PubMed] [Google Scholar]
- 61.Wang X et al. JUMP: a tag-based database search tool for peptide identification with high sensitivity and accuracy. Mol Cell Proteomics 13, 3663–3673 (2014). 10.1074/mcp.O114.039586 [DOI] [PMC free article] [PubMed] [Google Scholar]
- 62.Niu M et al. Extensive Peptide Fractionation and y1 Ion-Based Interference Detection Method for Enabling Accurate Quantification by Isobaric Labeling and Mass Spectrometry. Anal Chem 89, 2956–2963 (2017). 10.1021/acs.analchem.6b04415 [DOI] [PMC free article] [PubMed] [Google Scholar]
- 63.Du X et al. Hippo/Mst signalling couples metabolic state and immune function of CD8alpha(+) dendritic cells. Nature 558, 141–145 (2018). 10.1038/s41586-018-0177-0 [DOI] [PMC free article] [PubMed] [Google Scholar]
- 64.Ritchie ME et al. limma powers differential expression analyses for RNA-sequencing and microarray studies. Nucleic Acids Res 43, e47 (2015). 10.1093/nar/gkv007 [DOI] [PMC free article] [PubMed] [Google Scholar]
- 65.Gu Z, Eils R & Schlesner M Complex heatmaps reveal patterns and correlations in multidimensional genomic data. Bioinformatics 32, 2847–2849 (2016). 10.1093/bioinformatics/btw313 [DOI] [PubMed] [Google Scholar]
- 66.Hornbeck PV et al. PhosphoSitePlus, 2014: mutations, PTMs and recalibrations. Nucleic Acids Res 43, D512–520 (2015). 10.1093/nar/gku1267 [DOI] [PMC free article] [PubMed] [Google Scholar]
- 67.Hao Y et al. Integrated analysis of multimodal single-cell data. Cell 184, 3573–3587 e3529 (2021). 10.1016/j.cell.2021.04.048 [DOI] [PMC free article] [PubMed] [Google Scholar]
Associated Data
This section collects any data citations, data availability statements, or supplementary materials included in this article.
Supplementary Materials
Data Availability Statement
The RNA-seq data files are available through Synapse (https://www.synapse.org/#!Synapse:syn52457643). The raw and analysed datasets generated during the study are available for research purposes from the corresponding authors on reasonable request. Source data are provided with this paper.


