Abstract
Microbial metabolites provide numerous benefits to the human body but can also contribute to diseases such as obesity, diabetes, cancer, and bone disorders. However, the role of imidazole propionate (ImP), a histidine-derived metabolite produced by the intestinal microbiome, in bone metabolism and the development of osteoporosis is still poorly understood. In this study, we investigated the role of ImP and its underlying mechanisms in regulating bone homeostasis. When ImP was administered to 8-week-old mice for 4 weeks, bone loss was observed, along with a decrease in alkaline phosphatase-positive osteoblast cells. Additionally, bone marrow stromal cells (BMSCs) isolated from ImP-treated mice exhibited reduced osteogenic potential. In BMSCs from control mice, ImP treatment inhibited BMP2-induced osteoblast differentiation while promoting adipocyte differentiation. However, ImP had no effect on RANKL-induced osteoclast differentiation or activity in bone marrow macrophages. Mechanistically, ImP treatment increased p38γ phosphorylation and decreased AMPK (T172) phosphorylation in BMSCs. Suppression of p38γ expression using si-p38γ reversed the inhibitory effects of ImP on osteoblast differentiation, with a concurrent increase in AMPK (T172) phosphorylation. Conversely, ImP stimulated adipocyte differentiation by decreasing AMPK (T172) phosphorylation. Treatment with the AMPK agonist metformin significantly reversed the inhibitory effects of ImP on osteoblast differentiation and the promotion of adipocyte differentiation, along with enhanced AMPK (T172) phosphorylation. These findings suggest that the microbial metabolite ImP may disrupt bone homeostasis by stimulating p38γ phosphorylation and inhibiting the AMPK pathway, presenting a potential therapeutic target for managing metabolic bone diseases.
Subject terms: Cell signalling, Metabolic bone disease
Imidazole propionate, a microbial metabolite, impairs bone homeostasis by inhibiting osteoblast differentiation and enhancing adipocyte differentiation via p38γ activation and AMPK suppression. Metformin counters these effects.
Introduction
Bones undergo a constant process of bone formation by osteoblasts and bone resorption by osteoclasts to perform various functions in the body1,2. Osteoblasts are derived from bone marrow stromal cells (BMSCs) through differentiation3, and the BMPs−smads−Runx2 /osteoblast-specific transcription factor pathway plays an important role in this process4,5. Hormonal changes, aging, metabolic diseases, and gut microbiota alterations induce an imbalance of osteoblasts and osteoclasts, leading to reduced bone mass and increased fat accumulation6. Diabetes is associated with osteoporosis due to elevated levels of glucose and adipokines in the blood, leading to increased bone resorption, reduced regenerative capabilities, and higher risk of fractures7,8.
Recently, the balance of gut microbiota and their metabolites has been emphasized as an important regulator in maintaining bone homeostasis9,10. Trimethylamine N-oxide11, a degradation product of carnitine and phosphatidylcholine by gut microbes, promotes inflammatory responses and damages BMSCs. Branched-chain amino acids produced by Lactobacillus and Weissella increase the incidence of insulin resistance and type 2 diabetes12.
Imidazole propionate (ImP) is a histidine-derived metabolite produced by urocanate reductase, an enzyme produced by the gut microbiome, it is found in high levels in the bloodstream of patients with diabetes and has been implicated in exacerbating diabetes13. In diabetes, glucose production increases due to a significant reduction in AMPK activation, which is essential for maintaining energy homeostasis14,15. Metformin, a widely used anti-diabetic medication, works by enhancing AMPK activation to regulate glucose levels14. ImP accelerates the rate of diabetes progression by inducing AMP-activated kinase (AMPK) phosphorylation at S485 and inhibiting AMPK phosphorylation at T172, which inhibits the glucose-lowering effects of metformin16.
This study shows that ImP activates P38γ in BMSCs to regulate AMPK (T172) phosphorylation. This, in turn, promotes adipocyte differentiation while inhibiting osteoblast differentiation, ultimately disrupting bone homeostasis. Our results suggest that ImP may play a role in the development of metabolic bone diseases, and targeting this signaling pathway could be a therapeutic strategy.
Results
The microbial metabolite ImP causes bone loss in mice
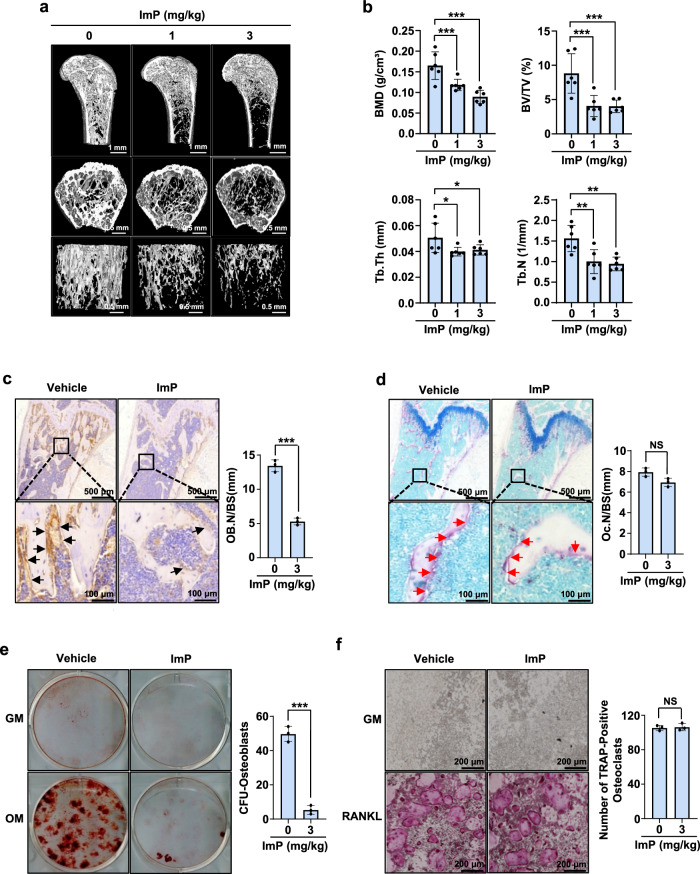
To examine the systemic influence of ImP on bone homeostasis, the agent was administered to mice for 4 weeks using a subcutaneous osmotic pump, and bone tissues were analyzed using micro-computed tomography (µ-CT). The µ-CT image analysis showed that ImP markedly induced trabecular bone loss compared to the control group (Fig. 1a). In addition, quantitative analysis of trabecular bone parameters revealed significant decreases in bone mineral density (BMD), bone volume fraction (BV/TV), trabecular number (Tb.N), and trabecular thickness (Tb.Th) (Fig. 1b). Histological analysis was also performed to observe pathological changes in the bone. The bone loss was confirmed through H&E staining (Supplementary Fig. 1a), and a decrease in the osteoblast differentiation marker was observed (Fig. 1c) with ALP staining, while no difference was noted in the osteoclast differentiation marker through TRAP staining (Fig. 1d). To further understand the cellular-level effects on bone, BMSCs and bone marrow macrophage (BMM) cells were isolated from ImP-treated mice and identified differentiation colonies. In ImP-treated BMSCs, calcium deposition decreased (Fig. 1e), while there was no change in RANKL-induced osteoclastogenesis of BMM cells, as confirmed by TRAP staining (Fig. 1f). To assess the local effects of ImP on BMP2-induced ectopic bone formation in vivo, BMP2 and ImP were administered with a collagen sponge into the back of mice. ImP decreased BMP2-induced ectopic bone formation but increased adipocytes, as confirmed by hematoxylin and eosin (H&E) staining and µ-CT analysis (Supplementary Fig. 2a, b). These findings suggest that the microbial metabolite ImP suppresses bone formation and disrupts bone homeostasis.
Fig. 1. ImP produces bone loss in mice.
a ImP was administered for 4 weeks using a subcutaneously implanted osmotic pump, and micro-computed tomography analysis was performed on the femurs of the mice (n = 6). b Trabecular bone parameters, including BMD (g/cm3), BV/TV (%), Tb.Th (mm), and Tb.N (1/mm) were measured using CT analyzer program (n = 6). c, d Pathological bone changes were observed through histological analysis of the samples shown in (a). Immunohistochemistry (IHC) analysis was performed using ALP staining (c) (n = 3). Additionally, TRAP staining was performed using a TRAP detection kit (d) (n = 3). e, f BMSCs and BMM cells were isolated from mice injected with ImP (3 mg/kg) for 4 weeks and identified differentiation colonies (n = 3). The results were confirmed through alizarin red S staining (e) and TRAP staining (f). ImP, imidazole propionate; BMD, bone mineral density; BV/TV, percentage bone volume; Tb.Th, trabecular thickness; Tb.N, trabecular number; IHC, Immunohistochemistry; black arrow, ALP-positive osteoblasts; red arrow, TRAP-positive osteoclasts; Values are presented as the mean ± SD; *, P < 0.05; **, P < 0.01; ***, P < 0.001; compared to the control group.
ImP suppresses osteoblast differentiation
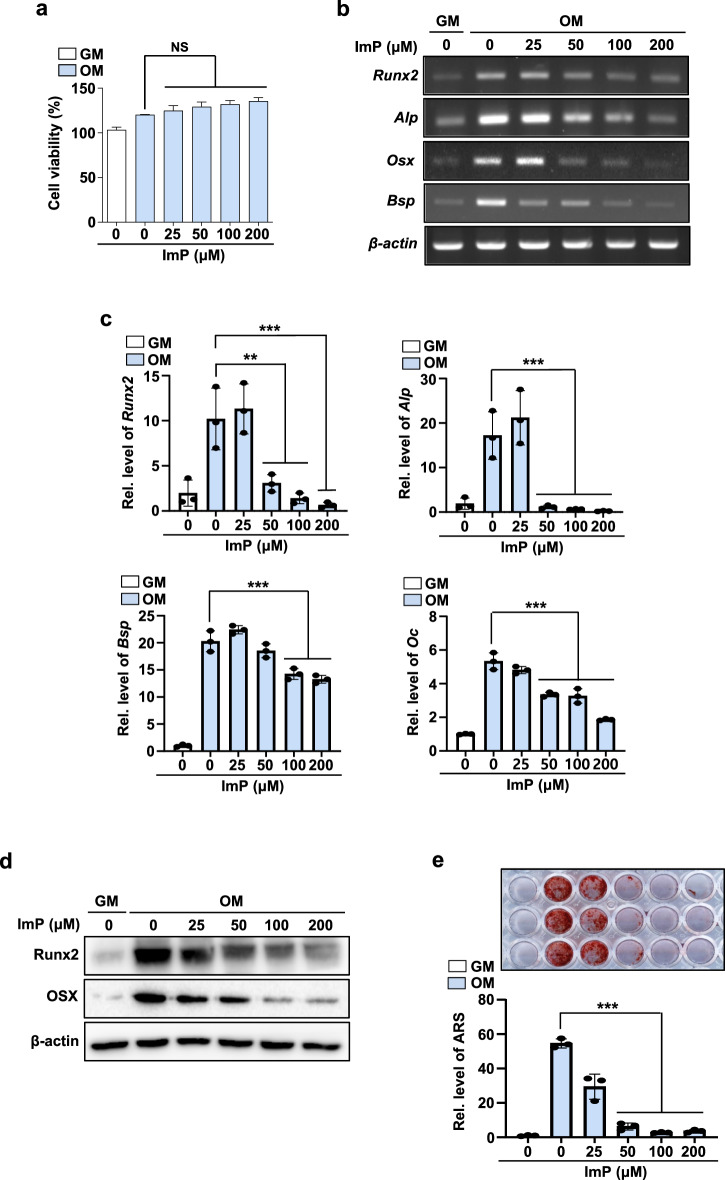
To investigate the cellular actions of ImP underlying bone loss, primary BMSCs were cultured with ImP. Concentrations of ImP below 200 μM did not affect the viability of the BMSCs (Fig. 2a). In osteogenic media (OM) containing BMP2, BMSCs significantly increased the mRNA expression of osteoblast differentiation markers, such as Runx2, Osx, Alp, Bsp, and Oc. In contrast, ImP treatment at concentrations ranging from 50 to 200 μM significantly inhibited the expression, as confirmed by reverse transcription-polymerase chain reaction (RT-PCR) and quantitative real time PCR (qRT-PCR) (Fig. 2b, c). The protein levels were also significantly reduced by the ImP treatment (Fig. 2d). In addition, ImP significantly inhibited osteogenic medium (OM)-induced calcium deposition, as evidenced by alizarin red S (ARS) staining (Fig. 2e). These results suggest that ImP may impair bone formation by inhibiting osteoblast differentiation.
Fig. 2. ImP inhibits BMP2-induced osteoblast differentiation.
BMSCs were isolated from the tibia and maintained with GM or OM. a Effects of ImP on cell viability were evaluated using a CCK8 assay reagent (n = 3). b, c BMSCs were cultured for 6 days and analyzed through RT-PCR and qRT-PCR (n = 3). d Western blotting was performed with Runx2 and Osx antibodies (n = 3). β-actin was used as an internal control. e BMSCs were cultured for 14 days, and alizarin red S staining was performed to determine calcification (n = 3). ImP, imidazole propionate; BMSC, bone marrow stromal cell; GM, growth media; OM, osteogenic media (ascorbic acid 50 µg/ml, β-glycerophosphate 5 mM, and BMP2 100 ng/ml); Values are presented as the mean ± SD; NS, non-significant; **P < 0.01; ***P < 0.001; compared to the control group.
ImP does not affect RANKL-induced osteoclastogenesis in BMMs
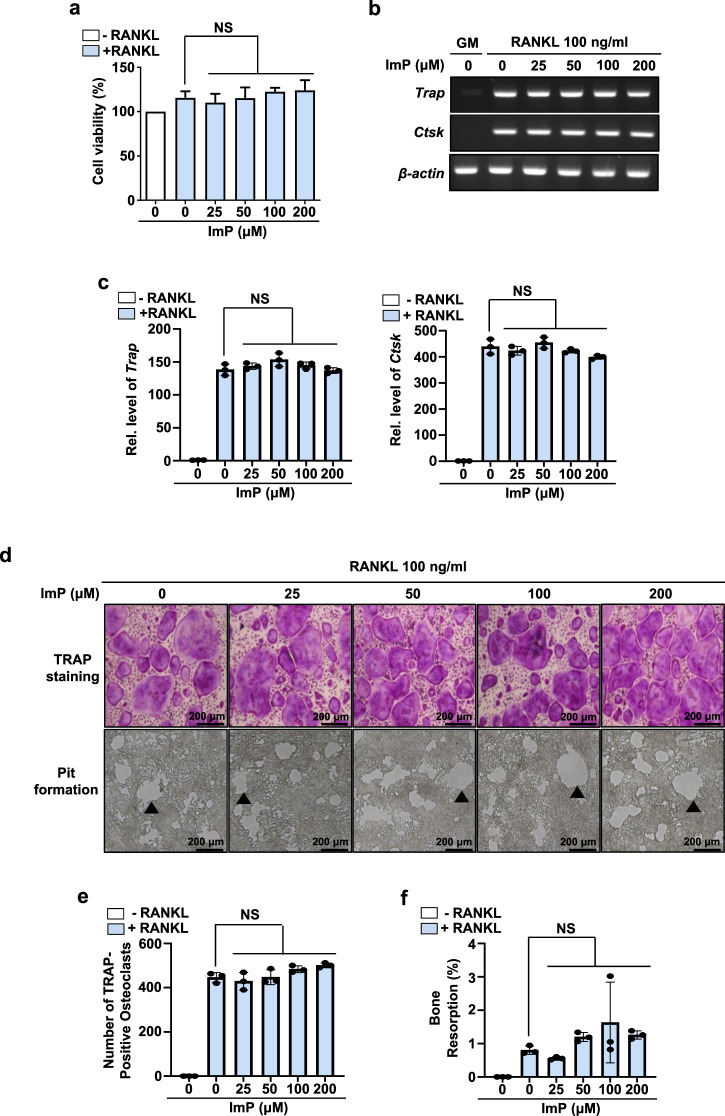
To further examine the effects of ImP on RANKL-induced osteoclast differentiation, we isolated and cultured primary BMMs with M-CSF and RANKL in the presence of ImP. Treatment with RANKL increased the mRNA expression levels of Trap and Ctsk in BMMs (Fig. 3b, c), as well as the number of osteoclast-like TRAP-positive multinuclear cells (Fig. 3d, e). However, ImP did not affect the RANKL-induced osteoclast differentiation (Fig. 3b–e). In addition, it was confirmed that there was no change in bone resorption in the pit assay conducted to assess the activity of osteoclasts (Fig. 3d, f). These results suggest that ImP-induced bone loss in mice may not be due to an increase in osteoclast activity.
Fig. 3. ImP does not affect RANKL-induced osteoclastogenesis in BMMs.
Cells were isolated from the tibia and maintained for 4 days with α-MEM containing RANKL (100 ng/ml) and M-CSF (30 ng/ml). a Effects of ImP on cell viability were evaluated using a CCK8 assay reagent (n = 3). b, c RT-PCR and qRT-PCR analyses were performed with the indicated primers. β-actin was used as an internal control (n = 3). d (upper panel), e Trap staining was performed, and osteoclast-like Trap-positive cells were counted (n = 3). d (lower panel), f A pit assay was performed to assess bone resorption (n = 3). ImP, imidazole propionate; BMM, bone marrow macrophage; Black triangle, bone resorption pit; Values are presented as the mean ± SD; NS, non-significant; compared to the control group.
ImP stimulates adipocyte differentiation
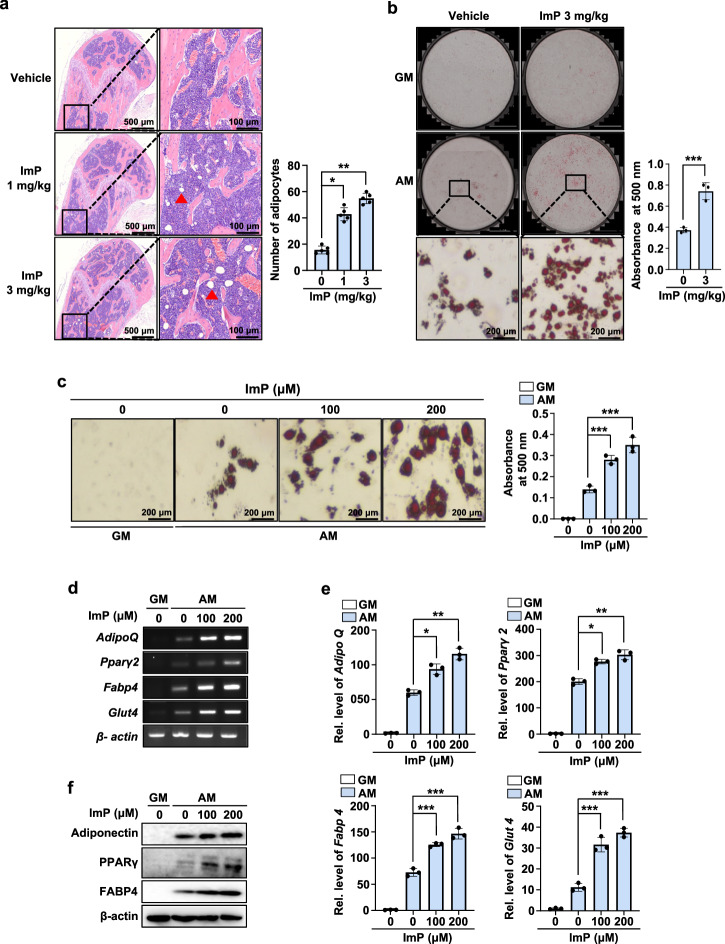
Previous studies have shown that adipogenic factors inhibit osteogenesis, while osteopromoting factors suppress adipogenesis17. Our findings demonstrated that ImP inhibits osteoblast differentiation, so we further investigated its effects on adipocyte differentiation. When ImP was systemically administered to mice using an osmotic pump, a dose-dependent increase in bone marrow adipocytes was observed, confirmed by H&E staining (Fig. 4a). To explore cellular-level changes, BMSCs cells were isolated from mice injected with ImP (3 mg/kg) for 4 weeks and identified lipid droplet formation. This revealed a significant increase in lipid droplet formation, as shown by oil red O staining (Fig. 4b). Additionally, in vitro treatment of BMSCs with ImP to induce differentiation also increased lipid droplet formation (Fig. 4c). In BMSC cultures, ImP dose-dependently increased lipid droplet formation, along with the expression of adipocyte differentiation markers such as AdipoQ, Pparγ2, Fabp4, and Glut4 mRNA (Fig. 4d–e). Consistent with this, western blot analysis showed that ImP increased the expression of adipogenic proteins, including adiponectin, PPARγ, and FABP4 (Fig. 4f). Furthermore, in 3T3-L1 preadipocyte cultures, ImP treatment also dose-dependently increased lipid droplet formation, as confirmed by BODIPY (493/503) and oil red O staining (Supplementary Fig. 3a, b). These results suggest that ImP may promote adipocyte differentiation from BMSCs, potentially disrupting bone homeostasis.
Fig. 4. ImP stimulates adipocyte differentiation.
a ImP was administered for 4 weeks using a subcutaneously implanted osmotic pump, and H&E analysis was performed on the femurs. H&E-stained bone marrow adipocytes were quantified (n = 5). b BMSCs cells were isolated from mice injected with ImP (3 mg/kg) for 4 weeks and identified lipid droplet formation. After inducing adipocyte differentiation, the results were confirmed through oil red O staining (n = 3). c BMSCs were cultured in GM and AM for 8 days. Oil red O staining was performed, and the oil red O-positive cells were counted (n = 3). d, e Total RNA was isolated from the cell cultures, and RT-PCR and qRT-PCR analyses were performed (n = 3). f Western blotting was performed with antibodies against adiponectin, PPARγ, and FABP4 (n = 3). β-actin was used as an internal control. ImP, imidazole propionate; H&E, hematoxylin and eosin; BMSC, bone marrow stromal cell; GM, growth media; AM, adipogenic media (1 µg/ml insulin, 2 µM rosiglitazone, and 100 nM dexamethasone); Red triangle, adipocyte; Values are presented as the mean ± SD; *, P < 0.05; **, P < 0.01; ***, P < 0.001; compared to the control group.
ImP regulates bone homeostasis by activating p38γ and modulating AMPK phosphorylation
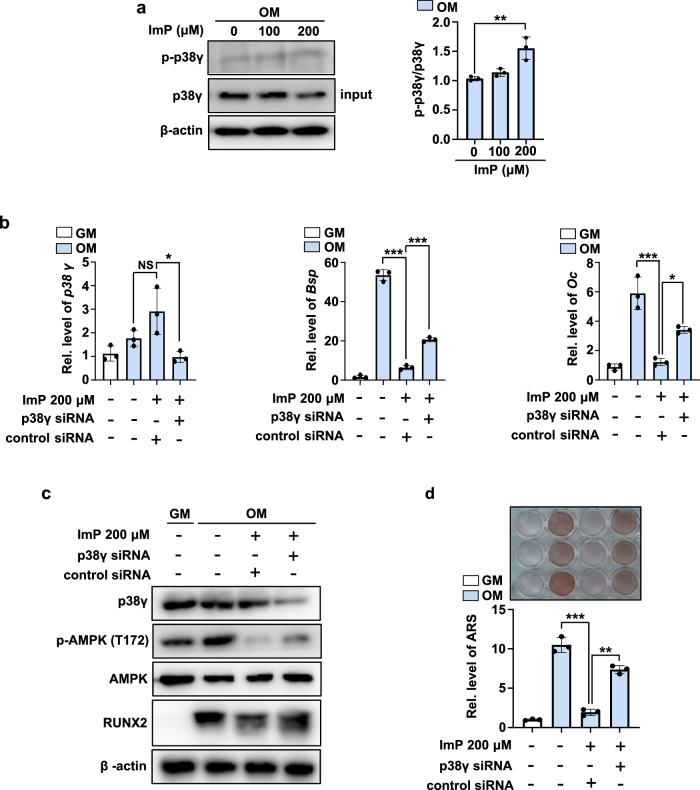
ImP is known to regulate various signaling pathways by activating p38γ16. To investigate whether ImP promotes p38γ phosphorylation in BMSCs, immunoprecipitation and western blot analyses were performed. When 200 μM of ImP was added to BMSC cultures, the phosphorylation of p38γ significantly increased (Fig. 5a). To further explore the relationship between p38γ activation and osteoblast differentiation, we examined the expression of osteoblast-specific genes such as Bsp and Oc following treatment with ImP and/or p38γ siRNA. ImP treatment alone decreased the expression of these genes, while treatment with p38γ siRNA partially reversed the effects of ImP (Fig. 5b).
Fig. 5. ImP regulates bone homeostasis by activating p38γ and controlling AMPK phosphorylation.
a BMSCs were treated with ImP at different concentrations, cultured for 2 days, and p38γ activation was confirmed by IP (n = 3). b After transfecting p38γ siRNA, qRT-PCR analysis was performed to examine the expression of p38γ, Bsp, and Oc (n = 3). c After transfecting p38γ siRNA, p38γ, p-AMPK (T172), AMPK, and RUNX2 protein expression levels was assessed using western blot (n = 3). d After transfection with p38γ siRNA, calcium deposition was evaluated using alizarin red S staining (n = 3). ImP, imidazole propionate; BMSC, bone marrow stromal cell; GM, growth media; IP, Immunoprecipitation; Values are presented as the mean ± SD; *, P < 0.05; **, P < 0.01; ***, P < 0.001; compared to the control group.
Previous studies have shown that ImP modulates AMPK phosphorylation via p38γ activation16, and AMPK plays a crucial role in osteoblast differentiation18. In this study, ImP inhibited the expression of Runx2, a key regulator of osteoblast differentiation, along with a decrease in AMPK phosphorylation. Moreover, p38γ siRNA treatment restored Runx2 expression, counteracting the effects of ImP (Fig. 5c). Similarly, p38γ siRNA treatment rescued ImP-mediated inhibition of calcium deposition (Fig. 5d). These findings suggest that ImP regulates bone homeostasis by modulating AMPK phosphorylation through p38γ activation.
ImP inhibits osteoblast differentiation by regulating AMPK (T172) phosphorylation in primary BMSCs
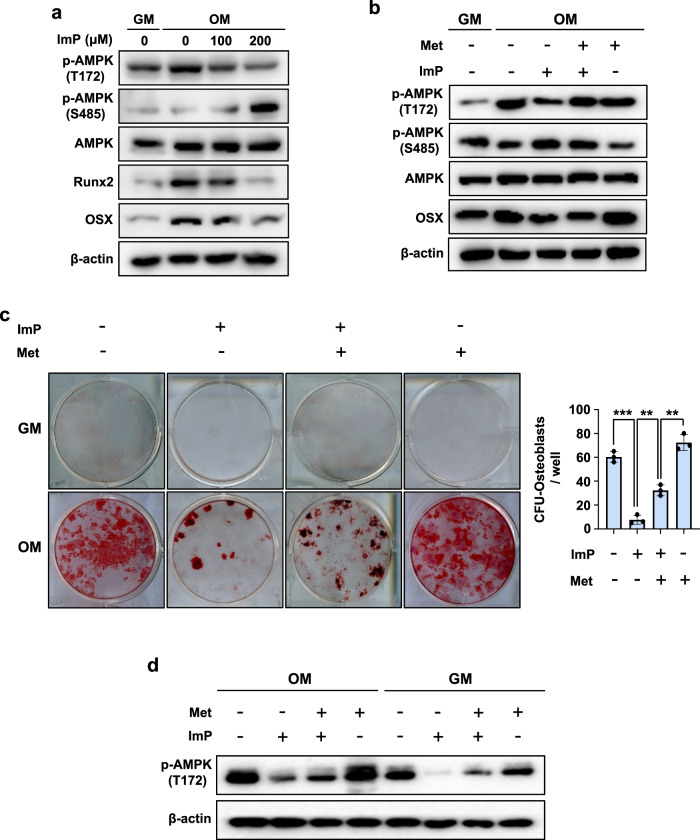
The activation of AMPK stimulates osteogenesis and inhibits adipogenesis19. Our previous study also showed that the antidiabetic medication metformin promotes osteoblastic differentiation by increasing AMPK phosphorylation18. Here, in this study, we examined whether metformin or BMP2 could enhance osteoblast differentiation by increasing AMPK (T172) phosphorylation. Western blot analyses revealed that metformin (100 μM) or BMP2 (100 ng/ml) increased AMPK (T172) phosphorylation (Supplementary Fig. 4). As ImP decreased AMPK (T172) phosphorylation and increased AMPK (S485) phosphorylation, inhibiting the glucose-lowering effect of metformin16, we also examined the effect of ImP on AMPK phosphorylation and osteoblast differentiation-related gene expression in primary BMSCs. ImP treatment inhibited BMP2-induced phosphorylation of AMPK (T172), leading to the inhibition of the downstream signals, such as the protein expression of RUNX2 and OSX (Fig. 6a). To confirm that these effects were due to the regulation of AMPK phosphorylation, we used an AMPK agonist (metformin), administered 3 hours before ImP treatment. Metformin significantly increased AMPK (T172) phosphorylation, which was suppressed by ImP, and also restored the expression of OSX protein, a key downstream signal (Fig. 6b). We also reversed the treatment order, administering ImP 3 hours before metformin. Under these conditions, ImP significantly reduced the effects of metformin, as evidenced by decreased AMPK (T172) phosphorylation and reduced OSX protein expression (Supplementary Fig. 5a-c). In an animal model, ImP and metformin were administered to mice, and differentiation colonies were identified on extracted cells. Metformin was administered orally 24 hours before ImP injection. As a result, metformin restored the ImP-induced reduction in calcium deposition (Fig. 6c), and western blot analysis confirmed that this increase in calcium deposition was due to the regulation of AMPK phosphorylation (Fig. 6d). These findings suggest that ImP inhibits osteoblast differentiation by suppressing AMPK (T172) phosphorylation and its downstream transcription factors.
Fig. 6. ImP inhibits osteoblast differentiation by regulating AMPK (T172) phosphorylation in primary BMSCs.
a BMSCs were cultured for 6 days with OM and ImP (100 and 200 µM), and western blot analysis was performed (n = 3). b BMSCs were cultured for 6 days with OM, ImP (200 µM) and metformin (500 µM), and western blot analysis was performed. β-actin was used as an internal control (n = 3). c, d BMSCs cells were isolated from mice injected with ImP (3 mg/kg) and metformin (100 mg/kg) for 4 weeks and identified differentiation colonies (n = 3). The analysis was conducted through alizarin red S staining (c) and western blot (d). ImP, imidazole propionate; Met, metformin; BMSC, bone marrow stromal cell; OM, osteogenic media (ascorbic acid 50 µg/ml, β-glycerophosphate 5 mM, and BMP2 100 ng/ml); Values are presented as the mean ± SD; **, P < 0.01; ***, P < 0.001; compared to the control group.
ImP increases adipocyte differentiation by regulating AMPK (T172) phosphorylation in primary BMSCs
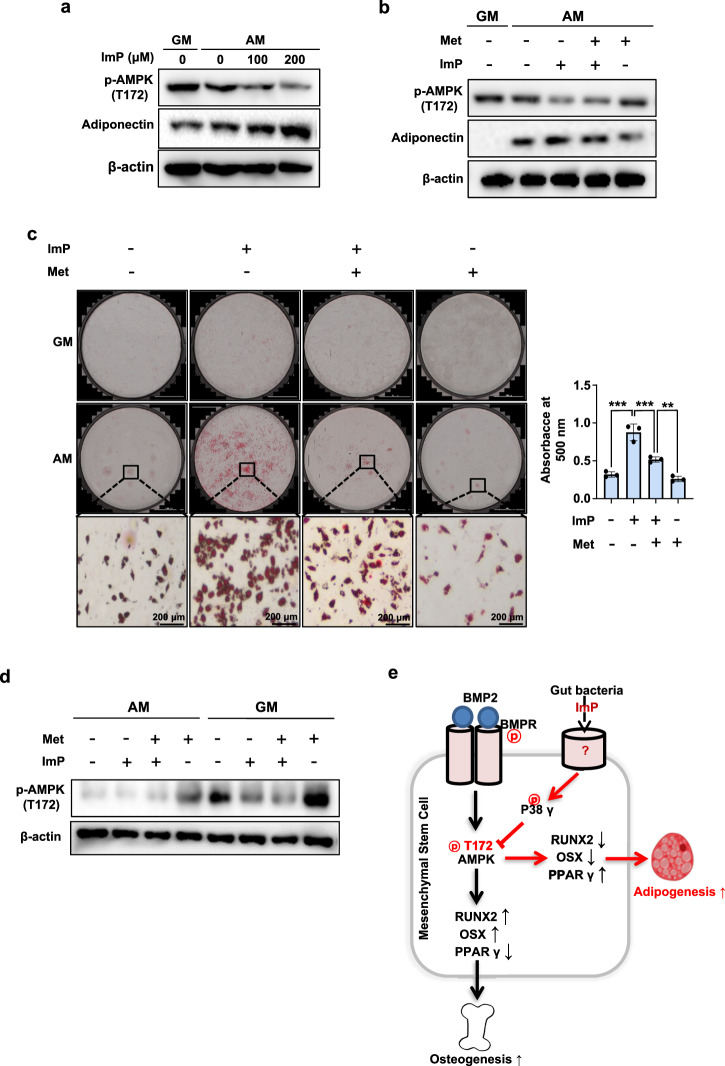
Several AMPK activators have been shown to suppress adipocyte differentiation20. In this study, we also examined the effect of ImP on adipocyte differentiation, as it inhibited AMPK (T172) phosphorylation and osteogenic differentiation in BMSCs. During adipocyte differentiation of BMSCs, AMPK (T172) phosphorylation was reduced, and ImP treatment further decreased it while increasing adiponectin protein expression, a downstream signal (Fig. 7a). However, treatment with the AMPK agonist metformin significantly restored AMPK (T172) phosphorylation, which had been inhibited by ImP, while reducing adiponectin expression (Fig. 7b). To confirm the involvement of AMPK in ImP-induced adipocyte differentiation in an animal model, we performed a lipid droplet formation assay in BMSCs isolated from metformin-treated and/or ImP-treated mice. ImP-induced lipid droplet formation was reduced following metformin treatment (Fig. 7c), along with the increases in AMPK phosphorylation (Fig. 7d). These results suggest that ImP can increase adipocyte differentiation by suppressing AMPK (T172) phosphorylation.
Fig. 7. ImP increases adipocyte differentiation by regulating AMPK (T172) phosphorylation in primary BMSCs.
a BMSCs were cultured for 8 days with AM and ImP (100 and 200 µM), and western blot analysis was performed (n = 3). b BMSCs were cultured for 8 days with AM, ImP (200 µM), and metformin (500 µM), and western blot analysis was performed. β-actin was used as an internal control (n = 3). c, d BMSCs cells were isolated from mice injected with ImP (3 mg/kg) and Metformin (100 mg/kg) for 4 weeks and identified lipid droplet formation (n = 3). The analysis was conducted through oil red O staining (c) and western blot (d). e ImP inhibits AMPK (T172) phosphorylation to promote adipogenesis, increasing PPARγ expression, and suppresses osteogenesis, decreasing RUNX2 and OSX expression. ImP, imidazole propionate; Met, metformin; BMSC, bone marrow stromal cell; AM, adipogenic media (1 µg/ml insulin, 2 µM rosiglitazone, and 100 nM dexamethasone); Values are presented as the mean ± SD; **P < 0.01; ***P < 0.001; compared to the control group.
Discussion
Microbes in the gut and their food metabolites play important roles in maintaining the homeostasis of bone and adipose metabolism21,22. In this study, we demonstrated that the microbial metabolite imidazole propionate inhibits the osteogenic differentiation of BMSCs and promotes their differentiation into adipocytes by regulating AMPK (T172) phosphorylation, leading to decreased bone mass.
ImP is a histidine-derived metabolite generated by the gut microbial enzyme urocanate reductase13. Although the biological actions of ImP are not well understood, an increased concentration of ImP in the blood has been observed in patients with diabetes, and it diminishes the blood glucose-lowering effects of metformin16. Diabetic or high-glucose conditions induce anti-osteogenic differentiation and decrease bone mass while increasing the activity of adipocytes23,24. These findings led us to investigate the systemic and local effects of ImP on bone formation and homeostasis. In the present study, continuous ImP administration using an osmotic pump resulted in decreased bone mass in the femur, and local ImP administration to subcutaneous tissue reduced BMP2-induced ectopic bone formation. These findings suggest that ImP exerts a negative effect on bone homeostasis. In contrast, previous studies have shown that short-chain fatty acids derived from dietary fiber, such as butyrate and propionate, produced by gut microbes, promote osteogenesis25,26. Taken together, these observations imply that changes in gut microbial composition and their metabolites, depending on dietary intake, can modulate bone homeostasis in various ways.
Bone tissue is maintained through the balanced regulation of osteoblasts and osteoclasts27,28. In our study, ImP suppressed osteoblastic differentiation in cultured osteoblast lineage cells, while it did not affect osteoclast differentiation in cultured osteoclast lineage cells. Moreover, ImP stimulated adipogenic differentiation in preadipocytes and BMSC cultures. These results indicate that the bone loss observed following in vivo ImP administration may be related to the functional alteration of osteoblasts rather than that of osteoclasts.
Previously, ImP has been shown to inhibit AMPK (T172) phosphorylation and increase AMPK (S485) phosphorylation in hepatocytes, thereby reducing the glucose-lowering effects of metformin16. Against this background, we investigated the involvement of AMPK (T172) activation in the differentiation of BMSCs. In BMSC culture, treatment with BMP2 increased AMPK (T172) phosphorylation along with the expression of osteoblast-specific transcription factors, such as RUNX2 and OSX (Fig. 6a). In our previous study, chemical activators of AMPK, such as metformin and 5-amino-4-imidazole carboxamide riboside (AICAR), enhanced BMP-induced osteoblast differentiation with Runx2 activation18. Moreover, BMP2 induces AMPK (T172) phosphorylation in human urethra-derived stem cells, promoting calcification29. These findings suggest that AMPK (T172) activation may act as a molecular link between BMP2 signaling and osteoblast differentiation and that ImP may negatively regulate bone homeostasis by suppressing AMPK activation. Although the cellular mechanisms of ImP are not yet well understood, in hepatocytes, ImP has been shown to ameliorate the effects of metformin on glucose lowering by increasing AMPK (S485) phosphorylation16. In the present study, ImP decreased AMPK (T172) phosphorylation and increased AMPK (S485) phosphorylation while inhibiting the differentiation of BMSCs into osteoblasts. Conversely, it stimulated the differentiation of BMSCs into adipocytes. Considering that the activation of AMPK reduces adipocyte formation and promotes bone formation30,31, the effects of ImP on osteoblast and adipocyte differentiation may result from the inhibition of AMPK activation in BMSCs. In fact, ImP-mediated inhibition of osteoblast differentiation was significantly restored by treatment with the AMPK activator metformin (Fig. 6b-d). In addition, metformin treatment significantly reduced adipogenesis with an increase in AMPK phosphorylation (T172) (Fig. 7b-d). These suggest that ImP can affect the imbalance of bone homeostasis by regulating the activation of AMPK (T172).
Although the mechanism trough which ImP regulates AMPK activity is not well understood, a study conducted on liver tissues has reported that ImP promotes p38γ phosphorylation, which in turn inhibits AMPK(T172) phosphorylation and promotes inhibitory AMPK(S485) phosphorylation16. In this study, we also investigated whether p38γ is involved in the changes in AMPK phosphorylation and osteoblast differentiation induced by ImP in BMSCs. ImP treatment alone promoted p38γ phosphorylation, reduced phosphorylation of AMPK(T172), and inhibited osteoblast differentiation. Furthermore, si-p38γ treatment restored these effects of ImP (Fig. 5). These results suggest that ImP inhibits osteoblast differentiation by altering the activity of p38γ and AMPK. However, further research is needed to determine whether ImP directly regulates p38γ after entering the cell.
Patients with diabetes are particularly susceptible to bone loss, a condition exacerbated by metabolic imbalances and hyperglycemia32. Metformin, widely recognized for its glucose-lowering effects through the activation of AMPK phosphorylation in liver cells, also promotes osteoblast differentiation through AMPK pathways18,33,34 This dual action positions metformin as a promising candidate for addressing bone-related complications in diabetes.
In our diabetes in vitro model, metformin successfully restored calcium deposition in bone marrow mesenchymal stem cells (BMSCs) under high glucose conditions, demonstrating its osteoblast-promoting potential. However, this benefit was significantly reduced by the presence of ImP, which modulates AMPK activity. Even in normal glucose conditions, ImP diminished metformin’s ability to promote osteoblast differentiation (Supplementary Fig. 6). These findings strongly suggest that ImP negatively regulates metformin’s efficacy, which may explain its limited therapeutic effects in certain cases. To confirm these findings and further investigate the mechanistic interactions between ImP, AMPK activity, and metformin, studies using diabetic animal models are still required.
While the osteoblast-promoting effects of metformin have been widely reported, its effectiveness in in vivo animal models and randomized clinical trials remains inconsistent35,36.
Based on our findings, these discrepancies could be partly attributed to the influence of gut microbial metabolites, such as ImP, which may reduce metformin’s therapeutic efficacy.
Overall, AMPK (T172) phosphorylation in osteoblasts is an important factor in promoting bone formation. ImP suppresses AMPK (T172) phosphorylation to inhibit osteoblast differentiation and stimulate adipocyte differentiation via activating p38γ phosphorylation, thereby causing bone loss (Fig. 7e). Our results suggest that the gut microbial metabolite ImP may be an important factor in the pathogenesis of diabetic bone loss and that inhibiting the action of ImP could be a crucial strategy for controlling diabetic osteoporosis.
Materials and Methods
Chemicals and Antibodies
ImP (deamino-histidine, sc294276), metformin (317240) was purchased from Santa Cruz Biotechnology (Dallas, TX, USA) and EMD Millipore (USA) respectively. Anti-rabbit AMPKα (#5831 s), anti-rabbit p-AMPK (Thr172, #2535 s), anti-rabbit p-AMPK (Ser485, #2573 s), anti-rabbit p38γ (#2307 s), anti-rabbit PPARγ (#2430 s), anti-rabbit adiponectin (#2789 s), anti-rabbit FABP4 (#2120 s), and anti-rabbit RUNX2 (#8486 s) were purchased from Cell Signaling Technology (Beverly, MA, USA). Anti-mouse OSX (sc-393325), and anti-mouse β-actin (sc-47778) were purchased from Santa Cruz Biotechnology. Anti-mouse p-Threonine (943002) were purchased from BioLegend. Also, anti-rabbit Alkaline Phosphatase (ab 108337) were purchased from Abcam.
Animal preparation
C57BL/6 mice were purchased from Damool Science (Daejeon, Korea). All mice were maintained in accordance with the guidelines of the Animal Ethics Committee at Chonnam National University (CNU IACUC-YB-2022-80), and this study complied with the ARRIVE guidelines for preclinical research. Eight-week-old C57BL/6 mice were anesthetized by intraperitoneal injection of a mixture of Zoletil (30 mg/kg, Virbac, Carros Cedex, France) and Rompun (10 mg/kg, Bayer Korea, Seoul, Korea). To analyze the systemic effects of ImP on bone, it was subcutaneously administered using an osmotic pump (MICRO-OSMOTIC PUMP MODEL 1004, ALZET®) at doses of 0, 1, and 3 mg/kg for 4 weeks. To determine the in vivo local effects of ImP on BMP2 (Cowellmedi Co., Ltd., Seoul, Republic of Korea)-induced ectopic bone formation, ImP and/or BMP2 were transplanted with a collagen sponge (CollaDerm™, Bioland, Cheongju, Korea) into the subcutaneous space of the back of mice through a surgical procedure. After 4 weeks, the mice were euthanized using CO2 inhalation, and femurs or ectopic bones were harvested.
µ-CT analysis
The microarchitecture of the femoral and ectopic bones was investigated using a µ-CT device (SkyScan 1172, Bruker, Kontich, Belgium) in cone-beam acquisition mode. A 0.5-mm thick aluminum filter was used for scanning. The X-ray source was set at 50 kV and 200 A with a pixel size of 30 µm and an exposure time of 1.2 s. The scanned images were reconstructed with the assistance of NRecon and CT analyzer software (Bruker). Three-dimensional-rendering images and quantitative bone volume were obtained using the Mimics imaging program (version 14.0; Materialise N.V., Leuven, Belgium). Trabecular morphometry was characterized by measuring the BV/TV, Tb.Th, Tb.N, and trabecular separation (Tb.Sp).
Histological analysis
The specimens were fixed with 10% formalin (Sigma Aldrich, USA), decalcified in 0.5 M ethylene-diamine tetra acetic acid (EDTA, pH 7.4), and embedded in paraffin. They were then sliced into 5-µm-thick sections for Immunohistochemistry (IHC) analysis and hematoxylin-and-eosin (H&E) staining. The specimens were observed through slide scanning using Pannoramic MIDI II (3DHISTECH Ltd., Budapest, Hungary).
Cell viability
BMSCs and BMM cells were seeded at a density of 4 × 10⁴ cell per well in 96-well plates overnight. Different doses of ImP (0, 25, 50, 100, 200 µM) were then added to the medium, and the samples were incubated for 24 h. Cell viability was assessed using the Quanti-MAX™ WST-8 Cell Viability Assay Kit (Biomax, Republic of Korea). Absorbance was measured at 450 nm with a spectrophotometer (Thermo Fisher Scientific) and expressed as a percentage.
Cell differentiation
To induce osteoblast differentiation, bone marrow cells were isolated from the femurs and tibias of 6−10-week-old male C57BL/6 mice and cultured for 5 days in α-MEM (Gibco,12561-056, USA) to obtain BMSCs, as described previously37. After passaging, the cells were maintained with OM containing ascorbic acid (50 µg/ml, Sigma Aldrich, St. Louis, MO, USA), β-glycerophosphate (5 mM, ChemCruz TM Biochemicals, Dallas, TX, USA), and BMP2 (100 ng/ml, Cowellmedi Co., Ltd., Seoul, Republic of Korea). To induce osteoclast differentiation, bone marrow cells were isolated from mice, treated with an ammonium-chloride-potassium lysing buffer (Gibco, NY, USA) to remove red blood cells, and filtered through a 0.7-µm filter to remove remaining debris. The cells were then cultured in α-MEM containing M-CSF (BioLegend, San Diego, CA, USA) for 3 days to induce attachment of BMM cells, followed by induction of osteoclast differentiation for 3−4 days in a medium containing RANKL (100 ng/ml, Peprotech, Rocky Hill, NJ, USA) and M-CSF (30 ng/ml). For adipocyte differentiation, BMSCs and 3T3-L1 cells were maintained in α-MEM containing insulin (1 µg/ml, WELGENE, LS038-01, Republic of Korea), rosiglitazone (2 µΜ, Sigma Aldrich, R2408-10MG, St. Louis, MO, USA), and dexamethasone (100 nM, Sigma Aldrich, D2915-100mg, St. Louis, MO, USA).
RT-PCR and qRT-PCR
Total RNA was obtained using TRIzol reagent (Ambion, Carlsbad, CA, USA), and cDNA was synthesized with random primers, dNTP, RNasin (Promega), and Moloney Murine Leukemia Virus (M-MLV) reverse transcriptase (Promega), according to the manufacturer’s instructions. For quantitative analysis, qRT-PCR was performed using the StepOnePlus™ real-time PCR system (Applied Biosystems) and Power SYBR Green PCR Master Mix (Thermo Fisher Scientific). The data were presented as the relative expression calculated using the ΔΔCt method and the QuantStudio Design & Analysis software (Applied Biosystems). Conventional PCR was performed using Go Taq Green Master Mix (Promega), a Veriti 96-well Thermal Cycler (Applied Biosystems), and Quantum-Gel Documentation Imaging (Vilber). The primer sequences are shown in supplementary Table 1.
Immunoprecipitation and Western blot analysis
Total cell extract was prepared using lysis buffer (Cell Signaling Technology) and centrifuged at 16,000 × g for 15 min at 4 °C. For immunoprecipitation (IP), BMSCs cells were transiently co-transfected with p38γ and p-Threonine. Cell lysates were precleared with protein G-agarose beads (Invitrogen) and then incubated with the indicated antibodies overnight at 4 °C. After incubation with protein G-agarose beads for 2 h, the suspension was centrifuged, and the beads were washed with lysis buffer three times. The immunoprecipitated materials were solubilized in SDS sample buffer (Sigma-Aldrich). Total proteins or immunoprecipitated proteins were resolved on an SDS-PAGE gel and transferred into a PVDF membrane. The membrane was blocked with 2% skim milk (Difco™; BD, Detroit, MI, USA) in TBST buffer (0.2 M Tris-HCl pH 7.6, 1.37 M NaCl, 0.1% Tween 20) and incubated with the primary antibody overnight at 4 °C. After washing with TBST buffer, the membrane was incubated with the secondary antibody for 1 h. Signals were visualized using an enhanced chemiluminescence reagent (Millipore, Billerica, MA, USA) in a LAS-4000 Lumino Image Analyzer System (Fujifilm, Tokyo, Japan). The band intensity was quantified using Multi Gauge V3.0 software (Fujifilm).
Small interfering RNA (si RNA) transfection
Control-siRNA and p38r siRNA (29857-1, 5′- CGA ACC AGC CAU UUG GUG U -3′) were purchased from Bioneer and transfected into BMSCs using Lipofectamine RNAiMAX (Thermo Fisher Scientific, USA) according to the manufacturer’s protocol.
Alizarin red S staining
Cells were cultured in OM for 14 days and then fixed with 10% formalin (Sigma Aldrich, USA), for 15 min. After washing, the cultures were reacted with a 40-mM alizarin red S (ARS) solution (pH 4.2, Sigma Aldrich, St. Louis, MO, USA) to evaluate calcium deposition. The stained cultures were then photographed. For quantitative analysis, 10% cetylpyridinium chloride (pH 7.0, Sigma Aldrich, St. Louis, MO, USA) was added to the culture, and the absorbance was measured at 540 nm using a spectrophotometer (Thermo Fisher Scientific).
TRAP staining
Cultured cells were fixed with 10% formalin for 15 min and then stained using a TRAP Staining Kit (Cosmo Bio, Tokyo, Japan) according to the manufacturer’s instructions. After washing with distilled water, the cells were examined under an optical microscope (Leica Microsystems, Wetzlar, Germany) and Lionheart FX Cell Imager (BioTek). For quantitative analysis, the number of TRAP-positive multinucleated cells (n > 3) was determined.
Bone resorption assay
BMM cells (8 × 10⁴) were separated and seeded in the Bone Resorption Assay Kit 48 (CSR-BRA-48KIT, Cosmo Bio, Tokyo, Japan). ImP was administered at concentrations of 25, 50, 100, and 200 μM. After 14 days, bone resorption was examined using optical microscopy (Leica Microsystems, Wetzlar, Germany) and quantified using Image J.
Staining of neutral lipid droplets
After 8 days of adipocyte differentiation, the cells were fixed with 4% formaldehyde, stained with oil red O (Sigma Aldrich, USA), and Images were acquired using light microscope and Lionheart FX Cell Imager. The oil red O-stained lipid droplets inside the cells were further dissolved using absolute isopropanol, and the absorbance was measured at 510 nm. Adipogenic differentiation was also determined using BODIPY 493/503 fluorescent dye (Thermo Fisher Scientific) staining, according to the manufacturer’s instructions.
Statistics and Reproducibility
Statistical analysis of the data was performed using Student’s t-test or analysis of variance with Tukey’s multiple comparison test on Prism 9 software (GraphPad Software, Inc., San Diego, CA, USA). Differences with P < 0.05 were considered significant. The results are presented as the mean ± standard deviation of triplicate samples. All experiments were repeated at least three times.
Reporting summary
Further information on research design is available in the Nature Portfolio Reporting Summary linked to this article.
Supplementary information
Description of Additional Supplementary Files
Acknowledgements
We thank Ara Koh, Mi-Nam Lee, In A Cho, and Zijiao Zhang for their technical assistance and valuable comments. This work was supported by the National Research Foundation of Korea (NRF) grant funded by the Korean government (MSIT) (No. 2019R1A5A2027521); the Basic Science Research Program through the National Research Foundation of Korea (NRF) funded by the Ministry of Education (No. NRF-2020R1I1A1A01061824); the Korean Fund for Regenerative Medicine (KFRM) grant (Ministry of Science and ICT, Ministry of Health & Welfare, 22A0104L1); and the National Research Foundation of Korea (NRF) grant funded by the Korean government (MSIT) (NRF-2021R1C1C2009626).
Author contributions
J.-T.K., funding acquisition, supervision, writing- reviewing and editing; S.-G.P., conceptualization, data curation, formal analysis, writing- original draft preparation; J.-H.S., J.-W.K., visualization, writing- reviewing and editing; S.-H.K., S.-H.O., methodology; X.P., Z.W., investigation; J.-H.R., N.K., O-S.K., resources, validation. All authors approved the manuscript.
Peer review
Peer review information
Communications Biology thanks the anonymous reviewers for their contribution to the peer review of this work. Primary Handling Editor: Tobias Goris. A peer review file is available.
Data availability
Uncropped and unedited gel/blot images are provided in the supplementary information file, and source data for the graphs are available in the supplementary data 1. Further information is available from the corresponding author upon reasonable request.
Competing interests
The authors declare no competing interests.
Footnotes
Publisher’s note Springer Nature remains neutral with regard to jurisdictional claims in published maps and institutional affiliations.
Supplementary information
The online version contains supplementary material available at 10.1038/s42003-024-07316-w.
References
- 1.Foger-Samwald, U., Dovjak, P., Azizi-Semrad, U., Kerschan-Schindl, K. & Pietschmann, P. Osteoporosis: pathophysiology and therapeutic options. EXCLI J.19, 1017–1037 (2020). [DOI] [PMC free article] [PubMed] [Google Scholar]
- 2.Xing, L., Xiu, Y. & Boyce, B. F. Osteoclast fusion and regulation by RANKL-dependent and independent factors. World J. Orthop.3, 212–222 (2012). [DOI] [PMC free article] [PubMed] [Google Scholar]
- 3.Chen, X. J. et al. Polydatin promotes the osteogenic differentiation of human bone mesenchymal stem cells by activating the BMP2-Wnt/beta-catenin signaling pathway. Biomed. Pharmacother.112, 108746 (2019). [DOI] [PubMed] [Google Scholar]
- 4.Takeno, A., Kanazawa, I., Notsu, M., Tanaka, K. I. & Sugimoto, T. Inhibition of adenosine monophosphate-activated protein kinase suppresses bone morphogenetic protein-2-induced mineralization of osteoblasts via Smad-independent mechanisms. Endocr. J.65, 291–298 (2018). [DOI] [PubMed] [Google Scholar]
- 5.Sanchez-Duffhues, G., Hiepen, C., Knaus, P. & Ten Dijke, P. Bone morphogenetic protein signaling in bone homeostasis. Bone80, 43–59 (2015). [DOI] [PubMed] [Google Scholar]
- 6.Zhai, Z. et al. High glucose inhibits osteogenic differentiation of bone marrow mesenchymal stem cells via regulating miR-493-5p/ZEB2 signalling. J. Biochem.167, 613–621 (2020). [DOI] [PubMed] [Google Scholar]
- 7.Hofbauer, L. C., Brueck, C. C., Singh, S. K. & Dobnig, H. Osteoporosis in patients with diabetes mellitus. J. Bone Miner. Res.22, 1317–1328 (2007). [DOI] [PubMed] [Google Scholar]
- 8.Zhang, M., Yang, B., Peng, S. & Xiao, J. Metformin rescues the impaired osteogenesis differentiation ability of rat adipose-derived stem cells in high glucose by activating autophagy. Stem Cells Dev.30, 1017–1027 (2021). [DOI] [PubMed] [Google Scholar]
- 9.Han, H. S. et al. Effect of Lactobacillus Fermentum as a probiotic agent on bone health in postmenopausal women. J. Bone Metab.29, 225 (2022). [DOI] [PMC free article] [PubMed] [Google Scholar]
- 10.Zhang, L. et al. Gut microbiota and type 2 Diabetes Mellitus: association, mechanism, and translational applications. Mediators Inflamm.2021, 5110276 (2021). [DOI] [PMC free article] [PubMed] [Google Scholar]
- 11.Lin, H. et al. The role of gut microbiota metabolite trimethylamine N-oxide in functional impairment of bone marrow mesenchymal stem cells in osteoporosis disease. Ann.Transl. Med.8, 1009 (2020). [DOI] [PMC free article] [PubMed] [Google Scholar]
- 12.Ballan, R. & Saad, S. M. I. Characteristics of the gut microbiota and potential effects of probiotic supplements in individuals with type 2 diabetes mellitus. Foods10, 2528 (2021). [DOI] [PMC free article] [PubMed] [Google Scholar]
- 13.Koh, A. et al. Microbially produced imidazole propionate impairs insulin signaling through mTORC1. Cell175, 947–961. e917 (2018). [DOI] [PubMed] [Google Scholar]
- 14.Coughlan, K. A., Valentine, R. J., Ruderman, N. B. & Saha, A. K. AMPK activation: a therapeutic target for type 2 diabetes? Diabetes Metab. Syndr. Obes.7, 241–253 (2014). [DOI] [PMC free article] [PubMed] [Google Scholar]
- 15.Ruderman, N. B., Carling, D., Prentki, M. & Cacicedo, J. M. AMPK, insulin resistance, and the metabolic syndrome. J. Clin. Invest.123, 2764–2772 (2013). [DOI] [PMC free article] [PubMed] [Google Scholar]
- 16.Koh, A. et al. Microbial imidazole propionate affects responses to metformin through p38γ-dependent inhibitory AMPK phosphorylation. Cell Metab.32, 643–653.e644 (2020). [DOI] [PMC free article] [PubMed] [Google Scholar]
- 17.Chen, Q. et al. Fate decision of mesenchymal stem cells: adipocytes or osteoblasts? Cell Death Differ.23, 1128–1139 (2016). [DOI] [PMC free article] [PubMed] [Google Scholar]
- 18.Jang, W. G. et al. Metformin induces osteoblast differentiation via orphan nuclear receptor SHP-mediated transactivation of Runx2. Bone48, 885–893 (2011). [DOI] [PubMed] [Google Scholar]
- 19.Wang, Y. G. et al. AMPK promotes osteogenesis and inhibits adipogenesis through AMPK-Gfi1-OPN axis. Cell. Signal.28, 1270–1282 (2016). [DOI] [PubMed] [Google Scholar]
- 20.Chen, S. C. et al. Metformin suppresses adipogenesis through both AMP-activated protein kinase (AMPK)-dependent and AMPK-independent mechanisms. Mol. Cell. Endocrinol.440, 57–68 (2017). [DOI] [PMC free article] [PubMed] [Google Scholar]
- 21.Roager, H. & Dragsted, L. Diet‐derived microbial metabolites in health and disease. Nutr. Bull.44, 216–227 (2019). [Google Scholar]
- 22.Heiss, C. N. & Olofsson, L. E. The role of the gut microbiota in development, function and disorders of the central nervous system and the enteric nervous system. J. Neuroendocrinol.31, e12684 (2019). [DOI] [PubMed] [Google Scholar]
- 23.Gayatri, M. B., Gajula, N. N., Chava, S. & Reddy, A. B. High glutamine suppresses osteogenesis through mTORC1-mediated inhibition of the mTORC2/AKT-473/RUNX2 axis. Cell Death Discov.8, 277 (2022). [DOI] [PMC free article] [PubMed] [Google Scholar]
- 24.He, C., Liu, M., Ding, Q., Yang, F. & Xu, T. Upregulated miR-9-5p inhibits osteogenic differentiation of bone marrow mesenchymal stem cells under high glucose treatment. J. Bone Miner. Metab.40, 208–219 (2022). [DOI] [PubMed] [Google Scholar]
- 25.Lucas, S. et al. Short-chain fatty acids regulate systemic bone mass and protect from pathological bone loss. Nat. Commun.9, 55 (2018). [DOI] [PMC free article] [PubMed] [Google Scholar]
- 26.Tyagi, A. M. et al. The microbial metabolite butyrate stimulates bone formation via T regulatory cell-mediated regulation of WNT10B expression. Immunity.49, 1116–1131.e1117 (2018). [DOI] [PMC free article] [PubMed] [Google Scholar]
- 27.Ao, Q. et al. Fibrin glue/fibronectin/heparin-based delivery system of BMP2 induces osteogenesis in MC3T3-E1 cells and bone formation in rat calvarial critical-sized defects. ACS Appl. Mater. Interfaces12, 13400–13410 (2020). [DOI] [PubMed] [Google Scholar]
- 28.Xing, L., Schwarz, E. M. & Boyce, B. F. Osteoclast precursors, RANKL/RANK, and immunology. Immunol. Rev.208, 19–29 (2005). [DOI] [PubMed] [Google Scholar]
- 29.Sun, X. et al. Focal adhesion kinase promotes BMP2-induced osteogenic differentiation of human urinary stem cells via AMPK and Wnt signaling pathways. J. Cell Physiol.235, 4954–4964 (2020). [DOI] [PubMed] [Google Scholar]
- 30.Shah, M. et al. AMP-activated protein kinase (AMPK) activation regulates in vitro bone formation and bone mass. Bone47, 309–319 (2010). [DOI] [PMC free article] [PubMed] [Google Scholar]
- 31.Jeyabalan, J., Shah, M., Viollet, B. & Chenu, C. AMP-activated protein kinase pathway and bone metabolism. J. Endocrinol.212, 277–290 (2012). [DOI] [PubMed] [Google Scholar]
- 32.Räkel, A., Sheehy, O., Rahme, E. & LeLorier, J. Osteoporosis among patients with type 1 and type 2 diabetes. Diabetes Metab.34, 193–205 (2008). [DOI] [PubMed] [Google Scholar]
- 33.Zaki, M. K., Abed, M. N. & Alassaf, F. A. Antidiabetic agents and bone quality: a focus on glycation end products and incretin pathway modulations. J. Bone Metab.31, 169–181 (2024). [DOI] [PMC free article] [PubMed] [Google Scholar]
- 34.Ma, J., Zhang, Z., Hu, X., Wang, X. & Chen, A. Metformin promotes differentiation of human bone marrow derived mesenchymal stem cells into osteoblast via GSK3β inhibition. Eur. Rev. Med. Pharmacol. Sci.22, 7962–7968 (2018). [DOI] [PubMed] [Google Scholar]
- 35.Nordklint, A. K. et al. The effect of metformin versus placebo in combination with insulin analogues on bone mineral density and trabecular bone score in patients with type 2 diabetes mellitus: a randomized placebo-controlled trial. Osteoporos Int.29, 2517–2526 (2018). [DOI] [PubMed] [Google Scholar]
- 36.Jeyabalan, J. et al. The anti-diabetic drug metformin does not affect bone mass in vivo or fracture healing. Osteoporosis Int.24, 2659–2670 (2013). [DOI] [PMC free article] [PubMed] [Google Scholar]
- 37.Jeong, B. C., Oh, S. H., Lee, M. N. & Koh, J. T. Macrophage-stimulating protein enhances osteoblastic differentiation via the recepteur d’origine nantais receptor and extracellular signal-regulated kinase signaling pathway. J. Bone Metab.27, 267 (2020). [DOI] [PMC free article] [PubMed] [Google Scholar]
Associated Data
This section collects any data citations, data availability statements, or supplementary materials included in this article.
Supplementary Materials
Description of Additional Supplementary Files
Data Availability Statement
Uncropped and unedited gel/blot images are provided in the supplementary information file, and source data for the graphs are available in the supplementary data 1. Further information is available from the corresponding author upon reasonable request.


