

ABSTRACT
Uveal melanoma (UM) is an aggressive intraocular malignancy derived from melanocytes in the uvea tract of the eye. Up to 50% of patients with UM develop distant metastases which is usually fatal within one year; preventing metastases is therefore essential. Metabolic reprogramming plays a critical role in UM progression and metastasis. However, the metabolic phenotype of UM cells in the hypoxic tumor is not well understood. Here, we report that hypoxia-induced BNIP3 reprograms tumor cell metabolism, promoting their survival and metastasis. In response to hypoxia, BNIP3-mediated mitophagy alleviates mitochondrial dysfunction and enhances mitochondrial oxidative phosphorylation (OXPHOS) while simultaneously reducing mitochondrial reactive oxygen species (mtROS) production. This, in turn, impairs HIF1A/HIF-1α protein stability and inhibits glycolysis. Inhibition of mitophagy significantly suppresses BNIP3-induced UM progression and metastasis in vitro and in vivo. Collectively, these observations demonstrate a novel mechanism whereby BNIP3 promotes UM metabolic reprogramming and malignant progression by mediating hypoxia-induced mitophagy and suggest that BNIP3 could be an important therapeutic target to prevent metastasis in patients with UM.
Abbreviations: AOD: average optical density; BNIP3: BCL2/adenovirus E1B interacting protein 3; CQ: chloroquine; CoCl2: cobalt chloride; GEPIA: Gene Expression Profiling Interactive Analysis; HIF1A: hypoxia inducible factor 1, alpha subunit; IHC: immunohistochemistry; mtROS: mitochondrial reactive oxygen species; NAC: N-acetylcysteine; OCR: oxygen consumption rate; OXPHOS: oxidative phosphorylation; ROS: reactive oxygen species; TCGA: The Cancer Genome Atlas; UM: uveal melanoma.
KEYWORDS: BNIP3, glycolysis, HIF1A, mitophagy, oxidative phosphorylation, uveal melanoma
Introduction
Uveal melanoma (UM), the most common primary malignant intraocular tumor in adults, has a remarkably high propensity to metastasize [1]. Although the primary tumor can be effectively treated using therapeutic strategies including surgery, plaque radiotherapy, and proton beam radiation, approximately half of the patients will develop distant metastasis despite treatment of the primary tumor [2]. Nonetheless, only 4% of patients with UM show metastases at initial diagnosis, indicating that patients with UM develop undetectable micro-metastases early during tumorigenesis [3]. The prognosis for patients with metastatic disease is very poor, with overall survival between 3 and 16 months [4]. It is therefore essential to understand the early events that facilitate UM progression and identify molecular biomarkers for metastasis prediction and prognosis for patients diagnosed with UM.
Hypoxia is an important feature of UM and is associated with malignant progression [5]. HIF1A/HIF-1α (hypoxia inducible factor 1, alpha subunit) is substantially expressed in hypoxic regions of UM tumors [6,7] while its inhibition suppresses tumor growth and metastasis in pre-clinical models for UM [6,8]. Prior studies have implicated HIF-regulated angiogenic genes, including VEGF and ANGPTL4, in the promotion of UM tumor growth [6]. However, in addition to tumor-induced angiogenesis, HIFs also regulate genes important for tumor cell metabolism [9]. In this regard, BNIP3 (BCL2/adenovirus E1B interacting protein 3) encodes a BH3-only member of the BCL2 family that contains a hypoxia response element/HRE in its promoter region and is strongly induced by HIF1A [10]. Previous studies have reported that BNIP3 is aberrantly expressed in many tumors, including prostate cancer, non-small cell lung cancer, and cervical cancer [11–13]. In lung cancer, hypoxia-induced BNIP3 regulates tumor progression by influencing tumor cell apoptosis, autophagy, and epithelial-to-mesenchymal transition/EMT [14]. BNIP3 has been reported to be associated with deeper scleral invasion and poor prognosis in patients with UM [15]. However, the underlying mechanism(s) whereby BNIP3 promotes tumor progression in patients with UM are still unknown.
Metabolic reprogramming, especially the alteration of tumor cell energy metabolism, is a hallmark of malignant tumors [16,17]. The most extensively investigated metabolic alteration in cancer cells, the Warburg effect (also called aerobic glycolysis), is characterized by the preferential use of glycolysis over mitochondrial oxidative phosphorylation (OXPHOS) by tumor cells despite the presence of oxygen. Although Warburg initially proposed that this phenomenon is caused by impaired mitochondrial function [18], emerging evidence suggests that a majority of tumor cells retain mitochondrial function under hypoxic conditions [19]. Rather, in aggressive tumor cells mitochondrial metabolism is reprogrammed to meet their high energy demands [20]. The mixed glycolysis-OXPHOS phenotype allows for cancer cell metabolic flexibility [21]. Previous studies have shown that UM tumor cells exhibit high OXPHOS gene expression levels suggesting that elevated mitochondrial metabolism may play an important role in UM metastasis [22].
Selective autophagy of mitochondria, known as mitophagy, has emerged as a key regulator of cellular energy metabolism [23]. Mitophagy can facilitate metabolic shifts by regulating mitochondrial dynamics [24]. BNIP3 is a mitophagy receptor, which directly interacts with the LC3 protein through the conserved LC3-interacting region/LIR motif and stimulates mitophagy [25]. In this study, we use a combination of in vitro and in vivo approaches to evaluate how BNIP3 reprograms UM tumor cell metabolism in hypoxia, thereby promoting UM progression and metastasis. We demonstrate that the altered metabolic phenotype of UM tumor cells is induced by BNIP3-mediated mitophagy. These results provide new insights into the mechanism of UM development and metastasis and identify BNIP3 as a potential prognostic marker and therapeutic target for the treatment of patients with UM.
Results
BNIP3 positively correlates with HIF1A expression and predicts poor prognosis in UM patients
To investigate the role of BNIP3 in patients with uveal melanoma, we first analyzed the Uveal Melanoma cohort from The Cancer Genome Atlas (TCGA) by Gene Expression Profiling Interactive Analysis (GEPIA) and UALCAN. The results showed that high BNIP3 mRNA expression predicted shorter disease-free survival (Figure 1A). The mRNA level of BNIP3 was positively associated with the mRNA expression of the transcription factor, HIF1A (Figure 1B). We then assessed the association of BNIP3 and HIF1A expression with tumor stage and found that the expression of BNIP3 and HIF1A may be associated during the transition from stage 3 to stage 4 (Figure S1A-B).
Figure 1.
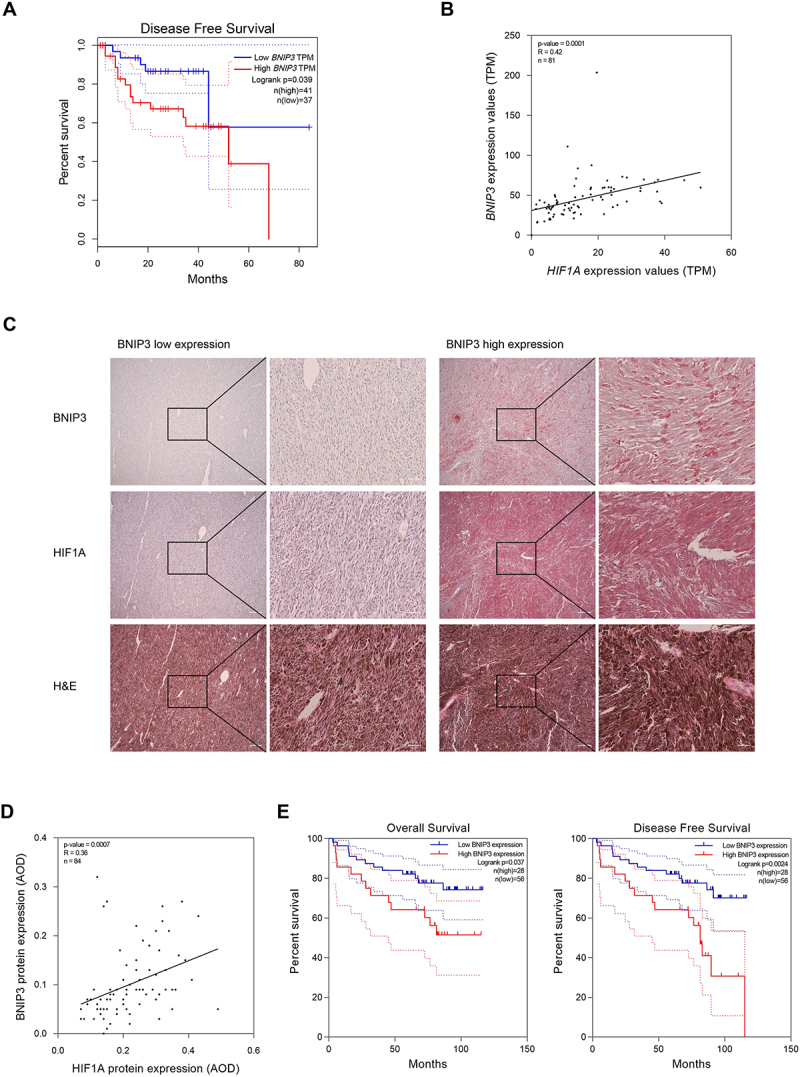
BNIP3 positively correlates with HIF1A expression and predicts poor prognosis in UM patients. (A) disease-free survival curve of BNIP3 expression in UM patients analyzed by GEPIA. B) correlation analysis between BNIP3 and HIF1A mRNA expression in human UM tissues was performed by UALCAN. Pearson’s correlation coefficient (R) and p values are indicated. (C) Representative images of hematoxylin and eosin (H&E) and IHC staining of BNIP3 and HIF1A in human UM tissues. Scale bar: 200 μm (left), 50 μm (right). (D) BNIP3 and HIF1A protein expression was determined by IHC and quantified as the average optical density (AOD) using ImageJ software and color deconvolution plugin. Pearson’s test was used to analyze the correlation between BNIP3 and HIF1A protein expression in human UM tissues. Pearson’s correlation coefficient (R) and p values are indicated. (E) Kaplan – Meier survival analysis of overall survival and disease-free survival by BNIP3 protein expression in human UM tissues.
To substantiate the TCGA analyses at the protein level, immunohistochemical (IHC) staining was performed on 84 paraffin-embedded clinical samples (Figure 1C). Protein expression of BNIP3 was closely associated with that of HIF1A in UM patients (Figure 1D). Furthermore, an analysis of BNIP3 expression and clinicopathological parameters showed that high BNIP3 expression was significantly correlated with distant metastasis (Table 1). Kaplan – Meier curves revealed high BNIP3 expression predicted shorter overall survival and disease-free survival in UM patients (Figure 1E). Collectively, these observations demonstrate that BNIP3 mRNA and protein expression positively correlates with that of HIF1A in human UM tissues and that higher BNIP3 expression predicts a poor prognosis.
Table 1.
Correlation between BNIP3 expression and clinicopathological features of 84 UM patients.
| Characteristics | Number | BNIP3 expression |
p valuea | |
|---|---|---|---|---|
| High | Low | |||
| Age (years) | ||||
| <50 | 39 | 15 | 24 | 0.353 |
| ≥50 | 45 | 13 | 32 | |
| Gender | ||||
| Male | 33 | 9 | 24 | 0.343 |
| Female | 51 | 19 | 32 | |
| Histological typeb | ||||
| Spindle | 41 | 11 | 30 | 0.189 |
| Epitheloid and Mixed | 42 | 17 | 25 | |
| Tumor size (mm) | ||||
| <15 | 59 | 19 | 40 | 0.736 |
| ≥15 | 25 | 9 | 16 | |
| Distant metastasis | ||||
| Present | 31 | 17 | 14 | 0.001*** |
| Absent | 53 | 11 | 42 | |
| Status | ||||
| Alive | 58 | 15 | 43 | 0.030* |
| Dead | 26 | 13 | 13 | |
aPearson chi-squared test; b, cell type was not determined in one sample due to a high degree of cell dedifferentiation and necrosis. Tumor size was defined as the largest basal diameter.
Hypoxia induces BNIP3 expression in UM cells through HIF1A
Hypoxia is a key feature of UM, which is associated with a poor prognosis in patients with UM [26]. It has been reported that BNIP3 is a stress sensor protein that is strongly induced by hypoxia [27]. To examine whether hypoxia can induce BNIP3 expression in UM, we cultured UM tumor cells in 1% oxygen or in the presence of cobalt chloride (CoCl2), a hypoxia-mimetic agent [28], and measured the expression of BNIP3 mRNA and protein by qPCR and western blot analysis, respectively. Expression of BNIP3 was markedly increased under hypoxic conditions (Figure 2A–D and Figure S2A-B). Moreover, knockdown of HIF1A mRNA expression using two small interfering RNAs (siHIF1A#1 and siHIF1A#2) abrogated hypoxia-induced BNIP3 expression in UM tumor cells (Figure 2E,F and Figure S2C). Under normoxia, HIF1A was not expressed, and knocking down HIF1A did not affect BNIP3 expression (Figure S2D-E). Taken together, these data demonstrated that hypoxia induces BNIP3 expression in a HIF1A-dependent manner in UM tumor cells.
Figure 2.

Hypoxia induces BNIP3 expression in UM cells through HIF1A. (A) qPCR analysis of BNIP3 mRNA expression in UM cells treated with or without 1% O2 for 24 h. (B) Western blot analysis of HIF1A and BNIP3 protein levels in UM cells with or without 1% O2 for 24 h. (C) qPCR analysis of BNIP3 mRNA expression in UM cells treated with or without CoCl2 for 24 h. (D) Western blot analysis of HIF1A and BNIP3 protein levels in UM cells with or without CoCl2 for 24 h. (E) qPCR analysis of HIF1A and BNIP3 mRNA expression in UM cells transfected with two independent HIF1A siRnas, siHIF1A#1 and siHIF1A#2. Cells were exposed to 1% O2 for 24 h. (F) Western blot analysis of HIF1A and BNIP3 protein levels in UM cells transfected with siHIF1A#1 and siHIF1A#2. Cells were exposed to 1% O2 for 24 h. N, normoxia. H, hypoxia.
BNIP3 is located in the mitochondria and nucleus in human UM tumor cells
To examine the expression of BNIP3 in UM tumor cells, we evaluated the mRNA and protein expression of BNIP3 in four human UM cell lines OCM1, OMM1, 92.1, and Mel285. OCM1 cells showed higher BNIP3 expression compared to OMM1, 92.1 and Mel285, whereas 92.1 showed the lowest BNIP3 expression levels (Figure S3A-B). Thus, OCM1 and 92.1 cells were used in subsequent studies. To examine the subcellular localization of BNIP3 in UM cells, we performed western blot analysis on cellular subfractions and observed that BNIP3 expression mainly localized to the mitochondria and nucleus of UM tumor cells (Figure S3C). This observation was corroborated using immunofluorescence assays (Figure S3D). These results demonstrate that BNIP3 is located in both the mitochondria and nucleus of human UM tumor cells. Hypoxia significantly increased BNIP3 colocalization with the mitochondria and did not affect BNIP3 nuclear colocalization (Figure S3D).
BNIP3 promotes the survival and metastasis of UM cells under hypoxic conditions
To explore the potential functional roles of BNIP3 in UM cells, we next knocked out BNIP3 expression in OCM1 cells using CRISPR-Cas9 (BNIP3 KO1 and BNIP3 KO2) or overexpressed BNIP3 in 92.1 cells (BNIP3 OE). Successful BNIP3 knockout and overexpression in UM cells were confirmed by qPCR and western blot analysis (Figure S4A-B). To assess the effects of BNIP3 on cell proliferation, we used the CCK8 assay, EdU, and colony formation assays and observed that BNIP3 did not affect UM tumor cell proliferation under normoxic conditions (Figure S4C-E).
To determine if BNIP3 affects UM tumor cells under external stress, we evaluated the effect of BNIP3 expression on apoptosis under hypoxic conditions. In cells cultured in 1% O2, BNIP3 knockout in OCM1 cells significantly increased the apoptosis rate compared with control groups. Conversely, 92.1 cells displayed a lower apoptosis rate after BNIP3 overexpression (Figure 3A,B). Accordingly, protein expression of apoptosis markers, cleaved PARP and cleaved CASP3 (caspase 3), were upregulated in OCM1 cells with BNIP3 knockout and downregulated in 92.1 cells after BNIP3 overexpression under hypoxic conditions (Figure 3C,D).
Figure 3.
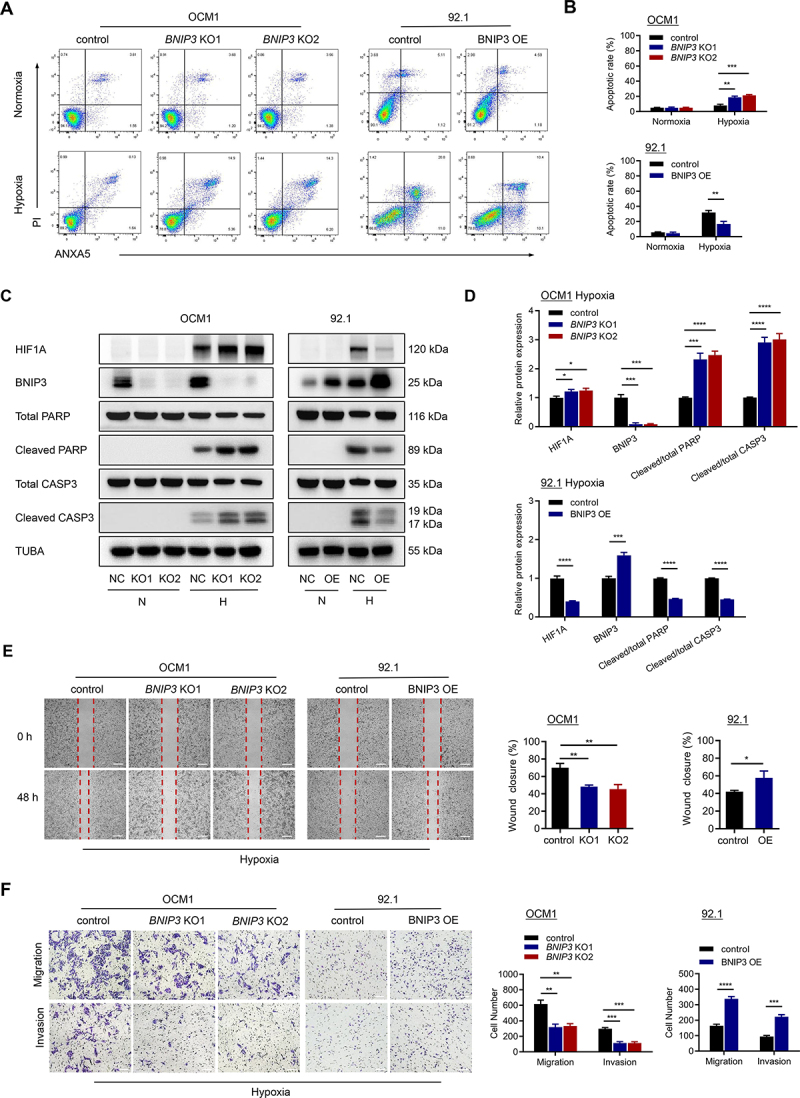
BNIP3 promotes the survival and metastasis of UM cells under hypoxic conditions. (A-B) flow cytometry showing the apoptotic rate of cells stained with ANXA5/annexin V-APC-PI following 24 h of treatment with or without 1% O2. Representative plots (A) and quantification (B) are shown. (C) Western blots of apoptosis markers in UM cells treated with or without 1% O2 for 24 h. N, normoxia. H, hypoxia. (D) quantification analysis of the western blot image shown in (C) using ImageJ software. (E) Representative images (left) and quantification (right) of the wound healing assay. Scale bar: 200 μm. (F) Representative images (left) and quantification (right) of the migration and invasion assay. Scale bar: 100 μm.
We next examined wound healing, transwell migration, and matrigel invasion assays to explore whether BNIP3 expression influences UM tumor cell migration and invasion in hypoxia. BNIP3 knockout significantly weakened the migration and invasion of OCM1 cells, while overexpression of BNIP3 enhanced the migration and invasion ability of 92.1 cells cultured in 1% O2 (Figure 3E,F). Collectively, these results suggest that BNIP3 enhances UM tumor cell survival under hypoxic conditions and may further promote UM metastasis.
BNIP3 reprograms metabolism in UM tumor cells cultured in hypoxia
Emerging studies demonstrate that metabolic reprogramming of UM tumor cells contributes to tumor progression and metastasis [22]. BNIP3 has previously been implicated in tumor cell metabolism [29]. We therefore next examined whether BNIP3 could regulate the energy metabolism of UM tumor cells under hypoxic conditions. To this end, we measured mitochondrial respiration with a Seahorse XF96 analyzer and observed that basal respiration and ATP production were decreased in BNIP3 KO OCM1 cells but remarkably increased in BNIP3 OE 92.1 cells (Figure 4A,C), consistent with a role for BNIP3 in promoting mitochondrial respiration in UM tumor cells. Using the Seahorse XF Glycolytic Rate Assay, we further observed that BNIP3 knockout markedly increased basal glycolysis and compensatory glycolysis in the OCM1 cell lines (Figure 4B,D). Conversely, BNIP3 overexpression led to a significant reduction in basal glycolysis and compensatory glycolysis in 92.1 cell lines. In addition, BNIP3 knockout in OCM1 cells dramatically promoted glucose uptake and lactate production under hypoxic conditions, while BNIP3 OE 92.1 cells displayed significantly decreased glucose uptake and lactate production in comparison with their respective control tumor cell lines (Figure 4E,F). These results suggest that BNIP3 upregulates oxidative metabolism and inhibits glycolytic metabolism in hypoxic UM tumor cells.
Figure 4.

BNIP3 reprograms metabolism in UM tumor cells cultured in hypoxia. (A) the oxygen consumption rate (OCR) was detected by the seahorse XF cell mito stress test. (B) glycolytic proton efflux rate (glycoPER) was detected by the seahorse XF glycolytic rate assay kit. (C) the calculated OCR for basal respiration and ATP production. (D) the calculated glycoPER for basal glycolysis and compensatory glycolysis. (E) glucose uptake was measured in UM cells cultured in normoxia or hypoxia (1% O2) for 24 h.(F) lactate production was measured in UM cells cultured in normoxia or hypoxia (1% O2) for 24 h.
BNIP3 mediates hypoxia-induced mitophagy and alleviates mitochondrial dysfunction
Mitochondrial quality control is essential for OXPHOS function. Mitophagy is a vital process that removes dysfunctional or excess mitochondria to maintain mitochondrial quality control and mitochondrial reactive oxygen species (mtROS) balance [30]. Accumulating evidence has shown that BNIP3 can strengthen the overall function of mitochondria and maintain mitochondrial homeostasis through its regulation of mitophagy [31]. We therefore next examined whether BNIP3 regulates mitochondrial metabolism in UM tumor cells cultured in hypoxia by influencing mitophagy. Mitophagy was monitored by detecting the expression of mitophagy-related proteins. Expression of LC3B-II was increased, whereas the expression of SQSTM1/p62 and two mitochondrial proteins, TIMM23 and TOMM20, were decreased in a time-dependent manner in UM tumor cells cultured in hypoxia (Figure S5A). To evaluate the Mitophagy flux, we treated UM cells with chloroquine (CQ), a drug that prevents autophagosome-lysosome fusion and degradation (Figure S5B). Hypoxia-induced degradation of the mitochondrial proteins TIMM23 and TOMM20 could be inhibited by CQ. Additionally, LC3B-II and SQSTM1 expression were increased in UM cells cultured in hypoxia after CQ treatment. These results suggest that hypoxia can induce mitophagy in UM tumor cells. Knocking out BNIP3 significantly decreased the expression of autophagy marker LC3B-II and increased the expression of mitophagy-related proteins SQSTM1, TIMM23, and TOMM20 in OCM1 cells. Conversely, BNIP3 overexpression had the opposite effect in 92.1 cells cultured in hypoxia (Figure 5A and Figure S5C). In the presence of CQ, the expression of TIMM23, TOMM20, SQSTM1 and LC3B-II were decreased in BNIP3 KO OCM1 cells and increased in BNIP3 OE 92.1 cells compared to control cells, indicating that BNIP3 increases mitophagy flux in UM cells (Figure 5B and Figure S5D). Transmission electron microscopy/TEM analysis demonstrated that BNIP3 KO OCM1 cells exhibited less mitophagosomes compared with control cells, while overexpression of BNIP3 resulted in an increased number of mitophagosomes in 92.1 cells cultured in hypoxia (Figure 5C). Mitophagosomes were defined as initial autophagic vacuoles-like structures engulfing or containing abnormal mitochondria. We also utilized mitochondria-targeted Keima (mito-Keima) probe to monitor mitophagy. Mito-Keima, a pH-sensitive fluorescent protein located in mitochondria, is excited by 440-nm light (green) when it accumulates in cytoplasm and excited by 550-nm light (red) in lysosomes. A color shift from green to red indicates mitophagy activation [32]. Knocking out BNIP3 resulted in a decreased red:green fluorescence ratio in OCM1 cells, while overexpression of BNIP3 increased the red:green fluorescence ratio in 92.1 cells (Figure 5D). Decreased colocalization of LC3B and TOMM20 in BNIP3 KO OCM1 cells, and increased colocalization of LC3B with TOMM20 in the BNIP3 OE 92.1 cells further confirm a role for BNIP3 in mitophagy in UM tumor cells (Figure S5E).
Figure 5.

BNIP3 mediates hypoxia-induced mitophagy. (A) Western blots of TIMM23, TOMM20, SQSTM1, and LC3B proteins in UM cells in hypoxia (24 h). (B) Western blots of UM cells treated with or without hypoxia for 24 h in the presence or absence of CQ. (C) mitophagosomes were observed by transmission electron microscopy in UM cells cultured under hypoxia for 24 h and then treated with CQ for 1 h. Representative images (upper) and quantification (lower) are shown. Scale bar: 0.5 μm. (D) Representative images of mito‐Keima. UM cells were exposed to hypoxia for 24 h and then incubated with CQ for 1 h. Quantification of red:green fluorescence intensity ratio was analyzed by ImageJ. Scale bar: 10 μm.
We next examined mitochondrial membrane potential/MMP and ROS production to evaluate mitochondrial function in UM tumor cells cultured in hypoxia. Mitochondrial membrane potential was detected by JC-1 staining. As shown in Figure 6A, BNIP3 decreased the mitochondrial depolarization in OCM1 and 92.1 cells under hypoxia. DCFH-DA probes were used to measure the levels of intracellular ROS, and MitoSOX probes were used to evaluate the levels of mitochondrial ROS in UM cells (Figure 6B,C). Results showed that BNIP3 markedly suppressed intracellular and mitochondrial ROS production. Taken together, BNIP3 increased hypoxia-induced mitophagy and ameliorated mitochondrial dysfunction.
Figure 6.

BNIP3 alleviates mitochondrial dysfunction under hypoxia. (A) the mitochondrial membrane potential was detected by flow cytometry following JC-1 staining. An increase in the green:red ratio indicates mitochondrial depolarization. UM cells were cultured in hypoxia (1% O2) for 24 h. Representative plots (left) and quantification (right) are shown. (B) DCFH-DA was used to examine intracellular ROS in UM cells in hypoxia (24 h). Representative flow plots (left) and quantification of MFI (right) are shown. (C) the level of mitochondrial ROS was detected with the MitoSOX probe in UM cells in hypoxia (24 h). Representative flow plots (left) and quantification of MFI (right) are shown. MFI, mean fluorescence intensity.
BNIP3 suppresses glycolysis by impairing the stability of HIF1A
HIF1A can promote glycolysis by upregulation of various glycolytic enzymes in cancer cells [33]. We hypothesized that BNIP3 might inhibit glycolysis by targeting HIF1A in hypoxic UM tumor cells. To test this hypothesis, we examined the expression of HIF1A and its downstream glycolytic targets, including SLC2A1/GLUT1, HK2, LDHA, and PKM/PKM2, in UM cells cultured in hypoxia (1% O2) for 24 h (Figure 7A,B). Both mRNA and protein expression of HIF1A-regulated glycolytic enzymes were upregulated in BNIP3 KO OCM1 cells compared to control cells. Conversely, overexpression of BNIP3 resulted in a marked decrease in the expressions of HIF1A-regulated glycolytic enzymes in 92.1 cells. BNIP3 knockout increased HIF1A protein level while BNIP3 overexpression significantly decreased HIF1A protein expression without affecting HIF1A mRNA levels, suggesting that BNIP3 May regulate HIF1A protein stability. To test this, UM cells were treated with protein synthesis inhibitor, cycloheximide (CHX) (Figure 7C). BNIP3 KO increased the stability of the HIF1A protein. In contrast, BNIP3 overexpression accelerated the degradation of HIF1A protein. We next investigated whether HIF1A mediates the functions of BNIP3 in glycolytic metabolism. siRNA for HIF1A gene was used to reduce HIF1A protein expression (Figure 7D). HIF1A knockdown significantly inhibited BNIP3 downregulation-induced upregulation of glucose uptake and lactate production under hypoxia (Figure 7E,F). These results suggest that BNIP3 suppresses glycolysis by impairing the stability of HIF1A under hypoxia. Interestingly, BNIP3 is also induced by hypoxia as a target of HIF1A, indicating that there is a negative feedback loop between BNIP3 and HIF1A. This negative feedback loop has been previously reported in breast cancer [34], but not in melanoma [35].
Figure 7.
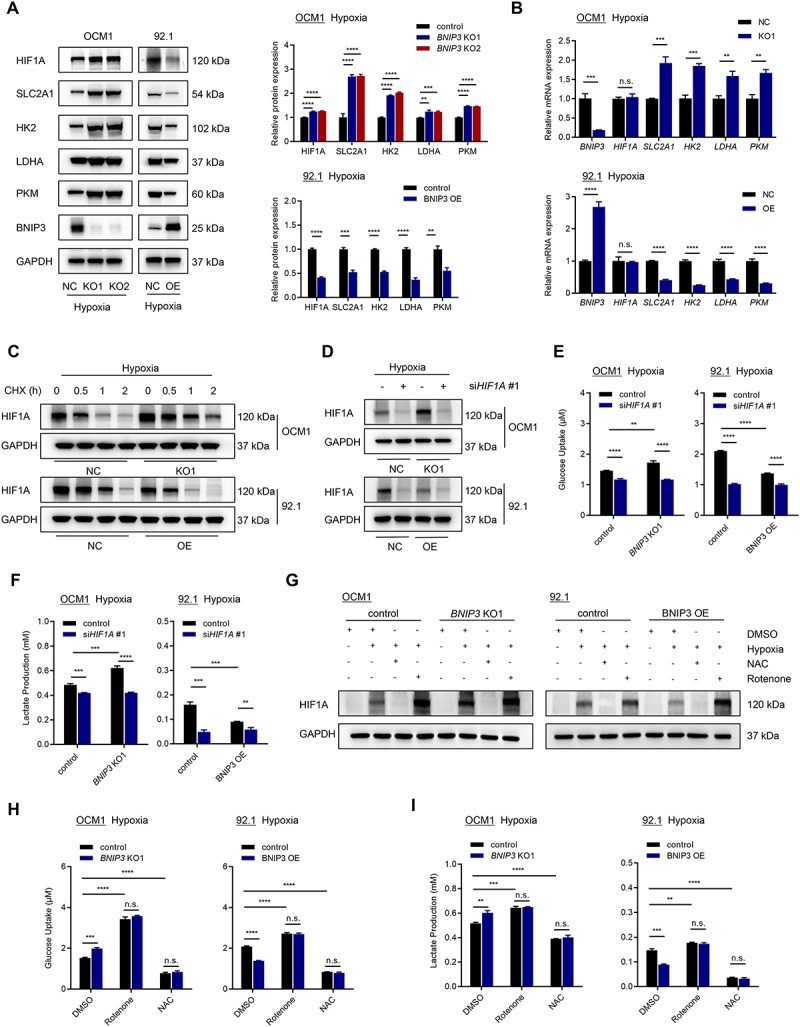
BNIP3 suppresses glycolysis by impairing the stability of HIF1A. (A) Western blots of BNIP3, HIF1A, SLC2A1, HK2, LDHA, and PKM proteins in UM cells in hypoxia (24 h). Representative images (left) and quantification (right) are shown. (B) qPCR analysis of BNIP3, HIF1A, SLC2A1, HK2, LDHA, and PKM mRNA expression in UM cells in hypoxia (24 h). (C) Western blots of HIF1A protein in UM cells cultured in hypoxia for 24 h and treated with CHX as indicated. (D) Western blots of HIF1A protein in UM cells transfected with scrambled or HIF1A siRNAs and cultured in hypoxia (1% O2) for 24 h. (E) glucose uptake was measured in UM cells transfected with scrambled or HIF1A siRNAs and cultured in hypoxia (1% O2) for 24 h. (F) Lactate production was measured in UM cells transfected with scrambled or HIF1A siRNAs and cultured in hypoxia (1% O2) for 24 h. (G) Western blots of HIF1A protein in UM cells cultured in normoxia or hypoxia and treated with DMSO, NAC, or rotenone for 24 h. (H) Glucose uptake was measured in UM cells cultured in hypoxia and treated with DMSO, NAC, or rotenone for 24 h. (I) lactate production was measured in UM cells cultured in hypoxia and treated with DMSO, NAC, or rotenone for 24 h.
BNIP3 regulates HIF1A stability by diminishing mitochondrial ROS production under hypoxia
ROS stabilizes HIF1A in cells cultured in hypoxia [36]. Since BNIP3 influences ROS production, we examined whether HIF1A is regulated by BNIP3 through its effects on ROS production. To assess the role of ROS in HIF1A stability by BNIP3, UM tumor cells were treated with a ROS inducer (rotenone), or ROS scavenger (N-acetylcysteine, NAC) in cells cultured in hypoxia (Figure 7G). Hypoxia-induced HIF1A expression was increased by rotenone treatment and decreased by NAC treatment, consistent with a role for ROS in the stabilization of HIF1A in UM tumor cells. Treatment with rotenone further promoted lactate production and glucose uptake in UM tumor cells cultured in hypoxia, whereas NAC treatment reduced lactate production and glucose uptake (Figure 7H,I). Collectively, these results suggest that BNIP3 suppresses glycolysis through ROS/HIF1A pathway in UM tumor cells cultured in hypoxia.
BNIP3-mediated mitophagy promotes survival and metastasis of hypoxic UM tumor cells
To evaluate the function of BNIP3-mediated mitophagy in UM tumor cells cultured in hypoxia, we incubated UM tumor cells with CQ to block mitophagy, and measured apoptosis (by flow cytometry), and cell migration and invasion (by transwell assay). Treatment with CQ significantly reversed BNIP3-induced cell survival (Figure 8A,B) and metastasis (Figure 8C,D) under hypoxia. These results suggest that BNIP3 promotes the malignant progression of hypoxic UM cells by activating mitophagy.
Figure 8.
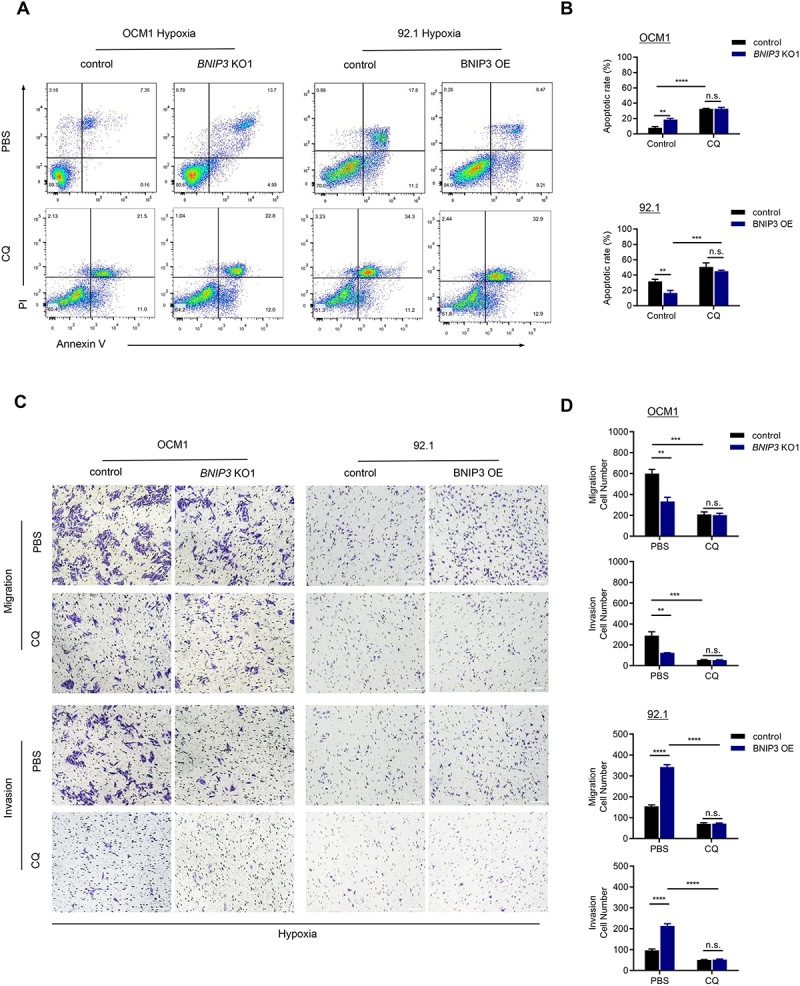
BNIP3-mediated mitophagy promotes survival and metastasis of hypoxic UM tumor cells. (A-B) the apoptotic rate of UM cells was assessed by flow cytometry after 24 h of treatment with 1% O2 in the presence or absence of CQ. Representative plots (A) and quantification (B) are shown. (C-D) Representative images (C) and quantification (D) of the migration and invasion assay. UM cells were exposed to hypoxia for 24 h in the presence or absence of CQ. Scale bar: 100 μm.
BNIP3 promotes the growth and metastasis of UM cells in vivo
We next set out to investigate the biological function of BNIP3 on UM tumor growth in vivo. To this end, xenograft experiments were performed by inoculating UM tumor cells into the suprachoroidal space of nude mice. BNIP3 knockout significantly reduced tumor growth in OCM1 cell mouse models (Figure 9A-D). Conversely, BNIP3 overexpression remarkably accelerated tumor growth in 92.1 cell mouse models. CQ treatment inhibited BNIP3-mediated tumor growth in UM xenografts. The expressions of BNIP3, LC3B, and MKI67/Ki67 were detected in orthotopic xenograft tumor tissues (Figure 9E,F and Figure S6A-B). LC3B and MKI67 expression were increased in the BNIP3 high-expression group; this effect was reversed by CQ treatment, consistent with our observations in vitro.
Figure 9.

BNIP3 promotes the growth and metastasis of UM cells in vivo. (A-D) Representative bioluminescence images (A-B) and statistical analysis (C-D) of UM orthotopic xenografts. (E-F) Representative IHC staining images of BNIP3, LC3B, and MKI67 in orthotopic xenografts. Scale bar: 50 μm. (G-H) Representative bioluminescence images of the liver metastasis mouse model. (I-J) Kaplan – Meier survival curves of the liver metastasis mouse model. n = 6 per group.
We next established an intrasplenic injection model to evaluate liver metastasis of UM tumor cells. BNIP3 expression promoted UM liver metastasis and reduced animal survival (Figure 9G-J and Figure S6C-D) while CQ treatment decreased BNIP3-mediated liver metastasis and prolonged survival. Collectively, these animal studies support our in vitro assays and demonstrate a central role of BNIP3-mediated mitophagy in UM tumor growth and metastasis.
Discussion
Considerable evidence points to a critical role of energy metabolism reprogramming as a driver of tumor initiation and malignant progression [37–39]. Tumor cells flexibly adjust energy metabolism to adapt to different survival pressures of a changing tumor microenvironment [40,41]. This is exemplified by the Warburg effect, in which hypoxia enhances glycolysis and inhibits OXPHOS, to facilitate the tumor cell growth [36,42]. Interestingly, in UM, the most common primary intraocular cancer in adults, oncogenic Gq/11 signaling increases both glycolysis and OXPHOS rather than attenuates OXPHOS, suggesting that UM lacks a classical Warburg effect [43]. This raises questions regarding how UM tumor cells regulate their metabolism during tumor growth and progression.
Recent studies suggest that the metabolic shift from glycolysis to mitochondrial OXPHOS also plays an important role in cancer metastasis [44–46]. In breast cancer, for example, this metabolic shift occurs in the early stages of lymph node metastasis [47]. Invasive cancer cells often enhance mitochondrial respiration to meet the increased energy demands required for trafficking to distal tissues [48]. Hematogenous metastasis to the liver is the main cause of poor prognosis and death in patients with UM [4]. However, how UM tumor cells adjust to the increased metabolic demand required for hematogenous metastasis is not clear.
In this regard, emerging evidence implicate BNIP3 as a key player in carcinogenesis and tumor growth and metastasis in many cancers [49,50]. The regulation and function of BNIP3 can be inconsistent among different cancers and is dependent on the specific tumor type. In colorectal and pancreatic cancers, for example, BNIP3 is epigenetically silenced by promoter hypermethylation, and its downregulation contributes to chemoresistance and a poor prognosis [51,52]. Conversely, in cervical cancer BNIP3 expression is increased and correlates with more advanced tumor stages [13]. Increased expression of BNIP3 in UM tumor cells has previously been reported [15]. However, the role of BNIP3 in UM tumorigenesis has not been adequately explored.
In the present study, we demonstrate that increased expression of BNIP3 is associated with distant metastasis and an unfavorable prognosis in patients with UM. Expression of BNIP3 in UM tumor cells is increased by hypoxia, and is dependent on the transcription factor, HIF1A. BNIP3 positively correlated with HIF1A expression in human tissue. Moreover, hypoxia-induced BNIP3 markedly improved OXPHOS and suppressed glycolysis in UM tumor cells, implying that BNIP3-mediated OXPHOS may contribute to UM early metastasis. These observations further suggest that mitochondrial metabolism may play an important role in the malignant progression of UM. Consistent with this hypothesis, studies in multiple tumor mouse models have shown that defects in mitophagy can cause tumor regression [53]. Collectively, these results suggest that targeting BNIP3-regulated mitochondrial metabolism may be a promising strategy for UM treatment.
We further report the underlying mechanism whereby BNIP3 regulates the energy metabolism of hypoxic UM tumor cells. BNIP3 is localized in the mitochondrial outer membrane via its TM domain and interacts with LC3 on autophagosome to mediate mitophagy [31], an important mechanism for tumor metabolic remodeling [23]. In the MMTV-PyMT mammary tumor model, loss of BNIP3 reduced mitophagy, increased ROS, stabilized HIF1A, promoted aerobic glycolysis and mammary tumor progression to metastasis [34]. Silencing BNIP3 was previously reported to exacerbate PHD2-mediated HIF1A downregulation in dermal melanoma [35]. However, our data in UM suggest that HIF1A‐induced BNIP3 mediates mitophagy, alleviates mitochondrial damage and promotes OXPHOS in UM tumor cells. Elevated BNIP3 reduces mtROS accumulation and promotes HIF1A protein degradation, thereby suppressing glycolysis overactivation under hypoxia. This suggests that there exists a HIF1A-BNIP3-ROS negative feedback loop in UM tumor cells. This bidirectional loop between BNIP3 and HIF1A is unique from that found in melanoma and may help contribute to the differences in the biological features between UM and dermal melanoma.
The role of mitophagy in tumor progression remains poorly understood, and appears to depend on the type (and stage) of tumor [54]. Under physiological conditions, mitophagy plays tumor suppressor functions by clearing depolarized mitochondria [55]. During tumor progression, mitophagy deficiency has been reported to promote breast cancer bone metastasis during hypoxia [56]. Conversely, in hepatocellular carcinoma, PINK1-dependent mitophagy activation potentiates tumor metastasis and chemoresistance [57]. To develop effective targeted therapeutic strategies, these observations suggest that it will be essential to explore the detailed regulatory mechanisms of mitophagy during tumor progression for each specific cancer. We report that inhibition of mitophagy significantly suppressed BNIP3-induced UM progression and metastasis in vitro and in vivo, demonstrating a tumor-promoting role of BNIP3-mediated mitophagy in UM. Collectively, these findings support the development of therapies targeting BNIP3 or mitophagy for the treatment of patients with UM. BNIP3L/NIX is highly homologous to BNIP3 [58]. It can also be transcriptionally upregulated by HIF1A to mediate mitophagy in response to hypoxia [59]. The GEPIA database demonstrates that the mRNA level of BNIP3L is positively associated with the mRNA expression of HIF1A in UM. However, no correlation between mRNA expression and patient survival was observed for BNIP3L in UM. Further research is needed to examine the role of BNIP3L in order to picture a more comprehensive understanding of the molecular mechanisms involved in hypoxia-induced mitophagy in UM.
In summary, we demonstrate that hypoxia-induced BNIP3 reprograms metabolism by regulating mitophagy, thereby promoting UM progression and metastasis. BNIP3-mediated mitophagy alleviated mitochondrial dysfunction, enhancing OXPHOS while reducing mtROS accumulation; the latter, in turn, impairs the stability of HIF1A and inhibits glycolysis by hypoxic tumor cells (Figure 10). Combination inhibitors targeting BNIP3 and mitophagy may therefore be an effective therapeutic strategy for the treatment of patients with UM.
Figure 10.

Schematic diagram of the mechanism by which BNIP3 promotes UM progression and metastasis under hypoxia.
Materials and methods
Antibodies and reagents
The information for all antibodies and reagents is listed in Table 2.
Table 2.
Antibodies or reagents.
| Antibodies or reagents | Source | Catalog number |
|---|---|---|
| Anti-BNIP3 | Cell Signaling Technology | 44060 |
| Anti-HIF1A | Cell Signaling Technology | 36169 |
| Anti-TUBA/tubulin | Proteintech | 66031-1-lg |
| Anti-LMNB1/lamin B1 | Proteintech | 12987-1-AP |
| Anti-ACTB/actin | Cell Signaling Technology | 4970 |
| Anti-ATP5F1A/ATP5A1 | Proteintech | 14676-1-AP |
| Anti-TOMM20 | Proteintech | 66777-1-lg |
| Anti-cleaved CASP3 | Cell Signaling Technology | 9664 |
| Anti-cleaved PARP | Cell Signaling Technology | 5625 |
| Anti-TIMM23 | Proteintech | 11123-1-AP |
| Anti-SQSTM1/p62 | Cell Signaling Technology | 5114 |
| Anti-LC3B | Cell Signaling Technology | 2775 |
| Anti-SLC2A1/GLUT1 | Proteintech | 21829-1-AP |
| Anti-HK2/hexokinase 2 | Proteintech | 66974-1-Ig |
| Anti-LDHA | Proteintech | 19987-1-AP |
| Anti-PKM | Proteintech | 15822-1-AP |
| Anti-GAPDH | Cell Signaling Technology | 5174 |
| Anti-MKI67 | Proteintech | 27309-1-AP |
| Cobalt chloride (CoCl2) | Sigma | C8861 |
| Chloroquine (CQ) | Selleck | S4157 |
| Cycloheximide (CHX) | Selleck | S7418 |
| Rotenone | Selleck | S2348 |
| N-acetylcysteine (NAC) | Selleck | S1623 |
TCGA data analysis
The Uveal Melanoma cohort from The Cancer Genome Atlas (TCGA, https://www.cancer.gov/about-nci/organization/ccg/research/structural-genomics/tcga) was analyzed by the Gene Expression Profiling Interactive Analysis (GEPIA; http://gepia2.cancer-pku.cn) and UALCAN websites (http://ualcan.path.uab.edu).
Human tissue samples
Formalin-fixed paraffin-embedded human uveal melanoma tissue samples were obtained from the Eye & ENT Hospital of Fudan University. All patients signed informed consent and the study was approved by the Ethics Committee of the Eye & ENT Hospital of Fudan University. Detailed clinicopathological characteristics are listed in Table 1.
Histology and immunohistochemistry
Tissues were fixed in 4% paraformaldehyde, paraffin-embedded, and sliced into sections. Hematoxylin and eosin staining were used for histological analysis. For immunohistochemistry (IHC) staining, sections of human uveal melanoma tissues were incubated in 0.1% potassium permanganate solution and 1% oxalic acid solution for depigmentation, following deparaffinization and antigen retrieval. Sections were then blocked, probed with primary antibodies at 4°C overnight, and incubated with SignalStain Boost IHC Detection Reagent (AP, rabbit; Cell Signaling Technology 18,653) at room temperature for 30 min. Staining was visualized using SignalStain Vibrant Red Alkaline Phosphatase Substrate Kit (Cell Signaling Technology 76,713). The average optical density (AOD) of staining was quantified using ImageJ software and Color Deconvolution plugin. BNIP3 AOD ≥ 0.1 was defined as high expression, while < 0.1 was defined as low expression.
Cell culture
All UM cell lines were provided by the Eye & ENT Hospital of Fudan University. Cells were cultured in RPMI 1640 medium (Gibco 11,875,085) supplemented with 10% FBS (Invitrogen 10,099,158), at 37°C with 5% CO2. For hypoxia treatment, cells were incubated under hypoxic conditions with 1% O2, or the hypoxia mimic, cobalt chloride (CoCl2; 200 μM), for 24 h.
Quantitative real-time PCR
Quantitative real-time PCR analysis was performed as described previously [60]. The sequences of primers are shown in Table S1.
Western blot analysis
Western blot analysis was performed as described previously [60].
Transfection and transduction
Short-interfering RNAs (siRNAs) were designed and synthesized by RiboBio (Guangzhou, China). Cell transfection was performed using Lipofectamine 3000 (Invitrogen, L3000008). RNA sequences of siRNAs are listed in Table S2.
BNIP3 knockout CRISPR-Cas9 lentiviruses were constructed by Genomeditech (13700GV-LV). BNIP3 overexpression lentiviruses (LV50121843), mito-Keima adenovirus (AP23092104) and HBLV-ZsGreen-LUC-PURO lentiviruses (LV46081163) were purchased from HanBio. Transduction and establishment of stable cell lines were performed following the manufacturer’s instructions.
Nuclear, cytoplasmic, and mitochondrial fractionation
Nuclear, cytoplasmic, and mitochondrial fractionation was performed using the Nuclear and Cytoplasmic Protein Extraction Kit (Beyotime, P0027) and Cell Mitochondria Isolation Kit (Beyotime, C3601) according to the manufacturer’s protocol.
Immunofluorescence and confocal microscopy
For immunofluorescence detection, cells were fixed in 4% paraformaldehyde for 30 min and then permeabilized with 0.1% Triton X-100 (Beyotime, P0096) for 10 min. After blocking with 1% BSA (Beyotime, ST023) for 1 h, cells were incubated with primary antibodies overnight at 4°C followed by incubation with fluorophore-conjugated secondary antibodies. Nuclei were counterstained with DAPI or Hoechst. Cells were observed using a Zeiss Axio Observer microscope (ZEISS, Jena, Germany) or a Leica TCS SP8 confocal microscope (Leica, Wetzlar, Germany). Colocalization was quantified by ImageJ Coloc2 using Pearson colocalization coefficient (PCC).
Mito-Keima staining for mitophagy
Mitochondria-targeted keima (mito-Keima; HanBio, AP23092104) was used to detect mitophagy. Mito-Keima fluorescence was imaged in two channels via two sequential excitations (440-nm, green; 550-nm, red) and using 620-nm emission. The level of mitophagy was quantified by calculating the ratio of red to green fluorescence intensity using ImageJ software.
CCK-8, colony formation, and EdU incorporation assay
For the Cell Counting Kit-8 (CCK-8; Selleck, B34302) assay, cells were seeded into 96-well plates with 1000 cells/well (in 100 μl medium) and cultured for 0, 24, 48, 72, 96, or 120 h. Ten μl CCK-8 was then added to each well. After 2 h, the absorbance at 450 nm was measured.
For the colony formation assay, 1000 cells were seeded in each well of 6-well plates. After 2 weeks, clones were stained crystal violet (Beyotime, C0121).
EdU Cell Proliferation Kit (Beyotime, C0071) was utilized to measure cell proliferation according to the manufacturer’s manual. Images were taken using a fluorescence microscope.
Apoptosis assays
Apoptosis assays were performed as described previously [60].
Wound healing assay
Wound healing assays were performed to detect cell migration. 3 × 10⁵ cells were seeded into 6-well plates. After 48 h, cell monolayers were scratched to form a wound using pipette tips. The images were recorded at 0 h and 48 h after scratch.
Transwell migration and matrigel invasion assay
Cells were plated into the top chambers with (invasion assay) or without (migration assay) Matrigel (BD Biosciences 356,234). After 48 h, cells on the bottom side were fixed using 4% paraformaldehyde and stained using crystal violet.
Seahorse assay
Cellular oxygen consumption rate (OCR) and extracellular acidification rate/ECAR were determined using a Seahorse XF96 analyzer with the Seahorse XF Cell Mito Stress Test Kit (Agilent 103,015–100) and Seahorse XF Glycolytic Rate Assay Kit (Agilent 103,344–100) according to the manufacturer’s instructions. Data were analyzed with Seahorse XF Mito Stress Test and Glycolytic Rate Assay Report Generator. The glycolytic proton efflux rate (glycoPER) reflects the glycolytic rate.
Glucose uptake and lactate production
Glucose uptake and lactate production assay were measured using Glucose Uptake Assay Kit (Colorimetric) (Abcam, ab136955) and L-Lactate Assay Kit (Colorimetric) (Abcam, ab65331), respectively, according to the manufacturer’s protocols.
Transmission electron microscopy
Transmission electron microscopy was conducted as previously described [60].
Mitochondrial function analysis
Mitochondrial membrane potential was measured using a Mitochondrial membrane potential assay kit with JC-1 (Beyotime, C2006). DCFH-DA (Beyotime, S0033) and MitoSOX (Invitrogen, M36008) were used to measure intracellular and mitochondrial reactive oxygen species. Samples were stained according to the manufacturer’s protocols and then detected by flow cytometry.
Mouse models
Six-week-old male BALB/c nude mice were used under protocols approved by the Institutional Animal Care and Use Committee of the Eye & ENT Hospital of Fudan University (20170301). For the orthotopic UM mouse model, 1 × 10⁶ luciferase-labeled UM cells were injected into the suprachoroidal space in the left eye using a 33-gauge Hamilton syringe. PBS (Gibco 10,010,023) or CQ (Selleck, S4157) treatments were administered by intraperitoneal injection twice a week. After four weeks, tumor burden was measured by in vivo bioluminescence imaging (Aniview 100, Biolight Biotechnology, Guangzhou, China). Following euthanasia and eyeball enucleation, eye tissues were used for IHC staining. As described previously, the liver metastasis model was established by intrasplenic injection of luciferase-labeled UM cells (1 × 10⁶) [61]. The mice were intraperitoneally administrated with PBS or CQ twice a week. Bioluminescence imaging was used to detect liver metastasis two months after splenic injection.
Statistical analysis
Statistical analyses were performed using GraphPad Prism and SPSS. Pearson correlation test was used for correlation analysis. Kaplan – Meier analysis with log-rank test was used for survival analysis. Pearson Chi-squared test was used for categorical variables and Student’s t-test for quantitative variables. Data are expressed as mean ± standard deviation (SD) (n.s.=not significant, *p < 0.05, **p < 0.01, ***p < 0.001, ****p < 0.0001).
Supplementary Material
Funding Statement
The work was supported by the National Natural Science Foundation of China [82171099, 81970835]; Shanghai Hospital Development Center Foundation [SHDC12024118].
Disclosure statement
No potential conflict of interest was reported by the author(s).
Data availability statement
The data that support the findings of this study are available from the corresponding author upon reasonable request.
Ethics statement
All experiments have been carried out adhering to the tenets of the Helsinki Declaration and were approved by the Investigational Review Board of the Eye and ENT Hospital of Fudan University.
Supplementary material
Supplemental data for this article can be accessed online at https://doi.org/10.1080/15548627.2024.2395142
References
- [1].Smit KN, Jager MJ, de Klein A, et al. Uveal melanoma: towards a molecular understanding. Prog Retin Eye Res. 2020;75:100800. doi: 10.1016/j.preteyeres.2019.100800 [DOI] [PubMed] [Google Scholar]
- [2].Rantala ES, Hernberg MM, Piperno-Neumann S, et al. Metastatic uveal melanoma: the final frontier. Prog Retin Eye Res. 2022;90:101041. doi: 10.1016/j.preteyeres.2022.101041 [DOI] [PubMed] [Google Scholar]
- [3].Eskelin S, Pyrhönen S, Summanen P, et al. Tumor doubling times in metastatic malignant melanoma of the uvea: tumor progression before and after treatment. Ophthalmology. 2000;107(8):1443–1449. doi: 10.1016/S0161-6420(00)00182-2 [DOI] [PubMed] [Google Scholar]
- [4].Bustamante P, Piquet L, Landreville S, et al. Uveal melanoma pathobiology: metastasis to the liver. Semin Cancer Biol. 2021;71:65–85. doi: 10.1016/j.semcancer.2020.05.003 [DOI] [PubMed] [Google Scholar]
- [5].Zhao J, Yi Q, Li K, et al. A multi-omics deep learning model for hypoxia phenotype to predict tumor aggressiveness and prognosis in uveal melanoma for rationalized hypoxia-targeted therapy. Comput Struct Biotechnol J. 2022;20:3182–3194. doi: 10.1016/j.csbj.2022.06.034 [DOI] [PMC free article] [PubMed] [Google Scholar]
- [6].Hu K, Babapoor-Farrokhran S, Rodrigues M, et al. Hypoxia-inducible factor 1 upregulation of both VEGF and ANGPTL4 is required to promote the angiogenic phenotype in uveal melanoma. Oncotarget. 2016;7(7):7816–7828. doi: 10.18632/oncotarget.6868 [DOI] [PMC free article] [PubMed] [Google Scholar]
- [7].Asnaghi L, Lin MH, Lim KS, et al. Hypoxia promotes uveal melanoma invasion through enhanced notch and MAPK activation. PLoS One. 2014;9(8):e105372. doi: 10.1371/journal.pone.0105372 [DOI] [PMC free article] [PubMed] [Google Scholar]
- [8].Dong L, You S, Zhang Q, et al. Arylsulfonamide 64B inhibits Hypoxia/HIF-Induced expression of c-met and CXCR4 and reduces primary tumor growth and metastasis of uveal melanoma. Clin Cancer Res. 2019;25(7):2206–2218. doi: 10.1158/1078-0432.CCR-18-1368 [DOI] [PMC free article] [PubMed] [Google Scholar]
- [9].de Heer EC, Jalving M, Harris AL.. Hifs, angiogenesis, and metabolism: elusive enemies in breast cancer. J Clin Invest. 2020;130(10):5074–5087. doi: 10.1172/JCI137552 [DOI] [PMC free article] [PubMed] [Google Scholar]
- [10].Kothari S, Cizeau J, McMillan-Ward E, et al. BNIP3 plays a role in hypoxic cell death in human epithelial cells that is inhibited by growth factors EGF and IGF. Oncogene. 2003;22(30):4734–4744. doi: 10.1038/sj.onc.1206666 [DOI] [PubMed] [Google Scholar]
- [11].Shaida N, Launchbury R, Boddy JL, et al. Expression of BNIP3 correlates with hypoxia-inducible factor (hif)-1α, HIF-2α and the androgen receptor in prostate cancer and is regulated directly by hypoxia but not androgens in cell lines. Prostate. 2008;68(3):336–343. doi: 10.1002/pros.20707 [DOI] [PubMed] [Google Scholar]
- [12].Giatromanolaki A, Koukourakis MI, Sowter HM, et al. BNIP3 expression is linked with hypoxia-regulated protein expression and with poor prognosis in non–small cell lung cancer. Clin Cancer Res. 2004;10(16):5566–5571. doi: 10.1158/1078-0432.CCR-04-0076 [DOI] [PubMed] [Google Scholar]
- [13].Leo C, Horn LC, Höckel M. Hypoxia and expression of the proapoptotic regulator BNIP3 in cervical cancer. Int J Gynecol Cancer. 2006;16(3):1314–1320. doi: 10.1136/ijgc-00009577-200605000-00055 [DOI] [PubMed] [Google Scholar]
- [14].Gorbunova AS, Yapryntseva MA, Denisenko TV, et al. BNIP3 in lung cancer: to kill or rescue? Cancers (Basel). 2020;12(11):12. doi: 10.3390/cancers12113390 [DOI] [PMC free article] [PubMed] [Google Scholar]
- [15].Jiang Z, Yu F, Li M. Upregulation of BCL2 19 kD protein-interacting protein 3 (BNIP3) is predictive of unfavorable prognosis in Uveal melanoma. Med Sci Monit. 2018;24:4711–4717. doi: 10.12659/MSM.907679 [DOI] [PMC free article] [PubMed] [Google Scholar]
- [16].Faubert B, Solmonson A, DeBerardinis RJ. Metabolic reprogramming and cancer progression. Science. 2020;368(6487). doi: 10.1126/science.aaw5473 [DOI] [PMC free article] [PubMed] [Google Scholar]
- [17].Hanahan D, Weinberg RA. Hallmarks of cancer: the next generation. Cell. 2011;144(5):646–674. doi: 10.1016/j.cell.2011.02.013 [DOI] [PubMed] [Google Scholar]
- [18].Warburg O, Wind F, Negelein E. THE METABOLISM OF TUMORS IN THE BODY. J Gen Physiol. 1927;8(6):519–530. doi: 10.1085/jgp.8.6.519 [DOI] [PMC free article] [PubMed] [Google Scholar]
- [19].Ashton TM, McKenna WG, Kunz-Schughart LA, et al. Oxidative phosphorylation as an emerging target in cancer therapy. Clin Cancer Res. 2018;24(11):2482–2490. doi: 10.1158/1078-0432.CCR-17-3070 [DOI] [PubMed] [Google Scholar]
- [20].Roth KG, Mambetsariev I, Kulkarni P, et al. The mitochondrion as an emerging therapeutic target in cancer. Trends Mol Med. 2020;26(1):119–134. doi: 10.1016/j.molmed.2019.06.009 [DOI] [PMC free article] [PubMed] [Google Scholar]
- [21].Jia D, Park JH, Jung KH, et al. Elucidating the metabolic plasticity of cancer: mitochondrial reprogramming and hybrid metabolic states. Cells. 2018;7(3):21. doi: 10.3390/cells7030021 [DOI] [PMC free article] [PubMed] [Google Scholar]
- [22].Han A, Schug ZT, Aplin AE. Metabolic alterations and therapeutic opportunities in rare forms of melanoma. Trends Cancer. 2021;7(8):671–681. doi: 10.1016/j.trecan.2021.05.005 [DOI] [PMC free article] [PubMed] [Google Scholar]
- [23].Ferro F, Servais S, Besson P, et al. Autophagy and mitophagy in cancer metabolic remodelling. Semin Cell Dev Biol. 2020;98:129–138. doi: 10.1016/j.semcdb.2019.05.029 [DOI] [PubMed] [Google Scholar]
- [24].Naik PP, Birbrair A, Bhutia SK. Mitophagy-driven metabolic switch reprograms stem cell fate. Cell Mol Life Sci. 2019;76(1):27–43. doi: 10.1007/s00018-018-2922-9 [DOI] [PMC free article] [PubMed] [Google Scholar]
- [25].Panigrahi DP, Praharaj PP, Bhol CS, et al. The emerging, multifaceted role of mitophagy in cancer and cancer therapeutics. Semin Cancer Biol. 2020;66:45–58. doi: 10.1016/j.semcancer.2019.07.015 [DOI] [PubMed] [Google Scholar]
- [26].Robertson AG, Shih J, Yau C, et al. Integrative analysis identifies four molecular and clinical subsets in Uveal melanoma. Cancer Cell. 2017;32(2):204–20.e15. doi: 10.1016/j.ccell.2017.07.003 [DOI] [PMC free article] [PubMed] [Google Scholar]
- [27].Bruick RK. Expression of the gene encoding the proapoptotic Nip3 protein is induced by hypoxia. Proc Natl Acad Sci UA. 2000;97(16):9082–9087. doi: 10.1073/pnas.97.16.9082 [DOI] [PMC free article] [PubMed] [Google Scholar]
- [28].Yuan Y, Hilliard G, Ferguson T, et al. Cobalt inhibits the interaction between hypoxia-inducible Factor-α and von hippel-lindau protein by direct binding to hypoxia-inducible Factor-α. J Biol Chem. 2003;278(18):15911–15916. doi: 10.1074/jbc.M300463200 [DOI] [PubMed] [Google Scholar]
- [29].Yao J, Wang J, Xu Y, et al. CDK9 inhibition blocks the initiation of PINK1-prkn-mediated mitophagy by regulating the SIRT1-FOXO3-BNIP3 axis and enhances the therapeutic effects involving mitochondrial dysfunction in hepatocellular carcinoma. Autophagy. 2022;18(8):1879–1897. doi: 10.1080/15548627.2021.2007027 [DOI] [PMC free article] [PubMed] [Google Scholar]
- [30].Ni HM, Williams JA, Ding WX. Mitochondrial dynamics and mitochondrial quality control. Redox Biol. 2015;4:6–13. doi: 10.1016/j.redox.2014.11.006 [DOI] [PMC free article] [PubMed] [Google Scholar]
- [31].Gao A, Jiang J, Xie F, et al. Bnip3 in mitophagy: novel insights and potential therapeutic target for diseases of secondary mitochondrial dysfunction. Clin Chim Acta. 2020;506:72–83. doi: 10.1016/j.cca.2020.02.024 [DOI] [PubMed] [Google Scholar]
- [32].Katayama H, Kogure T, Mizushima N, et al. A sensitive and quantitative technique for detecting autophagic events based on lysosomal delivery. Chem Biol. 2011;18(8):1042–1052. doi: 10.1016/j.chembiol.2011.05.013 [DOI] [PubMed] [Google Scholar]
- [33].Elzakra N, Kim Y. HIF-1α metabolic pathways in human cancer. Adv Exp Med Biol. 2021;1280:243–260. [DOI] [PubMed] [Google Scholar]
- [34].Chourasia AH, Tracy K, Frankenberger C, et al. Mitophagy defects arising from BNip3 loss promote mammary tumor progression to metastasis. EMBO Rep. 2015;16(9):1145–1163. doi: 10.15252/embr.201540759 [DOI] [PMC free article] [PubMed] [Google Scholar]
- [35].Vara-Pérez M, Rossi M, Van den Haute C, et al. BNIP3 promotes HIF-1α-driven melanoma growth by curbing intracellular iron homeostasis. Embo J. 2021;40(10):e106214. doi: 10.15252/embj.2020106214 [DOI] [PMC free article] [PubMed] [Google Scholar]
- [36].Wu Z, Zuo M, Zeng L, et al. OMA1 reprograms metabolism under hypoxia to promote colorectal cancer development. EMBO Rep. 2021;22(1):e50827. doi: 10.15252/embr.202050827 [DOI] [PMC free article] [PubMed] [Google Scholar]
- [37].Yang Y, He J, Zhang B, et al. SLC25A1 promotes tumor growth and survival by reprogramming energy metabolism in colorectal cancer. Cell Death Dis. 2021;12(12):1108. doi: 10.1038/s41419-021-04411-2 [DOI] [PMC free article] [PubMed] [Google Scholar]
- [38].Tan YT, Lin JF, Li T, et al. LncRNA-mediated posttranslational modifications and reprogramming of energy metabolism in cancer. Cancer Commun (Lond). 2021;41(2):109–120. doi: 10.1002/cac2.12108 [DOI] [PMC free article] [PubMed] [Google Scholar]
- [39].You S, Zhu X, Yang Y, et al. SLC7A1 Overexpression is involved in energy metabolism reprogramming to induce tumor progression in epithelial ovarian cancer and is associated with immune-infiltrating cells. J Oncol. 2022;2022:5864826. doi: 10.1155/2022/5864826 [DOI] [PMC free article] [PubMed] [Google Scholar]
- [40].DeBerardinis RJ, Chandel NS. Fundamentals of cancer metabolism. Sci Adv. 2016;2(5):e1600200. doi: 10.1126/sciadv.1600200 [DOI] [PMC free article] [PubMed] [Google Scholar]
- [41].Yoshida GJ. Metabolic reprogramming: the emerging concept and associated therapeutic strategies. J Exp Clin Cancer Res. 2015;34(1):111. doi: 10.1186/s13046-015-0221-y [DOI] [PMC free article] [PubMed] [Google Scholar]
- [42].Dong F, Li R, Wang J, et al. Hypoxia-dependent expression of MAP17 coordinates the warburg effect to tumor growth in hepatocellular carcinoma. J Exp Clin Cancer Res. 2021;40(1):121. doi: 10.1186/s13046-021-01927-5 [DOI] [PMC free article] [PubMed] [Google Scholar]
- [43].Onken MD, Noda SE, Kaltenbronn KM, et al. Oncogenic Gq/11 signaling acutely drives and chronically sustains metabolic reprogramming in uveal melanoma. J Biol Chem. 2022;298(1):101495. doi: 10.1016/j.jbc.2021.101495 [DOI] [PMC free article] [PubMed] [Google Scholar]
- [44].Nie K, Li J, He X, et al. COX6B2 drives metabolic reprogramming toward oxidative phosphorylation to promote metastasis in pancreatic ductal cancer cells. Oncogenesis. 2020;9(5):51. doi: 10.1038/s41389-020-0231-2 [DOI] [PMC free article] [PubMed] [Google Scholar]
- [45].Huang Y, Du Y, Zheng Y, et al. Ct-OATP1B3 promotes high-grade serous ovarian cancer metastasis by regulation of fatty acid beta-oxidation and oxidative phosphorylation. Cell Death Dis. 2022;13(6):556. doi: 10.1038/s41419-022-05014-1 [DOI] [PMC free article] [PubMed] [Google Scholar]
- [46].Hu Y, Xu W, Zeng H, et al. Oxphos-dependent metabolic reprogramming prompts metastatic potential of breast cancer cells under osteogenic differentiation. Br J Cancer. 2020;123(11):1644–1655. doi: 10.1038/s41416-020-01040-y [DOI] [PMC free article] [PubMed] [Google Scholar]
- [47].Liu YM, Ge JY, Chen YF, et al. Combined single-cell and spatial transcriptomics reveal the metabolic evolvement of breast cancer during early dissemination. Vol. 10. Baden-Wurttemberg, Germany: Advanced science (Weinheim; ); 2023. p. e2205395. [DOI] [PMC free article] [PubMed] [Google Scholar]
- [48].LeBleu VS, O’Connell JT, Gonzalez Herrera KN, et al. PGC-1α mediates mitochondrial biogenesis and oxidative phosphorylation in cancer cells to promote metastasis. Nat Cell Biol. 2014;16(10):992–1003, 1–15. doi: 10.1038/ncb3039 [DOI] [PMC free article] [PubMed] [Google Scholar]
- [49].Mellor HR, Harris AL. The role of the hypoxia-inducible BH3-only proteins BNIP3 and BNIP3L in cancer. Cancer Metastasis Rev. 2007;26(3–4):553–566. doi: 10.1007/s10555-007-9080-0 [DOI] [PubMed] [Google Scholar]
- [50].Vijayalingam S, Pillai SG, Rashmi R, et al. Overexpression of BH3-only protein BNIP3 leads to enhanced tumor growth. Genes Cancer. 2010;1(9):964–971. doi: 10.1177/1947601910386110 [DOI] [PMC free article] [PubMed] [Google Scholar]
- [51].Erkan M, Kleeff J, Esposito I, et al. Loss of BNIP3 expression is a late event in pancreatic cancer contributing to chemoresistance and worsened prognosis. Oncogene. 2005;24(27):4421–4432. doi: 10.1038/sj.onc.1208642 [DOI] [PubMed] [Google Scholar]
- [52].He J, Pei L, Jiang H, et al. Chemoresistance of colorectal cancer to 5-fluorouracil is associated with silencing of the BNIP3 gene through aberrant methylation. J Cancer. 2017;8(7):1187–1196. doi: 10.7150/jca.18171 [DOI] [PMC free article] [PubMed] [Google Scholar]
- [53].Vara-Perez M, Felipe-Abrio B, Agostinis P. Mitophagy in cancer: a tale of adaptation. Cells. 2019;8(5):493. doi: 10.3390/cells8050493 [DOI] [PMC free article] [PubMed] [Google Scholar]
- [54].Bernardini JP, Lazarou M, Dewson G. Parkin and mitophagy in cancer. Oncogene. 2017;36(10):1315–1327. doi: 10.1038/onc.2016.302 [DOI] [PubMed] [Google Scholar]
- [55].Poole LP, Macleod KF. Mitophagy in tumorigenesis and metastasis. Cellular and molecular life sciences: CMLS. Cellular Mol Life Sci. 2021;78(8):3817–3851. doi: 10.1007/s00018-021-03774-1 [DOI] [PMC free article] [PubMed] [Google Scholar]
- [56].Deng R, Zhang HL, Huang JH, et al. MAPK1/3 kinase-dependent ULK1 degradation attenuates mitophagy and promotes breast cancer bone metastasis. Autophagy. 2021;17(10):3011–3029. doi: 10.1080/15548627.2020.1850609 [DOI] [PMC free article] [PubMed] [Google Scholar]
- [57].Zheng Y, Huang C, Lu L, et al. STOML2 potentiates metastasis of hepatocellular carcinoma by promoting PINK1-mediated mitophagy and regulates sensitivity to lenvatinib. J Hematol Oncol. 2021;14(1):16. doi: 10.1186/s13045-020-01029-3 [DOI] [PMC free article] [PubMed] [Google Scholar]
- [58].Wang S, Long H, Hou L, et al. The mitophagy pathway and its implications in human diseases. Signal transduction and targeted therapy. Signal Transduct Target Ther. 2023;8(1):304. doi: 10.1038/s41392-023-01503-7 [DOI] [PMC free article] [PubMed] [Google Scholar]
- [59].Nguyen-Dien GT, Kozul KL, Cui Y, et al. FBXL4 suppresses mitophagy by restricting the accumulation of NIX and BNIP3 mitophagy receptors. Embo J. 2023;42(13):e112767. doi: 10.15252/embj.2022112767 [DOI] [PMC free article] [PubMed] [Google Scholar]
- [60].Sun J, Feng D, Xi H, et al. CD24 blunts the sensitivity of retinoblastoma to vincristine by modulating autophagy. Mol Oncol. 2020;14(8):1740–1759. doi: 10.1002/1878-0261.12708 [DOI] [PMC free article] [PubMed] [Google Scholar]
- [61].Sugase T, Lam BQ, Danielson M, et al. Development and optimization of orthotopic liver metastasis xenograft mouse models in uveal melanoma. J Transl Med. 2020;18(1):208. doi: 10.1186/s12967-020-02377-x [DOI] [PMC free article] [PubMed] [Google Scholar]
Associated Data
This section collects any data citations, data availability statements, or supplementary materials included in this article.
Supplementary Materials
Data Availability Statement
The data that support the findings of this study are available from the corresponding author upon reasonable request.