Abstract
A single lipid molecular bilayer of 17 or 18 carbon chain phosphocholines, floating in water near a flat wall, is prepared in the bilayer gel phase and then heated to the fluid phase. Its structure (electron density profile) and height fluctuations are determined by using x-ray reflectivity and nonspecular scattering. By fitting the off-specular signal to that calculated for a two-dimensional membrane using a Helfrich Hamiltonian, we determine the three main physical quantities that govern the bilayer height fluctuations: The wall attraction potential is unexpectedly low; the surface tension, roughly independent on chain length and temperature, is moderate (≈5 × 10⁻⁴ J·m–2) but large enough to dominate the intermediate range of the fluctuation spectrum; and the bending modulus abruptly decreases by an order-of-magnitude from 10–18 J to 10–19 J at the bilayer gel-to-fluid transition.
Lipid bilayers (1, 2) have been often studied as models of two-dimensional soft systems (3). They are increasingly used as controlled idealized models of cell membranes for biophysical studies of membrane–membrane and membrane–protein interactions (1, 4). Lipid bilayers can be characterized by their static structure and dynamic, equilibrium thermal fluctuations. Structural measurements yield information on the variation of chemical composition (using neutrons) or electron density (using x-rays) along the z axis normal to the bilayer plane (for a review, see ref. 5). Thermal fluctuations of the bilayer plane are classically described (6) within the harmonic approximation originally proposed by Helfrich (3) with three physical quantities: (i) The intrinsic bilayer bending modulus κ stabilizes fluctuations with short in-plane (x, y) wavelengths; (ii) the surface tension γ, if strong enough, dominates the intermediate scales; and (iii) an external potential per unit surface, U, due, for instance, to the attraction by a nearby surface or neighboring bilayers, stabilizes (through its second derivative U″ = d2U/dz2) large in-plane wavelength fluctuation modes. The cross-over between these regimes is usually [with few exceptions (7)] at submicronic scales and more accessible to x-ray off-specular surface scattering than to optical microscopy measurements.
A considerable effort has been devoted to the measurement of the bending rigidity κ, which controls both the physical properties (bilayer fluctuations and vesicle shape) and biophysical properties (adhesion, invagination, and membrane–protein interactions) of the bilayers (2, 4, 8). Experiments have been based on indirect effects (9, 10) or on the direct determination (7) of the fluctuation spectrum, usually on vesicles (7, 11) or on multilayer stacks (5, 12). They have yielded results mostly in the fluid phase (7, 9, 11, 13–16) but also in the gel phase (17) and, more recently, as a function of temperature across the melting transition (10, 18, 19).
We report an experimental determination of the structure and fluctuations of a lipid bilayer, in a planar configuration (in the vicinity of an atomically flat solid substrate) that facilitates the acquisition of surface scattering data. In addition, experimenting with a single, controlled, fluctuating object facilitates the analysis in terms of a fluctuation spectrum. Comparison with theoretical predictions is easier than in stacks, and the potential depends on only one variable (distance z to the substrate), as assumed by many theoretical models (6, 18, 20). We add as supporting information, which is published on the PNAS web site, details of the scattering cross-section calculations and a summarization of the determined parameters.
Materials and Methods
Samples. 1,2-distearoyl-sn-glycero-3-phosphocholine (di-C18-PC or DSPC) and 1,2-diheptadecanoyl-sn-glycero-3-phosphocholine (di-C17-PC) from Avanti Polar Lipids were used without further purification. A monomolecular layer was deposited on water at room temperature, allowing for equilibration and solvent evaporation and compressed to a surface pressure of 40 ± 0.1 mN/m. A superpolished (<0.1 nm roughness) silicon substrate (SESO, Aix-en Provence, France) of surface 2.5 × 2.5 cm2 and 1 cm thick (to ensure a planarity of less than micrometers over the whole sample) was cleaned with organic solvents in ultrasound (21) and then made highly hydrophilic with ozone treatment under a UV lamp (22).
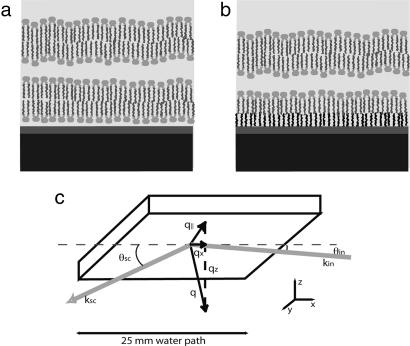
To mimic the interbilayer interaction potential, the substrate was first covered by an adsorbed bilayer, prepared by two classical Langmuir–Blodgett (LB) depositions at 5 mm/min (21) (Fig. 1a); this strongly adsorbed bilayer only weakly contributes to the scattering signal (see Fluctuation Spectrum). We prepare the floating bilayer by a LB deposition, followed by a Langmuir–Schaeffer (LS) deposition (horizontal sample) (21): The sample is brought parallel to the water with a micrometric control (19) and gently lowered in contact with the monolayer to be deposited. The transfer rates (ratio of the trough compression to substrate area), measured with 0.01 precision and 0.02 statistical dispersion, were 0.99 (for the first LB transfer), 0.89 (second LB), 0.98 (third LB), and 0.98 (LS). We refer to such samples as adsorbed samples.
Fig. 1.
Schematic of the sample. (a) A lipid bilayer floating about 2–3 nm above an adsorbed bilayer. Black, thick silicon substrate; dark gray, nanometric ozone-grown oxide (silica); light gray, water. The image is not drawn to scale. (b) Same, with a grafted layer. (c) Configuration of the incidence and scattered beams.
Alternatively, we further suppressed the scattering due to the first bilayer (see Fluctuation Spectrum) and thus facilitated data analysis by grafting on the substrate an aliphatic layer (23) (grafted samples; Fig. 1b). An ozone-treated substrate, recleaned in ultrasound for 10 min in ultrapure water, was left for 11 h in a thoroughly mixed solution of 10 μl of octadecyltrichlorosilane in 100 ml of dodecane and then cleaned in solvents with ultrasound. The transfer rates of the second, third, and fourth layers, prepared as above, were 0.8 (LB), 0.96 (LB), and 0.9 (LS) for di-C18-PC and 0.65 (LB), 0.95 (LB), and 0.97 (LS) for di-C17-PC. These transfer rates are better than those found by using hexane as a solvent, probably because dodecane yields a lower coverage for the grafted monomolecular layer, and this allows an interdigitation of alkyl chains.
After the LS deposition, the substrate was inserted into a PTFE sample cell with 50-μm-thick windows. The sample cell was tightly closed and transferred to an aluminium box and thermalized by a water circulation, first at 25°C, then heated by steps, with a feedback on the temperature measured inside the sample cell by a PT100 resistance.
Data Acquisition. The synchrotron radiation white-beam produced by the bending magnet at the ESRF beam-line BM32/IF was first reflected by a tungsten-coated, vertically focusing glass mirror. The energy was fixed at 20 keV (1 eV = 1.602 × 10⁻¹⁹ J) (wavelength λ = 0.0619 nm) by using a two-crystal Si(111) monochromator with sagittal (horizontal) focusing on the second crystal. The incident beam on the sample was limited by a 16-μm-high, 500-μm-wide slit, and its intensity was measured by using a photodiode monitor. The slits on the goniometer detector arm determine the background level; they affect specular measurements mainly at large q and nonspecular intensities because they define the scattering volume (in the reciprocal q-space). We find an acceptable compromise between the resolution and the signal-to-noise ratio with a 0.5-mm × 20-mm slit at 192 mm after the sample and a 0.5-mm × 20-mm slit at 718 mm after the sample, just in front of the detector, which is a NaI(Tl) scintillator.
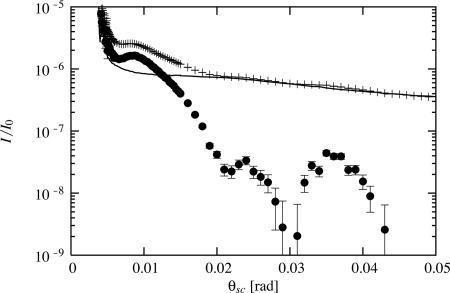
Specular reflectivity is defined as the ratio between the intensities of the reflected and incident x-ray beams (Fig. 1c) and measured as a function R(qz) of the wavevector transfer qz = 4π sin θ/λ perpendicular to the substrate surface x, y. Here, θ is the grazing angle of the incident beam with the x, y plane (in the incidence plane x, z). When crossing the 2.5-cm path length in water, ≈17% of the 20-keV x-rays were transmitted and 83% were absorbed. Whereas background scattering usually can be neglected in air, here the bulk water scatters around 10–6 of the signal (Fig. 2). This is two orders of magnitude larger than the high-q reflection or scattering by the nanometer-thick sample. Great care must therefore be taken to measure (by rocking the sample around the specular position) and to subtract the background. A complete specular scan takes ≈5 h (including background measurement). Since we detected a degradation of samples under the beam after 1.5–2 h, we displaced the sample laterally every hour and checked that the resulting curves were reproducible.
Fig. 2.
Nonspecular signal and background subtraction. Crosses, off-specular raw data (relative intensity I/I0 versus the scattering angle), here a grafted di-C18-PC sample at 48.4°C; solid line, sampleless background Isl(θsc – 2θin); filled circles, signal after background subtraction.
For the measurement of nonspecular scattering, surface sensitivity was considerably enhanced by taking advantage of total external reflection at the Si–water interface. The real part 1 – δ of the refractive index n for x-rays is smaller than 1, where δ = λ2reρ/2π and re = 2.818 × 10⁻⁶ nm is the so-called classical electron radius (Thomson scattering length). The Snell–Descartes law of refraction implies that, at a grazing angle of incidence smaller than  rad, only an evanescent wave propagates below the surface (with a penetration depth equal to a few nanometers). Note that for reflectivity measurements, the grazing angle of incidence can attain 30 mrad, well above the critical angle for total external reflection; however, the background scattering from the Si single crystal remains small.
We fixed the grazing angle of incidence below θc at θin = 10–3 rad. The detector scans a vertical circular arc (5 × 10⁻³ rad ≤ θsc ≤ 45 × 10–3 rad) in the x, z plane of incidence, out of the specularly reflected beam. It takes 1 h to record the I(θsc) curve, plus 1 h to measure the (sampleless) background curve Isl(θsc) by raising the sample 1 mm out of the direct beam. Since we were working below the critical angle (x-rays penetrated only on a few nanometers into the silicon substrate), we estimated the background as the small-angle scattering of the incident and reflected beams (24): IB(θsc) = [Isl(θsc) + R(θin) × Isl(θsc – 2θin)]/2, where R(θin) (usually close to but slightly smaller than unity) is the measured reflectivity for the total external reflection at the fixed angle θin (see Fig. 2).
Cross-Section Calculation. Because scattering cross-sections are large in the total external reflection region, we must use a better approximation than the (kinematic) Born Approximation. Since our bilayers have only a weak electron-density contrast with water, we can apply a perturbation theory (Distorted Wave Born Approximation) (25) using as a reference state an ideally flat, substrate/water interface for which the scattering can be exactly calculated (Fresnel equations), and we treat the bilayer as a weak perturbation (26). Within this approximation, the reflectivity of the interface can be written as
 |
[1] |
where δρ(z) = ρ(z) – ρH2O is the difference between the membrane electron density at depth z and that of water, and RF is the Fresnel reflectivity of the ideal stepwise interface between the substrate of electron density ρSi and water. The modulations in the reflectivity curve come from the small quantity δρ(z)/(ρSi – ρH2O).
For diffuse scattering, this approximation yields for the differential scattering cross-section (intensity scattered per unit solid angle Ω in the direction ksc per unit of incident flux in the direction kin)
 |
[2] |
where dσ/dΩref is the (known) specular reflectivity corresponding to the reference, flat substrate/water interface. Here, tH2O,Si(θin) and tH2O,Si(θsc) are the Fresnel transmission coefficients between water and the substrate for the grazing angle of incidence θin and the scattering angle θsc, respectively. The coefficient tH2O,Si(θin) represents a good approximation to the actual field scattered by the electron-density fluctuations δρ, whereas tH2O,Si(θsc) describes how this field propagates to the detector (26). Here, (êin·êsc)2 is a polarization factor (close to 1): êin is the polarization vector of the incident field and êsc that of the scattered field. The last term of Eq. 2 describes the correction to dσ/dΩref due to the presence of the film (25).
Fit to the Bilayer Data. The bilayer scatters the beam with a cross-section deduced from Eq. 2 for the case of height fluctuations z(r∥), where r∥ = (x, y) is the two-dimensional, in-plane position and q∥ is the reciprocal, in-plane wavevector transfer:
 |
[3] |
Here, 〈z(0)z(r∥)〉 is the height–height correlation function, 〈z2〉≡ 〈z(0)2〉 is the surface rms roughness, and  is the bilayer form factor.
  can be expressed in different ways that are, in principle, equivalent but not equally convenient. We analyzed specular data using the so-called 1G-hybrid box model, where the electron density ρ(z) is approximated by piecewise analytic smooth functions (5, 27). For the analysis of diffuse scattering data, we preferred to use the more convenient Fourier expansion of ρ(z) (this is possible because the nonspecular signal comes only from the floating bilayer, which respects the z → –z symmetry):
 |
[4] |
where Fh is the hth Fourier coefficient and the pseudoperiod D is a parameter left free in the fit (only for multilayer stacks would D have the signification of a period).
Using standard approximations and notations (3, 6), we assumed that the floating bilayer was fluctuating as a single sheet of constant thickness (no peristaltic modes) and with small fluctuation amplitudes z(r∥) (no overhangs) according to the Helfrich Hamiltonian:
 |
[5] |
where U″ is the second derivative of the effective microscopic potential U, γ is the surface tension, and κ is the bending modulus of the bilayer. The equipartition of energy implies that the thermal fluctuation spectrum is (6)
 |
[6] |
where kB is the Boltzmann constant and T is the temperature. If the discriminant Δ= γ2 – 4U″κ is negative, the denominator of Eq. 6 shows that the spectrum crosses over at (U″/κ)1/4 from U″-dominated small values to κ-dominated large values of q∥.If Δ> 0, there is an intermediate range  , where
  dominates.
Fourier transformation of Eq. 6 yields the height–height correlation function 〈z(0)z(r∥)〉. We obtained the scattered intensity in two steps. First, we convoluted Eq. 3 with the experimental resolution function determined by the slit openings. In the Fourier space, this amounted to a multiplication of the Fourier transform by  , giving the spatial coherence of the beam; here,
  is the resolution along x (25).
Second, we performed the numerical integration of Eq. 3. Since slits were widely open along y, the width in qy was large and the coherence was small: The integration was performed only along x. The result was used to fit our data.
The parameters U″, γ, and κ affect the scattering in a different way (see supporting information): U″ has a large effect on the spectrum shape at low q, γ shifts the curve at low q, and κ shifts the entire curve. The three parameters can thus be determined simultaneously.
All of the scans were performed in the plane of incidence x, z. The specular data were plotted as a function of the actual wavevector transfer qz, while off-specular data were plotted as a function of the projection qx of the wavevector transfer on the x, y substrate plane (Fig. 1c).
Results
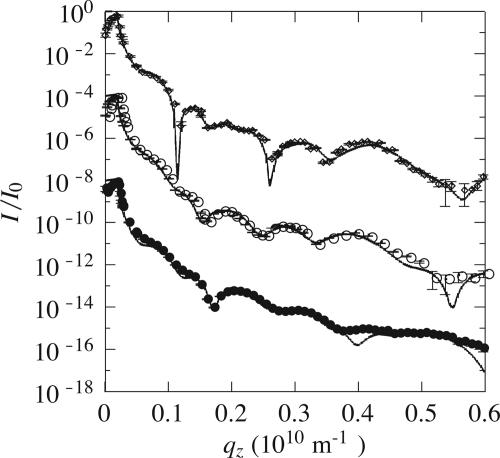
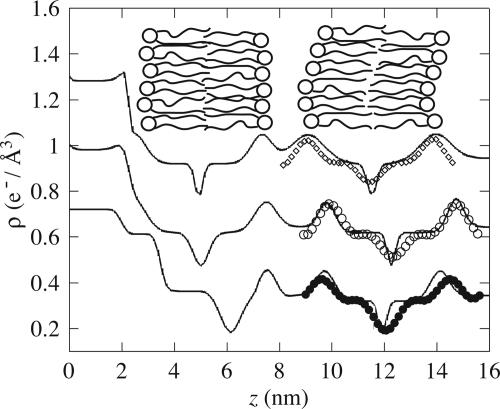
Bilayer Structure. The quantitative details of the parameters are presented in the supporting information. Specular reflectivity measurements (Fig. 3) yield a measure of the Fourier transform of the average electron-density profile of the sample structure. Fig 4 shows that, when heating from gel (25°C) to fluid (56°C) phase (i) the adsorbed bilayer to substrate distance does not change; (ii) the water layer thickness, i.e., the adsorbed to floating bilayer distance, increases by ≈0.9 nm; and (iii) the floating bilayer head-to-head distance is roughly constant, DHH ∼ 4.9 ± 0.2 nm, which is compatible with the picture of an intact floating bilayer (peristaltic modes).
Fig. 3.
Specular reflectivity for di-C18-PC floating bilayer. Diamonds, an adsorbed sample in the gel phase (25°C); open circles, in the fluid phase (56°C), shifted by 10–4 for clarity; filled circles, a grafted sample in fluid phase (57°C), shifted by 10–8. Solid lines are fits to the data of the 1G-hybrid box model used to determine the structural parameters.
Fig. 4.
Electron-density profiles of di-C18-PC obtained by specular reflectivity using 1G-hybrid model (lines) and by off-specular reflectivity using the Fourier expansion (symbols). Top curve, an adsorbed sample in the gel phase (line, T = 25°C; diamonds, T = 48°C); middle curve, in the fluid phase (line, T = 56°C; open circles, T = 56°C); bottom curve, a grafted sample in the fluid phase (line, T = 57°C; filled circles, T = 56°C). (Inset Left to Right) The silicon substrate (not schematized), the first layer (here drawn in the case of adsorbed bilayer), the floating bilayer (drawn), and the water (beyond the right side of the figure). To facilitate comparison, we have aligned vertically (around z = 7.5 nm) the peaks of the fixed lipid heads. The top and middle curves have been shifted vertically by +0.6 e–/Å3 and +0.3 e–/Å3, respectively, for clarity.
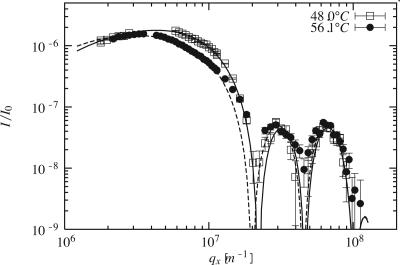
Like for reflectivity, absolute off-specular intensities are measured, yielding absolute values of the electron density without further calibration. This is generally not the case for values cited in the literature. Fig 5 presents the scattering by a di-C18-PC sample. Data at 48°C in the gel phase and at 56°C in the fluid phase differ significantly. The curve is sensitive to the floating bilayer only [its projection to the qz axis is reminiscent of a reflectivity curve for a single bilayer (data not shown)]. Fig 4 thus presents only the floating bilayer that is the same for adsorbed and grafted samples. The agreement between the specular and diffuse scattering determined structures is satisfactory.
Fig. 5.
Nonspecular scattering data (symbols) and best fits (lines) using the scattering cross-section calculated by using Eqs. 3–6 for di-C18-PC at 48°C (squares and solid line) and 56°C (circles and dashed line).
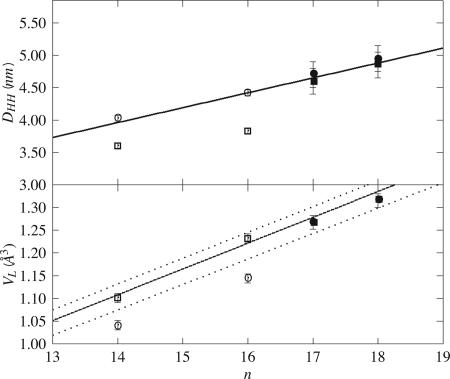
Both in the fluid and gel phases, we measure F0 = 0 e–/nm2. This implies (28) that the lipid molecular volume is VL = nL/ρw, where nL is the number of electrons per phospholipid molecule; here, nL = 438, and we obtain VL = 1.315 nm3. The area per lipid is AL = 2VL/DB, where DB is the distance between the two Gibbs dividing surfaces separating lipid and water. In the gel phase, DB = 5.3 nm (21), and we find AL = 0.50 nm2. In the fluid phase, DB is roughly equal to DHH (5), which we find equal to 4.85 nm (slightly, but not significantly, smaller than in the gel phase: DHH = 4.95 nm); hence, AL = 0.54 nm2. Results for di-C17-PC, calculated with nL = 422 [and DB = 5.2 nm in the gel phase (21)], are similar (Fig. 6 and Table 1).
Fig. 6.
Structural data in the gel (filled circles) and fluid (filled squares) phases for di-Cn-PC n = 17 and 18 floating bilayer (grafted samples). Data for n = 14 and 16 (5) are plotted for comparison (open symbols). (Upper) Lipid head-to-head distance; the solid line is a linear fit, DHH = 0.74 + 0.23n nm. The variation of this parameter with temperature is not significant given the error bars. (Lower) Volume per lipid; the solid line is the prediction based on published values for the fluid phase (5) (the dashed lines indicate the uncertainty interval), VL = 312.7 + 56.8n nm3.
Table 1. Structural data deduced from the off-specular determination of electron density profiles.
| Lipid no. | Phase | VL, nm3 | AL, nm2 | DHH, nm |
|---|---|---|---|---|
| 17 | Gel | 1.267 | 0.49 | 4.7 |
| Fluid | 0.55 | 4.6 | ||
| 18 | Gel | 1.315 | 0.50 | 4.95 |
| Fluid | 0.54 | 4.85 |
Uncertainties: lipid volume VL, 0.015 nm3; lipid area AL, 0.03 nm2; head-to-head distance DHH, 0.2 nm.
Fluctuation Spectrum. We first performed reference measurements at 25°C (data not shown). In air, the scattering of the bare silicon (with oxidized surface) substrate indicates that its roughness has the expected value (≈0.1 nm rms). In water, the contrast is reduced and the signal falls below our detection limit, even when the substrate is covered with a grafted layer. The scattering signal is thus sensitive to the floating bilayer only. An adsorbed bilayer contributes around our detection limit and much less than the floating bilayer.
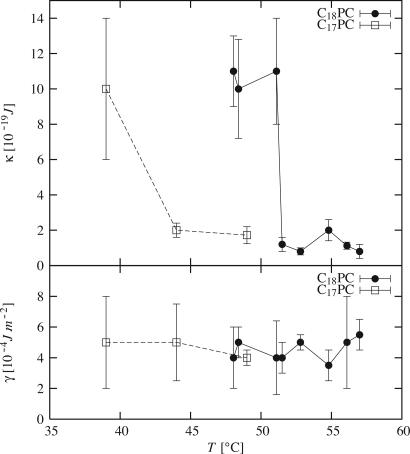
We obtain data for  values >1.2 × 10⁶ m–1 (Fig. 5); the spectra are well fitted by using a Helfrich thermal-fluctuation spectrum with three free parameters (Eq. 6). The fits systematically yield U″ < 5 × 10¹⁰ J·m–4; below this bound they are almost insensitive to U″. We thus neglect U″ and retain only two free parameters: γ and κ. Fig. 7 shows that surface tension is independent of phase and temperature, while the bending modulus is found to be about one order-of-magnitude lower in the fluid phase than in the gel phase.
Fig. 7.
Bending rigidity κ (Upper) and surface tension γ (Lower) for di-C17-PC (squares and dashed lines) and di-C18-PC (filled circles and solid lines).
Discussion
Samples. Our reconstruction (Fig. 4) is consistent with the picture of a (nearly free) bilayer floating a few nanometers above a fixed layer, which can be adsorbed or grafted. Upon heating, the lipid layer dimensions, the floating bilayer fluctuations, and the interbilayer distance change quantitatively, without changing qualitatively the overall sample structure. This change is visible even on the raw curves and thus is model-independent (Fig. 5).
The transition temperature (see Fig. 7) is significantly lower than tabulated values for bulk samples (55 ± 0.5°C for di-C18-PC and 49 ± 1°C for di-C17-PC; see, for example, www.lipidat.chemistry.ohio-state.edu). Whereas the explanation is unclear [it might here be related to the nonzero value of the surface tension γ (29)], this is in good agreement with previous neutron reflectivity results (19). Note that a static undulation of the bilayer, as reported in ripple phase (30), cannot explain the amplitude or the shape of the experimental signal (see supporting information).
We estimate the contributions to scattering by in-plane heterogeneities according to equation 7 of ref. 31 and find that they are small (data not shown): (i) Domains at the gel-to-fluid phase transition (which are very likely) have a very low contrast, whereas (ii) holes in the floating bilayer [which are unlikely (19, 32)] would have a form factor similar to that of height fluctuations. We have checked that these contributions would not affect the present results.
Structural Parameters. Our density profiles (Fig. 4) agree with the literature on diffraction from bilayer stacks for di-C14-PC (DMPC) (33), di-C16-PC (DPPC) (34), and DOPC (35), as well as with the existing partial results on di-C18-PC (36). In particular, we confirm that the maximum density in the head-group region is slightly higher in the fluid phase than in the gel phase (and, respectively, slightly lower for the chain and methyl groups). Note that our reconstruction is limited to the fourth Fourier component (Eq. 4); it is thus less sharp (the head-group peak and methyl-group hole are less pronounced) than that from lamellar phases of bilayers. The specular reflectivity results that are not subject to truncation effects also show this increased head-group density in the fluid phase.
Our determination of geometrical parameters agrees with expected values. According to ref. 37, using published values of molecular dimensions (5), we calculate VL = 1.278 and 1.335 ± 0.035 nm3 for di-C17-PC and di-C18-PC, respectively, and AL = 0.48 and 0.52 ± 0.03 nm2 for phosphocholines in the gel and fluid phases, respectively. This is 2% higher than volumes and 4% lower than areas calculated by using the present results; however, the difference is not significant given the error bars. The volume that we determine for saturated di-C18-PC is close to that for unsaturated 18-carbon chains (DOPC) at 30°C [VL = 1.303 nm3 (5, 35)]. The bilayer thickness in the gel phase increases with n, with a slope of 0.23 nm (Fig. 6 Upper) that agrees with the length of two additional CH2 groups. Lipid head projected areas are roughly independent of n for each phase (see Table 1). Molecular volumes increase with n, as expected (Fig. 6 Lower). We find F0 = 0e–/nm2 and thus the same volume in gel and fluid phases for both di-C17-PC and di-C18-PC. Note, however, that this invariance disagrees with the published results for di-C16-PC (DPPC) (5): 1.144 nm3 in the gel phase at 20°C versus 1.232 nm3 in fluid phase at 50°C (Fig. 6).
Helfrich Parameters. The values for the bending rigidity κ are the same for both chain lengths, C17 and C18, but vary strongly with temperature (Fig. 7). Typical values in the gel κ ∼ (11 ± 2) × 10–19 J(∼ 275 kBT) and fluid κ ∼ (1.5 ± 0.5) × 10–19 J(∼ 37 kBT) phases are in good agreement with previous measurements from other groups (7, 10, 17, 38). Neutron reflectivity on floating bilayers (19) indirectly estimated κgel and κfluid up to a multiplicative constant; their ratio is consistent with the present results: κgel/κfluid ∼ 10.
The values for the surface tension γ ∼ (5 ± 1) × 10–4 J·m–2 are the same for both chain lengths, C17 and C18, and are roughly independent on temperature (Fig. 7). We find values larger than obtained, for example, on vesicles (7) (γ ∼ 10–7 J·m–2) but still smaller than lysis surface tensions (≈5–20 × 10–3 J·m–2) (39, 40). This finding is consistent with the fact that our technique probes small scales, i.e., the actual microscopic area and surface tension, unlike optical methods which probe effective quantities at the micrometer scale (41).
Our upper bound on the second derivative of the external potential, U″ < 5 × 10¹⁰ J·m–4, is much lower than theoretical estimates in the small fluctuation regime. Typical calculations assume a van der Waals bilayer–bilayer potential (Hamacker constant H = 7.5 × 10⁻²¹ J) and a hydration repulsion Phlhye–lH2O/hy, where the hydration pressure Ph = 4 × 10⁸ Pa and half-length lhy = 0.2 nm (2, 42). With these values, we find a potential minimum around DH2O ≈ 1.8 nm, where U″ ≈ 2 × 10¹⁴ J/m4, which is not much displaced in presence of fluctuations when κ = 10–19 J. The limit of usually accepted values, H ∼ 10–21 J (weaker attraction) and Ph ∼ 4 × 10⁹ Pa with lhy = 0.3 nm (stronger repulsion), yields U″ ≈ 3 × 10¹¹ J/m4, still an order-of-magnitude larger than the experimental upper bound. We do not know whether this discrepancy arises from sample properties (sensitivity of the potential to physical parameters) or from the approximations used in the theory [self-consistent treatment of the fluctuations (18, 20), neglected here]. This point could be clarified only with experiments that access even smaller q (larger scales).
The above results indicate that, even in fluid phase,  dominates other terms of the fluctuation spectrum (Eq. 6). At small q (large scales), the cross-over to the U″-dominated range is at least at (γ/U″)1/2 ≈ 10–7 m, close to the limit of the experimentally accessible range. At large q (small scales), the cross-over to κ-dominated range is at (γ/κ)1/2 ≈ 2–5 × 10⁷ m–1 (fluid phase) and ≈ 108 m–1 (gel phase) and is experimentally accessible.
Summary
We combine specular and nonspecular scattering measurements of single lipid bilayers of phosphocholines with 17 or 18 carbons floating in water near a flat wall covered by a lipid layer. In a single set of experiments, we present a coherent picture of the underlying structure and fluctuations of the free phospholipid bilayer.
First, we determine the bilayer structure: its electron density profile, the corresponding molecular dimensions, and their variations across the bilayer gel-fluid transition, which is detected at a lowered temperature. Second, the scattering is compared to that of a two-dimensional membrane describe by a Helfrich Hamiltonian, allowing us to deduce the three main physical parameters that govern the bilayer height fluctuations: (i) The wall attraction potential is unexpectedly low; (ii) the surface tension, roughly independent on chain length and temperature, is moderate but large enough to dominate the intermediate range of the fluctuation spectrum; and (iii) the bending modulus abruptly decreases by an order of magnitude from 10–18 J to 10–19 J at the bilayer gel to fluid transition.
Supplementary Material
Acknowledgments
We thank O. Konovalov and A. Fera for x-ray experiments; H. Petrache for discussions; and C. Marques, M. Rawiso, and D. Riveline for a critical reading of the manuscript.
Author contributions: J.D., E.B.-A., T.C., G.F., and F.G. designed research; J.D., E.B.-A., A.B., T.C., G.F., F.G., S.M., F.R., and B.S. performed research; J.D., T.C., G.F., and S.M. analyzed data; and J.D., T.C., and F.G. wrote the paper.
This paper was submitted directly (Track II) to the PNAS office.
Abbreviations: di-C17-PC, 1,2-diheptadecanoyl-sn-glycero-3-phosphocholine; di-C18-PC, 1,2-distearoyl-sn-glycero-3-phosphocholine; LB, Langmuir–Blodgett; LS, Langmuir–Schaeffer.
References
- 1.Katsaras, J. & Gutberlet, T., eds. (2001) Lipid Bilayers: Structure and Interactions (Springer, Berlin).
- 2.Lipowsky, R. (1995) in Handbook of Biological Physics, eds. Lipowsky, R. & Sackmann, E. (Elsevier, Amsterdam), Vol. 1.
- 3.Helfrich, W. (1973) Z. Naturforsch. 28, 693–703. [DOI] [PubMed] [Google Scholar]
- 4.Mouritsen, O. & Andersen, O., eds. (1998) In Search of a New Biomembrane Model, Biol. Skr. Dan. Vid. Selsk. (Copenhagen), 49.
- 5.Nagle, J. & Tristram-Nagle, S. (2000) Biochim. Biophys. Acta Biomembranes 1469, 159–195. [DOI] [PMC free article] [PubMed] [Google Scholar]
- 6.Helfrich, W. (1978) Z. Naturforsch. 33, 305–315. [Google Scholar]
- 7.Pécréaux, J., Döbereiner, H. G., Prost, J., Joanny, J. F. & Bassereau, P. (2004) Eur. Phys. J. E 13, 277–290. [DOI] [PubMed] [Google Scholar]
- 8.Sackmann, E. (1994) Fed. Eur. Biochem. Soc. 346, 3–16. [Google Scholar]
- 9.Kummrow, M. & Helfrich, W. (1991) Phys. Rev. A 44, 8356–8360. [DOI] [PubMed] [Google Scholar]
- 10.Lee, C.-H., Lin, W.-C. & Wang, J. (2001) Phys. Rev. E 64, 020901. [DOI] [PubMed] [Google Scholar]
- 11.Mishima, K., Nakamae, S., Ohshima, H. & Kondo, T. (2001) Chem. Phys. Lipids 110, 27–33. [DOI] [PubMed] [Google Scholar]
- 12.Constantin, D., Mennicke, U., Li, C. & Salditt, T. (2003) Eur. Phys. J. E 12, 283–290. [DOI] [PubMed] [Google Scholar]
- 13.Brochard, F. & Lennon, J.-F. (1975) J. Phys. (Paris) 36, 1035–1047. [Google Scholar]
- 14.Evans, E. & Rawicz, W. (1990) Phys. Rev. Lett. 17, 2094–2097. [DOI] [PubMed] [Google Scholar]
- 15.Méléard, P., Gerbaud, C., Pott, T., Fernandes-Puente, L., Bivas, I., Mitov, M., Dufourcq, J. & Bothorel, P. (1997) Biophys. J. 72, 2616–2629. [DOI] [PMC free article] [PubMed] [Google Scholar]
- 16.Döbereiner, H.-G., Evans, E., Kraus, M., Seifert, U. & Wortis, M. (1997) Phys. Rev. E 55, 4458–4474. [Google Scholar]
- 17.Dimova, R., Pouligny, B. & Dietrich, C. (2000) Biophys. J. 79, 340–346. [DOI] [PMC free article] [PubMed] [Google Scholar]
- 18.Mecke, K., Charitat, T. & Graner, F. (2003) Langmuir 19, 2080–2087. [Google Scholar]
- 19.Fragneto, G., Charitat, T., Bellet-Amalric, E., Cubitt, R. & Graner, F. (2003) Langmuir 19, 7695–7702 [Google Scholar]
- 20.Lipowsky, R. & Leibler, S. (1986) Phys. Rev. Lett. 56, 2541–2544. [DOI] [PubMed] [Google Scholar]
- 21.Charitat, T., Bellet-Amalric, E., Fragneto, G. & Graner, F. (1999) Eur. Phys. J. B 8, 583–593. [Google Scholar]
- 22.Vig, J. (1985) Vac. Sci. Technol. A 3, 1027–1034. [Google Scholar]
- 23.Hughes, A. V., Goldar, A., Gerstenberg, M. C., Roser, S. J. & Bradshaw, J. (2002) J. Phys. Chem. Chem. Phys. 4, 2371–2378. [Google Scholar]
- 24.Fradin, C., Luzet, D., Braslau, A., Alba, M., Muller, F., Daillant, J., Petit, J. & Rieutord, F. (1998) Langmuir 14, 7327–7330. [Google Scholar]
- 25.Daillant, J. & Sentenac, A. (1999) in Lecture Notes in Physics, eds. Daillant, J. & Gibaud, A. (Springer, Heidelberg), Vol. m58, pp. 121–162. [Google Scholar]
- 26.Daillant, J. & Alba, M. (2000) Rep. Prog. Phys. 10, 1725–1777. [Google Scholar]
- 27.Wiener, M., Suter, R. & Nagle, J. (1989) Biophys. J. 55, 315–325. [DOI] [PMC free article] [PubMed] [Google Scholar]
- 28.Nagle, J. & Wiener, M. (1989) Mol. Cryst. Liq. Cryst. 144, 235–255. [Google Scholar]
- 29.Naumann, C., Brumm, T. & Bayerl, T. M. (1992) Biophys. J. 63, 1314–1319. [DOI] [PMC free article] [PubMed] [Google Scholar]
- 30.Woodward, J. & Zasadzinski, J. (1996) Phys. Rev. E 53, 3044–3047. [DOI] [PubMed] [Google Scholar]
- 31.Mora, S., Daillant, J., Luzet, D. & Struth, B. (2004) Europhys. Lett. 66, 694–700. [Google Scholar]
- 32.Bassereau, P. & Pincet, F. (1997) Langmuir 13, 7003–7007. [Google Scholar]
- 33.Tristam-Nagle, S., Liu, Y., Legleiter, J. & Nagle, J. (2002) Biophys. J. 83, 3324–3335. [DOI] [PMC free article] [PubMed] [Google Scholar]
- 34.Sun, W., Sutter, R., Knewtson, M., Worthington, C., Tristram-Nagle, S., Zhang, R. & Nagle, J. (1994) Phys. Rev. E 49, 4665–4676. [DOI] [PubMed] [Google Scholar]
- 35.Tristram-Nagle, S., Petrache, H. I. & Nagle, J. F. (1998) Biophys. J. 75, 917–925. [DOI] [PMC free article] [PubMed] [Google Scholar]
- 36.Kenworthy, A., Simon, S. & McIntosh, T. (1995) Biophys. J. 68, 1903–1920. [DOI] [PMC free article] [PubMed] [Google Scholar]
- 37.Petrache, H., Tristam-Nagle, S. & Nagle, J. (1998) Chem. Phys. Lipids 95, 83–94. [DOI] [PMC free article] [PubMed] [Google Scholar]
- 38.Fernandez-Puente, L., Bivas, I., Mitov, M. D. & Méléard, P. (1994) Europhys. Lett. 29, 181–186. [Google Scholar]
- 39.Evans, E. & Needham, D. (1987) J. Phys. Chem. 91, 4219–4228. [Google Scholar]
- 40.Hunter, D. G. & Frisken, B. J. (1998) Biophys. J. 74, 2996–3002. [DOI] [PMC free article] [PubMed] [Google Scholar]
- 41.Fournier, J. B., Ajdari, A. & Peliti, L. (2001) Phys. Rev. Lett. 86, 4970–4973. [DOI] [PubMed] [Google Scholar]
- 42.Israelachvili, J. (1992) Surface and Interface Forces (Academic, London).
Associated Data
This section collects any data citations, data availability statements, or supplementary materials included in this article.


