Abstract
The emergence of drug-resistant strains of bacteria is an increasing threat to society, especially in hospital settings. Many antibiotics that were formerly effective in combating bacterial infections in hospital patients are no longer effective because of the evolution of resistant strains, which compromises medical care worldwide. In this article, we formulate a two-level population model to quantify key elements in nosocomial (hospital-acquired) infections. At the bacteria level, patients infected with these strains generate both nonresistant and resistant bacteria. At the patient level, susceptible patients are infected by infected patients at rates proportional to the total bacteria load of each strain present in the hospital. The objectives of this paper are to analyze the dynamic elements of nonresistant and resistant bacteria strains in epidemic populations in hospital environments and to provide understanding of measures to avoid the endemicity of resistant antibiotic strains.
Keywords: mathematical populaton dynamics, nosocomial infection
Nosocomial (hospital-acquired) infections caused by antibiotic-resistant bacteria pose a serious threat to public health (1–3). Despite interventions aimed at limiting the emergence and spread of antimicrobial-resistant bacteria, including methicillin-resistant Staphylococcus aureus, vancomycin-resistant Enterococci, and multidrug-resistant Gram-negative bacilli, recovery of these pathogens continues to rise rapidly (4–7). Antimicrobial-resistant bacteria are transmitted among patients in hospitals through the contamination of the institutional environment or through human vectors. These bacteria also serve as a reservoir of antibiotic-resistance plasmids that are horizontally transmitted among strains and species of bacteria.
Part of the adaptation of bacteria to their environment involves the use of genetic information borne on extra chromosomal elements known as plasmids, some of which are capable of recombination with the chromosome of their host cells. Other naturally occurring plasmids are known only in an independent state. All of these plasmids are capable of replication and transmission in the course of cell division, and some mechanisms of infectious transmission have been identified. Plasmids are vertically transferred to daughter cells during binary fission and can be horizontally transferred from infected (donors) to uninfected cells (recipients) through conjugation (8). In some cases, the plasmid DNA is surrounded by a protein coat and is transmitted as an extracellular virus. In other cases, infectious transmission requires contact between cells carrying that plasmid and cells free of it (9–11). Plasmids can transfer copies of themselves to plasmid-free bacteria at high rates. A typical example is extended-spectrum β-lactamase Gram-negative bacilli, which are plasmid-mediated and are rapidly increasing in the hospital setting (12).
Simple mass-action models have been used to study the spread of conjugative plasmids in liquid culture (9, 10, 13–15). Stewart and Levin (9) studied the population dynamics of a class of conjugationally transmitted plasmids where the genes coding for replication, conjugation, and other plasmid characters are transmitted as a single inviolate element. They demonstrated that, as a consequence of infectious transmission, there exists a broad set of biologically possible conditions where nonantibiotic-determining plasmids could become established and would be maintained at substantial frequencies in bacterial populations. Bergstrom et al. (16) showed that plasmids cannot persist simply by bearing genes beneficial to their bacterial hosts and presented a pair of simple illustrative models intended to highlight two processes that could account for the long-term existence of bacterial plasmids.
Multidrug resistance via genes borne on conjugationally transmitted plasmids is among the best-known processes for bacterial adaptation (17). A number of interventions have been proposed to limit the spread of antibiotic-resistant bacteria. Preventative measures (such as hand washing and barrier precautions) are designed to reduce bacteria transmission among hospitalized patients. To judge the success of these interventions and to compare the merits of different interventions, several mathematical models have been proposed to provide quantitative predictions, which give rise to criteria for evaluating the interventions (18–20). Lipsitch et al. (20) developed a mathematical model of the transmission and spread of antimicrobial resistance in a hospital setting. The model can be used to explain a number of features of nosocomial infections, such as the rapid rate of change in response to interventions, the efficacy of nonspecific control measures, and the observation that use of one drug is an individual risk factor for the acquisition of resistance to other drugs, even in the absence of crossresistance or associated linkage selection. Recently, a few other interesting models have also been proposed for the study of antibiotic resistance in hospitals (refs. 16 and 21–26 and E.M.C.D., M.A. Hom, and G.F.W., unpublished results).
The relation between antibiotic usage and antibiotic resistance for many types of pathogens is largely mediated by population-level selection. Antimicrobial use and patient-to-patient transmission are inextricably linked for promoting antibiotic resistance (27). So far, modeling antibiotic resistance has been either at the bacteria (9, 16) or the patient level (refs. 18, 20, and 23 and E.M.C.D., M. A. Hom, and G.F.W., unpublished results). To the best of our knowledge, antibiotic resistance at both the bacteria and the patient levels has not been explored (ref. 28 and E.M.C.D., P.M., S.R., and G.F.W., unpublished results). In this article, we formulate a two-level population model to quantify key elements in nosocomial epidemics. At the bacteria level, both nonresistant and resistant bacteria strains are generated by patients infected with these strains. We assume that the emergence of resistance can occur only through acquisition of plasmids, and resistance through other mechanisms (such as chromosomal, efflux pumps, etc.) is not considered here. At the patient level, susceptible patients are infected by infected patients at rates proportional to the total bacteria load of each strain present in the hospital. The main objective of this model is to understand how the resistant strain becomes endemic in the hospital, and what measures are effective in preventing this from happening.
The Bacteria Population Level in a Single Infected Host
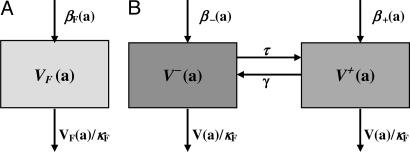
To determine the contribution of each infected patient to the total bacterial load in the hospital, we track each one according to their infection age (the time since becoming infected; see Fig. 1). For a patient infected with only nonresistant bacteria, let VF(a) represent the population level of nonresistant bacteria present in the patient at infection age a (see Fig. 1A). VF(a) satisfies the logistic growth equation (see Table 1),
 |
[1] |
where VF0 is the number of bacteria inoculated at the time of acquisition (a = 0), βF is the proliferation rate of bacteria in the individual (log2/βF is the doubling time of the bacteria without limitation of carrying capacity), and βFκF is the carrying capacity (the maximal sustainable bacteria population in an infected patient).
Fig. 1.
Flow diagram of bacteria populations in an infected patient. (A) Plasmid-free bacteria in a single infected host before antibiotic treatment. Here, log(2)/βF is the doubling time, and βFκF is the carrying capacity of the bacteria population. (B) Plasmid-free and plasmid-bearing bacteria in a single infected host before antibiotic treatment. Here log(2)/β- is the doubling time of the plasmid-free strain, log(2)/β+ is the doubling time of the plasmid-bearing strain, τ is the recombination rate, and γ is the reversion rate.
Table 1. Variables and parameters at the bacterial level.
| Variables | Parameters |
|---|---|
| VF(a) | Population of plasmid-free (nonresistant) bacteria present in a patient infected only with plasmid-free bacteria at infection age a |
| V- (a) | Population of plasmid-free (nonresistant) bacteria present in a patient infected with plasmid-free and plasmid-bearing (resistant) bacteria at infection age a |
| V+ (a) | Population of plasmid-bearing (resistant) bacteria present in a patient infected with plasmid-free and plasmid-bearing bacteria at infection age a |
| βF | Proliferation rate of plasmid-free strain in a patient infected with only plasmid-free bacteria |
| κF | The carrying capacity of bacteria in the host is βFκF |
| β-, β+ | Proliferation rates of plasmid-free and plasmid-bearing strains in a patient infected with both plasmid-free and plasmid-bearing strains |
| γ | Reversion rate of plasmid bearing to plasmid-free |
| τ | Recombination rate of plasmid-free and plasmid-bearing to plasmid-bearing strains |
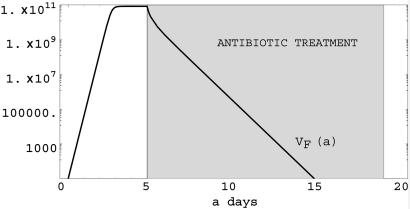
From Eq. 1, we can see that if βF > 0, then lima→∞ VF(a) = βFκF; if βF <0, then lima→∞ VF(a) = 0. This indicates that if the proliferation rate is positive, then the bacterial population will reach the carrying capacity. If the proliferation rate becomes negative (via treatment), then the bacteria population in the patient will die out (see Fig. 2).
Fig. 2.
Simulation of Eq. 1. Plasmid-free bacteria population in a single infected host before and during antibiotic treatment. Here βF = 12.0 log(2) (the doubling time is 2 h before treatment), βF = -2.0 after treatment, and κF = 1010. Treatment starts at day 5 and lasts 15 days. Treatment is successful in eliminating the nonresistant bacterial strain.
Plasmid is extrachromosomal DNA in the bacteria cell whose genes may confer resistance to antibiotics. A bacterium containing plasmid may revert to a bacterium without plasmid. On the other hand, a bacterium with plasmid may combine with a bacterium not containing plasmid to yield two bacteria with plasmid. For a patient infected with resistant bacteria, both strains are generated through proliferation by cell division, recombination of plasmid-bearing (resistant) and plasmid-free (nonresistant) bacteria, and reversion of plasmid-bearing to plasmid-free bacteria.
Let V-(a) and V+(a) denote the population levels of plasmid-free and plasmid-bearing bacteria at infection age a, respectively, in an individual infected with both resistant and nonresistant bacteria. Thus, V-/(V- + V+) is the fraction of bacteria that are plasmid-free, and V+/(V- + V+) is the fraction of bacteria that are plasmid-bearing (see Fig. 1B). Let γ be the reversion rate of plasmid-bearing to plasmid-free bacteria. Then γV+(a) describes the reversion process. Let τ be the recombination rate of plasmid-free and plasmid-bearing to plasmid-bearing bacteria. Then τV-(a)V+(a)/(V-(a) + V+(a)) represents the recombination process. Let β- and β+ be the proliferation rates of plasmid-free and plasmid-bearing strains, respectively. Then we assume V-(a) and V+(a) satisfy
 |
[2] |
with  and
and  as the number of bacteria initially.
System 2 has at most three equilibria: the trivial equilibrium E0 = (0,0) (no infection), the semitrivial equilibrium EF = (κF β-,0) (infected only by plasmid-free bacteria), and the positive equilibrium
 |
(infected by both plasmid-free and plasmid-bearing bacteria) if σ>0, where σ = τ - γ + β+ - β-. More precisely, by the results in the Supporting Text, which is published as supporting information on the PNAS web site (Theorem A5), we have the following:
If σ = τ - β+ - β- < 0, then system 2 has two equilibria, E0 (unstable) and EF (stable), i.e., lima→∞ V- = κFβ-, lima→∞ V+ (a) = 0.
If σ = τ - γ + β+ - β- > 0, then system 2 has three equilibria, E0 (unstable), EF (unstable), and E* (stable), i.e.,
 |
 |
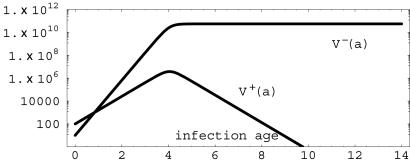
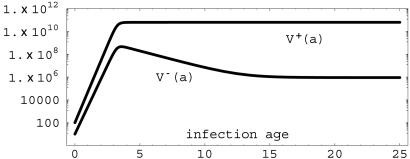
The solutions of system 2 track over time the total bacterial load of patients infected with the resistant bacterial strains in terms of their infection age. Such patients harbor both resistant [V+(a)] and nonresistant [V-(a)] strains. If the recombination (τ) and proliferation rates of plasmid-bearing bacteria (β+) are decreased or the reversion (γ) and proliferation rates (β-) of plasmid-free bacteria are increased so that σ = τ - γ + β+ - β- < 0, then the plasmid-free bacteria population will reach the carrying capacity, and the plasmid-bearing bacteria population will die out (see Fig. 3). On the other hand, if the reversion (γ) and proliferation rates (β-) of plasmid-free bacteria are decreased or the recombination (τ) and proliferation rates (β+) of plasmid-bearing bacteria are increased so that σ = τ - γ + β+ - β- > 0, then both plasmid-free and plasmid-bearing bacteria population in the host will persist and converge to steady-state values (see Fig. 4). In the absence of treatment, the proliferation rate of the wild type (nonresistant) has selective advantage over the resistant strain. In the presence of treatment, the resistant strain has selective advantage over the nonresistant strain, because it is unaffected by the drug.
Fig. 3.
Simulation of system 2 with β- = 8.0 × log(2), β+ = 4.0× log(2), γ = 0.00001, τ = 0.001, κF = 1010, and σ = -2.77 < 0. The plasmid-free [V-(a)] population has lima→∞ V- (a) = 5.55 × 10¹⁰, and the plasmid-bearing [V+(a)] population has lima→∞ V+(a) = 0.
Fig. 4.
Simulation of system 2 with β- = 8.0 × log(2), β+ = 9.0 × log(2), γ = 0.00001, τ = 0.001, κF = 1010 and σ = 0.69 > 0. The plasmid-free [V-(a)] population has lima→∞ V-(a) = 1.27 × 10⁶, and the plasmid-bearing [V+(a)] population has lima→∞ V+(a) = 6.23 × 10¹⁰.
The Patient Population Level in the Hospital
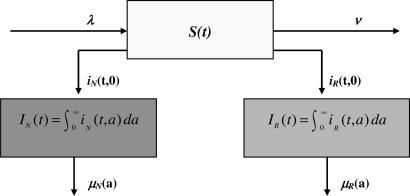
Let S(t) be the number of susceptible patients in the hospital at time t. Let iN(t, a) and iR(t, a) be the densities of individuals infected by bacteria nonresistant and resistant to antibiotics at time t and infection age a, respectively (see Fig. 5). Then
 |
are the numbers of patients infected by bacteria nonresistant and resistant to antibiotics at time t ≥ 0, respectively. Define
 |
Then
 |
denotes the total number of nonresistant bacteria in the environment at time t > 0, and
 |
denotes the total number of resistant bacteria in the environment at time t > 0. Thus, the total, nonresistant, and resistant infection rates are
 |
respectively.
Fig. 5.
Flow diagram of epidemic populations in the hospital. Susceptible patients acquire nonresistant or resistant bacteria at infection age 0 at time t.
The bacteria and patient population levels are coupled into the following system (see Table 2):
 |
[3] |
where (S0, φN, φR) ∈ [0, ∞) × L1(0, ∞) × L1(0, ∞).
Table 2. Variables and parameters at the patient level.
| Variables | Parameters |
|---|---|
| S(t) | Total number of susceptible patients in the hospital at time t |
| iN(t, a) | Age density of individuals infected by bacteria nonresistant to antibiotics at time t and infection age a |
| iR(t, a) | Age density of individuals infected by bacteria resistant to antibiotics at time t and infection age a |
| IN(t) | Total number of patients infected by nonresistant bacteria at time t |
| IR(t) | Total number of patients infected by resistant bacteria at time t |
| λ | Patient admission rate |
| η | Infection rate (exposure of patients to bacteria in the hospital) |
| ν | Exit rate from the hospital of susceptible patients |
| μN(a) | Exit rate of patients with infection age a infected with nonresistant bacteria |
| μR(a) | Exit rate of patients with infection age a infected with resistant bacteria |
In order to describe the outcomes of the epidemic in terms of the parameters in system 3, define
 |
 |
 |
The average length of time in the hospital while infected of a patient infected with only the nonresistant strain is  , where
  is the probability of remaining infected at least a days. The average bacterial load of nonresistant bacteria per patient infected only by nonresistant bacteria is HF = TF/LN. Similar interpretations hold for the average bacterial load HV- = TV-/LR (nonresistant) and HV+ = TV+/LR (resistant) per patient infected by both the nonresistant and resistant bacteria strains, where
  is the average length of time in the hospital while infected of a patient infected by both strains.
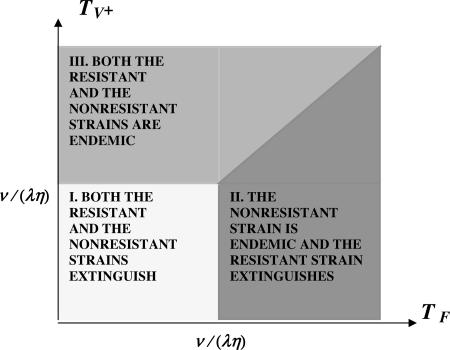
Let R0 = (λη/ν) max(TF, TV+). R0 is the number of secondary bacterial infections produced by a single patient infected with either the nonresistant or the resistant bacteria strain (29–32). If R0 < 1, then both strains extinguish. If R0 > 1 and TF > TV+, then the nonresistant strain becomes endemic, and the resistant strain extinguishes. If R0 > 1 and TV+ > TF, then both strains become endemic. From the formula for R0, it is evident that the average hospital bacterial loads HF and HV+ and infection durations LF and LV+ are critical values in determining the course of the epidemic. Each is strongly influenced by antibiotic use and, especially, overuse. By the results in Supporting Text, we distinguish three cases concerning the possible outcomes of the epidemic in terms of the equilibria for system 3 (the mathematica code for the all simulations is available upon request). The three cases depend on the relationship of λ, η, ν, TF, and TV+, as indicated in the diagram in Fig. 6. To prevent the endemicity of both strains, it is necessary to maintain both TF and TV+ lower than ν/(λη). If the nonresistant strain is endemic [TF > ν/(λη)], then the essential requirement to prevent the endemicity of the resistant strain is to maintain TV+ < TF, that is, to hold the average daily hospital-resistant bacteria load of patients infected with the resistant strain lower than the average daily hospital-nonresistant bacteria load of patients infected with the nonresistant strain.
Fig. 6.
Parametric determination of epidemics in the hospital. The admission rate λ, the average length of stay of uninfected patients 1/ν, the infection rate parameter η, and the average patient bacterial loads HF = TF/LN (nonresistant strain) and HR = TV+/LR (resistant strain) determine three possible epidemic outcomes.
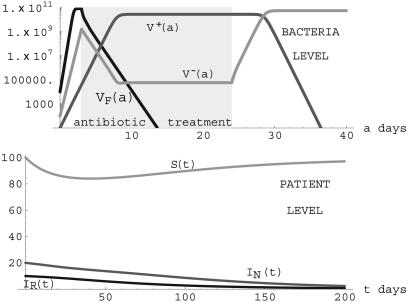
R0 = (λη/ν) max(TF, TV+) < 1. When the parameters lie in Region I, the only nontrivial steady state is E1 given by S = λ/ν, IN = 0, IR = 0. In this case, both the resistant and nonresistant strains go extinct. An illustration of this case is given in Fig. 7.
Fig. 7.
Simulation of system 3 when parameters lie in Region I. (Upper) Treatment starts on day 3 and lasts 21 days for patients undergoing treatment. βF = 12.0 × log(2) before treatment and -2.0 during treatment for patients infected only with the nonresistant strain. β- = 8.0 × log(2) before treatment and -2.0 during treatment and β+ = 4.0 × log(2) before and during treatment for patients infected with the resistant strain. γ = 0.00001, τ = 0.001, κF = 1010. Treatment eliminates the nonresistant strain in patients with only this strain but not in patients with the resistant strain. (Lower) λ = 5.0, ν = 0.05, η = 3.0 × 10⁻¹⁴, μN = 0.05, μR = 0.04, TF = 1.31 × 10¹¹ < TV- = 2.84 × 10¹¹, TV+ = 4.44 × 10¹¹, and R0 = 0.85 < 1. (S(t), IN(t), IR(t)) converges to the steady state (98,0,0).
R0 = (λη/ν) max(TF, TV+) = (λη/ν) TF > 1. When the parameters lie in Region II, in addition to E1, there is a nontrivial steady-state E2 given by
 |
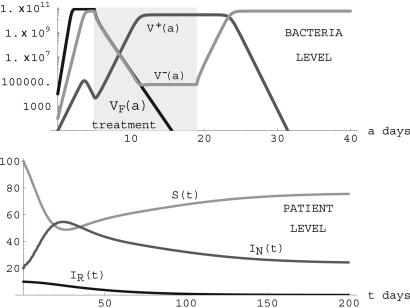
Notice that the condition R0 = (λη/ν)TF >1 ensures the existence of this nontrivial steady state. In this case, the nonresistant strain is endemic, and the resistant strain goes extinct. An illustration is given in Fig. 8. The changes from the simulation in Fig. 7 to the simulation in Fig. 8 are that the length of treatment is changed from 21 to 14 days, treatment starts on day 5 instead of day 3, and the transmission rate η is increased from 3.0 × 10⁻¹⁴ to 5.0 × 10⁻¹⁴.
Fig. 8.
Simulation of system 3 when parameters lie in Region II. (Upper) Treatment starts on day 5 and lasts 14 days for patients undergoing treatment.βF = 12.0 × log(2) before treatment and -2.0 during treatment for patients infected with the nonresistant strain. β- = 8.0 × log(2) before treatment and -2.0 during treatment, β+ = 4.0 × log(2) before and during treatment for patients infected with the resistant strain. γ = 0.00001, τ = 0.001, κ = 1010F. The nonresistant strain is present in patients with the resistant strain because of the reversion of plasmid-bearing to plasmid-free bacteria. (Lower) λ = 5.0, ν = 0.05, η = 5.0 × 10⁻¹⁴, μN = 0.05, μR = 0.04, TF = 2.62 × 10¹¹> TV + = 1.76 × 10¹¹, TV - = 6.30 × 10¹¹, and R0 = 1.31 > 1. The nonresistant strain becomes endemic, and the resistant strain is eliminated. (S(t), IN(t), IR(t)) converges to the steady state (76,24,0).
R0 = (λη/ν) max(TF, TV+) = (λη/ν) TV+ > 1. When the parameters lie in Region III, in addition to E1, there is a positive steady state E2 given by
 |
 |
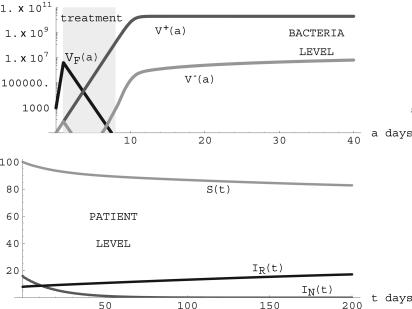
Notice that the condition R0 = (λη/ν) TV+ > 1 ensures the existence of this positive steady state. In this case, both the nonresistant and resistant strains are endemic. Although the nonresistant strain is necessarily positive in this steady state, its value may be extremely small and thus negligible. This case is seen in many hospitals in which resistant strains become endemic, whereas nonresistant strains go undetected over long periods of time. An illustration is given in Fig. 9. In this simulation, treatment is initiated at day 1 (before the bacteria population has peaked) and is stopped at day 8 (after the nonresistant strain is eliminated but before the resistant strain has peaked). This simulation illustrates the case of effective elimination of the nonresistant strain and endemicity of the resistant strain when the nonresistant strain does not have selective advantage over the resistant strain in patients harboring the resistant strain.
Fig. 9.
Simulation of system 3 when parameters lie in Region III. (Upper) Treatment starts on day 1 and lasts 7 days for patients undergoing treatment. βF = 12.0 × log(2) before treatment and -0.8 during treatment for patients infected with the nonresistant strain. β- = 3.0 × log(2) before treatment and -2.0 during treatment, β+ = 3.0 × log(2) before and during treatment for patients infected with the resistant strain. γ = 0.00001, τ = 0.001, κ = 1010F. (Lower) λ = 5.0, ν = 0.05, η = 5.0 × 10⁻¹⁴, μN = 0.05, μR = 0.05, TF = 5.62 × 10⁶< TV+ = 2.48 × 10¹¹, TV- = 5.48 × 10⁷, and R0 = 1.24 > 1. The population of patients infected only with the nonresistant strain is effectively eliminated, and patients infected with the resistant strain completely dominate. (S(t), IN(t), IR(t)) converges to the steady state (83,0,17).
Discussion
We have developed a model of nosocomial epidemics that describes transmission dynamics in terms of bacterial load at two separate levels, the bacterial load in individual patients and the total bacterial load of all patients in the hospital. At the bacterial level in individual patients, there are two classes of bacteria (nonresistant and resistant). At the patient level, there are three classes of patients (susceptibles, infectives infected by the nonresistant strain, and infectives infected by the resistant strain). The total hospital bacterial load of separate antibiotic nonresistant and resistant strains depends on both levels: (i) the number of bacteria harbored by individual patients through their stages of infection and use of antibiotics, and (ii) the number of patients infected with each of these strains. Nosocomial infection transmission of antibiotic resistance in hospitals is not typical of epidemic models, in which contact of susceptibles with infectives determines transmission dynamics. In the hospital setting, uninfected patient–infected patient contact is not the primary transmission of infection but rather patient–healthcare worker contact and patient–environment contact, which depends on hospital contamination. Total hospital contamination, in turn, depends on the bacterial load of individual patients.
A natural way to track the bacterial load in individual patients is infection age, which begins at age 0 upon acquisition. The bacterial load in individuals is a function of this infection age, as the infection progresses and treatment is administered. We analyze the population dynamics at this level (systems 1 and 2) and establish conditions on the parameters (cell doubling times, plasmid recombination rates, plasmid reversion rates, host-carrying capacity, and therapy schedules) for the bacterial loads of each strain within an infected individual Stability Analysis of System 2 in Supporting Text). We also analyze the transmission dynamics at the patient population level (system 3) and provide conditions on the parameters (hospital admission rates, length of stay, and exposure rates to total hospital bacterial load) to distinguish the mutually exclusive epidemic outcomes: (i) both the nonresistant infective and resistant infective populations extinguish, (ii) the nonresistant infective class becomes endemic but the resistant class does not, and (iii) both infective classes become endemic (Steady States for System 3 in Supporting Text).
Because these three cases are distinguished by simple conditions on the parameters at the bacteria and patient levels, it is possible to evaluate control measures that can alter epidemic outcomes. The impact of control measures such as isolation of patients infected with resistant strains, restricted use of antibiotics, and reduced or extended hospital stays can be discussed in terms of these parameters. The parametric input can be understood in terms of a single quantity: R0 = (λη/ν) max(TF, TV+), which measures the number of secondary bacterial infections generated by a patient infected with either strain. R0 involves the hospital admission rate λ, the average length of stay 1/ν of susceptible patients, the infection transmission parameter η, TF = HFLN (the average bacterial load of patients infected by nonresistant bacteria times their average infection lifespan), and TV+ = HV+LR (the average bacterial load of patients infected by resistant bacteria times their average infection lifespan). Because the hospital admission rate λ and average length of stay 1/ν of susceptible patients are largely uncontrollable, the quantities η, TF, and TV+ are critical in controlling the epidemic.
The prevention of endemicity of both nonresistant and resistant bacterial strains requires R0 < 1. If R0 > 1, then max(TF, TV+) determines whether the resistant strain extinguishes (TV+ < TF) or becomes endemic (TV+ > TF). The importance of maintaining strict compliance with hospital hygiene measures (reducing η in the formula for R0) is illustrated by the examples in Figs. 7 (R0 < 1), 8, and 9 (R0 > 1), where the infection rate parameter η is significantly higher in Figs. 8 and 9. The simulations in Figs. 7 and 9 illustrate the difficulty in maintaining TV+ < TF. Treatment is successful only against the nonresistant strain and, in fact, hugely amplifies the resistant strain, if used by patients harboring this strain. The essential difference in Figs. 8 (TV+ < TF) and 9 (TV+ > TF) is that the nonresistant strain does not have a selective advantage over the resistant strain in patients harboring the resistant strain, and the resistant strain is dominant when therapy is stopped. The implication for maintaining TV+ < TF is that antibiotic therapy for patients infected with the resistant strain must be strictly limited. Another essential consideration in maintaining TV+ < TF is reducing the average hospital infection lifetime LR of patients infected by the resistant strain in the general hospital population, which can be accomplished by sequestering patients infected with the resistant strain from the general hospital population.
Conclusion
The model we have developed here presents an ecological view of antibiotic-resistance evolution in hospitals by connecting two environmental levels, bacteria in infected hosts and patients in the hospital. The main advantage of this modeling approach is that it allows quantification of the consequences of therapy regimens and hospital controls in terms of the complex dynamics of competing bacterial strains. Our model illustrates the essential difficulties in controlling the advance of resistant bacterial infections in hospitals. Antibiotic therapy is necessary and effective for patients infected with the nonresistant strain but ineffective for patients infected with the resistant strain. In the absence of treatment, the nonresistant strain dominates the resistant strain. But treatment administered to patients infected with the resistant strain reverses this domination and may contribute inexorably to the eventual endemicity of the resistant strain.
Supplementary Material
Acknowledgments
The research for this paper was partially supported by National Science Foundation Grants DMS-0109148 (to G.F.W.) and DMS-0412047 (to S.R.).
Author contributions: G.F.W., E.M.C.D., P.M., and S.R. designed research, performed research, contributed new reagents/analytic tools, and wrote the paper.
This paper was submitted directly (Track II) to the PNAS office.
References
- 1.Cohen, M. L. (1992) Science 257, 1050-1055. [DOI] [PubMed] [Google Scholar]
- 2.Neu, H. C. (1992) Science 257, 1064-1073. [DOI] [PubMed] [Google Scholar]
- 3.National Nosocomial Infections Surveillance System (2001) Am. J. Infect. Control 29, 404-421. [DOI] [PubMed] [Google Scholar]
- 4.National Nosocomial Infections Surveillance System Report (2003) Am. J. Infect. Control 31, 481-509. [DOI] [PubMed] [Google Scholar]
- 5.Tacconelli, E., Venkataram, L., DeGirolami, T. & D'Agata, E. M. C. (2004) J. Antimicrobial. Chemother. 53, 474-479. [DOI] [PubMed] [Google Scholar]
- 6.Tacconelli, E., Yokoe, D. & D'Agata, E. M. C. (2004) Clin. Infect. Dis. 39, 964-970. [DOI] [PubMed] [Google Scholar]
- 7.D'Agata, E. M. C. (2004) Infect. Control Hosp. Epidemiol. 25, 842-846. [DOI] [PubMed] [Google Scholar]
- 8.Thomas, C. M. (2000) The Horizontal Gene Pool: Bacterial Plasmids and Gene Spread (Harwood, Amsterdam).
- 9.Stewart, F. M. & Levin, B. R. (1977) Genetics 87, 209-228. [DOI] [PMC free article] [PubMed] [Google Scholar]
- 10.Levin, B. R. & Stewart, F. M. (1980) Genetics 94, 425-443. [DOI] [PMC free article] [PubMed] [Google Scholar]
- 11.Levin, B. R., Stewart, F. M. & Rice, V. A. (1979) Plasmid 2, 247-260. [DOI] [PubMed] [Google Scholar]
- 12.Jacoby, G. A. & Munoz-Price, L. S. (2005) N. Engl. J. Med. 352, 380-391. [DOI] [PubMed] [Google Scholar]
- 13.Bergstrom, C. R., Lipsitch, M. & Levin, B. R. (2000) Genetics 155, 1505-1519. [DOI] [PMC free article] [PubMed] [Google Scholar]
- 14.Paulsson, J. (2002) Genetics 161, 1373-1384. [DOI] [PMC free article] [PubMed] [Google Scholar]
- 15.Turner, P. E. (2004) Genetics 167, 9-20. [DOI] [PMC free article] [PubMed] [Google Scholar]
- 16.Bergstrom, C. T., Lo, M. & Lipsitch, M. (2004) Proc. Natl. Acad. Sci. USA 101, 13285-13290. [DOI] [PMC free article] [PubMed] [Google Scholar]
- 17.Falkow, S. (1975) Infectious Multiple Drug Resistance (Pion, London).
- 18.Austin, D. J., Kristinsson, K. G. & Anderson, R. M. (1999) Proc. Natl. Acad. Sci. USA 96, 1152-1156. [DOI] [PMC free article] [PubMed] [Google Scholar]
- 19.Bonhoeffer, S., Lipsitch, M. & Levin, B. R. (1997) Proc. Natl. Acad. Sci. USA 94, 12106-12111. [DOI] [PMC free article] [PubMed] [Google Scholar]
- 20.Lipsitch, M., Bergstrom, C. T. & Levin, B. R. (2000) Proc. Natl. Acad. Sci. USA 97, 1938-1943. [DOI] [PMC free article] [PubMed] [Google Scholar]
- 21.Bonten, M. J. M., Austin, D. J. & Lipsitch, M. (2001) Clin. Infect. Dis. 33, 1739-1746. [DOI] [PubMed] [Google Scholar]
- 22.Cooper, B. S., Medley, G. F., Stone, S. P., Kibbler, C. C., Cookson, B. D., Roberts, J. A., Duckworth, G., Lai, R. & Ebrahim, S. (2004) Proc. Natl, Acad. Sci. USA 101, 10223-10228. [DOI] [PMC free article] [PubMed] [Google Scholar]
- 23.D'Agata, E. M. C., Horn, M. A. & Webb, G. F. (2002) J. Infect. Dis. 185, 766-773. [DOI] [PubMed] [Google Scholar]
- 24.Pelupessy, I., Bonten, M. C. M. & Diekmann, O. (2002) Proc. Natl. Acad. Sci. USA 99, 5601-5605. [DOI] [PMC free article] [PubMed] [Google Scholar]
- 25.Smith, D. L., Dushoff, J., Perencevich, E. N., Harris, A. D. & Levin, S. A. (2004) Proc. Natl. Acad. Sci. USA 101, 3709-3714. [DOI] [PMC free article] [PubMed] [Google Scholar]
- 26.Smith, D. L., Levin, S. A. & Laxminarayan, R. (2005) Proc. Natl. Acad. Sci. USA 101, 3153-3158. [DOI] [PMC free article] [PubMed] [Google Scholar]
- 27.Lipsitch, M. & Samore, M. H. (2002) Emerg. Infect. Dis. 8, 347-354. [DOI] [PMC free article] [PubMed] [Google Scholar]
- 28.Levin, S. A. & Andreasen, V. (1999) Proc. Natl. Acad. Sci. USA 96, 800-801. [DOI] [PMC free article] [PubMed] [Google Scholar]
- 29.Anderson, R. M. & May, R. M. (1991) Infectious Diseases of Humans: Dynamics and Control (Oxford Univ. Press, Oxford, U.K.).
- 30.Diekmann, O. & Heesterbeek, J. A. P. (2000) Mathematical Epidemiology of Infectious Diseases: Model Building, Analysis and Interpretation (Wiley, Chichester, U.K.).
- 31.Brauer, F. & Castillo-Chavez, C. (2000) Mathematical Models in Population Biology and Epidemiology (Springer, New York).
- 32.Thieme, H. R. (2003) Mathematics in Population Biology (Princeton Univ. Press, Princeton, NJ).
Associated Data
This section collects any data citations, data availability statements, or supplementary materials included in this article.


