

Abstract
We describe a new approach to explore and quantify the sequence space associated with a given protein structure. A set of sequences are optimized for a given target structure, using all-atom models and a physical energy function. Specificity of the sequence for its target is ensured by using the random energy model, which keeps the amino acid composition of the sequence constant. The designed sequences provide a multiple sequence alignment that describes the sequence space compatible with the structure of interest; here the size of this space is estimated by using an information entropy measure. In parallel, multiple alignments of naturally occurring sequences can be derived by using either sequence or structure alignments. We compared these 3 independent multiple sequence alignments for 10 different proteins, ranging in size from 56 to 310 residues. We observed that the subset of the sequence space derived by using our design procedure is similar in size to the sequence spaces observed in nature. These results suggest that the volume of sequence space compatible with a given protein fold is defined by the length of the protein as well as by the topology (i.e., geometry of the polypeptide chain) and the stability (i.e., free energy of denaturation) of the fold.
The sequences of naturally occurring proteins are defined by evolutionary selective pressure, which is controlled by a fine balance of function, stability, and kinetics. Although most random mutations of sequences are unlikely to enhance stability or function, they can be accepted by natural selection as long as they are neutral (or near neutral). As a consequence, the size of the sequence space compatible with a given protein fold is very large (although small compared with the full space a protein sequence can explore, whose size is 20N, where N is the number of residues of the protein). The number of compatible amino acids at a given position in a protein is structure-dependent: some local structures such as tight turns have energetic constraints that can be satisfied only by small amino acids such as glycine, alanine, or proline. These differences at the residue level extend to differences among whole protein domains. The 32,000 protein domains contained in the Protein Data Bank (PDB) as of March 1, 2001 can be clustered into 564 different structural families or folds, and the sizes of these families are found to vary greatly (1). A large number of these folds have a single representative, whereas other folds, such as the TIM fold or the Ig fold, have hundreds of representatives in the PDB (2). The question arises whether these differences are a consequence of differences in function and/or stability. We cannot also exclude the effect of bias in the sampling properties of the PDB database, which contains a very small subset of all proteins that were chosen for their biological interests as well as for the feasibility of their structure determination. In this article, we focus on the influence of the stability of a protein (i.e., its free energy of denaturation) on the size of its compatible sequence space.
Many proteins maintain their structure while undergoing extensive mutations. For example, alanine substitution of 10 consecutive residues in bacteriophage T4 lysozyme leads to only minor structural differences (3). On the other hand, a single double mutation can generate a dramatic structural change, as observed in the Arc repressor for which the interchange of the sequence position of residues 11 and 12 leads to a new structure in which each β-strand is replaced by an α-helix (4). These seemingly conflicting results have lead to a complicated picture of protein sequence evolution: it is not clear whether a protein fold can evolve into a new fold by accumulation of simple point mutations (5). As a first step toward a better understanding of evolution, studies have focused on characterizing the protein sequence space compatible with a given protein structure, the so-called inverse folding problem (6, 7). A large range of methods, including in vitro experiments mimicking evolution (8–10) and fully automated computer protein design (11–13), has been proposed for searching sequences that would stabilize a given protein structure with improved stability or with a new activity. Here we propose an extension of these methods and present a computational approach, which derives the size of the sequence space compatible with a given protein structure. Our results are validated by comparison with the size of the sequence space derived from naturally observed proteins.
Methods
Characterizing Sequence Space.
A sequence, Ai, that is compatible with a target protein structure, C, is characterized by its energy, E(Ai,C), corresponding to the energy of the model protein obtained by building the side chains corresponding to Ai onto the backbone of C (for a full definition of E, see ref. 14). This energy is derived from estimates of the physical forces that stabilize native protein structures: it includes van der Waals interactions, electrostatics, and an environment-free energy (15). The distance between two sequences, Ai and Aj, is defined as d(Ai, Aj) = 100 − I(Ai, Aj), where I is the number of identical residues expressed as a percentage of the length of the shorter sequence.
Building Model Proteins.
The compatibility of a sequence A with a protein C is tested by first threading it on the backbone template of the known native structure of C. Side chains are positioned by using an iterative self-consistent mean field approach (16). The procedure iteratively refines a conformational matrix of the side chains of the protein, CM, such that its current element at each cycle, CM(i,j), is the probability that side chain i of the protein adopts the conformation of its possible rotamer j. Interactions and hence probabilities depend solely on a Lennard Jones function for van der Waals interactions (electrostatics and solvent interactions are ignored). The rotamer with the highest probability in the optimized conformational matrix defines the conformation of the side chain in the final model.
Sequence Design: Stability vs. Specificity.
A sequence, A, designed for a target conformation, C, must be stable for that conformation. This stability is reached by minimizing E(A, C). Sequence A must also be specific to C, i.e., incompatible with competing folds. A rigorous solution to this problem requires simultaneous and complete explorations of sequence space and conformation space. We have shown, however, that under the approximation of the random energy model (17–19), specificity can be achieved by optimization in sequence space alone, provided that the amino acid composition of the sequence is held constant (14).
Canonical Sequence Design: Free Energy Optimization.
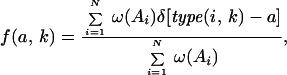
The thermodynamic stability of the protein A with conformation C is measured by the difference in free energies between the state C and a denatured state U:
 |
1 |
The energy difference between two sequences A and B is given by
 |
2 |
In the case of a canonical sequence optimization with fixed amino acid composition (i.e., under the approximation of the random energy model), we have (14)
 |
3 |
As a consequence, the denatured states have little influence in the design process if the sequence composition is kept fixed. In our previous work (14), we have also shown that optimization of ΔΔG(A − >B, C) is equivalent to optimizing ΔE(A − >B, C).
Exploration of Protein Sequence Space: Sequence Space Annealing (SSA).
Our method for exploring protein sequence space is based on a genetic algorithm, and is similar in essence to the concept of “conformational space annealing” introduced by Scheraga and coworkers (20, 21). For a target protein structure, C, we start with a population of N sequences, all with the same given amino acid composition, stored in a sequence “bank.” For each sequence, Ai, a model structure is built, and its energy is evaluated and stored as E(Ai, C). The initial bank is constructed such that its N sequences are distributed randomly in the sequence space, and proper sampling is enforced by requiring that the initial distance d(Ai, Aj) between any sequences Ai and Aj in the bank is larger than a preset cutoff value, Dcut. Optimization is performed as follows. Starting with sequence Ai, M new sequences Bm are generated, each derived by random exchange of the amino acid types of K randomly chosen positions in Ai. Model structures are built for each Bm, and the corresponding energies are stored in E(Bm, C). Each new sequence Bm is characterized by the sequence Ac in the bank that is closest to Bm. If the distance between Ac and Bm is smaller than Dcut and E(Bm, C) is smaller than E(Ac, C), Ac is replaced by Bm in the bank. If, on the other hand, Bm and Ac are further apart than Dcut, Bm is added to the bank. The sequences in the bank are then ordered with increasing energies, and the N “best” (i.e., with lowest energies) are kept. The procedure is repeated for all Bm. The next sequence of the bank is then chosen as a new seed. A full cycle of is reached when all N sequences of the bank have been used as seeds to generate new sequences. The updated bank serves then as input to the following cycle, and the full procedure is repeated until the system has equilibrated and the variance of the sequence space described by the bank remains steady. Convergence is accomplished by initially setting the number of residues that are shuffled when generating the new sequences, K, to a large value (usually K is set to 20% of the total length of the protein), and then slowly reducing it to 2, the smallest value allowed here. Large values of K allow sampling of entire sequence families that are compatible with the target fold, whereas small values of K limit the search to improving the representative of each family (in which case the procedure becomes equivalent to a parallel Monte Carlo procedure). The design of 100 sequences for a protein of 100 residues requires 40 h on a 533-MHz alpha-powered computer; this computing time varies approximately linearly with protein size.
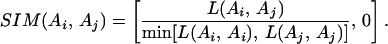
Sequence Weights in Multiple Alignment.
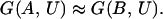
Sequences in a multiple sequence alignment are weighted to reflect their similarities with other sequences in the alignment. We have chosen the method of Godzik and coworkers (22) to derive these weights. First, the alignment score L(Ai, Aj) of two sequences Ai and Aj in the multiple sequence alignment is calculated directly by using the BLOSUM62 substitution matrix. This score is transformed into a similarity score SIM(Ai, Aj), according to
 |
4 |
These similarity scores have values between 0 and 1. The weight ω(Ai) of each sequence Ai is then computed based on its similarity scores to all other sequences in the multiple alignment:
 |
5 |
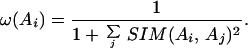
Entropy As a Measure of the Size of Sequence Space.
The sequence information contained in a multiple sequence alignment is first converted into a profile matrix, which consists of an array of vectors, one for each position in the sequence. Each vector contains 21 values representing the frequencies of occurrence of all 20 types of amino acids plus the gap at the position considered. The frequency of occurrence of an amino acid type, a, at position, k, in the multiple sequence alignment is computed as a weighted sum of counts in the aligned sequences divided by the total weight of the alignment. More precisely,
 |
6 |
where N is the total number of sequences in the alignment, type(i, k) defines the type of amino acid observed at position k in sequence Ai, and δ is a step function, which equals 1 if type(i, k) is a, and 0 otherwise.
The diversity of the multiple sequence alignment at position i is derived from the frequencies by using the common information theory definition of entropy
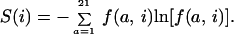 |
7 |
The total entropy S of the multiple sequence alignment is defined as the sum of the entropy score at the individual positions.
Our Protein Test Set.
The SSA procedure is tested on our standard set (23) of 10 proteins: 2ci2, chain I (65 residues), 1ctf (68 residues), 2hsp (71 residues), 4icb (76 residues), 1lmb, chain 3 (92 residues), 5mbn (153 residues), 7pcy (98 residues), 1pgb (56 residues), 5pti (58 residues), 1tim, and chain A (247 residues) plus one larger protein, 1ede (310 residues).
Results
(i) Subsets of Sequence Space Compatible with 1ctf and 1tim.
The SSA procedure was first tested on two proteins with PDB ID codes 1ctf and 1tim. Protein 1ctf is a small, highly stable α+β protein of 68 residues whose fold is nearly unique in the present PDB database. Protein 1tim is a large α/β of 247 residues whose α/β-barrel fold is observed in many proteins in the PDB, covering several families with different functions. For each protein, we optimize a set of 100 sequences describing its compatible sequence space. A two-dimensional projection of this space at the beginning and at the end of the optimization is shown in Fig. 1. All optimized sequences were found to be specific to their target backbone in computer threading experiments using THREADER2 (24) with a database of 1,900 representative backbones. The 100 sequences optimized for 1ctf were, on average, 36% identical to the native sequence of 1ctf; the corresponding number drops to 14% in the case of 1tim. Most interestingly, the mean sequence identity among all pairs of sequences designed for 1ctf is 52%, whereas the mean sequence identity for sequences designed for 1tim is much lower at 20%.
Figure 1.

The design of 100 sequences compatible with the topology of 1ctf (A and C) and 1tim (B and D). A two-dimensional projection of the sequence space spanned by these sequences at the beginning of the optimization is shown in A and B, whereas C and D illustrate the size of this sequence space at then end of the optimization, after 80 cycles of SSA. (A–D) The position of the native sequence is set to the origin (0,0) and shown as a gray square. This two-dimensional representation of sequence space is created by using a nonlinear mapping procedure (23).
The 1ctf sequences were included in a multiple sequence alignment, which in turn is described by a profile, i.e., a position-specific mutation matrix. The profile is generated by using the fold and function assignment system (FFAS) algorithm introduced by Godzik and coworkers (22). The information content of this profile is quantified by using an entropy measure (25). When all 20 types of amino acids are allowed, the average entropy per residue is 3.0 [i.e., log(20)]. When the fixed amino acid composition is taken into account, the upper limit for the entropy per residue is smaller (2.2 for 1ctf and 2.8 for 1tim). We find that the average entropy per residue for the designed sequences for 1ctf is 0.94, corresponding to an average of 2.6 types of amino acids allowed at each position of 1ctf. The same analysis performed on the 100 sequences designed for 1tim yields an average entropy per residue for 1tim of 1.94, corresponding to an average of 7 types of amino acids allowed at each position in 1tim, on average. Fig. 2, which maps sequence variability onto the structure, illustrates this difference between 1ctf and 1tim. The low entropy per residue of designed sequences indicates a significant decrease in the size of the sequence space compatible with a structure when structural and stability constraints are taken into account, in agreement with recent studies on measuring sequence space (26, 27). Most importantly, however, we find that the size of this sequence space reflects the usage of the fold observed in naturally occurring proteins.
Figure 2.

The design entropy of 1ctf and 1tim. The PDB structures of 1ctf and 1tim are drawn by using MOLSCRIPT (38), and the residues are colored according to their entropy values. The scale of color was chosen such that blue represents residues with small entropy values (with dark blue corresponding to an entropy value of 0), whereas red represents residues with high entropy values (with a maximum of 2.65). 1ctf appears much “colder” than 1tim, with a mean entropy value of 0.94, compared with 1.94 for 1tim.
(ii) Two Proteins of Similar Lengths Can Accommodate Subsets of Sequence Space of Different Sizes.
The size of the sequence space trivially depends on the size of the protein considered (20N sequences of length N). To assess the role of other factors in defining the size of this sequence space, the procedure described above was repeated on two proteins of similar size, 1ctf (68 residues) and 2hsp (71 residues). As already mentioned, the protein 1ctf is a small, highly stable α+β protein whose fold is nearly unique. On the other hand, 2hsp is a small β protein whose fold (the SH3 fold) is observed in many proteins in the PDB. For each protein, two measures of the size of its sequence space are derived.
First, the sequences of all proteins whose structures are homologous to the protein of interest are extracted from the fold classification based on structure–structure alignment of proteins (FSSP) database (28). We use a cutoff of Z = 4 for defining structural homology, where Z is the Z score defined by FSSP. The structural alignments of these homologous proteins are used to derive a structure-based multiple alignment, whose diversity is measured by its sequence entropy, Sstr. The structural alignments for 1ctf and 2hsp contain 4 and 24 proteins, respectively. We find that the average entropy per residue for these alignments for 1ctf and 2hsp is 0.99 and 1.57, respectively.
Second, we optimize for each protein a set of 100 sequences describing its compatible sequence space. These sequences are stored in a multiple sequence alignment, which is transformed into a profile. The diversity of this profile is described by using both the entropy per residue and the total entropy Sdes. We find that the average entropy per residue for the sequence-based alignments for 1ctf and 2hsp are 0.94 and 1.70.
In Fig. 3, we plot the sequence entropy per residue as a function of the position in the protein sequence for 1ctf and 2hsp. First, we note that the sequence spaces compatible with two proteins of similar size can have significantly different sizes. Second, the calculated design entropy correlates well on average with the observed structural entropy. The latter describes the diversity in sequence space observed among known proteins sharing the similar fold. The former is the result of a calculation that depends on the geometry of the protein backbone, on the amino acid composition of the native sequence of the protein, and on the stability (i.e., free energy, see section i) of the fold.
Figure 3.

The entropy in sequence space of each residue of 1ctf and 2hsp is plotted against the position of the residue in the sequence of the protein. The continuous line shows the design entropy Sdes, whereas the dashed line shows the average entropy per residue derived from the sequences of proteins whose structure in the PDB were found similar to the structure of 1ctf or 2hsp, according to the FSSP database (28).
Four residues in 1ctf (positions 25, 31, 51, and 62) and one residue in 2hsp (position 44) have low design entropy: they correspond either to glycines or alanines in the native sequence at structurally constrained regions [i.e., positive (ϕ, φ) torsion angles]. These low values are in fact artifacts of our calculations in which we maintain a rigid geometry for the backbone of the protein. The same residues have higher structural entropy values.
Fig. 3 illustrates the importance of topology and stability for defining the size of the sequence space compatible with a protein structure. The amino acid composition is also considered, and this will be discussed below.
(iii) Geometry and Stability Define the Subset of the Sequence Space Compatible with a Protein Structure.
To investigate further the relationship between the sequence space compatible with a given protein fold derived from design experiments and the diversity of naturally occurring sequences found to adopt this fold, the procedure described above was repeated on nine additional proteins listed in Methods. These proteins vary in size from 56 to 310 residues, and cover all four classes of protein folds. For each protein, three different measures of its sequence space are derived. First, 100 sequences were designed by using the SSA procedure and stored in a multiple sequence alignment. This sequence alignment was transformed into a profile, whose diversity (Sdes) is described by using the entropy measure described in Methods. Second, the native sequence of the protein is compared with the nonredundant database of protein sequences built by combining the SwissProt, trEMBL, and new-trEMBL databases (29, 30) [release date April 2001 (640,428 sequences)]. Comparison is performed by using five iterations of PSI-blast (31) with an E-value cutoff of 0.00001. The resulting set of sequences is converted into a profile, which in turn is characterized by its sequence entropy, Sseq. Third, the sequences of all proteins whose structures are homologous to the protein of interest are derived from the FSSP database (28). We use a cutoff of Z = 4 for defining structural homology, where Z is the Z score defined by FSSP. The structural alignments of these homologous proteins are used to derive a structure-based multiple alignment, whose diversity is measured by its sequence entropy, Sstr.
The three measures of the size of sequence space, Sdes, Sseq, and Sstr, are compared in Fig. 4. For most proteins, the entropy derived from sequence (Sseq) compares well with the entropy derived from structural information (Sstr). It is noteworthy that Sseq and Sstr are two independent measures of the size of the same sequence space, derived from two independent databases. The good correlation observed indicates that if a bias exists in the content of these databases, it is probably small. Proteins 1tim and 1ede are two major exceptions. In the case of 1tim, PSI-blast identifies only triose phosphate isomerases as similar to the native sequence of 1tim, whereas a large collection of proteins with the tim α/β-barrel fold are included in the FSSP multiple sequence alignment. Similarly, PSI-blast finds dehalogenases based on the sequence of 1ede, whereas the FSSP multiple sequence alignment includes the larger family of hydrolases, all sharing the same fold, but with little sequence similarities. Clearly, Sseq cannot capture the true diversity of the family in these two cases. We do find a striking correlation, both qualitative and quantitative, between the entropy derived from our designed sequences (Sdes) and the entropy derived from naturally occurring sequences known to share the same fold (Sstr; see Fig. 4). This correlation is observed over a wide range of entropy and protein sizes.
Figure 4.

The sequence entropy [Sseq (*)] and the design entropy [Sdes (○)] are plotted against the entropy derived from structural information (Sstr) for a data set of 11 proteins. The line represents the first diagonal, i.e., the line where the different entropy measures would be identical. The correlation coefficient between Sseq and Sstr is 0.92, whereas the correlation coefficient between Sdes and Sstr is 0.99.
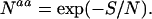
The definitions of the entropy measures Sseq, Sdes, and Sstr make them extensive variables that implicitly depend on the protein length. The trivial effect of the latter can be removed by considering the average entropy per residue, S/N, where N is the length, which can be converted to the average number Naa of amino acid types compatible with each position in the protein, according to
 |
8 |
The three measures, N , N
, N , and N
 , are compared in Fig. 5. We confirm that the sequence diversity per residue measured from our design sequence shows the best qualitative and quantitative agreement with the sequence diversity derived from structural information. This sequence diversity is derived from the knowledge of the three-dimensional conformation of the backbone of the protein (its topology or fold) and the stability of the designed sequences for that fold (defined by minimizing the free energy of the model proteins generated in the SSA procedure; see Methods).
Figure 5.

The mean numbers of amino acid types compatible with any position in the structure of the protein of interest derived from random sequences with fixed amino acid composition [N (*)], from sequences designed to stabilize the fold of the protein [N
 (○)], and from sequences identified as similar to the native sequence of the protein by PSI-blast [N
 (+)] are compared with N
 , derived from sequences of proteins identified as structurally similar to the protein of interest by FSSP. The line represents the first diagonal, i.e., the line where the different measures would be identical.
Our sequence design strategy also relies on keeping the amino acid composition fixed. Fig. 5 shows that this constraint effectively reduces the size of the sequence space sampled in the design procedure, but that this space remains large compared with the sequence space found at the end of the optimization procedure. Proteins within a folding class (such as α, β, α+β, and α/β) have very similar amino acid compositions. The latter can in fact be used to predict the folding class of a protein with remarkable accuracy (see ref. 32 for review). Because the structure of the backbone of the protein is an input to our sequence design procedure, the folding class is known, and maintaining the amino acid composition constant to its value defined by the native sequence of the protein seems appropriate.
Both Figs. 4 and 5 suggest that, independent of functional fitness, it is the topology of a protein, its length, and its stability that define the size of the sequence space that is compatible with its structure.
Conclusions
It is well known that certain protein structures (folds) are more common than others (1, 33). To explain this phenomenon, several models consider the concept of protein structure designability; that is, the number of sequences possessing the structure of interest as their nondegenerate energy ground state. Highly designable structures are more likely to have been found through the process of evolution, because they are more robust to random mutations. Based on lattice models with a reduced amino acid alphabet (usually a two-letter code), it was found that highly designable structures are thermodynamically more stable that other structures and contain “protein-like” secondary structures and tertiary structures (34–36). It was noticed recently, however, that these results depend on the details of the model; for example, lattice structures that were highly designable for the two-letter amino acid alphabet are not especially designable with a higher-letter alphabet (37). The study described in this article is concerned with detailed all-atom representations of proteins; it measures stability based on a physical potential and includes all 20 types of amino acids. We design sequences for proteins based on both their topology (i.e., the three-dimensional geometry of the backbone) and their stability. The diversity of the sequences designed for a given protein structure is found to correlate well with the diversity of the sequences of naturally occurring proteins that adopt this structure. Our results also suggest that the designability of a protein can be derived from the knowledge of its topology alone. As a consequence, we anticipate that our method for sequence space exploration will prove useful for identifying highly designable folds, which will represent attractive targets for protein design.
Acknowledgments
This work was supported by grants (to M.L.) from the Department of Energy (DE-FG03-95ER62135).
Abbreviations
- PDB
Protein Data Bank
- SSA
sequence space annealing
- FSSP
fold classification based on structure–structure alignment of proteins
Footnotes
This paper was submitted directly (Track II) to the PNAS office.
References
- 1.Murzin A G, Brenner S E, Hubbard T, Chothia C. J Mol Biol. 1995;247:536–540. doi: 10.1006/jmbi.1995.0159. [DOI] [PubMed] [Google Scholar]
- 2.Brenner S E, Chothia C, Hubbard T J P. Curr Opin Struct Biol. 1997;7:369–376. doi: 10.1016/s0959-440x(97)80054-1. [DOI] [PubMed] [Google Scholar]
- 3.Heinz D, Baase W, Matthews B. Proc Natl Acad Sci USA. 1992;89:3751–3755. doi: 10.1073/pnas.89.9.3751. [DOI] [PMC free article] [PubMed] [Google Scholar]
- 4.Cordes M, Walsh N, McKnight C, Sauer R. Science. 1999;284:325–327. doi: 10.1126/science.284.5412.325. [DOI] [PubMed] [Google Scholar]
- 5.Bogarad L, Deem M. Proc Natl Acad Sci USA. 1999;96:2591–2595. doi: 10.1073/pnas.96.6.2591. [DOI] [PMC free article] [PubMed] [Google Scholar]
- 6.Drexler K E. Proc Natl Acad Sci USA. 1981;78:5275–5278. doi: 10.1073/pnas.78.9.5275. [DOI] [PMC free article] [PubMed] [Google Scholar]
- 7.Pabo C. Nature (London) 1983;301:200. doi: 10.1038/301200a0. [DOI] [PubMed] [Google Scholar]
- 8.Arnold F H. Acc Chem Res. 1998;31:125–131. [Google Scholar]
- 9.Arnold F H. Nat Biotechnol. 1998;16:617–618. doi: 10.1038/nbt0798-617. [DOI] [PubMed] [Google Scholar]
- 10.Arnold F H. Proc Natl Acad Sci USA. 1998;95:2035–2036. doi: 10.1073/pnas.95.5.2035. [DOI] [PMC free article] [PubMed] [Google Scholar]
- 11.Desjarlais J, Handel T. Protein Sci. 1995;4:2006–2018. doi: 10.1002/pro.5560041006. [DOI] [PMC free article] [PubMed] [Google Scholar]
- 12.Dahiyat B I, Mayo S L. Science. 1997;278:82–87. doi: 10.1126/science.278.5335.82. [DOI] [PubMed] [Google Scholar]
- 13.Hellinga H W. Nat Struct Biol. 1998;5:525–527. doi: 10.1038/776. [DOI] [PubMed] [Google Scholar]
- 14.Koehl P, Levitt M. J Mol Biol. 1999;293:1161–1181. doi: 10.1006/jmbi.1999.3211. [DOI] [PubMed] [Google Scholar]
- 15.Koehl P, Delarue M. Proteins Struct Funct Genet. 1994;20:264–278. doi: 10.1002/prot.340200307. [DOI] [PubMed] [Google Scholar]
- 16.Koehl P, Delarue M. J Mol Biol. 1994;239:249–275. doi: 10.1006/jmbi.1994.1366. [DOI] [PubMed] [Google Scholar]
- 17.Shakhnovich E I, Gutin A M. Protein Eng. 1993;6:793–800. doi: 10.1093/protein/6.8.793. [DOI] [PubMed] [Google Scholar]
- 18.Shakhnovich E I, Gutin A M. Proc Natl Acad Sci USA. 1993;90:7195–7199. doi: 10.1073/pnas.90.15.7195. [DOI] [PMC free article] [PubMed] [Google Scholar]
- 19.Pande V S, Grosberg A Y, Tanaka T. Biophys J. 1997;73:3192–3210. doi: 10.1016/S0006-3495(97)78345-0. [DOI] [PMC free article] [PubMed] [Google Scholar]
- 20.Lee J, Scheraga H, Rackovsky S. J Comp Chem. 1997;18:1222–1232. [Google Scholar]
- 21.Lee J, Liwo A, Scheraga H. Proc Natl Acad Sci USA. 1999;96:2025–2030. doi: 10.1073/pnas.96.5.2025. [DOI] [PMC free article] [PubMed] [Google Scholar]
- 22.Rychlewski L, Jaroszewski L, Li W, Godzik A. Protein Sci. 2000;9:232–241. doi: 10.1110/ps.9.2.232. [DOI] [PMC free article] [PubMed] [Google Scholar]
- 23.Koehl P, Levitt M. J Mol Biol. 1999;293:1183–1193. doi: 10.1006/jmbi.1999.3212. [DOI] [PubMed] [Google Scholar]
- 24.Jones D T, Taylor W R, Thornton J M. Nature (London) 1992;358:86–89. doi: 10.1038/358086a0. [DOI] [PubMed] [Google Scholar]
- 25.Shakhnovich E, Abkevich V, Ptitsyn O. Nature (London) 1996;379:96–98. doi: 10.1038/379096a0. [DOI] [PubMed] [Google Scholar]
- 26.Kuhlman B, Baker D. Proc Natl Acad Sci USA. 2000;97:10383–10388. doi: 10.1073/pnas.97.19.10383. [DOI] [PMC free article] [PubMed] [Google Scholar]
- 27.Wernisch L, Hery S, Wodak S. J Mol Biol. 2000;301:713–736. doi: 10.1006/jmbi.2000.3984. [DOI] [PubMed] [Google Scholar]
- 28.Holm L, Sander C. Nucleic Acids Res. 1994;22:3600–3609. [PMC free article] [PubMed] [Google Scholar]
- 29.Bairoch A, Böckman B. Nucleic Acids Res. 1991;19:2247–2249. doi: 10.1093/nar/19.suppl.2247. [DOI] [PMC free article] [PubMed] [Google Scholar]
- 30.Bairoch A, Apweiler R. Nucleic Acids Res. 2000;28:45–48. doi: 10.1093/nar/28.1.45. [DOI] [PMC free article] [PubMed] [Google Scholar]
- 31.Altschul S F, Madden T L, Schaffer A A, Zhang J H, Zhang Z, Miller W, Lipman D J. Nucleic Acids Res. 1997;25:3389–3402. doi: 10.1093/nar/25.17.3389. [DOI] [PMC free article] [PubMed] [Google Scholar]
- 32.Chou K, Zhang C. Crit Rev Biochem Mol Biol. 1995;30:275–349. doi: 10.3109/10409239509083488. [DOI] [PubMed] [Google Scholar]
- 33.Orengo C A, Jones D T, Thornton J M. Nature (London) 1994;372:631–634. doi: 10.1038/372631a0. [DOI] [PubMed] [Google Scholar]
- 34.Li H, Helling R, Tang C, Wingreen N. Science. 1996;273:666–669. doi: 10.1126/science.273.5275.666. [DOI] [PubMed] [Google Scholar]
- 35.Melin R, Li H, Wingreen N, Tang C. J Chem Phys. 1999;110:1252–1262. [Google Scholar]
- 36.Tatsumi R, Chikenji G. Phys Rev E Stat Phys Plasmas Fluids Relat Interdiscip Top. 1999;60:4696–4730. doi: 10.1103/physreve.60.4696. [DOI] [PubMed] [Google Scholar]
- 37.Buchler N, Goldstein R. Proteins Struct Funct Genet. 1999;34:113–124. [PubMed] [Google Scholar]
- 38.Kraulis P J. J Appl Crystallogr. 1991;24:946–950. [Google Scholar]