Abstract
Based on the complete ensemble of hairpin conformations, a statistical mechanical model that combines the eigenvalue solutions of the rate matrix and the free-energy landscapes has been able to predict the temperature-dependent folding rate, kinetic intermediates, and folding pathways for hairpin-forming RNA sequences. At temperatures higher than a “glass transition” temperature, Tg, the eigenvalues show a distinct time separation, and the rate-limiting step is a two-state single exponential process determined by the slowest eigenmode. At temperatures lower than Tg, no distinct time separation exists for the eigenvalues, hence multiple (slow) eigenmodes contribute to the rate-determining processes, and the folding involves the trapping and detrapping of kinetic intermediates. For a 21-nt sequence we studied, Tg is lower than the transition temperature, Tm, for thermodynamic equilibrium folding. For T > Tm, starting from the native state, the chain undergoes a biphasic unfolding transition: a preequilibrated quasi-equilibrium macrostate is formed followed by a rate-limiting two-state transition from the macrostate to the unfolded state. For Tg < T < Tm, the chain undergoes a two-state on-pathway folding transition, at which a nucleus is formed by the base stacks close to the loop region before a rapid assembly of the whole hairpin structure. For T < Tg, the multistate kinetics involve kinetic trapping, causing the roll-over behavior in the rate-temperature Arrhenius plot. The complex kinetic behaviors of RNA hairpins may be a paradigm for the folding kinetics of large RNAs.
Elucidation of the RNA-folding mechanism at the level of both the secondary and tertiary structures are essential to the understanding of RNA functions in transcription, splicing, and translation. Over the recent few years, the folding kinetics of Tetrahymena ribozyme and other large RNAs have been under extensive investigation (1–7). These experiments have started to shed light on the general features of RNA folding kinetics, including the free-energy landscapes, folding cooperativity, pathways, kinetic intermediates, and the rate-limiting steps of the folding. On the other hand, the folding kinetics of the elementary steps of RNA, namely the formation of hairpin structures, has not been very much investigated yet. Since the early work of Pörschke (8) and Crothers and coworkers (9, 10), few studies have been devoted to the detailed folding kinetics of RNA hairpins and other secondary structures.
Recently, the studies of the folding kinetics for RNA hairpins (11), peptide β-hairpin (12–18), and DNA hairpins (19–25) have become highly active. However, despite the active efforts on the modeling of RNA folding (26–39), quantitative analysis based on the first principle calculations has not been explored very much for RNA hairpin-folding kinetics. Here we present a detailed folding-kinetics analysis based on a statistical mechanical model. Our model can provide a complete picture of the temperature-dependent folding kinetics: the folding rate, cooperativity, pathways, and kinetic intermediates. Our results reveal a rugged RNA folding energy landscape even for RNA structures as simple as hairpins. The model is a combination of the master equation (40) description for the rate process and the free-energy landscapes. Although several authors have used the Monte Carlo and other simulational approaches to modeling the RNA folding process (35–38), what distinguishes the present approach from the other approaches (e.g., Monte Carlo simulations) is that the conformational sampling in our model is complete and exact, and the model can give analytical results that allow for stable predictions for the long time dynamics and detailed analysis for the folding mechanisms. In addition, the solution of the master equation can give the population kinetics that is measured directly in the folding experiments.
Theory and Methods
Master Equation.
Consider an ensemble of ω chain conformations, the rate of change for the population of the ith (i = 1, … ,ω) conformation (equivalently the probability Pi of finding the ith conformation) is determined by the difference between the rate of entering and leaving the state: dPi/dt = Σj≠i[kijPj − kjiPi], where kij and kji are the rates for transitions from state j to state i and from state i to state j, respectively. By using vector p = col (P1, … , Pω), we can write the rate equation in a matrix form (the master equation): dp/dt = M⋅p, where M is a ω × ω rate matrix defined by Mij = kij for the off-diagonal elements i ≠ j and Mii = −Σj≠ikji for the diagonal elements.
To obtain the full population kinetics p(t) from the master equation, we diagonalize the rate matrix M and solve for the eigenvalues λμ (μ = 1, 2, … , ω) and eigenvectors nμ, from which the time development of the population of each and every conformational state can be calculated as the following vector form:
 |
1 |
where the coefficients cμ values are determined by the initial probability distribution p(0) at t = 0. Eq. 1 represents a decomposition of the equilibration process into ω independent kinetic modes (eigenmodes), where each mode is represented by the eigenvector nμ, and the rate of the kinetic mode is given by the corresponding eigenvalue |λμ|. We label the eigenvalues according to the order λ1 ≥ λ2 ≥ … ≥ λω.
The eigenvalue spectrum contains (i) an equilibrium mode λμ = 0 for μ = 1 and (ii) ω − 1 nonequilibrium kinetic relaxation modes λμ < 0 for μ > 1. The equilibrium mode guarantees the occurrence of equilibration for any given initial condition. The overall rate process is determined by the slow modes of small nonzero |λμ| values, especially if there exists a large gap between the slowest nonequilibrium eigenvalue λ2 and the rest of the nonzero eigenvalues, i.e., if |λ2|<<|λ3|, then the overall kinetics would be determined by a single exponential process represented by the kinetic mode n2 with rate |λ2|. Otherwise, the relaxation kinetics would be multiexponential and involves multiple slow eigenmodes.
Transition Rates.
We describe chain conformations in terms of base pairs. All the conformations that contain the same set of base pairs are classified as a “pair-based” conformational state. We allow one and only one base pair to be formed or broken in a kinetic transition, with the transition rate given by k± = k e−ΔG±/kBT (“+” for the formation and “−” for the breaking of the base pair). In the above equation, prefactor k
 is a rate constant, kB is the Boltzmann constant, T is the temperature, and ΔG± is the free-energy barrier for the transition. In our model, we use k
 ≃ k
≃ k ≃ 1011sec−1 as derived from the kinetic experimental data for short RNA hairpin (8). We assume that the barrier for the formation of a base pair is caused by the restriction of the chain entropy ΔS (because of the restriction of torsional angles, etc.) and is given by ΔG+ = TΔS, and the barrier for the disruption of a base pair is caused by the energetic (enthalpic) cost ΔH to break the hydrogen bonding and the base stacking interactions and is given by ΔG− = ΔH. Both ΔG+ and ΔG− are sequence-dependent. In our model, ΔH, ΔS, and ΔG± are calculated by using a statistical mechanical model for RNA folding (32, 41–43).
The choice of the transition states in the calculations of the rate constants k± is a simplified assumption. This assumption is supported by the previous experimental and theoretical studies (12, 13). The transition rates k± satisfy the detailed balance principle and involve no free adjustable parameter. Different choices of transition states may give different details in the kinetics; however, the general feature about the kinetics intermediates, single exponential and multistate kinetics, etc., may remain unchanged.
A Reduced Conformational Model.
The number of conformational states grows exponentially with the chain length. For example, the number of hairpin conformations increases from 138 for a 10-nt chain to 24,666 for a 16-nt chain. The rapid increase of the conformational ensemble greatly limits the applicability of the master equation approach because of the large size of the rate matrix M. We note that RNA hairpins are stabilized predominantly by the base-stacking interactions. An isolated (unstacked) base pair is unstable, because an interbase hydrogen bond is rather weak because of the competition for the hydrogen bonds with water molecules in the aqueous solution. The instability of the unstacked base pairs suggests a classification of conformations according to the stacking base pairs, i.e., all the conformations having the same base stacks form a “stack-based” conformational state. A great advantage of the use of the stack-based conformational states is the significant reduction in the number of states in the rate matrix M. For example, for a 16-nt chain the number of states is reduced from 24,666 pair-based conformations to 531 stack-based conformations.
Test of the Model.
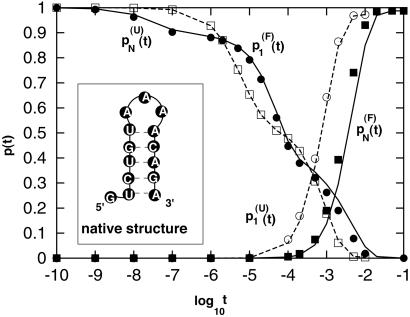
To test the model of the stack-based conformational states, we have calculated the detailed kinetics for a 14-nt RNA sequence by using both the pair-based and stack-based conformational models. As shown in Fig. 1, the results for the two models show excellent agreement. Therefore, the stack-based conformational model can give a rigorous and accurate description of the kinetics at the same level of the pair-based model. Our kinetic calculation will be based on the stack-based conformational model.
Figure 1.
The population kinetics for a 14-nt RNA sequence calculated from the pair-based (symbols) and the stack-based (lines) conformational models. There are 3,296 pair-based conformational states and 54 stack-based conformational states for the hairpin chain. PN(t) and P1(t) are the fractional population of the native state and the completely unfolded state, respectively. The figure contains two sets of test results: P (t) and P
 (t) for the folding kinetics at T = 10°C, starting from the completely unfolded state, and P
 (t) and P
 (t) for the unfolding kinetics at T = 90°C, starting from the native state. We see excellent agreement between the two models.
Results and Discussion
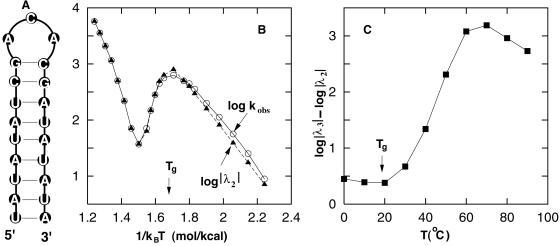
We consider a 21-nt RNA sequence: UAUAUAUCGACACGAUAUAUA. The 21-nt chain has ω = 1,603 stack-based hairpin conformations and a unique hairpin native state (1585) with a triloop and 9 base pairs in the helical stem, as shown in Fig. 2A.
Figure 2.
(A) The native structure of the 21-nt RNA sequence. (B) The apparent relaxation rate kobs (circles) and the slowest eigenvalue λ2 (triangles) as a function of 1/kBT. (C) The separation between eigenvalues λ2 and λ3 of the two slowest eigenmodes as a function of the temperature.
Folding Thermodynamics.
By using a statistical mechanical model for RNA thermodynamics (32, 41, 42), we have evaluated the specific heat of the 21-nt RNA as a function of temperature. The specific heat curve (data not shown) has a single peak at the melting temperature Tm = 62°C. Further calculations for the pairing probability (data not shown) show that as temperature T is decreased, the native base pairs close to the loop region are stabilized first, followed by a progressive formation of the helical stem. The full hairpin structure is stabilized at T = Tm, and further decrease of the temperature enhances the stability of the native state. The equilibrium folding pathway indicates that the base-pairing stability decreases as base pairs move away from the loop region.
Folding Kinetics: General Features.
We have examined the temperature-dependent behavior of the folding and unfolding kinetics. For each temperature, we evaluated the 1,603 × 1,603 rate matrix M and solved for the eigenmodes − the eigenvalues λμ and eigenvectors nμ (μ = 1, 2, … , 1,603). We then use Eq. 1 to calculate the population kinetics p(t) as a linear superposition of the eigenmodes. The relaxation kinetics p(t) depends on the starting distribution p(0). To simulate the refolding under folding conditions at temperature T below Tm, we follow the relaxation kinetics starting from the completely unfolded conformation (state 1), which contains no base stacks. In the kinetic experiments, this corresponds to a temperature jump from a very high temperature to temperature T. Similarly, to simulate the unfolding under unfolding condition at temperature T higher than Tm, we follow the unfolding relaxation starting from the native conformation (state 1585). In experiments, this corresponds to a temperature jump from a low temperature to temperature T.
To make connections to the experimentally measurable parameters, we extracted the apparent relaxation rate kobs by fitting the time development of the native population P1585(t) using an exponential function e−kobst. We then connected the apparent rate with the eigenvalues of the rate matrix. As we discussed above, if there exists a pronounced time separation in the eigenmodes, then the rate process is determined by the slowest mode μ = 2, and a single exponential kinetics would be observed with rate constant kobs ≃ λ2. Otherwise, the rate process would be determined by multiple slow kinetic modes, and kobs ≠ λ2. The comparison of kobs and λ2 is indicative of the kinetic cooperativity.
In Fig. 2 B and C we plot the temperature dependence of the apparent rate constant kobs, the slowest eigenvalue λ2, and the separation between the first two slowest eigenvalues λ2 and λ3. The figure shows distinctive features of the kinetics for temperatures higher or lower than a characteristic temperature Tg ≃ 20°C.
At temperature T higher than Tg, the apparent rate kobs agrees with the slowest eigenvalue |λ2|, and the rate-temperature dependence shows a typical Chevron plot (44, 45) for the two-state transitions, with a minimum rate near the melting temperature Tm = 62 . The agreement between kobs and |λ2| suggests a time separation in the eigenmodes. Indeed, as shown in Fig. 2C, there exists a large separation between λ2 and λ3 for T > Tg, and thus the folding (unfolding) transition is a single exponential cooperative process.
At temperature T below Tg, the apparent rate constant kobs deviates from |λ2|, and the temperature dependence of the rate constants shows a roll-over behavior in the Arrhenius plot (44, 45). This behavior implies that the folding cannot be described as a single exponential process, and there are multiple kinetic modes involved in the folding process. Indeed, Fig. 2C shows that for T below Tg, the gap between λ2 and λ3 is small, and there exist multiple slow kinetic modes; thus the folding is a multiexponential noncooperative process. Here Tg is defined as the temperature at which the Arrhenius plot starts to show the roll-over (slope of the Arrhenius plot = 0) at low T. Tg also can be defined as the temperature below which the large time separation in the eigenvalue spectrum disappears.
To obtain a better understanding of the temperature dependence of the kinetics, we have performed detailed investigation for the kinetics at three representative temperatures: T = 40, 90, and 10°C, corresponding to single exponential folding for Tg < T < Tm, single exponential unfolding for T > Tm, and multiexponential folding for T < Tg, respectively.
Temperature T = 40°C.
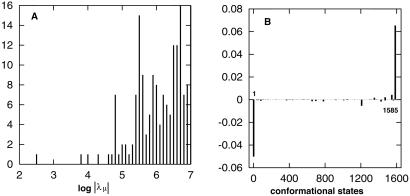
In Fig. 3 we show the eigenvalue spectrum λμ (A) and the eigenvector n2 (B) of the slowest nonzero eigenvalue λ2. The figure clearly shows a large gap between λ2 and the rest of the eigenvalue spectrum. As a result, the rate-limiting step of the kinetics would be determined by the single slowest eigenmode n2, and the native structure would be formed at a time scale tfold ≈|λ2|−1 = 10−2.5 sec. The estimated tfold is consistent with the population kinetic shown in Fig. 4A. Fig. 3B for the eigenvector n2 shows a two-state kinetic mode; the completely unfolded conformation (state 1) is depleted and converted to the native conformation (state 1585) without stable intermediate states involved in the process.
Figure 3.
(A) A histogram for the distribution of the eigenvalue spectrum at T = 40°C. The equilibrium eigenmode λ1 = 0 is not shown in the figure. (B) The eigenvector n2 for the slowest eigenvalue λ2. The x axis represents the index i for all 1,603 conformations, and the y axis represents the corresponding ith component of n2.
Figure 4.
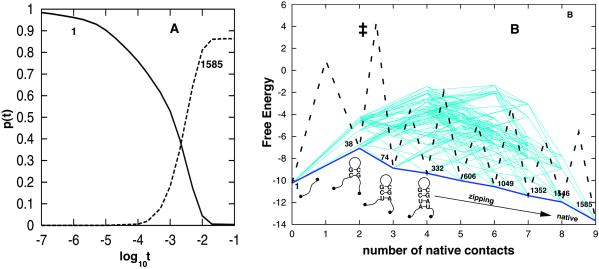
(A) The population kinetics for the folding relaxation starting from the unfolded state 1 at 40°C. Results for states other than states 1 and 1585 (native) are not shown, because their populations never exceed 10% in the relaxation. (B) The free-energy landscape and folding pathways. The figure plots all the lowest barrier (equal to 59.27 kcal/mol) pathways from the unfolded state 1 to the native state 1585. There are a total of 2,224 such low-barrier pathways. Only native base pairs are formed on these pathways. The x axis is for the number of native base pairs formed, and the y axis is the free energy in kcal/mol. The kinetic barrier between individual states are not shown except for the major pathway denoted by the thick dashed and solid lines.
The native state occupies 86.35% fractional population in thermal equilibrium at T = 40°C. For an initial distribution with 100% population of (the completely unfolded) state 1, Eq. 1 gives the population kinetics for each and every state. The population curves in Fig. 4A show no pronounced stable intermediates during the folding process.
To explore the folding pathways, we have enumerated the low-barrier folding routes 1→1585 exhaustively. We found that all the lowest barrier routes are on-pathway, i.e., no nonnative base pairs are formed. Fig. 4B is a plot for the “free-energy landscape” as a function of the number of native base pairs for all these pathways. For the lowest barrier pathways, from the distribution of barriers, we found that a major folding pathway would be the nucleation-zipping process (see the thick lines in Fig. 4B). Along this major pathway, the folding would be initiated by the closure of the native triloop through the nucleation of the consecutive native base stacks CG-GC and UC-GA closest to the loop, followed by a rapid formation of the base pairs in the stem. Other low-barrier pathways involve the closure of nonnative larger loops and are slower than the major pathway.
From the (one-dimensional) kinetic barrier profile for the major pathway in Fig. 4B, we found that the rate-limiting step is the formation of the nucleation base stack UC-GA, which causes the maximum decrease in entropy (ΔS = 35.5 entropy units) and thus the maximum free-energy barrier TΔS. In the rate-determining state (‡), bases U and A are in close proximity to form a pair (see state 74) that could either separate or react to be stabilized by the stacking interaction. From the free-energy landscape, we can estimate the activation enthalpy as ΔHa = ΔH‡ = ΔHstate38 = ΔHCG-CG = −8.0 kcal/mol. The activation enthalpy is negative, because the rate-determining state (‡) is less stable, and thus the barrier-crossing rate is decreased when the temperature is increased. We note that ΔHa also can be estimated from the slope at T = 40°C of the Arrhenius plot in Fig. 2B: ΔHa = −d(lnkobs)/d(1/T) ≃ −9.4 kcal/mol, which is close to that derived from the pathway analysis.
Temperature T = 90°C.
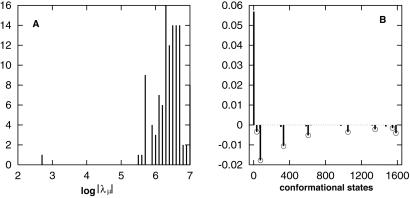
Fig. 5A is a histogram for the distribution of the eigenvalue spectrum λμ at T = 90°C. There exists a large gap between the slowest nonzero eigenvalue (λ2) and the rest of the eigenvalue spectrum. Therefore, the rate-limiting step of the kinetics would be determined by the μ = 2 eigenmode n2.
Figure 5.
(A) The eigenvalue spectrum at T = 90°C. (B) The eigenvector n2 for the slowest eigenvalue λ2. Also shown in the figure is the Boltzmann distribution (circles) for states 34, 74, 332, 606, 1049, 1352, and 1585. We see an excellent agreement between the equilibrium distribution and the corresponding eigenvector components for these states.
Fig. 5B is a plot for the eigenvector n2. n2 is composed of negative components for states 34, 74, 332, 606, 1049, 1352, 1546, and 1585 and a large positive component for the completely unfolded state 1. Therefore, n2 represents an unfolding kinetic mode that multiple states are transformed into the completely unfolded state. But how does the multistate kinetic mode reconcile with the single exponential cooperative unfolding kinetics? In Fig. 5B, we compared the eigenvector components of states 34, 74, 332, 606, 1049, 1352, 1546, and 1585 and the Boltzmann equilibrium distribution of these states; we found excellent agreement. Therefore, in the unfolding process these states preequilibrate to form a quasi-equilibrium macrostate, and the rate-determining step n2 is a cooperative transition from the preformed macrostate to the completely unfolded state. During the transition, although the population of the macrostate is decreased, the relative distribution of the conformations in the macrostate remains unchanged. The unfolding of the chain occurs on a time scale ≈|λ2|−1 = 10−2.75 sec, and the formation of the quasi-equilibrium macrostate is a result of the fast eigenmodes for μ > 2 with a time scale ≈|λ3|−1 = 10−5.58 sec. The estimated time scales are consistent with the population kinetics shown in Fig. 6A.
Figure 6.
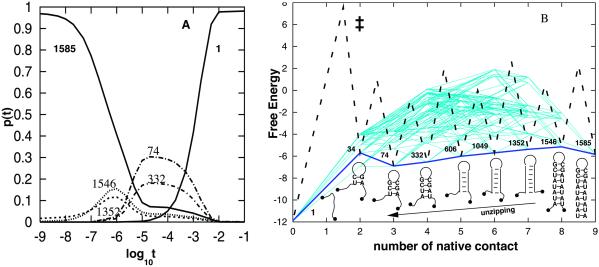
(A) Population kinetics for the unfolding relaxation starting from the native state 1585 at 90°C. Four on-pathway kinetic intermediates (1546, 1352, 332, and 74; see B for their structures) are formed in the unfolding process. The fractional populations of other states never exceed 10% during the relaxation and thus are not shown. (B) The free-energy landscape and unfolding pathways. The figure shows all the 2,224 lowest barrier (equal to 62.6 kcal/mol) pathways from the native state 1585 to the unfolded state 1. Only native base pairs are formed on these pathways. The x axis is for the number of native base pairs formed, and the y axis is the free energy in kcal/mol. The kinetic barrier between individual states is not shown except for the major pathway denoted by the thick dashed and solid lines.
At T = 90°C, the completely unfolded state (1) occupies 98% of the total population in equilibrium. Therefore, starting from the native state (1585) at t = 0, the relaxation is virtually an unfolding reaction. The population kinetics shown in Fig. 6A is consistent with our eigenmode analysis above, e.g., the preformation of the macrostate for the multiple intermediates followed by the rate-determining transition from the macrostate to the unfolded state.
To investigate the unfolding pathways, we have enumerated all the possible low-barrier pathways exhaustively. In Fig. 6B we show all the lowest barrier pathways. We found that all the lowest barrier routes are on-pathway. A major fast pathway determined from the barrier distribution would be the unzipping from the terminal of the helical stem (see the thick lines in Fig. 6B). Other pathways have higher kinetic barriers and thus give slower unfolding from the native state.
Fig. 6B is a plot for the one-dimensional free-energy landscape along the major pathway. The free-energy landscape shows that states 1585, 1546, 1352, 1049, 606, 332, 74, and 34 form a basin that is separated from the free-energy minimum for the unfolded state by a high free-energy barrier (‡). In the unfolding process, the states that reside in the basin preequilibrate to form a macrostate before transforming into the unfolded state. State 74 is at the bottom of the basin and therefore is the most stable kinetic intermediate (as shown in Fig. 6A). The activation enthalpy for the unfolding transition can be estimated from ΔHa ≃ ΔH‡ − ΔHmacrostate ≃ ΔHstate1 − ΔHstate74 = −(ΔHCG-CG + ΔHUC-GA) = 8 kcal/mol + 13.3 kcal/mol = 21.3 kcal/mol. This result is consistent with the result calculated from the slope of the Arrhenius plot at T = 90°C, ΔHa = −d(ln kobs)/d(1/T) = 23 kcal/mol. The positive activation enthalpy corresponds to the energetic cost to break the base stacks to unfold the hairpin.
Temperature T = 10°C.
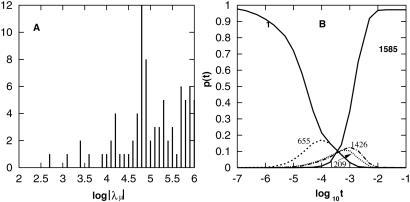
As shown in Fig. 7A, there is no distinctive time separation between the eigenmodes for T = 10°C. Therefore, the (folding) relaxation would be a multistate process that cannot be described by a single exponential kinetics.
Figure 7.
(A) The eigenvalue spectrum at 10°C. (B) Population kinetics for the folding from the fully unfolded state 1. Results for the states of which populations never exceed 10% during the relaxation are not shown. In the folding process, three kinetics intermediates, 655, 1209, and 1426, are formed (see Fig. 8 for the structures).
To simulate the folding kinetics, we start with the completely extended conformation (state 1) and follow the population kinetics. Because the native state occupies more than 97% of the total population, the relaxation process is virtually a folding reaction. In Fig. 7B we plot the population kinetics for all the states with fractional population no less than 10%.
Fig. 7B shows three kinetic intermediates: on-pathway (no nonnative base pairs formed) intermediate 655 formed at ≈10−4 sec, and off-pathway (with nonnative pairs formed) intermediates 1426 and 1209 formed at ≈10−3 sec (see Fig. 8 for their structures). The time scales of the formation of the intermediates can be estimated also from the eigenvalues: eigenmodes n2 and n3 involve the formation of states 1209 and 1426, and n4 involves the formation of state 655; hence, state 655 is formed at ≈|λ4|−1 = 10−3.4 sec, and states 1209 and 1426 are formed at ≈|λ3|−1 = 10−3.1 sec.
Figure 8.
The free-energy diagram of states 655, 1209, and 1426 and their kinetically neighboring states. The (negative) numbers are the free energies (in kcal/mol) of the corresponding states.
Fig. 8 is a free-energy diagram for states 655, 1209, and 1426 and their kinetically neighboring states. The intermediates are local minima on the free-energy landscape, because they have lower free energies than their neighboring states. The only exception is for state 1472, which has a lower free energy than state 1209 but is separated kinetically from 1209 by a notably high barrier. Kinetic barriers between individual states are not shown in the figure.
To have a better understanding of how the intermediates are formed, we have exhaustively enumerated all the possible low-barrier pathways for the formation of 655 from state 1 and the formation of 1209 and 1426 from states 1 and 655.
Formation of 655.
The close proximity to state 1 (only three steps away; see Fig. 8A) causes the early formation of state 655. State 1 → 655 is a fast process with a lowest total barrier of 19.9 kcal/mol. A typical 1 → 655 fast pathways would be 1 → 48 → 371 → 655 (see Fig. 8A).
Formation of 1209 and 1426.
Are states 1209 and 1426 predominantly formed from state 1 or from the preformed intermediate 655? Because the lowest total barriers for 1 → 1209 (38.5 kcal/mol, 120 pathways) and 1 → 1426 (42.1 kcal/mol, 176 pathways) are much smaller than the lowest barriers for 655 → 1209 (57.1 kcal/mol, 764 pathways) and 655 → 1426 (60.8 kcal/mol, 50 pathways), respectively, 1209 and 1426 are mainly caused by the folding of state 1 (the completely extended conformation).
How Do States 655, 1209, and 1426 Leave Their Respective Kinetic Traps and Fold to the Native State 1585?
Detrapping of 1209.
State 1209 is kinetically close to 1585 (only two steps away; see Fig. 8B). The exhaustive enumeration of the low-barrier pathways gives the lowest barrier downhill through pathway 1209 → 1472 → 1585 (see Fig. 8B).
Detrapping of 1426.
The low-barrier 1426 → 1585 pathways give a large number of chain-sliding modes for the folding, where a minimum number of bases are bulged out in each step to reduce the kinetic barrier (see Fig. 8C).
Detrapping of 655.
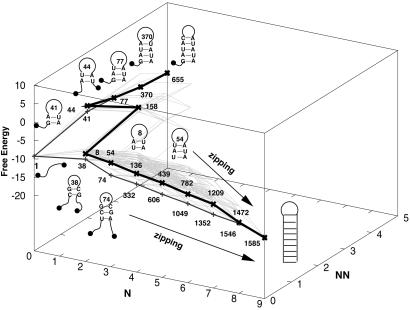
There are two types of low-barrier 655 → 1585 pathways depending on whether the chain is fully extended before refolding (i.e., whether the pathway passes state 1; see Fig. 9). Most low-barrier pathways (73.3 kcal/mol, total of 22,240 routes) pass state 1. A typical pathway is to refold from state 1 through a nucleation-zipping process (see Figs. 4B and 9) after a complete unfolding (655 → 1). The complete unfolding of state 655 costs 25 kcal/mol in enthalpy, and the nucleation-zipping pathway has an enthalpic barrier of −8 kcal/mol, and thus we would expect a positive activation barrier for folding of state 655. A smaller portion of the low-barrier pathways (72.2 kcal/mol, a total of 9,945 routes) detour around state 1, corresponding to refolding without being fully extended. For example, there are 1,924 such pathways that approach 1585 via 1209 (see Fig. 9).
Figure 9.
The free-energy landscape and the low-barrier pathways at T = 10°C for the detrapping and refolding of state 655. The vertical axis is the free energy in kcal/mol, and the horizontal coordinates (N, NN) are the number of (native, nonnative) base pairs of the states. The thick lines show typical refolding pathways with and without complete unfolding.
Conclusions
Previous chemical kinetics type models for RNA hairpin and duplex formation cannot account for the sequence-dependent multiple pathways and the formation of misfolded kinetic intermediates (8, 9). Here we have analyzed the detailed thermodynamics and kinetics of a representative 21-nt hairpin-forming RNA. Unlike previous approaches (13, 35–37), our model is based on the complete ensemble of all the possible hairpin conformations. The 21-nt RNA sequence that we investigated undergoes a two-state cooperative thermodynamic transition at Tm ≃ 60°C. In the equilibrium folding process, as temperature is decreased the native base pairs close to the loop region are formed, followed by a zipping process for the formation of the whole hairpin structure.
Our kinetic model is a combination of the eigenvalue and eigenvector solutions for the rate matrix and free-energy landscapes. The eigenvalue solution reveals a characteristic temperature Tg for the folding kinetics. For T > Tg there exists a large gap between the lowest nonzero eigenvalue and the rest of the eigenvalue spectrum, and for T > Tg, such a gap is absent. For the RNA sequence we investigated, Tg ≃ 20°C (<Tm). The folding kinetics shows distinctive behavior in different temperature regimes defined by the characteristic temperatures Tg and Tm. For T ≥ Tm, the unfolding relaxation shows a biphasic on-pathway kinetics, fast formation of a preequilibrated macrostate followed by a rate-limiting cooperative transition from the macrostate to the unfolded state. For Tg < T < Tm the chain folds through a rate-limiting nucleation for the consecutive base stacks UC-GA and CG-CG, which are closest to loop region, followed by a rapid assembly of the whole structure. The nucleation process leads to a negative apparent activation enthalpy. At further lower temperatures T ≤ Tg, the minima on the free-energy landscape are stabilized and become deep kinetic traps. As a result, the chain is trapped in the on- and off-pathway kinetic intermediates. We call temperature Tg a “glass transition temperature.” For the 21-nt RNA we investigated, the chain leaves the on-pathway trap through on-pathway transitions to the native state, and the chain leaves the off-pathway traps either by complete unfolding before refolding to the native state through a nucleation-zipping process or by partial unfolding/folding. Because of the multistate kinetics, the rate-temperature curve shows a roll-over Arrhenius plot, and the folding kinetics deviates from the two-state single exponential behavior.
Combined with the energy-landscape analysis, the solution of the eigenmodes of the rate matrix can give much profound folding kinetic information about the kinetics intermediates, folding cooperativity, activation barrier, and the rate-limiting step(s) and folding pathways. The model presented here also has limitations. The present analysis is limited to hairpin conformations and is not suitable for the prediction of the large RNA folding kinetics. Nevertheless, we show here that even for the folding of simple hairpin conformations, RNA folding kinetics shows a variety of temperature-dependent behaviors. RNA hairpin folding may be a paradigm for the folding of more complex RNA structures.
The general features of RNA hairpin-folding intermediates, negative activation barrier, and non-Arrhenius kinetics have been observed in a series of remarkable experiments for DNA and peptide hairpins (12, 19–21). The characteristic folding kinetics of RNA, DNA, and peptide hairpins may have the same origins. For example, the negative activation enthalpy associated with the entropic nucleation barrier is responsible for the nucleation-zipping kinetics, and multiple pathways involving the detrapping from the misfolded intermediates cause a positive apparent activation enthalpy and non-Arrhenius kinetics (46, 47).
Acknowledgments
We are indebted to Ken A. Dill for helpful discussions. This work was supported by grants from the Petroleum Research Fund and the American Heart Association (National Center).
Footnotes
This paper was submitted directly (Track II) to the PNAS office.
References
- 1.Treiber D K, Williamson J R. Curr Opin Struct Biol. 1999;9:339–345. doi: 10.1016/S0959-440X(99)80045-1. [DOI] [PubMed] [Google Scholar]
- 2.Woodson S A. Cell Mol Life Sci. 2000;57:796–808. doi: 10.1007/s000180050042. [DOI] [PMC free article] [PubMed] [Google Scholar]
- 3.Fang X W, Pan T, Sosnick T R. Nat Struct Biol. 1999;6:1091–1095. doi: 10.1038/70016. [DOI] [PubMed] [Google Scholar]
- 4.Silverman S K, Cech T R. RNA. 2001;7:161–166. doi: 10.1017/s1355838201001716. [DOI] [PMC free article] [PubMed] [Google Scholar]
- 5.Wu M, Tinoco I., Jr Proc Natl Acad Sci USA. 1998;95:11555–11560. doi: 10.1073/pnas.95.20.11555. [DOI] [PMC free article] [PubMed] [Google Scholar]
- 6.Gluick T C, Wills N M, Gesteland R F, Draper D E. Biochemistry. 1997;36:16173–16186. doi: 10.1021/bi971362v. [DOI] [PubMed] [Google Scholar]
- 7.Thirumalai D, Lee N, Woodson S A, Klimov D K. Annu Rev Phys Chem. 2001;52:751–762. doi: 10.1146/annurev.physchem.52.1.751. [DOI] [PubMed] [Google Scholar]
- 8.Pörschke D. Mol Biol Biochem Biophys. 1977;24:191–218. doi: 10.1007/978-3-642-81117-3_5. [DOI] [PubMed] [Google Scholar]
- 9.Craig M E, Crothers D M, Doty P. J Mol Biol. 1971;62:383–401. doi: 10.1016/0022-2836(71)90434-7. [DOI] [PubMed] [Google Scholar]
- 10.Crothers D M, Cole P E, Hilbers C W, Shulman R G. J Mol Biol. 1974;87:63–88. doi: 10.1016/0022-2836(74)90560-9. [DOI] [PubMed] [Google Scholar]
- 11.Liphardt J, Onoa B, Smith S B, Tinoco I, Jr, Bustamante C. Science. 2001;292:733–737. doi: 10.1126/science.1058498. [DOI] [PubMed] [Google Scholar]
- 12.Munoz V, Thompson P A, Hofrichter J, Eaton W A. Nature (London) 1997;390:196–199. doi: 10.1038/36626. [DOI] [PubMed] [Google Scholar]
- 13.Munoz V, Eaton W A. Proc Natl Acad Sci USA. 1999;96:11311–11316. doi: 10.1073/pnas.96.20.11311. [DOI] [PMC free article] [PubMed] [Google Scholar]
- 14.Klimov D K, Thirumalai D. Proc Natl Acad Sci USA. 2000;97:2544–2549. doi: 10.1073/pnas.97.6.2544. [DOI] [PMC free article] [PubMed] [Google Scholar]
- 15.Guo C L, Levine H, Kessler D A. Phys Rev Lett. 2000;84:3490–3493. doi: 10.1103/PhysRevLett.84.3490. [DOI] [PubMed] [Google Scholar]
- 16.Dinner A R, Lazaridis T, Karplus M. Proc Natl Acad Sci USA. 1999;96:9068–9073. doi: 10.1073/pnas.96.16.9068. [DOI] [PMC free article] [PubMed] [Google Scholar]
- 17.Kolinski A, Ilkowski B, Skolnick J. Biophys J. 1999;77:2942–2952. doi: 10.1016/S0006-3495(99)77127-4. [DOI] [PMC free article] [PubMed] [Google Scholar]
- 18.Pande V S, Rokhsar D S. Proc Natl Acad Sci USA. 1999;96:9062–9067. doi: 10.1073/pnas.96.16.9062. [DOI] [PMC free article] [PubMed] [Google Scholar]
- 19.Ansari A, Kuznetsov S V, Shen Y. Proc Natl Acad Sci USA. 2001;98:7771–7776. doi: 10.1073/pnas.131477798. [DOI] [PMC free article] [PubMed] [Google Scholar]
- 20.Bonnet G, Krichevsky O, Libchaber A. Proc Natl Acad Sci USA. 1998;95:8602–8606. doi: 10.1073/pnas.95.15.8602. [DOI] [PMC free article] [PubMed] [Google Scholar]
- 21.Wallace MI, Ying L M, Balasubramanian S, Klenerman D. Proc Natl Acad Sci USA. 2001;98:5584–5589. doi: 10.1073/pnas.101523498. [DOI] [PMC free article] [PubMed] [Google Scholar]
- 22.Kuznetsov S V, Shen Y Q, Benight A S, Ansari A. Biophys J. 2001;81:2864–2875. doi: 10.1016/S0006-3495(01)75927-9. [DOI] [PMC free article] [PubMed] [Google Scholar]
- 23.Shen Y Q, Kuznetsov S V, Ansari A. J Chem Phys. 2001;105:12202–12211. [Google Scholar]
- 24.Goddard N L, Bonnet G, Krichevsky O, Libchaber A. Phys Rev Lett. 2000;85:2400–2403. doi: 10.1103/PhysRevLett.85.2400. [DOI] [PubMed] [Google Scholar]
- 25.Wallace M I, Ying L M, Balasubramanian S, Klenerman D. J Phys Chem B. 2000;104:11551–11555. [Google Scholar]
- 26.Bundschuh R, Hwa T. Phys Rev Lett. 1999;83:1479–1482. [Google Scholar]
- 27.Gerland U, Bundschuh R, Hwa T. Biophys J. 2001;81:1324–1332. doi: 10.1016/S0006-3495(01)75789-X. [DOI] [PMC free article] [PubMed] [Google Scholar]
- 28.Thirumalai D. Proc Natl Acad Sci USA. 1998;95:11506–11508. doi: 10.1073/pnas.95.20.11506. [DOI] [PMC free article] [PubMed] [Google Scholar]
- 29.Higgs P G. Q Rev Biophys. 2000;33:199–253. doi: 10.1017/s0033583500003620. [DOI] [PubMed] [Google Scholar]
- 30.McCaskill J S. Biopolymers. 1990;29:1105–1119. doi: 10.1002/bip.360290621. [DOI] [PubMed] [Google Scholar]
- 31.Tostesen E, Chen S J, Dill K A. J Chem Phys. 2001;105:1618–1630. [Google Scholar]
- 32.Chen S J, Dill K A. Proc Natl Acad Sci USA. 2000;97:646–651. doi: 10.1073/pnas.97.2.646. [DOI] [PMC free article] [PubMed] [Google Scholar]
- 33.Zhang W B, Chen S J. J Chem Phys. 2001;114:7669–7681. [Google Scholar]
- 34.Zhang W B, Chen S J. J Chem Phys. 2001;114:4253–4266. [Google Scholar]
- 35.Flamm C, Fontana W, Hofacker I L, Schuster P. RNA. 2000;6:325–338. doi: 10.1017/s1355838200992161. [DOI] [PMC free article] [PubMed] [Google Scholar]
- 36.Isambert H, Siggia E D. Proc Natl Acad Sci USA. 2000;97:6515–6520. doi: 10.1073/pnas.110533697. [DOI] [PMC free article] [PubMed] [Google Scholar]
- 37.Gultyaev A P, van Batenburg F H, Pleij C W. J Mol Biol. 1995;250:37–51. doi: 10.1006/jmbi.1995.0356. [DOI] [PubMed] [Google Scholar]
- 38.Galzitskaya O, Finkelstein A V. Folding Des. 1998;3:69–78. doi: 10.1016/s1359-0278(98)00012-1. [DOI] [PubMed] [Google Scholar]
- 39.Tacker M, Fontana E, Stadler R F, Schuster P. Eur Biophys J. 1994;23:29–38. doi: 10.1007/BF00192203. [DOI] [PubMed] [Google Scholar]
- 40.Cieplak M, Henkel M, Karbowski J, Banavar J R. Phys Rev Lett. 1998;80:3654–3657. [Google Scholar]
- 41.Chen S J, Dill K A. J Chem Phys. 1998;109:4602–4616. [Google Scholar]
- 42.Chen S J, Dill K A. J Chem Phys. 1995;103:5802–5813. [Google Scholar]
- 43.Serra M J, Turner D H. Methods Enzymol. 1995;259:242–261. doi: 10.1016/0076-6879(95)59047-1. [DOI] [PubMed] [Google Scholar]
- 44.Chan H S, Dill K A. Proteins Struct Funct Genet. 1998;30:2–33. doi: 10.1002/(sici)1097-0134(19980101)30:1<2::aid-prot2>3.0.co;2-r. [DOI] [PubMed] [Google Scholar]
- 45.Onuchic J N, Luthey-Schulten Z, Wolynes P G. Annu Rev Phys Chem. 1997;48:545–600. doi: 10.1146/annurev.physchem.48.1.545. [DOI] [PubMed] [Google Scholar]
- 46.Thirumalai D, Woodson S A. Acc Chem Res. 1996;29:433–439. [Google Scholar]
- 47.Socci N D, Onuchic J N, Wolynes P G. J Chem Phys. 1996;104:5860–5868. [Google Scholar]


