

Abstract
Heptahelical receptors (HHRs) are generally thought to function as monomeric entities. Several HHRs such as somatostatin receptors (SSTRs), however, form homo- and heterooligomers when activated by ligand binding. By using dual fluorescent ligands simultaneously applied to live cells monotransfected with SSTR5 (R5) or SSTR1 (R1), or cotransfected with R5 and R1, we have analyzed the ligand receptor stoichiometry and aggregation states for the three receptor systems by fluorescence resonance energy transfer and fluorescence correlation spectroscopy. Both homo- and heterooligomeric receptors are occupied by two ligand molecules. We find that monomeric, homooligomeric, and heterooligomeric receptor species occur in the same cell cotransfected with two SSTRs, and that oligomerization of SSTRs is regulated by ligand binding by a selective process that is restricted to some (R5) but not other (R1) SSTR subtypes. We propose that induction by ligand of different oligomeric states of SSTRs represents a unique mechanism for generating signaling specificity not only within the SSTR family but more generally in the HHR family.
Heptahelical receptors (HHRs) constitute the largest single family of transmembrane signaling molecules that respond to diverse external stimuli such as hormones, neurotransmitters, chemoattractants, odorants, and photons. Although these receptors have been generally thought to function as monomeric entities, there is growing evidence that a number of HHRs assemble as functional homo- and heterooligomers (1, 2). Dimerization seems to be necessary for function of the class C subfamily of HHRs comprising the metabotropic glutamate, calcium sensing, the GABAB, and pheromone receptors that are targeted to the plasma membrane as preformed dimers which are stabilized by ligand binding (3–7). Several HHRs such as somatostatin receptors (SSTRs), dopamine receptors, gonadotrophin-releasing hormone receptor (GnRHR), luteinizing hormone/chorionic gonadotrophin hormone receptor, and chemokine receptors, however, which belong to the rhodopsin-like class A subfamily of HHRs, assemble on the membrane as homo- and heterooligomeric species in response to agonist activation (8–15).
In the case of SSTRs, we have shown by photobleaching fluorescence resonance energy transfer (pbFRET) that the human (h) type 5 receptor (hSSTR5 or R5) exists in the basal state as a monomer, and that activation by ligand induces dose-dependent oligomerization (8). When coexpressed with another SSTR (hSSTR1 or R1) or an unrelated HHR such as the dopamine 2 receptor (D2R), R5 also forms a heterooligomer that displays pharmacological properties distinct from those of either of the separate receptors (9). Little is known about the stoichiometry of ligand-receptor reactions or the specificity for homo- and heterooligomeric interactions between two receptors that are coexpressed in the same cell. By using dual fluorescent ligands simultaneously applied to live cells monotransfected with R5 or R1, or cotransfected with R5 and R1, we have analyzed the ligand-receptor stoichiometry and aggregation states for the three receptor systems by FRET and fluorescence correlation spectroscopy (FCS). We demonstrate the presence of monomeric, homooligomeric, and heterooligomeric receptor species in the same cell cotransfected with two SSTRs. We show that both homo- and heterooligomeric receptors are occupied by two ligand molecules, and that oligomerization of SSTRs is regulated by ligand binding by a selective process that is restricted to some (R5) but not other (R1) SSTR subtypes.
Methods
Peptides and Antisera.
SST-14, SST-28, and [Leu (8)-d-Trp-22, Tyr-25] SST-28 (LTT-SST-28) were obtained from Peninsula Laboratories. Anti-hemagglutinin (HA) mouse mAb (12CA5) and fluorescein- and rhodamine-conjugated mAbs against HA were from Roche Molecular Biochemicals. Rabbit polyclonal Ab directed against the NH2-terminal segment of hR1 was produced and characterized as described (16).
SSTR-Expressing Cells.
Stable Chinese hamster ovary (CHO)-K1 cells expressing HA-R5, wild-type (wt) R1, or coexpressing HA-R5/wt R1 were prepared by lipofectin transfection as described (8).
Fluorescent SST Ligands and Binding Studies.
Fluorescent SST ligands were prepared by N-terminal conjugation of SST-14 to FITC and Texas red (TR) followed by HPLC separation (17, 18). Radioligand binding studies were carried out by reacting [125I-LTT] SST-28 for 30 min at 37°C with cell membrane protein as reported (8, 9).
pbFRET.
pbFRET analysis was performed as described (8, 9, 19). The effective FRET efficiency E was calculated from the pb time constants of the donor obtained in the absence (D − A) and presence (D + A) of acceptor according to E = 1 − (τD-A/τD+A). CHO-K1 cells stably cotransfected with HA-R5 or R1 were grown on glass coverslips for 24 h, treated with SST-14 for 30 min at 37°C, and fixed and processed for immunocytochemistry. HA-R5 and R1 were specifically labeled with FITC and rhodamine, respectively, by using mouse monoclonal HA Abs and rabbit polyclonal R1 Ab followed by reaction with conjugated secondary Abs. Both reactions resulted in specific plasma membrane staining. The pb decay was analyzed for the plasma membrane region on a pixel by pixel basis as well as averaged over the entire image. Image analysis procedures and instrumental setup are described in ref. 8.
FRET Analysis by Single-Photon Excitation.
CHO-K1 cells expressing SSTRs were cultured in chamber slides, treated with fluorescent SST ligands, and examined directly. One-photon experiments were performed by using the 488-nm output of an argon-ion laser coupled to an Olympus (New Hyde Park, NY) 1× 70 epifluorescence microscope with confocal optics. The resulting emission was separated spectrally and detected on two avalanche photodiodes. The sample was scanned through the excitation volume by using a Piezo scanner (Physik Instrumente, Karlsruhe/Palmbach, Germany), and an image was recorded. The resolution of the system is determined by the width of the point-spread function of the laser (∼500 nm for the measurements presented here). Each pixel represents a movement of the sample of ∼200 nm. Variations in the relative intensity of TR and FITC fluorescence were observed by plotting a generalized polarization (GP) image (20). GP is determined as GP = (I1 − I2)/(I1 + I2), where I1 and I2 are the intensities of channel 1 (TR) and 2 (FITC), respectively. The GP image was obtained by performing this operation on each pixel of the two-channel image. The GP value ranges from −1 to +1, reflecting the relative intensity of each channel (−1 and +1 correspond to signal from only the FITC and TR channels, respectively, and being a ratio is independent of intensity). Changes in GP can arise from (i) changes in the ratio of the labeled ligands, (ii) changes in the molecular brightness of either fluorophore, or (iii) changes in the FRET efficiency between the fluorescent labels. Different information can be obtained from the GP image depending on which process is dominant. A change in ligand concentration cannot lead to a change in GP because the GP function is defined to be intensity independent; a change in the ratio of labeled ligands can (but does not necessarily have to) lead to a change in GP. Because direct excitation of the acceptor is negligible, changes in the ratio of donor- and acceptor-labeled ligands cannot cause changes in GP. Furthermore, we have no evidence for changes in the molecular brightness of the fluorophores and thus attribute changes in the GP to variations in the FRET efficiency of the labeled ligands. To correctly determine the FRET efficiency in the presence of direct TR excitation, the relative intensity of the two channels in the absence of FRET was taken to be the GP value measured in buffer where the ligands do not dimerize.
Fluorescence Correlation Spectroscopy.
CHO-K1 cells expressing SSTRs were cultured in chamber slides, treated with dual fluorescent SST ligands, and analyzed directly for FCS (21, 22). A mode-locked Ti-Sapphire laser, which generated ∼100 fsec-wide pulses at an 80-MHz frequency, was used as an efficient two-photon excitation light source directed by means of a Zeiss microscope to a confocal sample volume. The resulting fluorescence was spectrally separated by two avalanche photodiodes. The general equation for the normalized correlation function expressing the level of correlation between two photons separated by a time τ is given by
 |
1 |
with i = j for autocorrelation and i ≠ j for cross correlation. F(t) is the fluorescence intensity at time t, and the < > indicate time averaging (23). At τ = 0 [i.e., G (0), the y intercept of an FCS curve], the autocorrelation is inversely proportional to the average number of fluorescent particles. For τ approaching infinity, the above equation should vanish because the temporal separation of the two photons is large enough that there is no longer any correlation between them. Because the excitation volume is known, the correlation resulting from the time it takes for a dye to cross this volume intrinsically yields a diffusion coefficient. In addition, any property that causes fluctuations in the fluorescence intensity of the dye at a rate fast enough to occur during the fraction of time when the dye is in the excitation volume should be observable in the autocorrelation function.
Results
Ligand-Dependent Oligomerization of SSTRs: Analysis by pbFRET.
To study SSTR homooligomers, we expressed R5 at low levels in CHO-K1 cells (Bmax 160 + 30 fmol/mg of protein; Kd 1.1 + 0.2 nM for SST-14 binding) by stable transfection of R5 tagged at the NH2 terminus with the nonapeptide of HA (8). By pbFRET, using fluorescein (donor)- and rhodamine (acceptor)-labeled monoclonal anti-HA Abs, we have shown that in the absence of ligand, the receptor expressed in these cells displays low effective FRET efficiency consistent with a monomeric state (8). Addition of SST-14 induces a dose-dependent increase in FRET (EC50 3.9 + 2.8 nM) (8). Treatment of live R5 cells with the dual fluorescent anti-HA Abs for 4 h did not result in any observable FRET, indicating that NH2-terminal Ab binding to the receptor does not induce aggregation in the absence of SST ligand. To characterize SSTR heterooligomers, we stably coexpressed HA-R5 with wild-type R1 in CHO-K1 cells. Membrane-binding analysis with the common radioligand [125I-LTT] SST-28 gave a Bmax of 250 + 19 fmol/mg of protein and a Kd of 0.65 + 0.12 nM for SST-14 binding. Physical association of the two receptors to form heterooligomers was demonstrated by pbFRET microscopy (8, 9). As in the case of R5 homooligomers, we found a low relative FRET efficiency in the basal state reflecting a low level of preformed heterooligomers (Fig. 1). Treatment with SST-14 induced dose-dependent increase in FRET efficiency with a maximum of 12.6 + 1.0% at 10−6 M (EC50 3.4 + 2.1 nM), indicating agonist-induced microaggregation (physical association within 100–120 Å) of the two receptors to form a heterooligomer.
Figure 1.
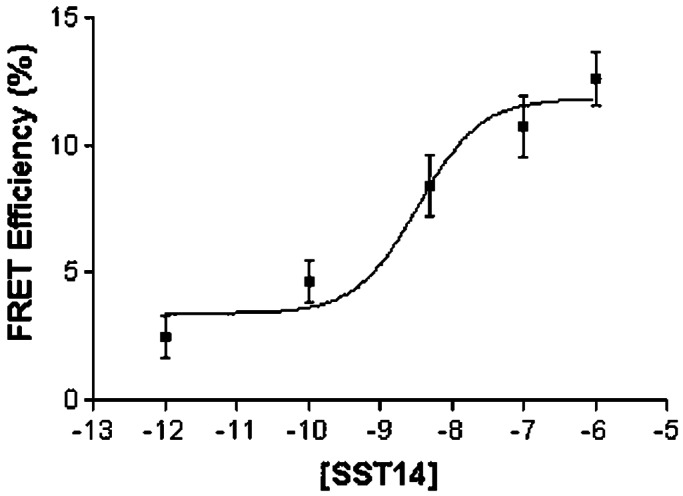
pbFRET analysis of R5/R1 receptors. Dose-dependent increase in effective FRET efficiency induced by treatment with SST-14 of CHO-K1 cells coexpressing HA-R5 and wild-type R1. CHO-K1 cells were treated with increasing concentrations of SST-14 for 30 min at 37°C and analyzed for pbFRET by using FITC-labeled mouse monoclonal anti-HA Abs and rabbit polyclonal R1 Ab directed against the receptor N-terminal segment followed by reaction with rhodamine-conjugated secondary Ab. Thirty to forty cells were analyzed for each experimental condition.
FRET Analysis of Interaction of SSTR Oligomers with Dual Fluorescent Ligands.
To determine whether SSTR oligomers interact with two ligand molecules, we used a single-photon confocal system with two-channel detection (channel 1 for TR and channel 2 for FITC) for direct FRET analysis by using two fluorescent ligands, SST-FITC and SST-TR. The two ligands were simultaneously applied at low concentrations (SST-FITC ∼ 12–15 nM, SST-TR ∼ 5 nM) to cultured CHO-K1 cells stably expressing HA-R5, and signals from both channels were recorded 1–2 min later. The relative intensities of the two fluorescent labels were calculated for individual pixels in given areas of the cell membrane and expressed quantitatively as GP. Confocal images of R5/CHO-K1 cells treated with SST-FITC and SST-TR revealed specific labeling and colabeling of plasma membrane receptors by the two ligands (data not shown). Selective FITC excitation at 488 nm resulted in energy transfer from FITC to TR, and hence, a quenching of the FITC signal and associated increase in the TR emission (Fig. 2A and B). The GP images obtained (Fig. 2C) reveal a highly structured but uneven pattern over the cell surface with the red areas corresponding to regions of high FRET efficiency.
Figure 2.

FRET analysis of dual-fluorescent SST ligands interacting with R5, R5/R1, and R1 in live cells. The FITC fluorescence emission (Left), TR fluorescence emission (Center), and GP image (Right) are shown for CHO-K1 cells individually transfected with R5 (Top), coexpressing R5/R1 (Middle), or R1 (Bottom). The GP image was calculated on a pixel by pixel basis from the FITC and TR images as described (18). The R5 and R5/R1 cells were measured by using single-photon excitation, and the R1 cells were measured with two-photon excitation. [Bar = 10 μm (A–C) and 25 μm (D–I).]
The results of single-photon experiments with the dual fluorescent SST-FITC and SST-TR ligands applied to HA-R5/R1 cell cotransfectants are depicted in Fig. 2 D–F. Confocal images showed specific labeling of plasma membrane receptors by both ligands (data not shown). As in the case of HA-R5, GP analysis of R5/R1 cell cotransfectants after simultaneous application of the two fluorescent ligands showed strong TR emission from channel 1 after FITC excitation (Fig. 2 D and E). The GP image (shown in red) over the cell surface for the R5/R1 heterooligomer is uneven comparable to that of the R5/R5 homooligomer, but with noticeably reduced GP values (Fig. 2F).
The histogram of GP values for Fig. 2 C and F masked via intensity to include only the membrane region of the cell are shown in Fig. 3A. Analysis of the membrane region revealed a broad monophasic curve for the R5 homooligomer with a relatively high mean GP value of 0.75. The GP distribution for the R5/R1 heterooligomer showed a bimodal curve comprising a major peak, with a mean GP value of 0.45, and a smaller peak with a mean GP value of 0.75, overlapping the single peak obtained with the R5 homooligomer. A distribution of GP values in the histogram arises from variations in the number of monomeric, homooligomeric, and (when relevant) heterooligomeric receptors within each pixel. Although the absolute GP value can be affected by direct excitation of the acceptor, crosstalk of the donor in the acceptor channel, and fluorescent background, it should be stressed that these results depend on the shape of the GP distribution function and the relative GP values of the two measurements. Provided the amount of direct excitation, background, and crosstalk are known, FRET efficiency can still be calculated. That FRET is observed between the two ligands implies they are in close proximity to each other (24, 25). The Förster distance for the FITC/TR donor-acceptor pair is Ro ≅ 50 Å with an uncertainty of about 5%. Hence, the homo- and the heterooligomer must be occupied by the two fluorescent ligand molecules, and the ligands must reside within 100 Å of each other. In view of the limitations and uncertainties in determination of the donor-acceptor separation, we roughly estimate the distance between the two fluorophores in the R5 homooligomer to be ∼50 Å, and approximately 60 Å in the case of the R5/R1 heterooligomer (24, 25). Furthermore, the biphasic distribution plot obtained for the R5/R1 cotransfectants suggests a mixed population of both R5/R1 heterooligomers and R5/R5 homooligomers in the same cells.
Figure 3.

Calculated FRET efficiencies for R5, R5/R1, and R1 cell lines. Normalized histograms of GP values occurring in the cell portion of the GP images in Fig. 2 C, F, and I are plotted. The cellular portion of the image was determined by visual assessment. The GP value is a measure of fractional intensity. A GP value of −1, 0, and 1 corresponds to signal entirely in the FITC channel, equally split between the two channels, or entirely in the TR channel, respectively. (A) Histogram of the R5 (red line)- and R5/R1 (green line)-transfected cell lines. Only pixels above a certain threshold intensity in the TR channel were included in the histogram to investigate the cell portion of the GP images. (B) Histogram of GP values for R1-transfected cell lines.
Although these results confirm the theoretical prediction that cotransfection of R5 with another SSTR subtype to produce a heterooligomer should also result in a population of R5 homooligomers, we were surprised not to see a third peak in the GP distribution plot of the R5/R1 cotransfectants corresponding to R1 homooligomers. This finding could be the result of an absence of R1 homooligomers or an R1 homooligomer peak that overlaps the R5/R5 or R5/R1 peaks detected. To distinguish between these two possibilities, direct studies were carried out in CHO-K1 cells monotransfected with R1 (Bmax 229 ± 10 fmol/mg of protein; Kd 0.62 ± 0.13 nM for SST-14). We first conducted pbFRET analysis of HA-R1 stably expressed in CHO-K1 cells with fluorescein- and rhodamine-conjugated monoclonal HA Abs. We obtained effectively no energy transfer both in the absence (1.1 ± 1.1%) and presence (1.0 ± 0.7%) of SST-14 (10−6 M), indicating that unlike R5, R1 exists only as a monomer in these cells. This result was confirmed by two-photon experiments with the dual fluorescent SST ligands, which showed that although both ligands were specifically colocalized on the plasma membrane (data not shown), there was no TR emission after FITC excitation (Fig. 2 G and H). GP analysis revealed a monophasic curve with a negative GP value consistent with the absence of FRET between the two ligands (Figs. 2I and 3B).
FCS Analysis of SSTR Oligomers.
Although FRET represents a powerful tool for probing dimer formation, it is less effective for analyzing monomeric species and for ligand-induced aggregation that extends beyond dimerization to oligomer formation. To address these issues, we applied two-photon dual color FCS with auto- and crosscorrelation analysis as described (21). With this method, a discrimination based on molecular size, number density, and average brightness/particle can be analyzed from experimental parameters totally independent of FRET. By using this technique, a sharply focused laser beam illuminates a femtoliter confocal volume in live cells, and emitted light quanta from single molecules are detected over time via a scanning dual channel two-photon system (21–23). Fluctuations in fluorescence intensity caused by translational and rotational diffusion, chemical reactions, and conformational changes of the molecules are revealed by autocorrelation analysis. In addition, fluorescence crosscorrelation analysis can be used to detect only those molecules that carry two different fluorophores so as to monitor oligomerization and aggregation. The maximum amplitude of the crosscorrelation function G1 2 (0) is directly proportional to the concentration of double-labeled molecules (23). Independent diffusion of two unattached different color-labeled ligands into the open two-photon volume will not contribute to the crosscorrelation, because these events are random and vanish when averaged.
Fig. 4A depicts a computer-simulated theoretical crosscorrelation analysis that would result from a purely monomeric sample. The simulations were performed by using the “Monte Carlo in a Grid” algorithm (26). The parameters selected were closely matched to those analyzed experimentally except for the number of particles, which was chosen to be much smaller than the experimental value to speed up the simulation time. The sole effect of this discrepancy is that the overall magnitude of the autocorrelation and crosscorrelation curves is larger in the simulation compared with the experiment. Therefore, to compare the results of the simulation to the experiment, the ratio of the crosscorrelation amplitude to that of the autocorrelation was used. The simulated minimum G1 2 (0)/G1 (0) value obtained (0.22) is greater than 0 only because unavoidable color leakage creates a background level of crosstalk between the two channels (Fig. 4A). Simulated crosscorrelation analysis for a purely dimeric sample yields a maximum G1 2 (0)/G1 (0) ratio of 0.71 (Fig. 4B). These values match very well with theoretical expectation. The experimental values should lie somewhere between these two extremes, because both monomeric and dimeric species are expected to be present. Consequently, for any given pair of experimental autocorrelation curves a maximum and minimum crosscorrelation value can be calculated by using simulation.
Figure 4.

Theoretical auto- and crosscorrelation FCS curves for monomeric and dimeric receptor species derived by using a Monte Carlo in a Grid simulation adapted to FCS measurements (using the SIMFCS program written by E.G.). The two-channel autocorrelation curves shown in green and red are coincident because the number of particles simulated was equally divided between the two species. (A) For the monomer case, the ratio of G12 (0) (crosscorrelation curve shown in black) to G1 (0) should theoretically be zero but shows a finite minimum value because of the crosstalk between the two channels. (B) The curves for the dimeric case reveal the maximum possible ratio of G12 (0) to G1 (0). These two scenarios set the minimum and maximum ratios for the set of experimental conditions simulated.
To determine the oligomerization status of R1, R5, and R5/R1 receptors, SST-FITC and SST-TR (5–15 nM) were applied to live CHO-K1 cells expressing R1 or R5, or coexpressing R5/R1 and FCS autocorrelation curves derived from selected cell regions (Fig. 5). Unlike the well defined curves obtained for the fluorescent ligands in solution (data not shown), sampling of different membrane regions from all three cell lines revealed a variation in FCS autocorrelation curves (shown in green and red) corresponding to a heterogeneous distribution of diffusion constants (Fig. 5 B and D). Crosscorrelation analysis (black curves) gave G1 2 (0) values of 0.02 for the R1 and 0.07 for the R5/R1-expressing cells. More importantly, the R5/R1-expressing cells displayed a greater crosscorrelation relative to the simulated boundaries (represented by the horizontal blue lines in Fig. 5 B and D) than the R1-expressing cells, suggesting a higher level of dimerization/oligomerization for R5/R1 compared to R1 (Fig. 5 B and D). In the case of R5, we were unable to obtain sufficiently noise-free curves to enable a crosscorrelation calculation, possibly because of the presence of a heterogeneous and highly aggregated system. Overall, these results are in agreement with our FRET data showing progressively increasing oligomer formation from R1 to R5/R1 and (probably) R5.
Figure 5.

Experimentally derived auto- and crosscorrelation curves from live R1- and R5/R1-expressing CHO-K1 cells using dual-color two-photon FCS. (A and C) The spots sampled are marked by a pink cross. (B and D) Autocorrelation curves are shown in red and green, and crosscorrelation is shown in black. The R5/R1-expressing cells have a greater crosscorrelation relative to the simulated boundaries (represented by the horizontal blue lines on the y axis) than the R1-expressing cells, indicating a higher level of dimer/oligomer formation.
Discussion
By using three independent techniques, we present conclusive evidence that membrane SSTRs exist in the basal state as a monomeric species, and that activation by ligand induces both homo- and heterooligomerization. In the case of R5, our FRET and FCS results suggest that ligand binding triggers a receptor-clustering process in the cell membrane that extends beyond dimers to higher order oligomers. A similar model of ligand-induced microaggregation has been proposed for the gonadotropin-releasing hormone receptor based on Ab crosslinking and pb recovery experiments (10, 27). It is possible that ligand-bound R5 clusters aggregate in membrane rafts similar to the reported association of receptors for IgA, epidermal growth factor, and tissue factor, which have been shown to selectively associate with such membrane microdomains (28).
In contrast to R5, R1 did not form a homooligomer. Because this receptor binds and signals effectively when expressed as a monotransfectant, this means that a monomeric SSTR can be active and that homooligomerization is not an obligatory requirement for activation of all SSTRs (29). Interestingly, unlike other SSTRs, R1 is resistant to agonist-induced endocytosis but is instead up-regulated at the membrane in response to continued agonist exposure (29). Whether this or another property is linked to the inability of R1 to form homooligomers remains to be determined. We speculate that ligand-induced conformational change does not expose a hydrophobic interface, which can facilitate dimer formation in the case of R1. The observation that this receptor remains monomeric provides an important reference point against which precise molecular parameters such as aggregation kinetics, conformational states, and translational/rotational diffusion can be evaluated and compared with an oligomeric receptor such as R5 in live cells. Interestingly, although R1 did not form a homooligomer when expressed alone, it did associate with R5 as a heterooligomer when coexpressed with this receptor. Although the precise receptor domains that dictate such specificity for oligomerization remain to be elucidated, our distance estimates showing that the relative distance between the two ligand molecules in the ligand-bound form of the R5/R1 heterooligomer is greater than the distance between the same two ligand molecules in the R5 homooligomer suggests that the R5 homooligomer is a more compact structure than the R5/R1 heterooligomer, assuming that clusters with the same stoichiometry are compared. In this particular system, the GP data suggest a relationship between the proximity of binding sites and ease of dimer formation. The use of fluorescent ligands to probe distance relationships at the nanometer level provides a powerful approach that could be extended to other HHR oligomeric combinations to test the general validity of this observation.
Concerning ligand-receptor stoichiometry, we have described pharmacological evidence for the interaction of one ligand per receptor oligomer based on functional complementation of two partially active R5 mutants where only one of the mutants is binding competent, by functional complementation of a signaling-deficient R5 mutant with R1 by using a selective agonist that binds to only one of the two receptors, and by demonstrating that either SST or dopamine induces heterodimerization of R5 with the D2 receptor (8, 9). On the other hand, the finding that the R5/D2R heterooligomer displays enhanced signaling when simultaneously activated by both SST and dopamine ligands provides pharmacological evidence for the occupancy of the heterooligomer by two ligand molecules (9). Here we provide direct evidence with FRET that activated R5 homooligomers and R5/R1 heterooligomers interact with two ligand molecules. The association of SSTR homo- and heterooligomers with two ligand molecules is comparable to the model revealed by the crystal structure of the extracellular domain of the metabotropic glutamate receptor whose active form has binding sites for two glutamate molecules (6). Overall, our model suggests that a single ligand molecule is sufficient to trigger oligomerization but that a second physical state exists in which the oligomer is occupied by two ligand molecules. Functionally, the induction by ligand binding of different oligomeric states of SSTRs with different rates of lateral diffusion in the plasma membrane may be a mechanism for generating signaling specificity not only within the SSTR family but more generally in the HHR family.
Acknowledgments
We thank M. Correia for secretarial help. This study was supported by National Institutes of Health Grants NS32160 and NS34339 and by Canadian Institutes of Health Research Grant MOP-10411. Y.C.P. is a Distinguished Scientist of the Canadian Institutes of Health. M.R. is supported by a studentship from the Fonds de la Recherche en Sante du Quebec (FRSQ).
Abbreviations
- HHR
heptahelical receptor
- SSTR
somatostatin receptor
- pbFRET
photobleaching fluorescence resonance energy transfer
- FCS
fluorescence correlation spectroscopy
- HA
hemagglutinin
- CHO
Chinese hamster ovary
- TR
Texas red
- GP
generalized polarization
References
- 1.Milligan G. J Cell Sci. 2001;114:1265–1271. doi: 10.1242/jcs.114.7.1265. [DOI] [PubMed] [Google Scholar]
- 2.Salahpour A, Angers S, Bouvier M. Trends Endocrinol Metab. 2000;11:163–168. doi: 10.1016/s1043-2760(00)00260-5. [DOI] [PubMed] [Google Scholar]
- 3.Marshall F H, Jones K A, Kaupmann K, Bettler B. Trends Pharmacol Sci. 1999;20:396–399. doi: 10.1016/s0165-6147(99)01383-8. [DOI] [PubMed] [Google Scholar]
- 4.Herrada G, Dulac C. Cell. 1997;90:763–773. doi: 10.1016/s0092-8674(00)80536-x. [DOI] [PubMed] [Google Scholar]
- 5.Matsunami H, Buck L B. Cell. 1997;90:775–784. doi: 10.1016/s0092-8674(00)80537-1. [DOI] [PubMed] [Google Scholar]
- 6.Kunishima N, Shimada Y, Tsuji Y, Sato T, Yamamoto M, Kumasaka T, Nakanishi S, Jingami H, Morikawa K. Nature (London) 2000;407:971–977. doi: 10.1038/35039564. [DOI] [PubMed] [Google Scholar]
- 7.Bai M, Trivedi S, Brown E M. J Biol Chem. 1998;273:23605–23610. doi: 10.1074/jbc.273.36.23605. [DOI] [PubMed] [Google Scholar]
- 8.Rocheville M, Lange D, Kumar U, Sasi R, Patel R C, Patel Y C. J Biol Chem. 2000;275:7862–7869. doi: 10.1074/jbc.275.11.7862. [DOI] [PubMed] [Google Scholar]
- 9.Rocheville M, Lange D, Kumar U, Patel S C, Patel R C, Patel Y C. Science. 2000;288:154–157. doi: 10.1126/science.288.5463.154. [DOI] [PubMed] [Google Scholar]
- 10.Horvat R D, Roess D A, Nelson S E, Barisas B G, Clay C M. Mol Endocrinol. 2001;15:695–703. doi: 10.1210/mend.15.5.0633. [DOI] [PubMed] [Google Scholar]
- 11.Cornea A, Janovick J A, Maya-Nunez G, Conn P M. J Biol Chem. 2001;276:2153–2158. doi: 10.1074/jbc.M007850200. [DOI] [PubMed] [Google Scholar]
- 12.Roess D A, Horvat R D, Munnelly H, Barisas B G. Endocrinology. 2000;141:4518–4523. doi: 10.1210/endo.141.12.7802. [DOI] [PubMed] [Google Scholar]
- 13.Rodriguez-Frade J M, Vila-Coro A J, Martin de Ana A, Albar J P, Martinez-A C, Mellado M. Proc Natl Acad Sci USA. 1999;96:3628–3633. doi: 10.1073/pnas.96.7.3628. [DOI] [PMC free article] [PubMed] [Google Scholar]
- 14.Vila-Coro A J, Rodriguez-Frade J M, Martin De Ana A, Moreno-Ortiz M C, Martinez-A C, Mellado M. FASEB J. 1999;13:1699–1710. [PubMed] [Google Scholar]
- 15.Vila-Coro A J, Mellado M, Martin de Ana A, Lucas P, del Real G, Martinez-A C, Rodriguez-Frade J M. Proc Natl Acad Sci USA. 2000;97:3388–3393. doi: 10.1073/pnas.050457797. [DOI] [PMC free article] [PubMed] [Google Scholar]
- 16.Kumar U, Sasi R, Suresh S, Patel A, Thangaraju M, Metrakos P, Patel S C, Patel Y C. Diabetes. 1999;48:77–85. doi: 10.2337/diabetes.48.1.77. [DOI] [PubMed] [Google Scholar]
- 17.Nouel D, Gaudriault G, Houle M, Reisine T, Vincent J P, Mazella J, Beaudet A. Endocrinology. 1997;138:296–306. doi: 10.1210/endo.138.1.4834. [DOI] [PubMed] [Google Scholar]
- 18.Cornea A, Janovick J A, Lin X, Conn P M. Endocrinology. 1999;140:4272–4280. doi: 10.1210/endo.140.9.7049. [DOI] [PubMed] [Google Scholar]
- 19.Jovin T M, Arndt-Jovin D. In: FRET Microscopy: Digital Imaging of Fluorescence Resonance Energy Transfer. Application in Cell Biology in Cell Structure and Function by Microspectro-Fluometry. Kohen E, Ploem J S, Hirschberg J G, editors. Orlando, FL: Academic; 1989. p. 99. [Google Scholar]
- 20.Bagatolli L A, Gratton E. Biophys J. 2000;79:434–447. doi: 10.1016/S0006-3495(00)76305-3. [DOI] [PMC free article] [PubMed] [Google Scholar]
- 21.Berland K M, So P T C, Gratton E. Biophys J. 1995;68:694–701. doi: 10.1016/S0006-3495(95)80230-4. [DOI] [PMC free article] [PubMed] [Google Scholar]
- 22.Magde D, Elson E, Webb W W. Phys Rev Lett. 1972;29:705–708. [Google Scholar]
- 23.Kettling U, Koltermann A, Schwille P, Eigen M. Proc Natl Acad Sci USA. 1998;95:1416–1420. doi: 10.1073/pnas.95.4.1416. [DOI] [PMC free article] [PubMed] [Google Scholar]
- 24.Forster T. Ann Phys. 1948;2:55–75. [Google Scholar]
- 25.Wu P, Brand L. Anal Biochem. 1994;218:1–13. doi: 10.1006/abio.1994.1134. [DOI] [PubMed] [Google Scholar]
- 26.Fishkin J B, Gratton E. J Opt Soc Am A. 1993;10:127–140. doi: 10.1364/josaa.10.000127. [DOI] [PubMed] [Google Scholar]
- 27.Conn P M, Rogers D C, Stewart J M, Neidel J, Sheffield T. Nature (London) 1982;296:653–655. doi: 10.1038/296653a0. [DOI] [PubMed] [Google Scholar]
- 28.Simons K, Toomre D. Nat Rev Mol Cell Biol. 2000;1:31–39. doi: 10.1038/35036052. [DOI] [PubMed] [Google Scholar]
- 29.Hukovic N, Rocheville M, Kumar U, Sasi R, Khare S, Patel Y C. J Biol Chem. 1999;274:24550–24558. doi: 10.1074/jbc.274.35.24550. [DOI] [PubMed] [Google Scholar]