

Summary
Brown adipose tissue (BAT) simultaneously metabolizes fatty acids (FA) and glucose under cold stress but favors FA as the primary fuel for heat production. It remains unclear how BAT steer fuel preference toward FA over glucose. Here we show that the malate-aspartate shuttle (MAS) is activated by cold in BAT and plays a crucial role in promoting mitochondrial FA utilization. Mechanistically, cold stress selectively induces glutamic-oxaloacetic transaminase (GOT1), a key MAS enzyme, via the β-adrenergic receptor-PKA-PGC-1α axis. The increase in GOT1 activates MAS, transferring reducing equivalents from the cytosol to mitochondria. This process enhances FA oxidation in mitochondria while limiting glucose oxidation. In contrast, loss of MAS activity by GOT1 deficiency reduces FA oxidation, leading to increased glucose oxidation. Together, our work uncovers a unique regulatory mechanism and role for MAS in mitochondrial fuel selection and advances our understanding of how BAT maintains fuel preference for FA under cold conditions.
Keywords: Brown adipocytes, glutamic oxaloacetic transaminase, malate-aspartate shuttle, NADH shuttle, PGC-1α, glycolysis, fatty acid oxidation, mitochondrial thermogenesis, glucose oxidation
Graphical Abstract

eTOC blurb
Park et al. show that GOT1, a key enzyme of the malate-aspartate shuttle (MAS), is selectively upregulated by cold in brown adipose tissue and acts as a molecular switch turning on the MAS. Cold-activated MAS is essential for supporting mitochondrial fuel preference for fatty acids over glucose.
Introduction
Brown adipocytes, located in the interscapular brown adipose tissue (BAT), are a distinct type of fat cell that dissipates nutrient-derived energy in the form of heat via mitochondrial uncoupling protein 1 (UCP1)1–3. Brown-like beige adipocytes also emerge within white adipose tissue during prolonged cold exposure or pharmacological stimulation of β3-adrenergic receptors (β3AR)4–10. The presence of brown/beige adipocytes has been established in adult humans10–15, and their activity is associated with increased energy expenditure and improved systemic lipid and glucose homeostasis. These properties make brown/beige adipocytes an appealing target against obesity and its related metabolic disorders.
BAT simultaneously metabolizes a variety of carbon substrates, such as fatty acids, glucose, and amino acids to meet thermogenic and biosynthetic needs under cold stress1,16. Fatty acids (FA), released from intracellular triacylglycerol (TAG) stores or taken up from the circulation, are rapidly broken down into acetyl-CoA via FA β-oxidation with a concomitant production of NADH and FADH2 as byproducts. Acetyl-CoA then enters the TCA cycle where it is further oxidized to generate NADH and FADH2. The resultant NADH and FADH2 supply electrons to the electron transport chain (ETC), creating a proton gradient across the inner mitochondrial membrane (IMM). UCP1 residing in the IMM allows these protons to flow back into the mitochondrial matrix, thus leading to heat production rather than ATP synthesis2,3. As fatty acids (FA) produce more energy than any other substrates (e.g., 31 NADH and 15 FADH2 from one palmitic acid molecule compared to 6 NADH and 2 FADH2 from one glucose molecule), FA is the primary fuel source for UCP1-mediated thermogenesis. Moreover, FA directly activates UCP1 by inducing a conformational change that allows protons to be transported across the IMM17.
Cold-activated BAT also takes up a large amount of circulating glucose; however, glucose is only modestly (<15%) used as a fuel source for thermogenesis18–21. Increasing evidence indicates that the majority of glucose-derived carbons produced in glycolysis are released as lactate20,21 or channeled into various biosynthetic pathways, such as glycogen synthesis, pentose phosphate pathway, and glycerol-3-phosphate synthesis, which are essential for replenishment of intracellular TAG in lipid droplets20–23. The glycolytic end product pyruvate entering the mitochondria is primarily used to replenish TCA cycle intermediates (i.e., oxaloacetate) via pyruvate carboxylation23 or directed toward de novo fatty acid synthesis (FAS)21,24 although a small pool of pyruvate enters the TCA cycle as acetyl-CoA. Branched-chain amino acids (BCAA) taken up by BAT are used as nitrogen donors for biosynthesis of non-essential amino acids25 and as additional, but minor, carbon sources for TCA cycle intermediates26. This distinct substrate utilization likely allows BAT to efficiently meet the dual demands of heat production and cellular biosynthesis in response to cold stress. However, the regulatory mechanisms by which BAT prioritizes FA as the primary fuel for thermogenesis while directing other substrates to meet various metabolic needs still remain elusive.
The malate-aspartate shuttle (MAS) is an important biochemical system that maintains cytosolic and mitochondrial NAD+/NADH redox balance under glycolytic conditions. MAS transports reducing equivalents produced in glycolysis from the cytosol to mitochondria27, since the mitochondrial inner membrane (IMM) is impermeable to NADH. In cells with high energy demands, MAS enables glycolysis-derived NADH to be fed into the ETC for ATP production, while also regenerating NAD+ in the cytosol to sustain glycolysis. MAS plays a crucial role in various tissue-specific metabolic processes, such as neurotransmitter synthesis in the brain28, pumping activity of the heart29, urea cycle in the liver30, insulin secretion by pancreatic β-cells31, and exercise capacity in skeletal muscle under aerobic conditions32. However, MAS’s role in BAT with high metabolic and thermogenic demands remains unclear. MAS is composed of two mitochondrial carriers (OGC, AGC) and two pairs of cytosolic and mitochondrial enzymes – glutamic-oxaloacetic transaminases (cGOT1, mGOT2) and malate dehydrogenases (cMDH1, mMDH2). Intriguingly, we found that GOT1 is markedly induced by cold in BAT from its barely detectable level, while other MAS enzymes remain unchanged. Thus, we sought to investigate whether the increase in GOT1 protein levels activates MAS in BAT and what role MAS plays in BAT under cold conditions. By using BAT-specific Got1 knock-in and Got1 knockout mice and their respective brown adipocytes, we demonstrate that brown adipocyte GOT1 is a critical node linking cold-stimulated β-adrenergic signaling to the MAS, and cold-activated MAS is essential for promoting efficient utilization of FA over glucose in the mitochondria. This discovery expands our understanding of MAS beyond NADH transfer, positioning it as a critical regulator of mitochondrial fuel selection in BAT.
Results
GOT1, a key enzyme in the malate-aspartate shuttle, is highly elevated by cold in BAT
The malate-aspartate shuttle (MAS) utilizes two pairs of cytosolic and mitochondrial enzymes and two mitochondrial carriers (Fig. 1A). MAS is active in energy-demanding tissues, such as the brain, heart, liver, and to a lesser extent, skeletal muscle, and plays a critical role in cellular metabolism in a tissue-specific manner27. Our transcriptome analysis33 of BAT from mice housed at room temperature or exposed to 4°C for 6h unexpectedly revealed that the Got1 gene, but not other MAS enzyme genes (Got2, Mdh1, Mdh2), is highly upregulated by cold (Fig. 1B). Likewise, mice stimulated with a cold-mimetic β3-adrenergic receptor agonist CL3162435–7 showed increased expression of Got1 in BAT with no change in Got2, Mdh1, and Mdh2 gene expression (Fig. 1C), suggesting that cold-stimulated βAR signaling promotes the transcription of the Got1 gene. GOT1 was abundantly expressed in many tissues like the brain, liver, heart, skeletal muscle, and kidney, whereas GOT1 protein was barely detectable in BAT at room temperature (Fig. 1D). In agreement with the cold-dependent increase in Got1 expression, cold exposure markedly increased GOT1 protein levels (Fig. 1E), which were also coupled with heightened enzymatic activity (Fig. 1F). However, the protein levels of other MAS enzymes were relatively unchanged during cold exposure (Fig. 1E). Similar to BAT, GOT1 protein was hardly detectable in inguinal white adipose tissue (IWAT) at room temperature (Fig. 1D and 1G), but we observed a significant induction of GOT1 in IWAT undergoing browning during prolonged cold exposure (Fig. 1G, Fig. S1C). Together, these data indicate that cold stress upregulates Got1 gene expression in brown and beige adipocytes. In support of our findings, a recent brown, beige, and white adipocyte transcriptome analysis in mice and humans34 identified Got1 as a highly enriched gene in cold-activated brown and beige adipocytes.
Figure 1. Cold-dependent induction of GOT1, a key enzyme of the malate-aspartate shuttle in BAT.

(A) A schematic of the malate-aspartate shuttle (MAS), which consists of two pairs of cytosolic (GOT1 and MDH1) and mitochondrial (GOT2 and MDH2) enzymes and two mitochondrial transporters. MAS transports reducing equivalents produced in glycolysis from the cytosol to mitochondria in the form of malate, which is oxidized back to oxaloacetate (OAA), regenerating NADH in the mitochondria. (B, C) qPCR analysis of MAS gene expression in BAT. In B, BL6 mice were housed at 23°C or exposed to 4°C for 5h. In C, BL6 mice were administered with vehicle or a β3AR agonist CL316243 for 5h. (D) Expression of GOT1 protein in brain (B), liver (L), heart (H), muscle (M), kidney (K), brown adipose (BA), and white adipose (WA) tissue. (E) Effect of cold stress on the MAS enzyme levels in BAT. (F) Increased GOT activity in cold-activated BAT. (G) Effect of cold stress on the MAS enzyme levels in IWAT. BL6 mice were housed at 23°C or exposed to 4°C for 7 days. All data are presented as the Mean ± SEM. **p<0.01, ****p<0.0001.
The Got1 gene expression is upregulated via a βAR-cAMP-PKA-PGC-1α/NT-PGC-1α axis
Cold stress stimulates the sympathetic nervous system to release norepinephrine, which binds to β-adrenergic receptors on brown adipocytes and activates a signaling cascade leading to increased expression of a number of genes including Ucp11. To verify that brown adipocyte β-adrenergic signaling is responsible for increased Got1 gene expression in BAT, we stimulated fully differentiated brown adipocytes35 with a βAR agonist isoproterenol or a PKA activator cAMP. Both significantly induced Got1 gene expression with no effect on Got2, Mdh1, and Mdh2 genes (Fig. 2A and 2B). Given that PGC-1α transcriptional co-activators, such as full-length PGC-1α and its shorter isoform NT-PGC-1α35,36, regulate a number of cold-responsive genes in BAT in response to βAR stimulation, we asked whether Got1 is a downstream target of PGC-1α and/or NT-PGC-1α. Our BAT ChIP-seq33 with PGC-1α antibody detecting both PGC-1α and NT-PGC-1α35,36 revealed that PGC-1α/NT-PGC-1α are enriched at the GOT1 gene promoter that contains two consensus DNA binding motifs for estrogen-related receptors (ERRs) (Fig. 2C). We were able to confirm the recruitment of PGC-1α/NT-PGC-1α to one of the ERRE sites at the GOT1 gene promoter (−604/−596) (Fig. 2D). This is consistent with the previous finding that ERRα/γ binds to and activates the GOT1 gene promoter in murine heart37. Given that PGC-1α and NT-PGC-1α are transcriptional co-activators of ERRs in brown adipocytes36,38,39, the βAR-PKA-PGC-1α/NT-PGC-1α-ERRs axis likely promotes Got1 transcription in brown adipocytes. The loss of both PGC-1α and NT-PGC-1α in Pgc-1α−/− brown adipocytes40,41 blunted Got1 gene expression, while the deletion of either PGC-1α or NT-PGC-1α in brown adipocytes41,42 did not alter its expression (Fig. 2E). Likewise, re-expression of PGC-1α or NT-PGC-1α in Pgc-1α−/− brown adipocytes was sufficient to promote Got1 gene expression (Fig. 2F). Together, these results delineate that cold stress upregulates Got1 gene expression in brown adipocytes via the well-established βAR-cAMP-PKA-PGC-1α/NT-PGC-1α-ERR pathway (Fig. 2G).
Figure 2. Cold-stimulated βAR signaling promotes the transcription of the GOT1 gene through the βAR-cAMP-PKA-PGC-1α/NT-PGC-1α axis.

(A, B) Upregulation of Got1 gene expression in brown adipocytes treated with 5 μM isoproterenol (ISO) or 1 mM dibutyryl cAMP for 4h. (C) Enrichment of PGC-1α/NT-PGC-1α at the GOT1 gene promoter in cold-activated BAT. The PGC-1α/NT-PGC-1α ChIP-seq peak33 was visualized by the Integrative Genome Viewer (IGV) v2.3. (D) PCR analysis of PGC-1α/NT-PGC-1α recruitment to the ERRE of the GOT1 promoter. ChIP was carried out with PGC-1α antibody in nuclear extracts of BAT extracted from mice exposed to 4°C for 5h. (E) Effect of single or combined loss of full-length (FL)-PGC-1α and NT-PGC-1α on Got1 gene expression. Fully differentiated brown adipocytes were treated with 1 mM dibutyryl cAMP for 4h (n=4/group). (F) Effect of ectopic expression of FL-PGC-1α or NT-PGC-1α on Got1 expression in brown adipocytes (n=4/group). (G) Schematic presentation of transcriptional regulation of the Got1 gene by cold or β-AR agonist in brown adipocytes. All data are presented as the Mean ± SEM. #p<0.0001.
Mice overexpressing GOT1 in BAT exhibit enhanced BAT thermogenesis
This finding led us to ask whether GOT1 acts as a molecular switch for activating the MAS in BAT in response to cold. To address this question, we generated a Got1 knock-in mouse line where the transgene of CAG-loxP-neo-3xpA(stop)-loxP-Got1 was inserted into the Rosa26 locus (Fig. 3A). While the polyadenylation sequence terminates transcription initiated by the CAG promoter, the Cre-mediated excision of the stop cassette enables targeted expression of Got1. R26-Got1fl/+:UCP1-cre/+ (R26-Got1BATOE/+) mice were generated by crossing R26-Got1fl/fl mice with Ucp1-Cre mice43 that express Cre recombinase in BAT at room temperature. R26-Got1BATOE/+ mice housed at 23°C exhibited selective expression of Got1 in BAT, but not in other tissues (Fig. 3B). Moreover, GOT1 protein levels produced by the R26-Got1BATOE/+ allele at 23°C were comparable to those induced by cold in R26-Got1fl/+ control mice (Fig. 3C), and GOT1 overexpression did not alter the expression of other MAS enzymes (Fig. 3D), thereby validating the overexpression of GOT1 in BAT without cold exposure. Brown adipocyte morphology was relatively normal in R26-Got1BATOE/+ mice (Fig. 3E), but GOT1 overexpression caused a significant change in the cellular NAD+/NADH ratio in BAT (Fig. 3K), as expected from GOT1’s role in MAS activation.
Figure 3. BAT-specific overexpression of GOT1 in mice enhances BAT thermogenesis.

(A) Generation of BAT-specific Got1 knock-in mice. The transgene of CAG-loxP-neo-3xpA(stop)-loxP-Got1 was inserted into the Rosa26 locus. Cre-mediated excision of the stop cassette enables targeted expression of Got1 in BAT. (B) qPCR analysis for validation of BAT-specific Got1 expression in R26-Got1BATOE/+ mice housed at 23°C. (C) Cold-independent elevation of GOT1 protein in BAT of R26-Got1BATOE/+ male mice at 23°C. (D) No alteration of other MAS enzyme expression by GOT1 overexpression in BAT. (E) H&E staining of BAT from mice at 23°C. Scale bars represent 100 μm. (F-J) Measurement of body weight, energy expenditure, RER, food intake, and locomotor activity by indirect calorimetry in R26-Got1fl/+ and R26-Got1BATOE/+ female mice (n=5/group). (K) Measurement of NAD+/NADH ratios in BAT homogenates. (L, M) Measurement of mitochondrial respiration and 14C-labeled palmitate or pyruvate oxidation in brown adipocytes freshly isolated from female mice housed at room temperature. (N) Improved cold tolerance of R26-Got1BATOE/+ female mice (n=5/group). (O) Ucp1 mRNA and protein levels in BAT from the same mice described in N. (P) qPCR analysis of BAT extracted from mice housed at 23°C or 4°C (n=6–7/group). (Q, S) Glucose tolerance tests of R26-Got1fl/+ and R26-Got1BATOE/+ female mice at 23°C (n=7/group) and at 4°C (n=7/group). (R) [3H]-2DG uptake by BAT extracted from mice housed at 23°C. (T) In vivo [3H]-2DG uptake in female mice upon β3-adrenergic stimulation. All data are presented as the Mean ± SEM. *p<0.05, **p<0.01, ***p<0.001, ****p<0.0001, #p<0.0001.
To investigate the impact of GOT1 overexpression on BAT thermogenesis, we evaluated the whole-body energy expenditure (EE) by indirect calorimetry in R26-Got1BATOE/+ and R26-Got1fl/+ mice prior to and after BAT activation by a selective β3AR agonist CL3162435–7. Body mass and lean and fat mass were not different between the groups prior to and after indirect calorimetry (Fig. 3F, Fig. S1B). R26-Got1BATOE/+ mice exhibited slightly higher basal EE compared to littermate controls and displayed a greater increase in EE immediately after administration of CL316243 (Fig. 3G). The observed increase in EE in R26-Got1BATOE/+ mice was associated with a greater decrease in respiratory exchange ratio (RER) (Fig. 3H), indicating increased utilization of fat as a fuel source for BAT thermogenesis in R26-Got1BATOE/+ mice. Food intake and locomotor activity did not differ between the groups during indirect calorimetry (Fig. 3I and 3J).
Next, to determine if the observed phenotypes of R26-Got1BATOE/+ mice were due to the functional effects caused by GOT1 overexpression in BAT, we isolated primary brown adipocytes directly from BAT of R26-Got1BATOE/+ mice at room temperature and assessed the effect of GOT1 overexpression on mitochondrial respiration and substrate oxidation. Although R26-Got1BATOE/+ mice exhibited only a small increase in whole body EE without a change in RER at room temperature, the freshly isolated Got1OE brown adipocytes under this condition showed enhanced mitochondrial respiration as measured by oxygen consumption rates (OCR) (Fig. 3L), along with the increased oxidation of 14C-labeled palmitate over pyruvate (Fig. 3M), indicating that these cells preferentially oxidize fatty acids to fuel mitochondrial respiration. Thus, the combined findings from in vivo indirect calorimetry and ex vivo primary brown adipocyte studies likely suggest that the MAS’ full operational capacity in R26-Got1BATOE/+ mice also depends on the thermogenic demand and fatty acid flux, both of which increase with β-adrenergic activation of BAT.
R26-Got1BATOE/+ mice exhibited improved cold tolerance upon exposure to 4°C (Fig. 3N). The cold tolerance phenotype was associated with increasing trends in UCP1 mRNA and protein levels in Got1OE BAT (Fig. 3O). In addition, Got1OE BAT showed the elevated expression of genes linked to FA uptake (Cd36), mitochondrial FA transport (Cpt1b), and FA β-oxidation (Acads, Acadl) (Fig. 3P), consistent with lower RER (Fig. 3H). Inguinal WAT morphology appeared normal in R26-Got1BATOE/+ mice at room temperature (Fig. S1A), and cold-dependent induction of Ucp1 in IWAT was comparable in R26-Got1fl/+ and R26-Got1BATOE/+ mice (Fig. S1D), suggesting that the gain of GOT1 function in cold-induced beige adipocytes does not affect the overall browning process.
BAT is the tissue with highest rates of glucose uptake during cold exposure44–46, contributing to enhanced glucose tolerance during GTT47. Thus, we assessed glucose tolerance in R26-Got1BATOE/+ and R26-Got1fl/+ mice at room temperature and during cold exposure. At room temperature, a rise in blood glucose levels at 15 min was lower in R26-Got1BATOE/+ mice compared to littermate controls, although overall glycemic differences between the groups were not statistically significant (Fig. 3Q). However, BAT extracted from R26-Got1BATOE/+ mice at room temperature indeed showed a higher uptake of [3H]-2-deoxyglucose (2-DG), a non-metabolizable glucose analog (Fig. 3R). During cold exposure, R26-Got1BATOE/+ mice exhibited improved glucose tolerance compared to littermate controls (Fig. 3S). This improvement in glucose tolerance was also associated with an approximately 45% increase in [3H]-2-DG uptake by BAT in R26-Got1BATOE/+ mice compared to littermate controls, although statistical significance was not achieved (Fig. 3T). Consistent with these findings, Got1OE BAT showed augmented expression of genes involved in glucose uptake (Glut1, Glut4) and glycolysis (Pfk, Eno3, Ldha/b) (Fig. 3P). Collectively, these data suggest that GOT1 overexpression in BAT enhances BAT’s ability to more efficiently handle the high flux of fatty acids and glucose, both of which increase in BAT upon cold exposure.
GOT1 overexpression in brown adipocytes activates the malate-aspartate shuttle (MAS)
Next, we sought to investigate whether GOT1 overexpression indeed activates MAS in brown adipocytes. Thus, we generated Got1OE brown adipocytes by isolating stromal vascular fraction (SVF) from R26-Got1fl/fl BAT, followed by Cre-mediated recombination48 and differentiation into brown adipocytes. GOT1 overexpression did not alter brown adipogenesis as evidenced by no difference in adipogenic gene expression (Fig. 4A). The increase in cytosolic GOT1 levels resulted in increased GOT1 enzyme activity in the cytosolic fraction (Fig. 4B and 4D), and cytosolic GOT1 activity was completely inhibited by aminooxyacetate (AOA) that inhibits GOT1 and GOT249 (Fig. 4C and 4D). In the MAS, GOT1 catalyzes the conversion of aspartate to oxaloacetate, which is subsequently reduced to malate via malate dehydrogenase (MDH1) with the coupled oxidation of NADH to NAD+. Thus, we monitored cytosolic NADH dynamics in Got1OE brown adipocytes by expressing a genetically encoded NADH biosensor Peredox50–53. Peredox is constructed by linking a GFP variant to a bacterial NADH-binding protein, Rex (Fig. 4E, left panel). Upon binding NADH, Rex undergoes a conformational change that is coupled with an increase in green fluorescence. Peredox was tandemly fused to mCherry to enable ratiometric readout50. The green and red fluorescence intensity was monitored over time in the same cell in the presence of glucose, followed by addition of AOA to inhibit GOT1 and iodoacetate/pyruvate to inhibit glycolysis (Fig. 4E, right panel). GOT1 overexpression led to a lower green-to-red fluorescence ratio (Fig. 4F, vehicle), reflecting decreased NADH levels in the cytosol. This reduction was closely associated with an increase in mitochondrial respiration as measured by oxygen consumption rates (OCR) (Fig. 4G, vehicle), implying that reducing equivalents transferred from cytosolic NADH to the mitochondria via the MAS are fed into the ETC. Subsequent inhibition of GOT1 activity by AOA (Fig. 4C) rapidly increased the green-to-red fluorescence ratio in Got1OE brown adipocytes (Fig. 4F, AOA). In line with NADH accumulation in the cytosol, AOA abrogated the GOT1-dependent increase in mitochondrial respiration (Fig. 4G, AOA). Together, these results clearly demonstrate that the overexpression of GOT1 in brown adipocytes activates MAS, which in turn facilitates the oxidation of cytosolic NADH to NAD+ with a concurrent transport of reducing equivalents to the mitochondria.
Figure 4. GOT1 overexpression activates the malate-aspartate shuttle in brown adipocytes.

(A) qPCR analysis for adipogenesis in Got1fl/fl and Got1OE brown adipocytes. (B) WB analysis of GOT1 in the whole cell extracts, cytosolic, and mitochondrial fractions. (C) Schematic showing the effect of AOA-dependent inhibition of GOT1 and GOT2 in the MAS. Red arrows indicate the effect of AOA on NADH/NAD+. (D) Measurement of GOT1 enzyme activity in the cytosolic fraction of brown adipocytes treated with vehicle or 2 mM AOA. (E) Schematic showing Peredox-mCherry, a fluorescent sensor of the NADH-NAD+ redox state (left panel). A circularly permuted GFP T-Sapphire (green) is interposed between the two Rex subunits (gray), with an RFP mCherry (red) to normalize for the GFP fluorescence. A representative green and red fluorescence profile of Peredox-mCherry (right panel) prior to and after addition of 2 mM AOA, followed by addition of 20 mM pyruvate and 0.4 mM glycolytic inhibitor, iodoacetate. The Peredox signal was normalized to the lowest value with pyruvate and iodoacetate. (F) Effect of GOT1 overexpression on the cytosolic NADH-NAD+ redox state measured by the normalized green to red fluorescence ratio of Peredox-mCherry. Approximately 50 cells per group were analyzed. (G) Measurement of mitochondrial uncoupled respiration in brown adipocytes in the presence of an ATPase inhibitor, oligomycin. (H) Schematic of [2H] labeling used to determine cytosolic NADH-oxidizing pathways. The deuterium of NAD2H produced from [4-2H] glucose can be incorporated into malate, G3P, or lactate. (I) Total and [2H]-labeled NADH levels in Got1fl/fl and Got1OE brown adipocytes incubated with 25mM [4-2H] glucose at 2.5, 5, and 10 min. (J) Total and [M+1]-malate levels and fraction of [M+1]-malate after introducing [4-2H] glucose. (K) Total and [M+1]-, [M+2]-G3P levels and fraction of [M+1]- and [M+2]-G3P after introducing [4-2H] glucose. (L) Total and [M+1]-lactate levels and fraction of [M+1]-lactate after introducing [4-2H] glucose. All data are presented as the Mean ± SEM. *p<0.05, **p<0.01, ***p<0.001, ****p<0.0001, #p<0.0001.
To further attest the GOT1-dependent activation of MAS in brown adipocytes, we performed stable isotope tracing using a [4-2H]-glucose tracer54–56. Metabolism of [4-2H]-glucose in the glycolytic pathway produces [1-2H]-glyceraldehyde 3-phosphate (GAP) (Fig. 4H). GAPDH then transfers 2H from GAP to NADH. Cytosolic lactate dehydrogenase (LDH), malate dehydrogenase (MDH1), and glycerol-3-phosphate dehydrogenase (GPDH) subsequently transfer 2H from NAD2H to lactate, malate, and G3P, producing [2-2H]-lactate, [2-2H]-malate, and [2-2H]-G3P, respectively (Fig. 4H). GPDH can also produce [1, 2-2H]-G3P by transferring 2H from NAD2H to [1-2H]-dihydroxyacetone phosphate (DHAP). Thus, we assessed if GOT1 overexpression increases the production of deuterium-labeled malate by activating the MAS. Upon culturing brown adipocytes with [4-2H]-glucose, we detected rapid labeling of NADH from [4-2H]-glucose with higher levels of NAD2H in Got1OE brown adipocytes compared to control cells (Fig. 4I, right panel). The steady state isotopic labeling of metabolites was achieved as early as 2.5 minutes (Fig. 4J–4L). Indeed, GOT1 overexpression significantly increased the production of [M+1]-labeled malate (Fig. 4J, middle panel) and its labeled fraction (Fig. 4J, right panel), indicating that increased metabolic flux through GOT1 is sufficient to stimulate subsequent metabolic flux through the NADH-oxidizing enzyme MDH1 in the MAS pathway. Accordingly, the combined results from Peredox, mitochondrial respiration, and [4-2H]-glucose tracing studies clearly demonstrate that GOT1 overexpression activates MAS, promoting the transport of reducing equivalents produced in glycolysis into mitochondria.
GOT1-dependent activation of MAS enhances glucose uptake, glycolysis, and mitochondrial FA oxidation in brown adipocytes
Surprisingly, we noticed that [M+1]- and [M+2]-labeled G3P (Fig. 4K, middle and right panels) and [M+1]-labeled lactate (Fig. 4L, middle panel) were also elevated in Got1OE brown adipocytes, suggesting that regeneration of cytosolic NAD+ via MAS may stimulate the glycolytic flux, which in turn leads to increased glucose uptake. To test this, we first assessed the glycolytic flux by measuring extracellular acidification22,57 that is primarily caused by the release of lactate produced during glycolysis. The extracellular acidification rates (ECAR) were indeed higher in Got1OE brown adipocytes compared to control cells (Fig. 5A). ECAR also remained higher during βAR stimulation with a βAR agonist, isoproterenol (ISO) (Fig. 5A). The inhibition of mitochondrial ATP synthase by oligomycin (Oligo) did not result in an additional increase in glycolysis, indicating that WT and Got1OE brown adipocytes do not compensate for the inhibition of mitochondrial ATP production by increasing glycolysis. Consistent with increased glycolysis, Got1OE brown adipocytes showed increased uptake of [3H]-2-DG (Fig. 5B, vehicle), coupled with elevated levels of GLUT1 glucose transporter (Fig. 5C). Glucose uptake also remained higher during βAR stimulation with isoproterenol (Fig. 5B). In line with the rise in glucose uptake and glycolysis, Got1OE brown adipocytes exhibited increased expression of genes involved in glucose transport and glycolysis (Fig. 5D). However, despite the increase in glucose uptake and glycolysis, oxidation of the glycolytic end product pyruvate through the TCA cycle in the mitochondria was significantly diminished in Got1OE brown adipocytes treated with vehicle or isoproterenol (Fig. 5E). Instead, mitochondrial FA oxidation was greatly increased (Fig. 5F) as observed in the freshly isolated primary Got1OE brown adipocytes, in conjunction with elevated expression of FAO-related genes (Fig. 5D). Moreover, Got1OE brown adipocytes exhibited higher mitochondrial respiration (Fig. 5G). This increase was mainly due to an increase in oligomycin-independent leak respiration that represents UCP1-mediated uncoupled respiration. Upon β-AR stimulation, Got1OE brown adipocytes displayed a greater increase in total and leak respiration without a significant difference in coupled respiration (Fig. 5G). Enhanced uncoupled respiration was accompanied by increased UCP1 levels in Got1OE brown adipocytes (Fig. 5I). Taken together, these data show that GOT1 OE-dependent MAS activation stimulates glucose uptake and glycolysis while also increasing mitochondrial FA oxidation to support thermogenesis.
Figure 5. GOT1 overexpression enhances glucose uptake, glycolysis, and mitochondrial respiration in brown adipocytes.

(A) Extracellular acidification rates (ECAR) measured by a Seahorse XF analyzer in Got1fl/fl and Got1OE brown adipocytes (n=10/group) at baseline and after addition of 10 mM glucose, followed by addition of 10 μM oligomycin and 50 mM 2-DG. (B) Measurement of [3H]-2DG uptake in brown adipocytes treated with vehicle or 5μM isoproterenol (ISO) for 4h. (C) WB analysis of GLUT1 protein. (D) qPCR analysis of genes involved in glucose uptake, glycolysis, and FA oxidation. (E, F) Oxidation of 14C-labeled pyruvate or palmitate in brown adipocytes treated with vehicle or isoproterenol for 4h. CO2 production was normalized by protein concentrations. (G) Mitochondrial respiration in brown adipocytes in the absence and presence of an ATPase inhibitor, oligomycin. (H) The ADP/ATP ratios measured in the whole cell lysates. (I, J) Increased phosphorylation of AMPKα at Thr172 in Got1-overexpressing brown adipocytes and BAT. (K) Schematic showing the effect of GOT1 overexpression on FAO, glucose uptake, and glycolysis. All data are presented as the Mean ± SEM. *p<0.05, **p<0.01, ***p<0.001, #p<0.0001.
Despite no change in respiration coupled to mitochondrial ATP production, Got1OE brown adipocytes displayed an increase in the cellular ADP/ATP ratio (Fig. 5H). The higher ADP/ATP ratio has been shown to stimulate adenylate kinase that converts two ADP into ATP and AMP58,59. AMP binding to the γ subunit of AMPK promotes the phosphorylation of the α subunit at Thr172, enhancing AMPK’s catalytic activity60. Thus, we examined whether AMPK is activated in Got1OE brown adipocytes. The phosphorylation of AMPKα at Thr172 was increased in unstimulated Got1OE brown adipocytes and the phosphorylated levels remained higher even after βAR stimulation, which activates AMPK61,62 (Fig. 5I). Consistently, Got1OE BAT also exhibited a trend toward increased AMPKα phosphorylation at Thr172 (Fig. 5J). AMPK-mediated phosphorylation of acetyl-CoA carboxylase (ACC) at Ser79 has been shown to enhance FAO by increasing the activity of carnitine palmitoyl transferase (CPT1), the rate-limiting enzyme in FAO63. In line with AMPK activation by phosphorylation at Thr172, ACC was highly phosphorylated at Ser79 in Got1OE brown adipocytes (Fig. 5I, vehicle), revealing that activated AMPK in part contributes to the observed increase in FAO. Given AMPK’s well-established role in promoting glucose uptake64–67 and glycolysis68, AMPK might also contribute to the observed increase in glucose uptake and glycolysis in Got1OE brown adipocytes. Together, these data suggest that AMPK activated in Got1OE brown adipocytes in part plays a role in enhancing FA oxidation while also supporting glucose uptake and glycolysis (Fig. 5K).
Mice lacking Got1 in BAT have decreased capacity for FAO but induce a compensatory increase in glucose oxidation to fuel cold-induced thermogenesis
To assess the importance of the cold-activated MAS in BAT thermogenesis, we generated BAT-specific Got1 knockout (Got1fl/fl:UCP1-cre/+) mice by crossing Got1fl/fl mice (EMMA, #10399) with Ucp1-Cre mice43 (Fig. 6A). Ucp1-Cre mice express Cre recombinase mainly in BAT at room temperature and additionally in inguinal WAT (IWAT) undergoing brown remodeling during prolonged cold exposure43,69–72. Cold-dependent induction of Got1 mRNA and protein in BAT and IWAT, but not in other tissues, was completely blunted in Got1BATKO mice (Fig. 6B–C). However, the loss of GOT1 in BAT and IWAT depots had no impact on adiposity (Fig. S2A, S2B) and adipose remodeling during cold exposure (Fig. S2C, S2F), although it caused a reduction in the cellular NAD+/NADH ratio (Fig. 6H).
Figure 6. BAT-specific Got1 knockout mice exhibit reduced FA oxidation with a greater reliance on glucose oxidation for cold-induced thermogenesis.
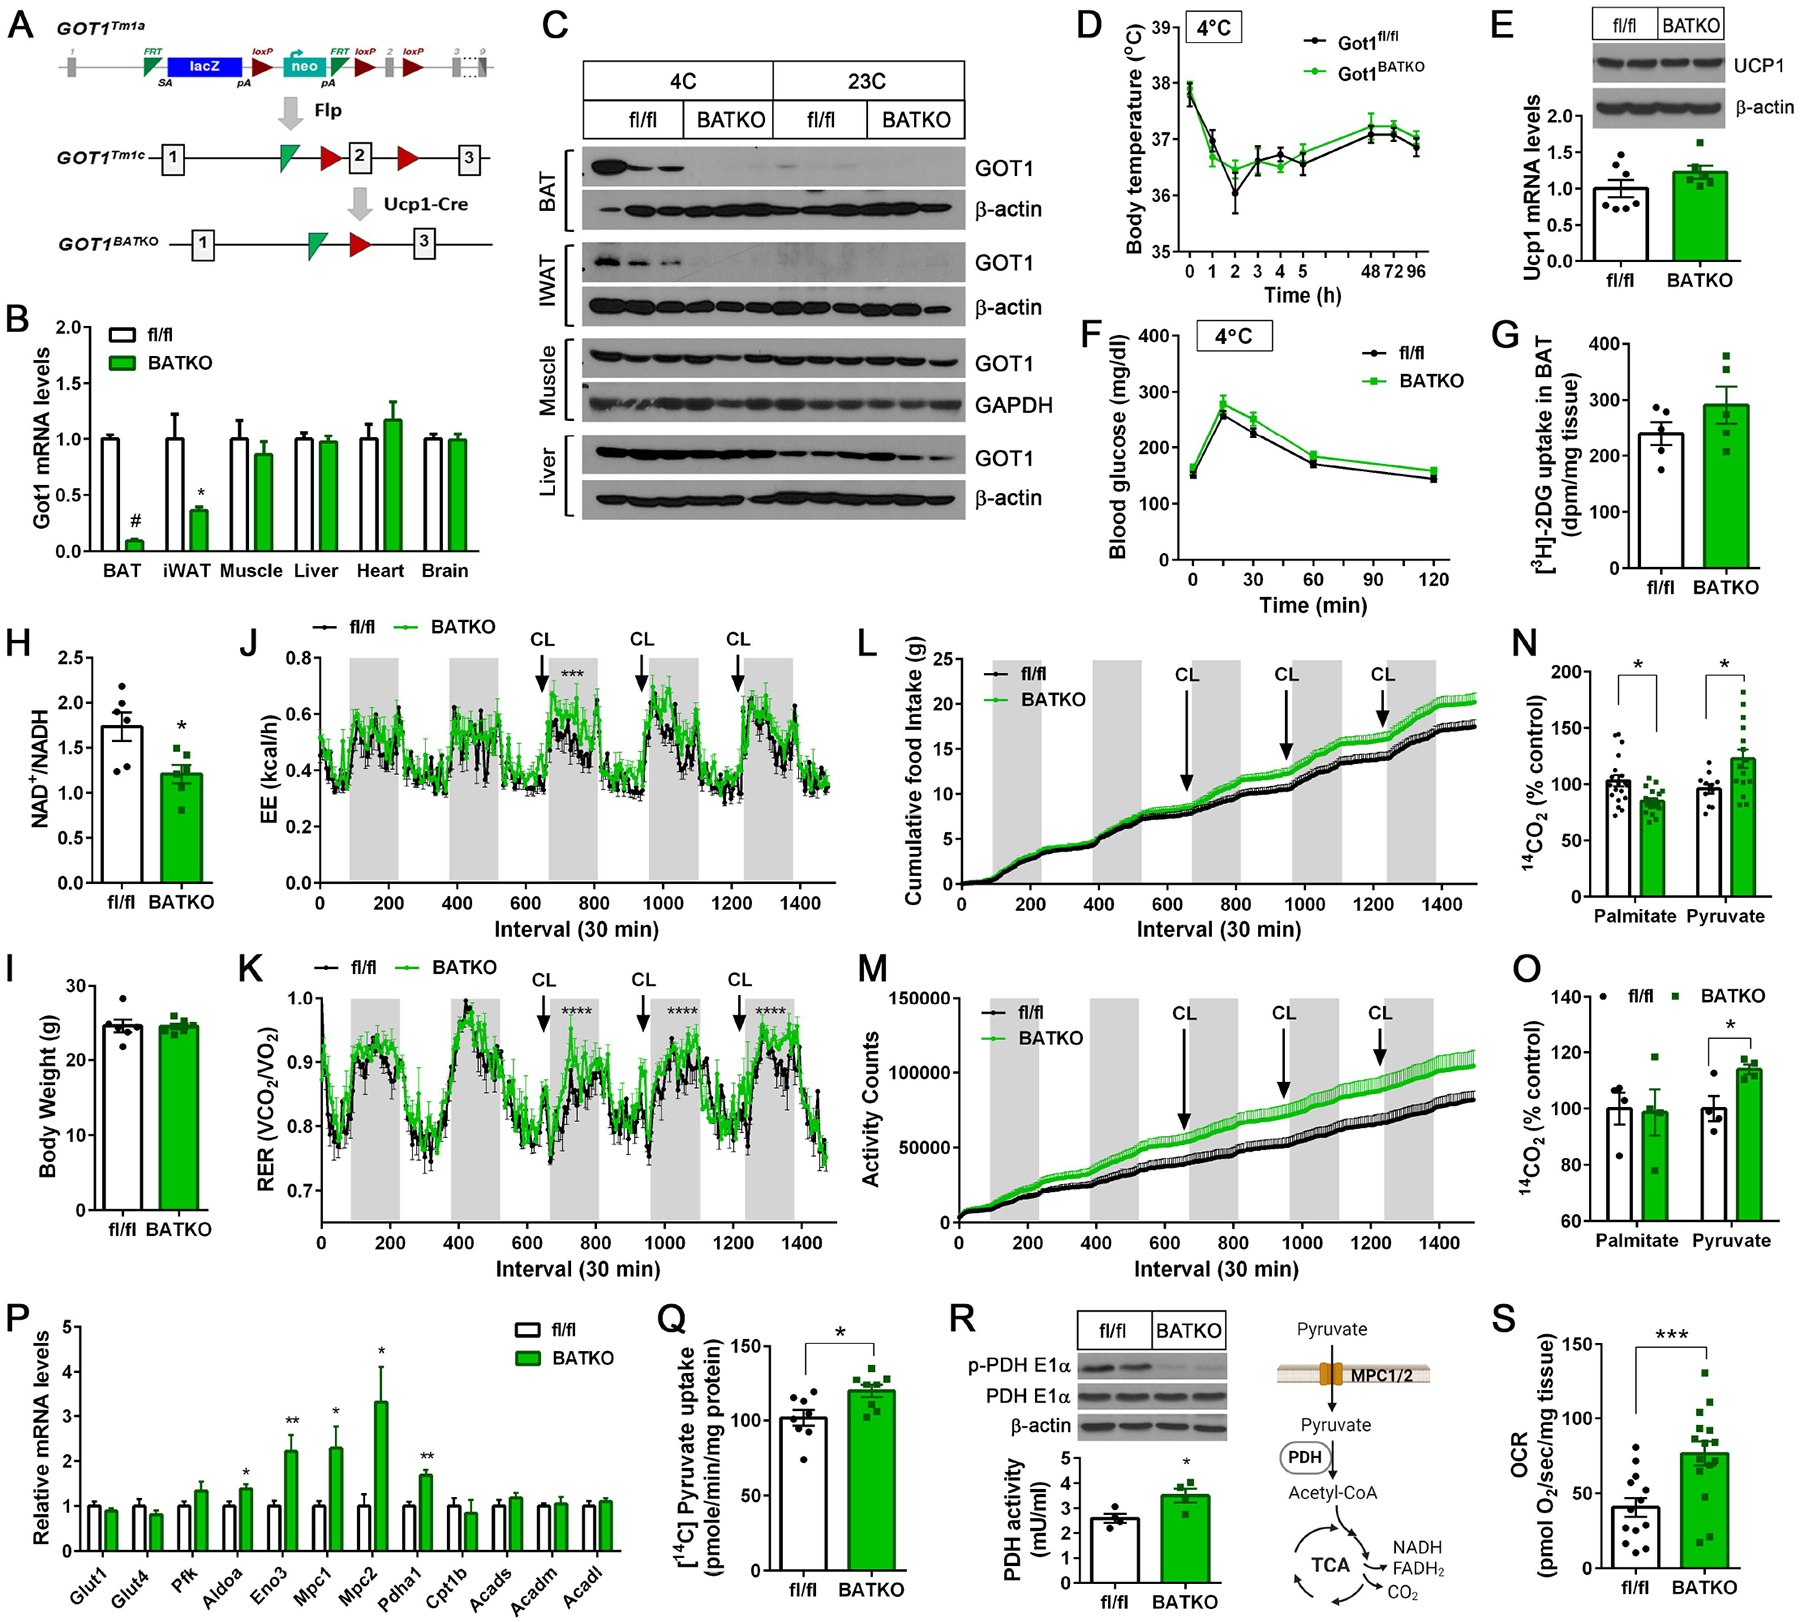
(A) Generation of BAT-specific Got1 knockout mice. Exon 2 of the mouse GOT1 gene was targeted for deletion by the LoxP/Cre system. (B) qPCR analysis for detection of Got1 transcripts in Got1fl/fl and Got1BATKO male mice exposed to 4°C for 7 days (n=6–7/group). (C) WB analysis for GOT1 in mice housed at 23°C or exposed to 4°C for 7 days. (D) Body temperature of Got1fl/fl and Got1BATKO female mice during cold exposure (n=7–8/group). (E) WB and qPCR of UCP1 in BAT from the same mice described in D. (F) Glucose tolerance test of cold exposed-Got1fl/fl and Got1BATKO female mice (n=7–10/group). (G) Measurement of [3H]-2DG uptake by cold-activated BAT. (H) The NAD+/NADH ratio in BAT homogenates. (I-M) Measurement of body weight, energy expenditure, RER, food intake, and locomotor activity in Got1fl/fl and Got1BATKO male mice (n=6/group). (N) Oxidation of 14C-labeled palmitate or pyruvate in BAT homogenates. BAT was extracted from mice exposed to 4°C for 7 days. (O) Oxidation of 14C-labeled palmitate or pyruvate in primary brown adipocytes freshly isolated from female mice exposed to 4°C for 7 days. (P) qPCR analysis of genes involved in glucose uptake, glycolysis, and FA oxidation in cold-activated BAT (n=6/group). (Q) Uptake of 14C-labeled pyruvate by the mitochondria isolated from cold-activated BAT. (R) Reduced phosphorylation of the PDH E1α subunit at Ser232 with a concurrent increase in PDH activity in Got1-deficient BAT. (S) Measurement of pyruvate-dependent mitochondrial respiration in BAT explants freshly extracted from mice exposed to 4°C for 7 days. All data are presented as the Mean ± SEM. *p<0.05, **p<0.01, ***p<0.001, ****p<0.0001, #p<0.0001.
We predicted that Got1BATKO mice would be less cold-tolerant than control mice due to the impaired coordination of cold-stimulated FAO, glucose uptake, and glycolysis via MAS. However, contrary to our prediction, Got1BATKO mice maintained their body temperature during cold exposure (Fig. 6D) along with normal levels of Ucp1 mRNA and protein in BAT (Fig. 6E). In addition, Got1BATKO mice exhibited relatively normal glucose tolerance during GTT in the cold (Fig. 6F) with no significant difference in [3H]-2-DG uptake by BAT (Fig. 6G).
Indirect calorimetry further revealed that whole body energy expenditure (EE) was similar in Got1fl/fl and Got1BATKO mice at baseline, but upon BAT activation by a β3AR agonist CL316243, EE was slightly higher in Got1BATKO mice compared to littermate controls (Fig. 6J). Intriguingly, we noticed that Got1BATKO mice had a greater reliance on glucose as a fuel source for CL316243-induced BAT thermogenesis as evidenced by higher RER (Fig. 6K). The higher RER was also coupled with an increase in food intake specifically during CL316243-induced BAT activation (Fig. 6L). Got1BATKO mice showed increased locomotor activity regardless of β3-adrenergic stimulation while its impact on EE seems minimal (Fig. 6M).
Consistent with higher RER, GOT1-deficient BAT extracted from cold-exposed Got1BATKO mice had reduced capacity to oxidize FA in the mitochondria (Fig 6N). However, the oxidation of glucose (i.e. pyruvate) through the TCA cycle was significantly increased in Got1KO BAT (Fig. 6N). Likewise, primary brown adipocytes freshly isolated from cold-exposed Got1BATKO mice exhibited the increased oxidation of pyruvate although they showed a comparable level of palmitate oxidation (Fig. 6O). The increase in pyruvate oxidation coincided with upregulation of key genes encoding glycolytic enzymes (ALDOA, ENO), mitochondrial pyruvate carriers (MPC1/2), and pyruvate dehydrogenase (PDH) catalyzing the conversion of pyruvate to acetyl-CoA73,74 (Fig. 6P). Moreover, the sequential pyruvate reactions, such as pyruvate import into the mitochondria (Fig. 6Q), PDH enzyme activation by the reduced inhibitory phosphorylation (Fig. 6R), and pyruvate-driven mitochondrial respiration (Fig. 6S), were all significantly accelerated in cold-activated Got1KO BAT. Likewise, Got1-deficient IWAT showed the increased expression of Glut1, Glut4, Aldoa, Eno3, and Mpc1 genes compared to controls (Fig. S2G), suggesting that Got1-deficient beige adipocytes in cold-activated IWAT may undergo similar metabolic shifts in the absence of MAS activity. Together, these results establish that MAS activation by GOT1 is essential for sustaining mitochondrial FA oxidation in BAT during cold exposure and further suggest that impaired MAS activity rewires BAT mitochondria to import and oxidize more pyruvate to meet the energy demands for thermogenesis.
Loss of MAS activity rewires mitochondrial fuel utilization toward glucose oxidation during βAR stimulation of brown adipocytes
To further attest the impacts of impaired MAS activity on mitochondrial fuel selection in brown adipocytes, we isolated stromal vascular fraction (SVF) from BAT of Got1fl/fl mice, induced Got1 deletion by retrovirus expressing Cre recombinase48, and differentiated them into brown adipocytes followed by treatment with isoproterenol (ISO) for 4h. Got1 deletion, confirmed by the loss of GOT1 expression and activity (Fig. 7A), did not alter brown adipogenesis as shown by no difference in adipogenic gene expression (Fig. 7B). First, we examined the effect of Got1 deletion on MAS activity by utilizing an NADH biosensor Peredox and a [4-2H]-glucose tracer. As expected, Got1KO brown adipocytes expressing Peredox-mCherry exhibited an increased green to red fluorescence ratio compared to Got1fl/fl cells (Fig. 7C, vehicle), reflecting accumulation of NADH in the cytosol. Subsequent inhibition of ISO-induced GOT1 by AOA in Got1fl/fl brown adipocytes led to a rise in the green to red fluorescence ratio (Fig. 7C, AOA), but this effect was lost in Got1KO cells. The [4-2H]-glucose tracing (Fig. 7E) further confirmed the impaired MAS flux in Got1KO brown adipocytes stimulated with ISO. The production of deuterium-labeled malate (Fig. 7E) and its fractional enrichment (Supplementary Fig. 3A) were significantly diminished in Got1KO cells, indicating that hampered metabolic flux through GOT1 significantly impairs subsequent metabolic flux through MDH1 in the MAS pathway.
Figure 7. The loss of MAS activity by Got1 deletion diminishes mitochondrial FA oxidation during βAR stimulation, resulting in a compensatory increase in glucose oxidation.

(A) Validation of loss of GOT1 expression and its enzymatic activity in the cytosolic fraction in Got1-deficient brown adipocytes treated with 5μM isoproterenol (ISO) for 4h. (B) qPCR analysis of brown adipocytes treated with ISO for 4h. (C) Measurement of the cytosolic NADH-NAD+ redox state by Peredox-mCherry as described in the figure legend 4E. (D) Schematic of [4-2H] glucose tracing. (E) [2H]-labeled malate, G3P, and lactate after introducing [4-2H] glucose to brown adipocytes treated with ISO for 4h. (F) [3H]-2DG uptake by brown adipocytes treated with ISO for 4h. (G, H) Oxidation of 14C-labeled palmitate or pyruvate in brown adipocytes treated with vehicle or ISO for 4h and 48h. (I, J) Mitochondrial respiration in brown adipocytes treated with ISO for 4h or 48h. (K) qPCR analysis of brown adipocytes treated with ISO for 48h. (L) WB analysis of brown adipocytes treated with ISO for 48h. (M) [3H]-2DG uptake by brown adipocytes treated with vehicle or ISO for 48h. (N) Extracellular acidification rates (ECAR) in brown adipocytes treated with ISO for 48h (n=5/group). (O) A schematic diagram describing the role of GOT1 in cold-activated brown adipocytes. Cold-inducible GOT1 acts as a critical node that links cold-stimulated βAR signaling to the malate-aspartate shuttle (MAS). GOT1-dependent MAS activation facilitates the transport of reducing equivalents produced in glycolysis from the cytosol to mitochondria. This process is essential for the efficient oxidation of fatty acids (FA) to support thermogenesis under cold stress. Got1-deficient brown adipocytes rewire mitochondrial fuel preference toward glucose by increasing mitochondrial pyruvate import and PDH-mediated conversion of pyruvate to acetyl-CoA. All data are presented as the Mean ± SEM. *p<0.05, **p<0.01, ***p<0.001, ****p<0.0001, #p<0.0001.
Interestingly, we noticed a reduced production of deuterium-labeled lactate, but not G3P, in Got1KO brown adipocytes (Fig. 7E). Got1KO brown adipocytes also took up less [3H]-2DG than Got1fl/fl cells (Fig. 7F), suggesting that impaired regeneration of cytosolic NAD+ from NADH by MAS reduces glycolytic flux and glucose uptake in Got1KO brown adipocytes. In addition, loss of MAS activity in Got1KO brown adipocytes resulted in an inability of mitochondria to enhance FA oxidation during βAR stimulation (Fig. 7G, ISO 4h). However, unlike the observed increase in glucose oxidation in Got1BATKO mice, mitochondrial pyruvate oxidation was not upregulated in Got1KO brown adipocytes treated with ISO for 4h (Fig. 7H, ISO 4h). The resulting decrease in overall fuel supply to the ETC led to decreased mitochondrial respiration (Fig. 7I). These results clearly show that MAS plays a critical role in coordinating βAR-stimulated glucose uptake, glycolysis, and FAO in brown adipocytes. Next, we sought to test if increased pyruvate oxidation observed in Got1KO BAT occurs as a compensatory mechanism during prolonged βAR stimulation. To do this, we treated Got1fl/fl and Got1KO brown adipocytes with ISO for 48h. Indeed, pyruvate oxidation was significantly increased in Got1KO brown adipocytes (Fig. 7H, ISO 48h) while FAO remained decreased (Fig. 7G, ISO 48h). Moreover, the increased utilization of pyruvate as fuel for the ETC effectively restored mitochondrial respiration, enhancing both total and uncoupled respiration in Got1KO brown adipocytes treated with ISO for 48h (Fig. 7J). These results thus indicate that Got1KO brown adipocytes compensate for reduced FAO by rewiring mitochondrial fuel utilization toward pyruvate oxidation during prolonged βAR stimulation. This metabolic shift was also associated with upregulation of Mpc1 and Mpc2 gene expression (Fig. 7K) and reduction of inhibitory phosphorylation of PDH (Fig. 7L), as seen in BAT of cold-exposed Got1BATKO mice. In line with increased glucose utilization for mitochondrial respiration, glucose uptake was restored to normal levels in Got1KO brown adipocytes treated with ISO for 48h (Fig. 7M), with glycolysis being relatively comparable (Fig. 7N). Under βAR stimulation that activates AMPK61,62, AMPKα phosphorylation at Thr172 was not different between Got1fl/fl and Got1KO brown adipocytes (Fig. 7L), indicating that AMPK has no effect on these changes. ECAR (Fig. 7N) suggests that LDH helps NAD+ regeneration for glycolysis in the absence of MAS. Taken together, the compensatory mechanisms occurring both in the cytosol and mitochondria during prolonged βAR stimulation likely explain the cold tolerance and glucose tolerance phenotypes of Got1BATKO mice exposed to cold (Fig. 6D and 6F).
Discussion
During cold adaptation, BAT simultaneously metabolizes both fatty acids (FA) and glucose but distinctly utilizes them; FA is primarily used as a fuel source for thermogenesis, whereas glucose-derived carbons are mostly released as lactate or channeled into various biosynthetic pathways. In the present study, we show that the malate-aspartate shuttle (MAS) is essential for sustaining mitochondrial FA utilization in BAT under cold conditions. Intriguingly, MAS activity in BAT is tightly regulated by environmental temperatures through drastic changes in GOT1 protein levels. At room temperature, GOT1 is present at barely detectable levels in BAT, but its expression is induced by cold via the βAR-cAMP-PKA-PGC-1α/NT-PGC-1α axis. This regulatory mechanism of GOT1 is unique in BAT as GOT1 is abundantly expressed in many other tissues. Using BAT-specific Got1 knock-in and Got1 knockout mice and their respective brown adipocytes, we have clearly demonstrated that cold-inducible GOT1 serves as a molecular switch turning on the MAS, enabling BAT to increase FA oxidation rates to fuel thermogenesis under cold conditions (Fig. 7O).
How does MAS enhance mitochondrial FA oxidation in BAT? MAS oxidizes glycolysis-derived NADH to NAD+ in the cytosol, maintaining the high cytosolic NAD+/NADH ratio required for continued glycolysis. We found that GOT1 overexpression in brown adipocytes increases the expression of genes linked to FA uptake (Cd36), mitochondrial transport (Cpt1b), and FA β-oxidation (Acads, Acadm, Acadl). When the cytosolic NAD+/NADH ratio is high, NAD+-dependent SIRT1 deacetylase has been shown to promote transcription of FAO-related genes, including Cpt1b, Acadm, and Acadl, by facilitating the interaction of PGC-1α with PPARα75–77. Thus, our findings suggest that the high cytosolic NAD+/NADH ratio maintained by the MAS could contribute to enhanced expression of FAO-related genes in BAT under cold conditions. A recent glucose tracing study23 showed that cold-activated BAT increases the flux of pyruvate to oxaloacetate (OAA) via pyruvate carboxylase (PC) over acetyl-CoA via PDH, indicating that glucose supplies OAA necessary for the efficient oxidation of FA-derived acetyl-CoA through the TCA cycle. Supporting these findings, acetyl-CoA has been shown to activate PC but inhibits PDH78. It should also be noted that MAS is interconnected with the TCA cycle through MDH2 and shared intermediates (e.g., malate and OAA). Thus, by shuttling reducing equivalents and supporting anaplerotic reactions, MAS may enable BAT mitochondria to efficiently handle the high flux of acetyl-CoA from FA β-oxidation without depleting TCA intermediates. Alternatively, considering the MAS’s role in exporting mitochondrial OAA to the cytosol in the form of aspartate, MAS may support the enhanced flux of PC over PDH in cold-activated BAT by clearing excess OAA derived from pyruvate out of the mitochondria. Although the precise mechanism remains to be clarified, our data show that impaired MAS activity by GOT1 deficiency reduces the ability of BAT mitochondria to efficiently oxidize FA under cold stress, leading to a compensatory increase in mitochondrial pyruvate import, its conversion to acetyl-CoA via PDH, and subsequent oxidation through the TCA cycle.
It has been recently proposed that there are two distinct populations of mitochondria in BAT: cytosolic mitochondria (CM) and peridroplet mitochondria (PDM) that is anchored to lipid droplets79,80. While CM preferentially oxidizes fatty acids, PDM has a higher capacity for pyruvate oxidation, contributing to the replenishment of glucose-derived triacylglycerol in lipid droplets. We thus assessed whether the increase in pyruvate oxidation in Got1-deficient BAT is linked to a higher number of pyruvate-oxidizing PDM compared to CM. Our transmission electron microscopy (TEM) analysis revealed that small and rounded CM was enriched in both BAT of cold-exposed Got1fl/fl and Got1BATKO mice (Fig. S2D), consistent with previous findings79,80. The overall mitochondrial shapes and the number of mitochondria in the cytosol and in contact with lipid droplets were also relatively similar in both groups of mice (Fig. S2D, 2E), indicating that the observed shift in fuel preference toward pyruvate in the absence of GOT1 is not due to the increase in PDM over PC.
R26-Got1BATOE/+ mice exhibited improved glucose tolerance along with a higher glucose uptake by BAT. Consistently, GOT1 overexpression in brown adipocytes enhanced glucose uptake and glycolysis in the cytosol, whereas GOT1 deficiency led to a significant decrease in these processes under β-AR stimulation. Interestingly, reduced glucose uptake and glycolysis in Got1-deficient brown adipocytes were restored during prolonged β-AR stimulation, coinciding with increased utilization of glucose as fuel for thermogenesis. These findings imply that other cytosolic NADH-oxidizing pathways, such as lactate dehydrogenase (LDH), a glycerol-3-phosphate (G3P) shuttle composed of cytosolic and mitochondrial G3P dehydrogenases81, and a recently identified AIFM2 NADH oxidase82, could compensate for the loss of MAS in the cytosol by replenishing cytosolic NAD+ from NADH produced during glycolysis. However, these pathways that oxidize glycolysis-derived NADH in the cytosol employ various mechanisms to transfer electrons originating from NADH. The LDH transfers electrons to lactate being released to the bloodstream. Both the G3P shuttle and AIFM2 transfer electrons directly to the ubiquinone (Q) molecule within the ETC81,82. Unlike these pathways, MAS uniquely transports electrons across the IMM by leveraging a series of coordinated reactions and metabolite exchanges between the cytosol and mitochondria. Our findings suggest that this distinct mechanism of MAS is essential for sustaining FA oxidation in BAT mitochondria during increased thermogenic demand.
In summary, the present study identifies brown adipocyte GOT1 as a critical node that links cold-stimulated β-adrenergic signaling to the MAS, leading to efficient FA oxidation to produce energy for thermogenesis. This discovery expands our understanding of MAS beyond redox balance and electron transfer, positioning it as a critical regulator of mitochondrial fuel selection in BAT.
Limitations of the study
Although the present study has shown that GOT1-dependent MAS activation is crucial for sustaining mitochondrial FA oxidation in BAT, we cannot exclude the possibility that the non-MAS function of GOT1 indirectly contributes to enhanced FA oxidation in BAT. Given GOT1’s role in converting aspartate to OAA, GOT1 may supply OAA to PEPCK-C in glyceroneogenesis83, a metabolic pathway creating G3P from non-glucose precursors for replenishment of intracellular TAG, although quantitative significance of glyceroneogenesis in cold-activated BAT is not clear. The widely used Ucp1-Cre line43 was recently shown to have leaky Cre expression in various non-adipose tissues84. To mitigate the potential confounding effects on metabolic readouts, we utilized a β3-AR agonist CL316243 that selectively activates BAT, in conjunction with parallel ex vivo studies using BAT explants or primary brown adipocytes. We should clarify that some animal experiments (e.g. indirect calorimetry) with R26-Got1BATOE/+ and Got1BATKO mice were conducted using different sexes, without carefully considering sex consistency for similar experiments. We will ensure to consider this in our future studies. Finally, it remains to be determined whether MAS plays a similar role in beige adipocytes where GOT1 is also highly expressed by cold34. Crossing our mouse lines with Ucp1-eGFP mice34 followed by FACS-mediated isolation of eGFP-positive beige adipocytes will be needed for functional characterization of Got1-OE or Got1-KO beige adipocytes without contamination from white adipocytes.
Resource availability
Lead contact
Requests for further information and resources should be directed to and will be fulfilled by the lead contact, Ji Suk Chang (jisuk.chang@pbrc.edu).
Materials availability
All unique/stable reagents generated in this study are available from the lead contact with a completed Materials Transfer Agreement.
Data and code availability
All data generated or analyzed during this study are included in the published article and supplemental information.
This study does not report original code.
Any additional information required to reanalyze the data reported in this study is available from the lead contact upon request.
STAR★Methods
Experimental model and study participant details
Mice
Gene targeting and Got1 knock-in mouse production were performed by the Transgenics Core at Pennington Biomedical Research Center. DNA derived from a C57BL6 genomic BAC library clone (RP24–399J12) was used to generate a targeting vector containing the CAG-loxP-neo-3xpA(stop)-loxP-Got1. Targeted albino B6 embryonic stem cells carrying the transgene at the Rosa26 locus were injected into C57BL6 blastocytes, and chimeric mice were mated to C57BL6 mice to obtain heterozygous offspring containing a germline transgene allele. Heterozygous R26-Got1fl/+ mice were then mated to obtain homozygous R26-Got1fl/fl mice. To generate brown adipose tissue (BAT)-specific Got1 knock-in mice, R26-Got1fl/fl mice were mated to Ucp1-Cre transgenic mice43 (Jackson Laboratory, #024670) that express Cre recombinase under the control of UCP1 promoter, which is activated in brown adipocytes. While the polyadenylation sequence terminates transcription initiated by the CAG promoter, LoxP/Cre-mediated excision of the stop cassette enables targeted expression of Got1 in BAT in R26-Got1fl/+:Ucp1-Cre/+ mice. For generation of BAT-specific Got1 knockout mice, C57BL/6N-Got1tm1a(EUCOMM)Hmgu/H mice (EMMA, #10399) containing an FRT-flanked lacZ/neomycin cassette followed by a loxP site upstream of Got1 exon 2 were first mated to FLP mice to remove the lacZ and neo cassettes. The resulting Got1fl/fl mice were mated to Ucp1-Cre transgenic mice to generate Got1fl/+:Ucp1-Cre/+ mice, which were then mated with Got1fl/fl mice to generate homozygous Got1fl/fl:Ucp1-Cre/+ mice. Mice were housed at room temperature of 23°C under a 12-h light/12-h dark cycle with ad libitum feeding (standard chow 5001, LabDiet, St. Louis, MO). Animal studies were carried out in accordance with the institutional guidelines and were approved by the Institutional Animal Care and Use Committee of the Pennington Biomedical Research Center. 10-to-19-week-old male and female mice were used for animal experiments.
Brown adipocytes
Primary mature brown adipocytes were freshly isolated from interscapular BAT of 8–10 weeks old R26-Got1BATOE, Got1BATKO mice, or their littermate controls as described previously85. Briefly, BATs from 3 mice were minced into small pieces and digested in collagenase-dispase medium for 20 min at 37°C with shaking. The cell suspension was filtered through a 200 μm nylon filter to remove undigested tissues followed by centrifugation and washing. The floating brown adipocytes were immediately used for functional assays. In addition, stromal vascular fraction (SVF) containing brown preadipocytes was isolated from interscapular BAT of newborn R26-Got1fl/fl or Got1fl/fl pups by collagenase digestion and immortalized by infection with SV40T antigen-expressing retrovirus as previously described35. LoxP/Cre-mediated overexpression or deletion of Got1 was then induced by retrovirus expressing Cre recombinase (AddGene)48. The resulting Got1-overexpressing or -deficient brown preadipocytes were grown to confluence in culture medium supplemented with 20 nM insulin and 1 nM T3 (differentiation medium) and induced for differentiation by incubating in differentiation medium supplemented with 0.5 mM isobutylmethylxanthine (IBMX), 0.5 μM dexamethasone, and 0.125 mM indomethacin for 48 hours, as previously described86. Thereafter, the cells were maintained in differentiation medium until day 7. Fully differentiated brown adipocytes were treated with or without 5 μM of a β-adrenergic receptor agonist isoproterenol to stimulate β-AR signaling.
Method details
Cold tolerance tests
Mice were singly housed and exposed to 5°C for 6h or for 7 to 10 days. Core body temperature was measured at baseline and during cold exposure using a rectal probe RET-3 (a thin stainless-steel shaft 19 mm long with a smooth ball tip of 1.7 mm diameter).
Indirect calorimetry
For metabolic phenotyping, mice were placed in indirect calorimetry chambers (Sable Systems International, North Las Vegas, NV) and monitored for energy expenditure (kcal/h), VO2 and VCO2 at 28°C prior to and after intraperitoneal injections of a β3-adrenergic receptor agonist, CL316243 (1 mg/kg body weight, daily). Food intake and locomotor activity were also measured while the mice were in the chambers.
Glucose tolerance tests
Mice housed at room temperature were fasted for 16 h and injected intraperitoneally with a glucose bolus (2 g/kg body weight). Mice exposed to 5°C were fasted for 5 h and injected with a glucose bolus (2 g/kg body weight). Blood glucose levels were measured using a Contour Next EZ glucometer (Bayer, Leverkusen, Germany).
ChIP assay
Chromatin immunoprecipitation was performed as described previously33,36. Briefly, BAT explants were chopped into small pieces and fixed with paraformaldehyde. After incubation for 10 min, 2.5M glycine was added to a final concentration of 0.125 M and the material was pelleted by centrifugation at 8,000 rpm and resuspended in ChIP lysis buffer (10 mM Tris-HCl, pH 8.0, 10 mM NaCl, 3 mM MgCl2, 0.5% (vol/vol) NP-40, protease inhibitors). The homogenates were centrifuged at 1,200 × g and the nuclear pellets were sonicated using a Bioruptor in ChIP shearing buffer (0.25% SDS, 10 mM Tris-HCl, pH 8.0, 1 mM EDTA, protease inhibitors). Immunoprecipitation was conducted with rabbit polyclonal PGC-1α antibody35,41 directed against the N-terminus of PGC-1α. DNA-protein complexes were eluted from protein A beads with elution buffer (100 mM NaHCO3, 1% SDS) and reverse crosslinked by adding NaCl to a final concentration of 0.2 M and incubating at 65°C. PCR was performed to determine the recruitment of PGC-1α/NT-PGC-1α to the GOT1 promoter region using the following primers: for ERRE1 site, forward 5′-CTAATCCCCACAACAACCTG, reverse 5′-CTGTCCAGATCCTTTCTCCA, for ERRE2 site, forward 5′-CAAGGTCCTTTAGGGCTAGG, reverse 5′-TGGCACAGGACTCTAGTGGT.
Measurement of cytosolic NAD+/NADH ratios
Cytosolic NAD+/NADH ratio was measured using a genetically encoded fluorescent NADH biosensor Peredox-mCherry (Addgene, #32383)50. Brown adipocytes were incubated in phenol red-free DMEM containing 0.5 mM glucose and 1% fatty acid-free BSA and imaged by a Lionheart FX Automated Microscope (BioTek) with a 10× objective in an environmentally controlled chamber at 37 °C and 5% CO2. Green and red fluorescence images were acquired at 400 nm excitation/525 nm emission and 586 nm excitation/647 nm emission every 30 s for 15 min, during which time 2 mM aminooxyacetate (AOA) and then 0.4 mM Iodoacetate/20 mM pyruvate were added to inhibit GOT activity and glycolysis, respectively. Using ImageJ software, images were background corrected, and a pixel-by-pixel green-to-red ratio image was generated for each time point as described previously50. Total intracellular NAD+/NADH ratio was measured in BAT tissue homogenates using an EnzyChrom NAD+/NADH assay kit (BioAssay Systems).
Mitochondrial respiration assay
Oxygen consumption rates (OCR) of brown adipocytes and BAT explants were measured as described previously41. Briefly, brown adipocytes (106 cells) or fresh BAT explants (5 mg) were placed in a magnetically stirred respirometric chamber of the OROBOROS Oxygraph-2k (Oroboros Instruments, Innsbruck, Austria) containing the culture medium or respiration buffer41. For brown adipocytes, OCR measurements were obtained at baseline and after injection of oligomycin and antimycin A. For BAT explants, OCR was measured in the presence of malate/pyruvate, followed by injection of antimycin A. The value of basal and leak mitochondrial respiration was determined by subtracting antimycin A-independent non-mitochondrial respiration as described in the Oroboros Operator’s Manual.
Stable isotope labeling and LC-MS analysis
A [4-2H]-glucose tracer was utilized to label glycolysis-derived NADH with deuterium and trace the flow of NAD2H to metabolites generated by NADH-dependent dehydrogenase activity as previously described54–56. For isotopic labeling, brown adipocytes were cultured in 6-well plate in phenol red-, glucose-, pyruvate-, and glutamine-free DMEM supplemented with 25 mM [4-2H]-glucose, 2 mM L-glutamine, and 10% dialyzed FBS. At 2.5-, 5-, and 10-min time points, cells were washed three times in 0.9% saline and immediately quenched in 1 ml of pre-cooled 80% methanol containing 1 μM of 15N-valine as an internal control. After freezing at −80°C for 15 min, cells were scrapped and cleared by centrifugation at 4°C. To measure soluble metabolites in cell extracts, 15 μl supernatant was injected into LC-MS. A quadrupole orbitrap mass spectrometer (Q Exactive; ThermoFisher Scientific) operating in negative or positive ion mode was coupled to a Vanquish UHPLC system (ThermoFisher Scientific) with electrospray ionization and used to scan from m/z 80 to 680 at 2 Hz, with a 140,000 resolution. LC separation was achieved on an XBridge BEH Amide column (2.1 × 150 mm2, 2.5μm particle size, 130 Å pore size; Waters Corporation) using a gradient of solvent A (95:5 water: acetonitrile with 20 mM of ammonium acetate and 20 mM of ammonium hydroxide, pH 9.45) and solvent B (acetonitrile). Flow rate was 150μl/min. The LC gradient was: 0 min, 85% B; 2 min, 85% B; 3 min, 80% B; 5 min, 80% B; 6 min, 75% B; 7 min, 75% B; 8 min, 70% B; 9 min, 70% B; 10 min, 50% B; 12 min, 50% B; 13 min, 25% B; 16 min, 25% B; 18 min, 0% B; 23 min, 0% B; 24 min, 85% B; and 30 min, 85% B. The autosampler temperature was 5°C. LC-MS data was converted from .raw files to .mzXML and then loaded into EI-MAVEN open source software87 (Version 0.12.0, Elucidata). Using our annotated MS library, containing retention times and accurate m/z values, we selected metabolite peaks of interest on EI-MAVEN. Peak shape and quality were evaluated and Area Top of the metabolites of interest were recorded. Natural isotope correction was performed with AccuCor2 R code (https://github.com/wangyujue23/AccuCor2) and IsoCorrectoR88. Microsoft Excel and R were used for data analysis.
14C-palmitate and 14C-pyruvate oxidation assay
Palmitate oxidation was measured as previously described41,89. In brief, BAT tissue homogenates freshly prepared in SET buffer containing 250 mM sucrose, 1 mM EDTA, and 10 mM Tris-HCl (pH 7.4) or freshly isolated/cultured brown adipocytes were incubated in the reaction mixture89 containing [1-14C]-palmitate (0.5 μCi/ml), 200 μM palmitic acid coupled to BSA, and 1 mM carnitine for 30 min at 37 °C. At the end of incubation, 70% perchloric acid was added to stop the reaction. 14CO2 produced during the incubation was trapped in 1M NaOH and the acidified portion of the incubation mixture was collected for liquid scintillation counting in a Perkin Elmer Tri-Carb 2910TR liquid scintillation analyzer. Pyruvate oxidation was determined as above by incubating BAT tissue homogenates or freshly isolated/cultured brown adipocytes in the reaction mixture89 containing [2-14C]-pyruvate (0.5 μCi/ml), 1 mM pyruvate, and 1 mM thiamine pyrophosphate. Total palmitate/pyruvate oxidation was normalized to protein content in each sample.
Mitochondrial pyruvate uptake assay
Mitochondrial pyruvate uptake assay was performed as previously described90. Briefly, freshly isolated BAT mitochondria were resuspended to 15.0 mg/ml in Uptake buffer (120 mM KCl, 5 mM HEPES, pH 7.4, 1 mM EGTA, 2 μM rotenone, and 2 μM antimycin A). The mitochondria were split into two equal volumes and treated for 5 min on ice with or without 2 mM α-Cyano-4-hydroxycinnamic acid (CHC) to inhibit mitochondrial pyruvate carrier (MPC). To start the pyruvate uptake assay, 35 μl of CHC-treated or untreated mitochondria were mixed with an equal volume of 2× Pyruvate buffer (120 mM KCl, 5 mM HEPES, pH 6.1, 1 mM EGTA, 2 μM rotenone, and 2 μM antimycin A, and 100 μM [2-14C]-pyruvate). After 30 seconds, the uptake was stopped by adding 175 μl of Stop buffer (108 mM KCl, 4.5 mM HEPES, pH 6.8, 0.9 mM EGTA, 1.8 μM rotenone, 1.8 μM antimycin A, and 4 mM CHC). After stopping the reaction, the mitochondria were separated from the reaction mixture by centrifugation at 10,000× g, washed twice, and collected for liquid scintillation counting. Counts from CHC-treated mitochondria (negative control) were subtracted from untreated mitochondria.
Glucose uptake assay
Brown adipocytes were pre-incubated in serum-free DMEM supplemented with 1% fatty acid-free BSA. After rinsing with PBS, the cells were incubated for 10 min in glucose-free DMEM supplemented with 1 μCi of D-[3H]-2-deoxyglucose (2-DG), 0.2 mM of 2DG, and 1% fatty acid-free BSA, in the presence and absence of 20 μM cytochalasin B. Following incubation, 0.2 mM cytochalasin B was added to terminate glucose transport. The cells were then washed three times with ice-cold PBS and collected for liquid scintillation counting. Counts from cytochalasin B-pretreated cells (negative control) were subtracted from untreated cells. The ex vivo glucose uptake assay was performed as above with a slight modification. For glucose transport, freshly isolated BAT explants (approximately 30 mg) were incubated for 20 min in Krebs-Ringer bicarbonate buffer (KRBB) supplemented with 1 μCi of [3H]-2-DG and 0.2 mM of 2DG, in the presence and absence of cytochalasin B. The [3H]-2-DG uptake was calculated from the difference between the two samples and normalized to tissue weight. In vivo glucose uptake was measured as previously described91,92. Briefly, mice were fasted for 5h and then injected with CL316243 (1 mg/kg BW) 15 min before injection with a mixed solution of [3H]-2-DG (0.5 μCi/g BW) and glucose (1 g/kg BW). After 60 min of injection, various tissues were extracted, homogenized in 0.1M NaOH, and neutralized with 0.1M HCl. One aliquot was counted to determine [3H]-2-DG and [3H]-2-DG-6P radioactivity. A second aliquot was treated with Ba(OH)2 and ZnSO4 to remove [3H]-2-DG-6P and then counted to determine [3H]-2-DG radioactivity. The accumulation of [3H]-2-DG-6P was calculated from the difference between the two aliquots and normalized to tissue weight.
Measurement of extracellular acidification rate (ECAR)
To monitor rates of glycolysis, extracellular acidification caused by lactate produced during glycolysis was measured as previously described93. Briefly, brown adipocytes were plated in Seahorse XF 24-well plates and equilibrated in serum-free Seahorse XF media at 37°C for 45 min. ECAR was measured at baseline and after sequential addition of 10 mM glucose, 10 μM oligomycin, and 50 mM 2-DG in accordance with manufacturer’s instructions.
Enzyme activity assay
Enzyme activity of glutamic-oxaloacetic transaminase (GOT) and pyruvate dehydrogenase (PDH) was measured in BAT tissue homogenates by the GOT and PDH Activity Assay kits (Sigma).
Measurement of the ADP/ATP ratios
The cellular ADP/ATP ratios were measured by the ADP/ATP Ratio Assay kit (Sigma).
Western blot analysis
Whole cell extracts were prepared from tissues or brown adipocytes by homogenization in lysis buffer86 in the presence of a protease and phosphatase inhibitor cocktail (Roche). Lysates were separated by SDS-PAGE, transferred to nitrocellulose membrane, and analyzed by immunoblotting with following antibodies: GOT1 antibody (Pro Sci, #30–379), GOT2 antibody (Invitrogen, #PA5–27572), MDH1 antibody (Santa Cruz, #sc-166879), MDH2 antibody (Invitrogen, #PA5–21700), UCP1 antibody94, GAPDH antibody (Abcam, #ab9485), VDAC antibody (Abcam, #ab15895), α-tubulin antibody (Abcam, #ab7291), β-actin antibody (Sigma, #A5441), phospho-PDH E1α antibody (S232) (Millipore, #AP106350). PDH E1α antibody (#3205), MPC1 antibody (#14462), MPC2 antibody (#46141), GLUT1 antibody (#12939), phospho-AMPKα (T172) antibody (#2531L), AMPKα antibody (#2532), phospho-ACC (S79) antibody (#3661), and ACC antibody (#3662) were purchased from Cell Signaling.
Quantitative real-time PCR analysis
Total RNA was reverse transcribed for quantitative real-time PCR analysis as described previously36,86. Gene expression analysis was performed using the Applied Biosystems 7900 (Applied Biosystems) and iTaq Universal SYBR Green Supermix (Bio-Rad). Relative mRNA expression of the genes of interest was determined using gene-specific primers after normalization to cyclophilin by the 2−ΔΔCt method. The validated primer sequences were obtained from PrimerBank public resource95.
Histological analysis
Tissue samples were fixed in 10% neutral-buffered formalin, paraffin embedded, and sectioned (5 μm) by the Cell Biology & Bioimaging Core at Pennington Biomedical Research Center. Hematoxylin and eosin-stained paraffin sections were scanned using a Hamamatsu NanoZoomer slide scanner (Hamamatsu, Japan).
Transmission electron microscopy
BAT was cut into 1 mm cubes and immediately fixed in 2.5 % glutaraldehyde/2% paraformaldehyde in 0.1M sodium cacodylate buffer pH7.4 at 4 °C. The tissue samples were rinsed twice in cacodylate fixation buffer and post-fixed with 1% osmium. After dehydration using an ethanol gradient, the tissue samples were embedded in resin and polymerized. 70 mm thin sections from the resin blocks were mounted on gold support grids and contrasted with Uranyl acetate. The sections were then examined using a Philips CM10 Electron Microscope with 100 Kv accelerating voltage and images were captured using a Gatan TEM CCD camera. Sample processes and analysis were carried out at the University of Massachusetts Medical School Electron Microscopy core facility.
Quantification and statistical analysis
The data were analyzed and visualized using GraphPad Prism 10 software (Dotmatics, Boston, MA). All of the statistical details of experiments can be found in figures and figure legends, including statistical tests used, exact values of n, and dispersion and precision measures. Briefly, differences between two groups were evaluated using the unpaired two-tailed Student’s t-test or two-way ANOVA with Bonferroni’s multiple comparisons as post-test. N represents the number of animals used, the number of cells analyzed, and the number of experimental samples. Data were presented as means ± SEM, with statistical significance set at p < 0.05. Significance is considered as *p < 0.05, **p < 0.01, ***p < 0.001, and ****p < 0.0001.
Supplementary Material
Supplemental Information
Document S1. Figures S1–S3
Key resources table
| REAGENT or RESOURCE | SOURCE | IDENTIFIER |
|---|---|---|
| Antibodies | ||
| Anti-PGC-1α | Millipore Sigma | RRID:AB_10807905 |
| Anti-GOT1 | ProSci | RRID:AB_10912319 |
| Anti-GOT2 | Thermo Fisher Scientific | RRID:AB_2545048 |
| Anti-MDH1 | Santa Cruz Biotechnology | RRID:AB_10609257 |
| Anti-MDH2 | Thermo Fisher Scientific | RRID:AB_11156233 |
| Anti-UCP1 | Commins, S.P. et al. | N/A |
| Anti-GLUT1 | Cell Signaling Technology | RRID:AB_2687899 |
| Anti-p-AMPKα (T172) | Cell Signaling Technology | RRID:AB_330330 |
| Anti-AMPKα | Cell Signaling Technology | RRID:AB_330331 |
| Anti-p-ACC (S79) | Cell Signaling Technology | RRID:AB_330337 |
| Anti-ACC | Cell Signaling Technology | RRID:AB_2219400 |
| Anti-p-PDH E1α (S232) | Millipore Sigma | RRID:AB_10616070 |
| Anti-PDH E1α | Cell Signaling Technology | RRID:AB_2162926 |
| Anti-GAPDH | Abcam | RRID:AB_307275 |
| Anti-VDAC | Abcam | RRID:AB_2214787 |
| Anti-α-tubulin | Abcam | RRID:AB_2241126 |
| Anti-β-actin | Abcam | RRID:AB_445482 |
| Chemicals, peptides, and recombinant proteins | ||
| CL 316243 disodium salt | TOCRIS | Cat#1499 |
| D-(+)-Glucose | Sigma-Aldrich | Cat#G-6152 |
| Insulin from Bovine Pancreas | Sigma-Aldrich | Cat#I-5500 |
| T3 | Sigma-Aldrich | Cat#T-2877 |
| 3-Isobutyl-1-methylxanthine | Sigma-Aldrich | Cat#I-5879 |
| Dexamethasone | Sigma-Aldrich | Cat#D-1756 |
| Indomethacin | Sigma-Aldrich | Cat#I-7378 |
| (−)-Isoproterenol (+)-bitartrate salt | Sigma-Aldrich | Cat#I-2760 |
| DMEM, high glucose, pyruvate, no glutamine | Thermo Fisher Scientific | Cat#10-313-039 |
| DMEM, no glucose, no glutamine, no phenol red | Thermo Fisher Scientific | Cat#A1443001 |
| FBS | Cytiva | Cat#SH30396.03 |
| Penicillin-Streptomycin (10,000 U/mL) | Thermo Fisher Scientific | Cat#15-140-122 |
| L-Glutamine (200 mM) | Thermo Fisher Scientific | Cat#25-030-081 |
| Formalin solution, neutral buffered, 10% | Sigma-Aldrich | Cat#HT501128 |
| Glycine | Bio-Rad Laboratories | Cat#161-0718 |
| Trizma Base | Sigma-Aldrich | Cat#T-1503 |
| Trizma Hydrochloride | Sigma-Aldrich | Cat#T-5941 |
| Sodium Chloride | Fisher Scientific | Cat#S271-500 |
| Manganese Chloride Tetrahydrate | Sigma-Aldrich | Cat#M-9522 |
| Nonidet-P40 (NP-40) | US Biological | Cat#N-3500 |
| Protease Inhibitor tablets | Pierce | Cat#88265 |
| SDS | Bio-Rad Laboratories | Cat#161-0302 |
| EDTA Disodium Salt | Fisher Scientific | Cat#BP120-500 |
| Sodium Bicarbonate | Fisher Scientific | Cat#S233-500 |
| Albumin Bovine Fraction V Fatty Acid Free | MP Biomedicals | Cat#152401 |
| O-(Carboxymethyl)hydroxylamine hemihydrochloride (AOA) | Sigma | Cat#C13408 |
| Iodoacetate | Alfa Aesar | Cat#A12410-14 |
| Sodium Pyruvate | Sigma-Aldrich | Cat#P-2256 |
| L-(−)-Malic acid | Sigma-Aldrich | Cat#M-1000 |
| Rotenone | Sigma-Aldrich | Cat#R-8875 |
| Antimycin A | Sigma-Aldrich | Cat#A-8674 |
| Sucrose | Fisher Scientific | Cat#S2-500 |
| Dipotassium Phosphate | Fisher Scientific | Cat#S80146-3 |
| Potassium Chloride | Fisher Scientific | Cat#P333-500 |
| L-Carnitine hydrochloride | Sigma-Aldrich | Cat#C-0283 |
| DL-Dithiothreitol (DTT) | Promega | Cat#V-3151 |
| β-Nicotinamide adenine dinucleotide hydrate | Sigma-Aldrich | Cat#N-7004 |
| Adenosin 5’-triphosphate (sodium salt) | Cayman Chemical Company | Cat#14498 |
| Coenzyme-A | Cayman Chemical Company | Cat#16147 |
| Palmitic Acid | Sigma-Aldrich | Cat#P-0500 |
| 70% Perchloric Acid | Sigma-Aldrich | Cat#311421 |
| Sodium Hydroxide | Fisher | Cat#S318-500 |
| Thiamine pyrophosphate (TPP) | Sigma | Cat#C-8754 |
| HEPES (1M) | Thermo Fisher Scientific | Cat#15-630-080 |
| Ethylene glycol-bis(2-aminoethylether)-N,N,N′,N′-tetraacetic acid | Sigma-Aldrich | Cat#E-3889 |
| α-Cyano-4-hydroxycinnamic acid (CHC) | Sigma-Aldrich | Cat#476870 |
| 2-Deoxyglucose (2-DG) | Sigma-Aldrich | Cat#D-8375 |
| Cytochalasin B | Sigma-Aldrich | Cat#C-6762 |
| Oligomycin from Steptomyces diaststochromgenes | Sigma-Aldrich | Cat#O-4876 |
| iTaq Universal SYBR Green Supermix | Bio-Rad Laboratories | Cat#1725125 |
| D-[4-2H] glucose | Omicron Biochemicals | Cat#GLC-035 |
| 15N-valine | Sigma-Aldrich | Cat#490172 |
| 1-14C]-palmitic acid | Perkin Elmer | Cat#NEC075H |
| [2-14C]-pyruvic acid, sodium salt | Perkin Elmer | Cat#NEC256 |
| [3H]-2-deoxy-D-glucose | Perkin Elmer | Cat#NET328A |
| Critical commercial assays | ||
| EnzyChrom NAD+/NADH assay kit | BioAssay System | Cat#E2ND-100 |
| AST(GOT1) Activity Assay Kit | Sigma-Aldrich | Cat#MAK055-1KT |
| ADP/ATP Ratio Assay kit | Sigma-Aldrich | Cat#MAK135-1KT |
| Pyruvate Dehydrogenase Activity Assay Kit | Sigma-Aldrich | Cat#MAK183 |
| Experimental models: Cell lines | ||
| Pgc-1α−/− brown adipocytes | Uldry, M. et al.40 | N/A |
| FL-Pgc-1α−/− brown adipocytes | Jun, H.J. et al.41 | N/A |
| NT-Pgc-1α−/− brown adipocytes | Kim, J. et al.42 | N/A |
| Got1KO brown adipocytes | This paper | N/A |
| Got1OE brown adipocytes | This paper | N/A |
| Experimental models: Organisms/strains | ||
| C57BL/6 mice | Jackson Laboratory | RRID:IMSR_JAX:000664 |
| Ucp1-cre transgenic mice | Jackson Laboratory | RRID:IMSR_JAX:024670 |
| C57BL/6N-Got1tm1a(EUCOMM)Hmgu/H mice | EMMA | RRID:IMSR_EM:10399 |
| R26-Got1 knock-in mice | This paper | N/A |
| Oligonucleotides | ||
| Primers for qPCR from PrimerBank | https://pga.mgh.harvard.edu/primerbank/ | N/A |
| Recombinant DNA | ||
| CAG-loxP-neo-3xpA(stop)-loxP-GOT1 | This paper or Lab | N/A |
| pBABE-Puro-SV40LT | Addgene | RRID:Addgene_13970 |
| WZL-neo-cre | AddGene | RRID:Addgene_34568 |
| pcDNA3.1-Peredox-mCherry | AddGene | RRID:Addgene_32383 |
| Software and algorithms | ||
| ImageJ software | https://imagej.nih.gov/ij | RRID:SCR_002285 |
| Prism 10 software | GraphPad Software Inc. | RRID: SCR_002798 |
| Graphic abstract and schematics in figures | https://www.biorender.com | RRID:SCR_018361 |
| Integrative Genome Viewer (v2.3) | https://igv.org/ | RRID:SCR_011793 |
| Analysis instrument | ||
| Promethion | Sable Systems International | N/A |
| Next EZ glucometer | Bayer | N/A |
| Lionheart FX Automated Microscope | BioTek | RRID:SCR_019744 |
| OROBOROS Oxygraph-2k | Oroboros Instruments | N/A |
| Seahorse XF24 analyzer | Agilent Technologies | RRID:SCR_019539 |
| Hamamatsu NanoZoomer slide scanner | Hamamatsu | RRID:SCR_023762 |
| Applied Biosystems 7900 | Thermo Fisher Scientific | RRID:SCR_018060 |
| SpectraMax Plus 384 Absorbance Plate Reader | Molecular Devices | RRID:SCR_018598 |
| Tri-Carb 2910TR liquid scintillation analyzer | Perkin Elmer | N/A |
Highlights.
Got1 is markedly induced by cold in BAT via a β-adrenergic receptor-PKA-PGC-1α axis
The increase in GOT1 levels activates the malate-aspartate shuttle (MAS)
MAS activation promotes fatty acid oxidation while reducing glucose oxidation
Loss of MAS activity in BAT by Got1 deletion shifts the fuel preference to glucose
Acknowledgements
We thank Dr. Tom Gettys (Pennington Biomedical Research Center) for providing PGC-1α and UCP1 antibodies, Ms. Jisu Lee for technical assistance, Drs. Randall L. Mynatt and Jingying Zhang (PBRC Transgenics Core) for technical support in generating the Got1-knockin mouse line, and Dr. Gregory Hendricks and Ms. Keith Reddig (UMass Electron Microscopy core facility) for transmission electron microscopic analysis. This work was supported by the National Institutes of Health grant R01DK136536 (JSC) and used Cell Biology & Bioimaging Core, Genomics Core, and Animal Metabolism & Behavior Core that are supported in part by COBRE (1P20GM135002-01) and NORC (P30DK072476) center grants from the National Institutes of Health, and also used UMass Electron Microscopy core facility that is supported by Award Numbers S10OD025113-01, and S10OD021580, from the National Center For Research Resources.
Footnotes
Declaration of interests
The authors declare no competing interests.
References
- 1.Cannon B, and Nedergaard J (2004). Brown adipose tissue: function and physiological significance. Physiol Rev 84, 277–359. 10.1152/physrev.00015.2003. [DOI] [PubMed] [Google Scholar]
- 2.Nedergaard J, Golozoubova V, Matthias A, Asadi A, Jacobsson A, and Cannon B (2001). UCP1: the only protein able to mediate adaptive non-shivering thermogenesis and metabolic inefficiency. Biochim Biophys Acta 1504, 82–106. S0005–2728(00)00247–4 [pii]. [DOI] [PubMed] [Google Scholar]
- 3.Golozoubova V, Hohtola E, Matthias A, Jacobsson A, Cannon B, and Nedergaard J (2001). Only UCP1 can mediate adaptive nonshivering thermogenesis in the cold. FASEB J 15, 2048–2050. 10.1096/fj.00-0536fje. [DOI] [PubMed] [Google Scholar]
- 4.Wu J, Bostrom P, Sparks LM, Ye L, Choi JH, Giang AH, Khandekar M, Virtanen KA, Nuutila P, Schaart G, et al. (2012). Beige adipocytes are a distinct type of thermogenic fat cell in mouse and human. Cell 150, 366–376. 10.1016/j.cell.2012.05.016. [DOI] [PMC free article] [PubMed] [Google Scholar]
- 5.Himms-Hagen J, Cui J, Danforth E Jr., Taatjes DJ, Lang SS, Waters BL, and Claus TH (1994). Effect of CL-316,243, a thermogenic beta 3-agonist, on energy balance and brown and white adipose tissues in rats. Am J Physiol 266, R1371–1382. [DOI] [PubMed] [Google Scholar]
- 6.Himms-Hagen J, Melnyk A, Zingaretti MC, Ceresi E, Barbatelli G, and Cinti S (2000). Multilocular fat cells in WAT of CL-316243-treated rats derive directly from white adipocytes. Am J Physiol Cell Physiol 279, C670–681. [DOI] [PubMed] [Google Scholar]
- 7.Granneman JG, Li P, Zhu Z, and Lu Y (2005). Metabolic and cellular plasticity in white adipose tissue I: effects of beta3-adrenergic receptor activation. Am J Physiol Endocrinol Metab 289, E608–616. 10.1152/ajpendo.00009.2005. [DOI] [PubMed] [Google Scholar]
- 8.Cypess AM, Lehman S, Williams G, Tal I, Rodman D, Goldfine AB, Kuo FC, Palmer EL, Tseng YH, Doria A, et al. (2009). Identification and importance of brown adipose tissue in adult humans. N Engl J Med 360, 1509–1517. 10.1056/NEJMoa0810780. [DOI] [PMC free article] [PubMed] [Google Scholar]
- 9.Saito M, Okamatsu-Ogura Y, Matsushita M, Watanabe K, Yoneshiro T, Nio-Kobayashi J, Iwanaga T, Miyagawa M, Kameya T, Nakada K, et al. (2009). High incidence of metabolically active brown adipose tissue in healthy adult humans: effects of cold exposure and adiposity. Diabetes 58, 1526–1531. 10.2337/db09-0530. [DOI] [PMC free article] [PubMed] [Google Scholar]
- 10.van Marken Lichtenbelt WD, Vanhommerig JW, Smulders NM, Drossaerts JM, Kemerink GJ, Bouvy ND, Schrauwen P, and Teule GJ (2009). Cold-activated brown adipose tissue in healthy men. N Engl J Med 360, 1500–1508. 10.1056/NEJMoa0808718. [DOI] [PubMed] [Google Scholar]
- 11.Chondronikola M, Volpi E, Borsheim E, Porter C, Annamalai P, Enerback S, Lidell ME, Saraf MK, Labbe SM, Hurren NM, et al. (2014). Brown adipose tissue improves whole-body glucose homeostasis and insulin sensitivity in humans. Diabetes 63, 4089–4099. 10.2337/db14-0746. [DOI] [PMC free article] [PubMed] [Google Scholar]
- 12.Ouellet V, Labbe SM, Blondin DP, Phoenix S, Guerin B, Haman F, Turcotte EE, Richard D, and Carpentier AC (2012). Brown adipose tissue oxidative metabolism contributes to energy expenditure during acute cold exposure in humans. J Clin Invest 122, 545–552. 10.1172/JCI60433. [DOI] [PMC free article] [PubMed] [Google Scholar]
- 13.Hanssen MJ, Hoeks J, Brans B, van der Lans AA, Schaart G, van den Driessche JJ, Jorgensen JA, Boekschoten MV, Hesselink MK, Havekes B, et al. (2015). Short-term cold acclimation improves insulin sensitivity in patients with type 2 diabetes mellitus. Nat Med 21, 863–865. 10.1038/nm.3891. [DOI] [PubMed] [Google Scholar]
- 14.Cypess AM, Weiner LS, Roberts-Toler C, Franquet Elia E, Kessler SH, Kahn PA, English J, Chatman K, Trauger SA, Doria A, and Kolodny GM (2015). Activation of human brown adipose tissue by a beta3-adrenergic receptor agonist. Cell Metab 21, 33–38. 10.1016/j.cmet.2014.12.009. [DOI] [PMC free article] [PubMed] [Google Scholar]
- 15.O’Mara AE, Johnson JW, Linderman JD, Brychta RJ, McGehee S, Fletcher LA, Fink YA, Kapuria D, Cassimatis TM, Kelsey N, et al. (2020). Chronic mirabegron treatment increases human brown fat, HDL cholesterol, and insulin sensitivity. J Clin Invest 130, 2209–2219. 10.1172/JCI131126. [DOI] [PMC free article] [PubMed] [Google Scholar]
- 16.Townsend KL, and Tseng YH (2014). Brown fat fuel utilization and thermogenesis. Trends Endocrinol Metab 25, 168–177. 10.1016/j.tem.2013.12.004. [DOI] [PMC free article] [PubMed] [Google Scholar]
- 17.Fedorenko A, Lishko PV, and Kirichok Y (2012). Mechanism of fatty-acid-dependent UCP1 uncoupling in brown fat mitochondria. Cell 151, 400–413. 10.1016/j.cell.2012.09.010. [DOI] [PMC free article] [PubMed] [Google Scholar]
- 18.Ma SW, and Foster DO (1986). Uptake of glucose and release of fatty acids and glycerol by rat brown adipose tissue in vivo. Can J Physiol Pharmacol 64, 609–614. [DOI] [PubMed] [Google Scholar]
- 19.Isler D, Hill HP, and Meier MK (1987). Glucose metabolism in isolated brown adipocytes under beta-adrenergic stimulation. Quantitative contribution of glucose to total thermogenesis. Biochem J 245, 789–793. [DOI] [PMC free article] [PubMed] [Google Scholar]
- 20.Hankir MK, and Klingenspor M (2018). Brown adipocyte glucose metabolism: a heated subject. EMBO Rep 19. 10.15252/embr.201846404. [DOI] [PMC free article] [PubMed] [Google Scholar]
- 21.Jung SM, Doxsey WG, Le J, Haley JA, Mazuecos L, Luciano AK, Li H, Jang C, and Guertin DA (2021). In vivo isotope tracing reveals the versatility of glucose as a brown adipose tissue substrate. Cell Rep 36, 109459. 10.1016/j.celrep.2021.109459. [DOI] [PMC free article] [PubMed] [Google Scholar]
- 22.Winther S, Isidor MS, Basse AL, Skjoldborg N, Cheung A, Quistorff B, and Hansen JB (2018). Restricting glycolysis impairs brown adipocyte glucose and oxygen consumption. Am J Physiol Endocrinol Metab 314, E214–E223. 10.1152/ajpendo.00218.2017. [DOI] [PubMed] [Google Scholar]
- 23.Bornstein MR, Neinast MD, Zeng X, Chu Q, Axsom J, Thorsheim C, Li K, Blair MC, Rabinowitz JD, and Arany Z (2023). Comprehensive quantification of metabolic flux during acute cold stress in mice. Cell Metab 35, 2077–2092 e2076. 10.1016/j.cmet.2023.09.002. [DOI] [PMC free article] [PubMed] [Google Scholar]
- 24.Yu XX, Lewin DA, Forrest W, and Adams SH (2002). Cold elicits the simultaneous induction of fatty acid synthesis and beta-oxidation in murine brown adipose tissue: prediction from differential gene expression and confirmation in vivo. FASEB J 16, 155–168. 10.1096/fj.01-0568com. [DOI] [PubMed] [Google Scholar]
- 25.Verkerke ARP, Wang D, Yoshida N, Taxin ZH, Shi X, Zheng S, Li Y, Auger C, Oikawa S, Yook JS, et al. (2024). BCAA-nitrogen flux in brown fat controls metabolic health independent of thermogenesis. Cell 187, 2359–2374 e2318. 10.1016/j.cell.2024.03.030. [DOI] [PMC free article] [PubMed] [Google Scholar]
- 26.Yoneshiro T, Wang Q, Tajima K, Matsushita M, Maki H, Igarashi K, Dai Z, White PJ, McGarrah RW, Ilkayeva OR, et al. (2019). BCAA catabolism in brown fat controls energy homeostasis through SLC25A44. Nature 572, 614–619. 10.1038/s41586-019-1503-x. [DOI] [PMC free article] [PubMed] [Google Scholar]
- 27.Borst P (2020). The malate-aspartate shuttle (Borst cycle): How it started and developed into a major metabolic pathway. IUBMB Life 72, 2241–2259. 10.1002/iub.2367. [DOI] [PMC free article] [PubMed] [Google Scholar]
- 28.Pardo B, Contreras L, and Satrustegui J (2013). De novo Synthesis of Glial Glutamate and Glutamine in Young Mice Requires Aspartate Provided by the Neuronal Mitochondrial Aspartate-Glutamate Carrier Aralar/AGC1. Front Endocrinol (Lausanne) 4, 149. 10.3389/fendo.2013.00149. [DOI] [PMC free article] [PubMed] [Google Scholar]
- 29.Lu M, Zhou L, Stanley WC, Cabrera ME, Saidel GM, and Yu X (2008). Role of the malate-aspartate shuttle on the metabolic response to myocardial ischemia. J Theor Biol 254, 466–475. 10.1016/j.jtbi.2008.05.033. [DOI] [PMC free article] [PubMed] [Google Scholar]
- 30.Saheki T, and Kobayashi K (2002). Mitochondrial aspartate glutamate carrier (citrin) deficiency as the cause of adult-onset type II citrullinemia (CTLN2) and idiopathic neonatal hepatitis (NICCD). J Hum Genet 47, 333–341. 10.1007/s100380200046. [DOI] [PubMed] [Google Scholar]
- 31.Rubi B, del Arco A, Bartley C, Satrustegui J, and Maechler P (2004). The malate-aspartate NADH shuttle member Aralar1 determines glucose metabolic fate, mitochondrial activity, and insulin secretion in beta cells. J Biol Chem 279, 55659–55666. 10.1074/jbc.M409303200. [DOI] [PubMed] [Google Scholar]
- 32.Schantz PG, Sjoberg B, and Svedenhag J (1986). Malate-aspartate and alpha-glycerophosphate shuttle enzyme levels in human skeletal muscle: methodological considerations and effect of endurance training. Acta Physiol Scand 128, 397–407. 10.1111/j.1748-1716.1986.tb07993.x. [DOI] [PubMed] [Google Scholar]
- 33.Chang JS, Ghosh S, Newman S, and Salbaum JM (2018). A map of the PGC-1alpha- and NT-PGC-1alpha-regulated transcriptional network in brown adipose tissue. Sci Rep 8, 7876. 10.1038/s41598-018-26244-4. [DOI] [PMC free article] [PubMed] [Google Scholar]
- 34.Perdikari A, Leparc GG, Balaz M, Pires ND, Lidell ME, Sun W, Fernandez-Albert F, Muller S, Akchiche N, Dong H, et al. (2018). BATLAS: Deconvoluting Brown Adipose Tissue. Cell Rep 25, 784–797 e784. 10.1016/j.celrep.2018.09.044. [DOI] [PubMed] [Google Scholar]
- 35.Zhang Y, Huypens P, Adamson AW, Chang JS, Henagan TM, Lenard NR, Burk D, Klein J, Perwitz N, Shin J, et al. (2009). Alternative mRNA splicing produces a novel biologically active short isoform of PGC-1{alpha}. J Biol Chem 284, 32813–32826. [DOI] [PMC free article] [PubMed] [Google Scholar]
- 36.Chang JS, Fernand V, Zhang Y, Shin J, Jun HJ, Joshi Y, and Gettys TW (2012). NT-PGC-1alpha protein is sufficient to link beta3-adrenergic receptor activation to transcriptional and physiological components of adaptive thermogenesis. J Biol Chem 287, 9100–9111. 10.1074/jbc.M111.320200. [DOI] [PMC free article] [PubMed] [Google Scholar]
- 37.Dufour CR, Wilson BJ, Huss JM, Kelly DP, Alaynick WA, Downes M, Evans RM, Blanchette M, and Giguere V (2007). Genome-wide orchestration of cardiac functions by the orphan nuclear receptors ERRalpha and gamma. Cell Metab 5, 345–356. 10.1016/j.cmet.2007.03.007. [DOI] [PubMed] [Google Scholar]
- 38.Schreiber SN, Emter R, Hock MB, Knutti D, Cardenas J, Podvinec M, Oakeley EJ, and Kralli A (2004). The estrogen-related receptor alpha (ERRalpha) functions in PPARgamma coactivator 1alpha (PGC-1alpha)-induced mitochondrial biogenesis. Proc Natl Acad Sci U S A 101, 6472–6477. [DOI] [PMC free article] [PubMed] [Google Scholar]
- 39.Schreiber SN, Knutti D, Brogli K, Uhlmann T, and Kralli A (2003). The transcriptional coactivator PGC-1 regulates the expression and activity of the orphan nuclear receptor estrogen-related receptor alpha (ERRalpha). J Biol Chem 278, 9013–9018. 10.1074/jbc.M212923200. [DOI] [PubMed] [Google Scholar]
- 40.Uldry M, Yang W, St-Pierre J, Lin J, Seale P, and Spiegelman BM (2006). Complementary action of the PGC-1 coactivators in mitochondrial biogenesis and brown fat differentiation. Cell Metab 3, 333–341. [DOI] [PubMed] [Google Scholar]
- 41.Jun HJ, Joshi Y, Patil Y, Noland RC, and Chang JS (2014). NT-PGC-1alpha activation attenuates high-fat diet-induced obesity by enhancing brown fat thermogenesis and adipose tissue oxidative metabolism. Diabetes 63, 3615–3625. 10.2337/db13-1837. [DOI] [PMC free article] [PubMed] [Google Scholar]
- 42.Kim J, Park MS, Ha K, Park C, Lee J, Mynatt RL, and Chang JS (2018). NT-PGC-1alpha deficiency decreases mitochondrial FA oxidation in brown adipose tissue and alters substrate utilization in vivo. J Lipid Res 59, 1660–1670. 10.1194/jlr.M085647. [DOI] [PMC free article] [PubMed] [Google Scholar]
- 43.Kong X, Banks A, Liu T, Kazak L, Rao RR, Cohen P, Wang X, Yu S, Lo JC, Tseng YH, et al. (2014). IRF4 is a key thermogenic transcriptional partner of PGC-1alpha. Cell 158, 69–83. 10.1016/j.cell.2014.04.049. [DOI] [PMC free article] [PubMed] [Google Scholar]
- 44.Shibata H, Perusse F, Vallerand A, and Bukowiecki LJ (1989). Cold exposure reverses inhibitory effects of fasting on peripheral glucose uptake in rats. Am J Physiol 257, R96–101. 10.1152/ajpregu.1989.257.1.R96. [DOI] [PubMed] [Google Scholar]
- 45.Albert V, Svensson K, Shimobayashi M, Colombi M, Munoz S, Jimenez V, Handschin C, Bosch F, and Hall MN (2016). mTORC2 sustains thermogenesis via Akt-induced glucose uptake and glycolysis in brown adipose tissue. EMBO Mol Med 8, 232–246. 10.15252/emmm.201505610. [DOI] [PMC free article] [PubMed] [Google Scholar]
- 46.Bartelt A, Bruns OT, Reimer R, Hohenberg H, Ittrich H, Peldschus K, Kaul MG, Tromsdorf UI, Weller H, Waurisch C, et al. (2011). Brown adipose tissue activity controls triglyceride clearance. Nat Med 17, 200–205. 10.1038/nm.2297. [DOI] [PubMed] [Google Scholar]
- 47.Gasparetti AL, de Souza CT, Pereira-da-Silva M, Oliveira RL, Saad MJ, Carneiro EM, and Velloso LA (2003). Cold exposure induces tissue-specific modulation of the insulin-signalling pathway in Rattus norvegicus. J Physiol 552, 149–162. 10.1113/jphysiol.2003.050369. [DOI] [PMC free article] [PubMed] [Google Scholar]
- 48.Wang L, Jin Q, Lee JE, Su IH, and Ge K (2010). Histone H3K27 methyltransferase Ezh2 represses Wnt genes to facilitate adipogenesis. Proc Natl Acad Sci U S A 107, 7317–7322. 10.1073/pnas.1000031107. [DOI] [PMC free article] [PubMed] [Google Scholar]
- 49.Eto K, Tsubamoto Y, Terauchi Y, Sugiyama T, Kishimoto T, Takahashi N, Yamauchi N, Kubota N, Murayama S, Aizawa T, et al. (1999). Role of NADH shuttle system in glucose-induced activation of mitochondrial metabolism and insulin secretion. Science 283, 981–985. [DOI] [PubMed] [Google Scholar]
- 50.Hung YP, Albeck JG, Tantama M, and Yellen G (2011). Imaging cytosolic NADH-NAD(+) redox state with a genetically encoded fluorescent biosensor. Cell Metab 14, 545–554. 10.1016/j.cmet.2011.08.012. [DOI] [PMC free article] [PubMed] [Google Scholar]
- 51.Hung YP, and Yellen G (2014). Live-cell imaging of cytosolic NADH-NAD+ redox state using a genetically encoded fluorescent biosensor. Methods Mol Biol 1071, 83–95. 10.1007/978-1-62703-622-1_7. [DOI] [PMC free article] [PubMed] [Google Scholar]
- 52.Diaz-Garcia CM, Mongeon R, Lahmann C, Koveal D, Zucker H, and Yellen G (2017). Neuronal Stimulation Triggers Neuronal Glycolysis and Not Lactate Uptake. Cell Metab 26, 361–374 e364. 10.1016/j.cmet.2017.06.021. [DOI] [PMC free article] [PubMed] [Google Scholar]
- 53.Hung YP, Teragawa C, Kosaisawe N, Gillies TE, Pargett M, Minguet M, Distor K, Rocha-Gregg BL, Coloff JL, Keibler MA, et al. (2017). Akt regulation of glycolysis mediates bioenergetic stability in epithelial cells. Elife 6. 10.7554/eLife.27293. [DOI] [PMC free article] [PubMed] [Google Scholar]
- 54.Hanse EA, Ruan C, Kachman M, Wang D, Lowman XH, and Kelekar A (2017). Cytosolic malate dehydrogenase activity helps support glycolysis in actively proliferating cells and cancer. Oncogene 36, 3915–3924. 10.1038/onc.2017.36. [DOI] [PMC free article] [PubMed] [Google Scholar]
- 55.Liu L, Shah S, Fan J, Park JO, Wellen KE, and Rabinowitz JD (2016). Malic enzyme tracers reveal hypoxia-induced switch in adipocyte NADPH pathway usage. Nat Chem Biol 12, 345–352. 10.1038/nchembio.2047. [DOI] [PMC free article] [PubMed] [Google Scholar]
- 56.Lewis CA, Parker SJ, Fiske BP, McCloskey D, Gui DY, Green CR, Vokes NI, Feist AM, Vander Heiden MG, and Metallo CM (2014). Tracing compartmentalized NADPH metabolism in the cytosol and mitochondria of mammalian cells. Mol Cell 55, 253–263. 10.1016/j.molcel.2014.05.008. [DOI] [PMC free article] [PubMed] [Google Scholar]
- 57.Wu M, Neilson A, Swift AL, Moran R, Tamagnine J, Parslow D, Armistead S, Lemire K, Orrell J, Teich J, et al. (2007). Multiparameter metabolic analysis reveals a close link between attenuated mitochondrial bioenergetic function and enhanced glycolysis dependency in human tumor cells. Am J Physiol Cell Physiol 292, C125–136. 10.1152/ajpcell.00247.2006. [DOI] [PubMed] [Google Scholar]
- 58.Pulinilkunnil T, He H, Kong D, Asakura K, Peroni OD, Lee A, and Kahn BB (2011). Adrenergic regulation of AMP-activated protein kinase in brown adipose tissue in vivo. J Biol Chem 286, 8798–8809. 10.1074/jbc.M111.218719. [DOI] [PMC free article] [PubMed] [Google Scholar]
- 59.Gauthier MS, Miyoshi H, Souza SC, Cacicedo JM, Saha AK, Greenberg AS, and Ruderman NB (2008). AMP-activated protein kinase is activated as a consequence of lipolysis in the adipocyte: potential mechanism and physiological relevance. J Biol Chem 283, 16514–16524. 10.1074/jbc.M708177200. [DOI] [PMC free article] [PubMed] [Google Scholar]
- 60.Mihaylova MM, and Shaw RJ (2011). The AMPK signalling pathway coordinates cell growth, autophagy and metabolism. Nat Cell Biol 13, 1016–1023. 10.1038/ncb2329. [DOI] [PMC free article] [PubMed] [Google Scholar]
- 61.Inokuma K, Ogura-Okamatsu Y, Toda C, Kimura K, Yamashita H, and Saito M (2005). Uncoupling protein 1 is necessary for norepinephrine-induced glucose utilization in brown adipose tissue. Diabetes 54, 1385–1391. 10.2337/diabetes.54.5.1385. [DOI] [PubMed] [Google Scholar]
- 62.Mottillo EP, Desjardins EM, Crane JD, Smith BK, Green AE, Ducommun S, Henriksen TI, Rebalka IA, Razi A, Sakamoto K, et al. (2016). Lack of Adipocyte AMPK Exacerbates Insulin Resistance and Hepatic Steatosis through Brown and Beige Adipose Tissue Function. Cell Metab 24, 118–129. 10.1016/j.cmet.2016.06.006. [DOI] [PMC free article] [PubMed] [Google Scholar]
- 63.Chen ZP, McConell GK, Michell BJ, Snow RJ, Canny BJ, and Kemp BE (2000). AMPK signaling in contracting human skeletal muscle: acetyl-CoA carboxylase and NO synthase phosphorylation. Am J Physiol Endocrinol Metab 279, E1202–1206. 10.1152/ajpendo.2000.279.5.E1202. [DOI] [PubMed] [Google Scholar]
- 64.Abbud W, Habinowski S, Zhang JZ, Kendrew J, Elkairi FS, Kemp BE, Witters LA, and Ismail-Beigi F (2000). Stimulation of AMP-activated protein kinase (AMPK) is associated with enhancement of Glut1-mediated glucose transport. Arch Biochem Biophys 380, 347–352. 10.1006/abbi.2000.1935. [DOI] [PubMed] [Google Scholar]
- 65.McGee SL, van Denderen BJ, Howlett KF, Mollica J, Schertzer JD, Kemp BE, and Hargreaves M (2008). AMP-activated protein kinase regulates GLUT4 transcription by phosphorylating histone deacetylase 5. Diabetes 57, 860–867. 10.2337/db07-0843. [DOI] [PubMed] [Google Scholar]
- 66.Kurth-Kraczek EJ, Hirshman MF, Goodyear LJ, and Winder WW (1999). 5’ AMP-activated protein kinase activation causes GLUT4 translocation in skeletal muscle. Diabetes 48, 1667–1671. 10.2337/diabetes.48.8.1667. [DOI] [PubMed] [Google Scholar]
- 67.Fryer LG, Foufelle F, Barnes K, Baldwin SA, Woods A, and Carling D (2002). Characterization of the role of the AMP-activated protein kinase in the stimulation of glucose transport in skeletal muscle cells. Biochem J 363, 167–174. 10.1042/0264-6021:3630167. [DOI] [PMC free article] [PubMed] [Google Scholar]
- 68.Marsin AS, Bertrand L, Rider MH, Deprez J, Beauloye C, Vincent MF, Van den Berghe G, Carling D, and Hue L (2000). Phosphorylation and activation of heart PFK-2 by AMPK has a role in the stimulation of glycolysis during ischaemia. Curr Biol 10, 1247–1255. 10.1016/s0960-9822(00)00742-9. [DOI] [PubMed] [Google Scholar]
- 69.Altshuler-Keylin S, Shinoda K, Hasegawa Y, Ikeda K, Hong H, Kang Q, Yang Y, Perera RM, Debnath J, and Kajimura S (2016). Beige Adipocyte Maintenance Is Regulated by Autophagy-Induced Mitochondrial Clearance. Cell Metab 24, 402–419. 10.1016/j.cmet.2016.08.002. [DOI] [PMC free article] [PubMed] [Google Scholar]
- 70.Sambeat A, Gulyaeva O, Dempersmier J, Tharp KM, Stahl A, Paul SM, and Sul HS (2016). LSD1 Interacts with Zfp516 to Promote UCP1 Transcription and Brown Fat Program. Cell Rep 15, 2536–2549. 10.1016/j.celrep.2016.05.019. [DOI] [PMC free article] [PubMed] [Google Scholar]
- 71.Matesanz N, Nikolic I, Leiva M, Pulgarin-Alfaro M, Santamans AM, Bernardo E, Mora A, Herrera-Melle L, Rodriguez E, Beiroa D, et al. (2018). p38alpha blocks brown adipose tissue thermogenesis through p38delta inhibition. PLoS Biol 16, e2004455. 10.1371/journal.pbio.2004455. [DOI] [PMC free article] [PubMed] [Google Scholar]
- 72.Ohashi N, Morino K, Ida S, Sekine O, Lemecha M, Kume S, Park SY, Choi CS, Ugi S, and Maegawa H (2017). Pivotal Role of O-GlcNAc Modification in Cold-Induced Thermogenesis by Brown Adipose Tissue Through Mitochondrial Biogenesis. Diabetes 66, 2351–2362. 10.2337/db16-1427. [DOI] [PubMed] [Google Scholar]
- 73.Bricker DK, Taylor EB, Schell JC, Orsak T, Boutron A, Chen YC, Cox JE, Cardon CM, Van Vranken JG, Dephoure N, et al. (2012). A mitochondrial pyruvate carrier required for pyruvate uptake in yeast, Drosophila, and humans. Science 337, 96–100. 10.1126/science.1218099. [DOI] [PMC free article] [PubMed] [Google Scholar]
- 74.Herzig S, Raemy E, Montessuit S, Veuthey JL, Zamboni N, Westermann B, Kunji ER, and Martinou JC (2012). Identification and functional expression of the mitochondrial pyruvate carrier. Science 337, 93–96. 10.1126/science.1218530. [DOI] [PubMed] [Google Scholar]
- 75.Gerhart-Hines Z, Rodgers JT, Bare O, Lerin C, Kim SH, Mostoslavsky R, Alt FW, Wu Z, and Puigserver P (2007). Metabolic control of muscle mitochondrial function and fatty acid oxidation through SIRT1/PGC-1alpha. EMBO J 26, 1913–1923. 10.1038/sj.emboj.7601633. [DOI] [PMC free article] [PubMed] [Google Scholar]
- 76.Lagouge M, Argmann C, Gerhart-Hines Z, Meziane H, Lerin C, Daussin F, Messadeq N, Milne J, Lambert P, Elliott P, et al. (2006). Resveratrol improves mitochondrial function and protects against metabolic disease by activating SIRT1 and PGC-1alpha. Cell 127, 1109–1122. 10.1016/j.cell.2006.11.013. [DOI] [PubMed] [Google Scholar]
- 77.Nemoto S, Fergusson MM, and Finkel T (2005). SIRT1 functionally interacts with the metabolic regulator and transcriptional coactivator PGC-1{alpha}. J Biol Chem 280, 16456–16460. 10.1074/jbc.M501485200. [DOI] [PubMed] [Google Scholar]
- 78.Adina-Zada A, Zeczycki TN, St Maurice M, Jitrapakdee S, Cleland WW, and Attwood PV (2012). Allosteric regulation of the biotin-dependent enzyme pyruvate carboxylase by acetyl-CoA. Biochem Soc Trans 40, 567–572. 10.1042/BST20120041. [DOI] [PubMed] [Google Scholar]
- 79.Benador IY, Veliova M, Mahdaviani K, Petcherski A, Wikstrom JD, Assali EA, Acin-Perez R, Shum M, Oliveira MF, Cinti S, et al. (2018). Mitochondria Bound to Lipid Droplets Have Unique Bioenergetics, Composition, and Dynamics that Support Lipid Droplet Expansion. Cell Metab 27, 869–885 e866. 10.1016/j.cmet.2018.03.003. [DOI] [PMC free article] [PubMed] [Google Scholar]
- 80.Benador IY, Veliova M, Liesa M, and Shirihai OS (2019). Mitochondria Bound to Lipid Droplets: Where Mitochondrial Dynamics Regulate Lipid Storage and Utilization. Cell Metab 29, 827–835. 10.1016/j.cmet.2019.02.011. [DOI] [PMC free article] [PubMed] [Google Scholar]
- 81.Houstek J, Cannon B, and Lindberg O (1975). Gylcerol-3-phosphate shuttle and its function in intermediary metabolism of hamster brown-adipose tissue. Eur J Biochem 54, 11–18. [DOI] [PubMed] [Google Scholar]
- 82.Nguyen HP, Yi D, Lin F, Viscarra JA, Tabuchi C, Ngo K, Shin G, Lee AY, Wang Y, and Sul HS (2020). Aifm2, a NADH Oxidase, Supports Robust Glycolysis and Is Required for Cold- and Diet-Induced Thermogenesis. Mol Cell 77, 600–617 e604. 10.1016/j.molcel.2019.12.002. [DOI] [PMC free article] [PubMed] [Google Scholar]
- 83.Moura MA, Festuccia WT, Kawashita NH, Garofalo MA, Brito SR, Kettelhut IC, and Migliorini RH (2005). Brown adipose tissue glyceroneogenesis is activated in rats exposed to cold. Pflugers Arch 449, 463–469. 10.1007/s00424-004-1353-7. [DOI] [PubMed] [Google Scholar]
- 84.Claflin KE, Flippo KH, Sullivan AI, Naber MC, Zhou B, Neff TJ, Jensen-Cody SO, and Potthoff MJ (2022). Conditional gene targeting using UCP1-Cre mice directly targets the central nervous system beyond thermogenic adipose tissues. Mol Metab 55, 101405. 10.1016/j.molmet.2021.101405. [DOI] [PMC free article] [PubMed] [Google Scholar]
- 85.Song A, Dai W, Jang MJ, Medrano L, Li Z, Zhao H, Shao M, Tan J, Li A, Ning T, et al. (2020). Low- and high-thermogenic brown adipocyte subpopulations coexist in murine adipose tissue. J Clin Invest 130, 247–257. 10.1172/JCI129167. [DOI] [PMC free article] [PubMed] [Google Scholar]
- 86.Chang JS, Huypens P, Zhang Y, Black C, Kralli A, and Gettys TW (2010). Regulation of NT-PGC-1alpha subcellular localization and function by protein kinase A-dependent modulation of nuclear export by CRM1. J Biol Chem 285, 18039–18050. 10.1074/jbc.M109.083121. [DOI] [PMC free article] [PubMed] [Google Scholar]
- 87.Agrawal S, Kumar S, Sehgal R, George S, Gupta R, Poddar S, Jha A, and Pathak S (2019). El-MAVEN: A Fast, Robust, and User-Friendly Mass Spectrometry Data Processing Engine for Metabolomics. Methods Mol Biol 1978, 301–321. 10.1007/978-1-4939-9236-2_19. [DOI] [PubMed] [Google Scholar]
- 88.Heinrich P, Kohler C, Ellmann L, Kuerner P, Spang R, Oefner PJ, and Dettmer K (2018). Correcting for natural isotope abundance and tracer impurity in MS-, MS/MS- and high-resolution-multiple-tracer-data from stable isotope labeling experiments with IsoCorrectoR. Sci Rep 8, 17910. 10.1038/s41598-018-36293-4. [DOI] [PMC free article] [PubMed] [Google Scholar]
- 89.Huynh FK, Green MF, Koves TR, and Hirschey MD (2014). Measurement of fatty acid oxidation rates in animal tissues and cell lines. Methods Enzymol 542, 391–405. 10.1016/B978-0-12-416618-9.00020-0. [DOI] [PMC free article] [PubMed] [Google Scholar]
- 90.Gray LR, Rauckhorst AJ, and Taylor EB (2016). A Method for Multiplexed Measurement of Mitochondrial Pyruvate Carrier Activity. J Biol Chem 291, 7409–7417. 10.1074/jbc.M115.711663. [DOI] [PMC free article] [PubMed] [Google Scholar]
- 91.Moller LLV, Raun SH, Fritzen AM, and Sylow L (2022). Measurement of skeletal muscle glucose uptake in mice in response to acute treadmill running. J Biol Methods 9, e162. 10.14440/jbm.2022.385. [DOI] [PMC free article] [PubMed] [Google Scholar]
- 92.Ferre P, Leturque A, Burnol AF, Penicaud L, and Girard J (1985). A method to quantify glucose utilization in vivo in skeletal muscle and white adipose tissue of the anaesthetized rat. Biochem J 228, 103–110. 10.1042/bj2280103. [DOI] [PMC free article] [PubMed] [Google Scholar]
- 93.Mookerjee SA, and Brand MD (2015). Measurement and Analysis of Extracellular Acid Production to Determine Glycolytic Rate. J Vis Exp, e53464. 10.3791/53464. [DOI] [PMC free article] [PubMed] [Google Scholar]
- 94.Commins SP, Watson PM, Padgett MA, Dudley A, Argyropoulos G, and Gettys TW (1999). Induction of uncoupling protein expression in brown and white adipose tissue by leptin. Endocrinology 140, 292–300. 10.1210/endo.140.1.6399. [DOI] [PubMed] [Google Scholar]
- 95.Wang X, and Seed B (2003). A PCR primer bank for quantitative gene expression analysis. Nucleic Acids Res 31, e154. 10.1093/nar/gng154. [DOI] [PMC free article] [PubMed] [Google Scholar]
Associated Data
This section collects any data citations, data availability statements, or supplementary materials included in this article.
Supplementary Materials
Data Availability Statement
All data generated or analyzed during this study are included in the published article and supplemental information.
This study does not report original code.
Any additional information required to reanalyze the data reported in this study is available from the lead contact upon request.