

Abstract
Loss of the protective function of telomeres has previously been hypothesized to cause a DNA damage response. Here, we report a genome-wide expression response, the telomerase deletion response (TDR), that occurs when telomeres can no longer be maintained by telomerase. The TDR shares features with other DNA damage responses and the environmental stress response. Unexpectedly, another feature of the TDR is the up-regulation of energy production genes, accompanied by a proliferation of mitochondria. Finally, a discrete set of genes, the “telomerase deletion signature”, is uniquely up-regulated in the TDR but not under other conditions of stress and DNA damage that have been reported. The telomerase deletion signature genes define new candidates for involvement in cellular responses to altered telomere structure or function.
Telomeres, the DNA-protein complexes at the ends of eukaryotic chromosomes, are essential for maintaining genomic stability. They prevent chromosome end-to-end fusions and protect chromosomal DNA ends against uncontrolled nucleolytic degradation. Thus, it has been suggested that a defining feature of telomeres is to prevent chromosome ends from being treated as double-strand breaks. Loss of telomere function elicits some responses in common with double-strand breaks (1, 2), but it has not been tested directly whether checkpoints and cellular responses exist that are specific for damage at the telomere.
Telomere length is replenished over multiple cell generations by addition onto chromosome ends of tandem repeats of simple-sequence telomeric DNA by the ribonucleoprotein reverse transcriptase telomerase. Positive regulators of telomerase action include DNA damage checkpoint and repair genes (3). In the yeast Saccharomyces cerevisiae, deleting telomerase causes progressive telomere shortening and eventual cell-cycle arrest in G2/M, resulting in senescence of most of the cell population (4–6). It is unknown whether this arrest is caused by a DNA damage checkpoint that is activated directly as a result of short telomeres being recognized as double-strand breaks, or whether it is an indirect consequence of chromosomal fusions at nonfunctional telomeres and subsequent breakage of the resulting dicentric chromosomes.
From the senescing yeast cells, a subpopulation of survivor cells that replicate telomeres by recombination emerges (4). Known requirements for the generation and growth of survivor cells include the double-strand break repair/recombination proteins Rad52p, Rad51p, Rad50p, Rad59p, and Sgs1p (4, 6–10). However, very little is known about how recombination pathways are activated for telomere maintenance or what additional adaptive changes may be required for survivors to arise and proliferate.
We examined genome-wide changes in mRNA transcript levels after deleting TLC1, the telomerase RNA component, in S. cerevisiae. Here we show that such cells exhibit a previously uncharacterized gene expression profile, which we have termed the telomerase deletion response (TDR). Telomere shortening evoked genome-wide responses that had both similarities to, and significant differences from, responses caused by other types of DNA damage. Aspects of the environmental stress response (ESR; ref. 11) were activated once telomeres became sufficiently short. A subset of the ESR was sustained in survivors. Oxidative phosphorylation genes became up-regulated and mitochondria proliferated specifically in senescent cells. Comparisons of the genome-wide response to telomerase deletion with a variety of DNA damage and stress conditions identified a small group of genes that is uniquely up-regulated in the TDR, defining a “telomerase deletion signature” response. Together, these changes suggest that adaptive strategies exist for life without telomerase.
Materials and Methods
Strains.
For the telomerase deletion time courses, EHB3021 (ade2ΔhisG his3Δ200 met15Δ0 trp1Δ63 ura3Δ0 Δtlc1∷HIS3 pRS316-TLC1 MATa) and reference strain EHB3022 (ade2ΔhisG∷HIS3 his3Δ200 met15Δ0 trp1Δ63 ura3Δ0 MATa) were used. Construction details are published as supporting information on the PNAS web site, www.pnas.org.
Growth and Characterization of Δtlc1.
To generate Δtlc1 strains, EHB3021 was streaked onto 5-fluoroorotic acid (5FOA) plates to counterselect pRS316-TLC1 and grown at 30°C for 2 days. For each time course, 500 ml of yeast extract/peptone/dextrose (YPD) was inoculated with a single colony. Cultures were grown to 0.4–0.5 OD A600, and aliquots were used to inoculate the next culture and for viability and budding index analyses. The remaining cells were harvested and frozen in liquid nitrogen.
To analyze viability, 1:1,000 and 1:10,000 dilutions of samples from each culture were plated in duplicate onto YPD plates. Colonies were counted after 3 days of growth, and the final viability was normalized with respect to the OD A600 of the undiluted culture. To determine the budding index, paraformaldehyde-fixed cells were examined under ×100 magnification for the presence and size of a bud. Cells with buds less than half the size of the mother cell were counted as small-budded. At least 200 cells were counted for each time point.
Telomere Length Analysis.
Telomere length analysis was performed as described (12).
RNA Isolation, Probe Preparation, and Microarray Hybridization.
Total RNA was prepared as described (13). mRNA was prepared by Oligo-dT cellulose chromatography as described in supporting information. Preparation of Cy3- and Cy5-labeled cDNA probes is also described in supporting information. Microarrays printed with ≈6,200 ORFs from S. cerevisiae (14) were constructed and processed as described (15). For each time course, the reference cDNA was prepared by pooling equal amounts of mRNA from each time point and from wild-type cells. Both wild-type and time course samples were hybridized against the pooled reference by using conditions described (15).
Data Acquisition and Analysis.
Arrays were scanned on a GenePix 4000 scanner (Axon Instruments, Foster City, CA). Data were quantified by using GENEPIX PRO V.3.0 and further processed by using AMAD V.1.0. Because a pooled sample was used as the reference, ratio measurements from the time course data were normalized relative to wild-type ratios before further analysis. Pairwise average linkage clustering analysis was performed by using the program CLUSTER and visualized by using TREEVIEW (16). The data can be downloaded from http://biochemistry.ucsf.edu/∼blackburn/TDR. Genes whose expression changed by 2-fold or more relative to wildtype in at least one time point in both experiments were selected for further analysis. For analysis of subtelomeric genes, the peak-to-trough distance of the expression ratio of a gene (as a function of time) was also used to determine fold induction or repression. The Yeast Proteome Database and the Saccharomyces Genome Database (at ftp://genome-ftp.stanford.edu/pub/yeast/SacchDB/) were used to facilitate further analysis and interpretation of the expression profiles.
Mitochondrial Imaging.
Mitochondria were visualized by using a green fluorescent protein (GFP) that is targeted to the mitochondrial matrix (18). Briefly, an integrating TRP1 plasmid bearing a fusion gene of the COX4 presequence and the GFP gene under control of the ADH4 promoter was introduced into EHB3021. Δtlc1 mutant cells were generated and passaged as described above. At the end of each passage, cells were fixed with paraformaldehyde (see supporting information) and imaged by using a Leica scanning confocal microscope. The mitochondria were not visualized before selecting a cell for imaging.
Results
Genome-Wide Response to Deletion of Telomerase.
To analyze the global gene expression response to loss of telomerase activity, a telomerase RNA deletion mutant (Δtlc1) was generated and passaged. Starting with a strain whose only copy of TLC1, the gene encoding the telomerase RNA component, was on a URA3-marked plasmid, we selected against the plasmid by initial growth on 5-fluorootic acid, and inoculated two single colonies into two liquid cultures. The cells were passaged eight times and kept at cell densities low enough to sustain growth continuously in log phase. At the end of each passage, cell viability, cellular budding index, telomere length, and mRNA profiles were analyzed. As telomeres shortened, viability decreased and large-budded (G2/M arrested), often enlarged and occasionally multibudded, cells accumulated (Fig. 1). At the peak senescence time points, the vast majority of cells were enlarged. Survivor cells that maintain their telomeres by recombination to produce heterogeneously elongated telomeres overtook the culture on the sixth and seventh passages, respectively, for time courses 1 and 2 (Fig. 1A). The appearance of survivors coincided with regaining of population viability and normal cell cycle distribution, which were maintained during further passaging.
Figure 1.

Effects of deleting TLC1 on telomere length, viability, and budding index of cells for duplicate time courses. (a) Telomere length analysis. Southern analysis of XhoI-digested genomic DNA prepared from each time point probed with a telomeric repeat oligonucleotide. Brackets mark the presurvivor Y′-containing telomeric band. The first lane shows telomere length before counterselection of pRS316-TLC1. (b) Viability as measured by colony forming units (CFU) per unit of OD A600. (c) Approximate distribution of cells throughout the cell cycle. Unbudded cells (●) correspond roughly to G1, small-budded (♦) to late G1 and S phase, and large-budded (▴) to G2/M and early G1. ×, multibudded cells.
Changes in transcript levels were measured by hybridization of fluorescently labeled cDNA prepared from each time point on microarrays printed with ≈6,200 S. cerevisiae ORFs (14). Groups of genes with similar expression profiles were delineated by using hierarchical clustering (16). Expression of approximately 650 ORFs changed twofold or more relative to wild type in at least one time point in both time courses (Fig. 2). These changes, which we have termed the telomerase deletion response, or TDR, displayed a temporal pattern that correlated strongly and reproducibly with telomere length profile, viability, and budding index. Overall, the TDR changes were greatest in number and magnitude when telomeres were shortest and viability was at a minimum. Once survivors took over, the expression of many, but not all, of the TDR genes returned to wild-type levels. The TDR genes encompass a wide variety of functions including protein synthesis, energy production, stress response, protein folding, cell wall maintenance, carbohydrate and phosphate metabolism, RNA processing, and nucleotide synthesis (17). Approximately one-third of these genes have no functional annotations in the database (17). However, four major responses (described below) were revealed: a DNA damage response, a stress response, an altered metabolic program, and the induction of a unique telomerase deletion signature.
Figure 2.

Gene expression changes in Δtlc1 mutants. (Top) Y′-containing telomere portion of the Southern blot analysis of telomere length. (Middle) Hierarchical clustering of ≈650 ORFs whose expression changed by 2-fold or more relative to wild-type cells in both time courses. Each column represents expression of genes for a single time point. Each row represents the expression pattern of a single gene at all time points analyzed. Gene expression ratios shown in red are up-regulated and those in green are down-regulated. Gray areas indicate missing data. Ratios <1.5-fold are in black. Examples of genes from various clusters are provided. (Bottom) Average fold repression and induction as a function of passage for group A and group B genes.
Genes with Known Telomeric Functions.
The TDR included only a few genes previously implicated in telomere function. Three of these were down-regulated when telomeres were shortest: RAP1, a central negative regulator of telomere length (19); EBS1, a gene that contains an RRM RNA recognition motif and is also homologous to the telomerase component EST1 (20); and TBF1, which encodes a DNA-binding protein (21). Rap1p and its associated proteins regulate access of telomerase to the telomere in a length-dependent manner (19); thus, RAP1 down-regulation could be an adaptive response to shortened telomeres. Two genes previously implicated only in meiosis were induced in the TDR: NDJ1 binds telomeres specifically in meiosis (22, 23), but was up-regulated during senescence, and the meiotic recombination gene MSC1 (24) was induced by the third passage and remained up-regulated in survivors. None of the DNA recombination and repair genes known to be involved in the recombination pathways that maintain telomeres in survivors (RAD52, RAD51, RAD50, RAD59, and SGS1; refs. 4 and 6–10) were up-regulated in survivors. However, RAD51 was transiently up-regulated during senescence. Such up-regulation may help produce survivors, which arise with lower frequency in a rad51 genetic background (8).
Cell Cycle-Regulated Genes.
Because many of the changes in the TDR correlated with the appearance of large-budded cells during senescence, we determined whether the maximal TDR simply reflected a G2/M arrest. Of the ≈800 genes that normally show cell cycle-regulated expression of their transcript levels (13, 25), approximately 120 were included in the TDR. Although many of these were induced or repressed as they are in G2/M (see Fig. 6, which is published as supporting information on the PNAS web site, www.pnas.org), many others were induced rather than repressed, or vice versa. Expression of some cell cycle-regulated genes showed no correlation with changes in the large-budded population (Fig. 6). Hence, changes caused by G2/M arrest were not sufficient to account for the majority of the TDR.
Subtelomeric Genes.
Expression of 77 (about 25%) of the genes located within 20 kb of any chromosome end changed (in most cases being induced) at least twofold relative to wild type or during the course of the experiment (see Fig. 7, which is published as supporting information on the PNAS web site). Most changes were maximal when telomeres were shortest and disappeared once telomeres were lengthened by recombination (Fig. 7). Therefore, up-regulation of these genes may have occurred through loss of telomeric silencing resulting from the combined effects of telomere shortening and the above-mentioned down-regulation of RAP1, because Rap1p acts to repress subtelomeric genes (26). However, some subtelomeric genes (e.g., MSC1 and HXK1) were induced early in the TDR and stayed induced in survivors, suggesting that their up-regulation was not because of loss of telomeric silencing.
Comparison of the TDR to DNA Damage Responses.
DNA damage caused by methyl methane sulfonate (MMS; refs. 27 and 28), ionizing radiation (IR; ref. 28), or a single double-strand cut by HO endonuclease (29) results in significantly overlapping genomic expression responses. The TDR had both striking differences from, and shared features with, these reported responses (Fig. 3 and Fig. 8, which is published as supporting information on the PNAS web site). Many of the MMS- and IR-induced gene expression changes, including a stress response, depend on the DNA damage checkpoint kinase Mec1p (28). Notably, these treatments induce a “DNA damage signature” cluster consisting of nine genes (28): the ribonucleotide reductase subunits RNR2 and RNR4, the DNA-damage repair genes RAD51 and RAD54, the DNA-damage activated kinase DUN1, the DNA-damage-inducible mitochondrial nuclease DIN7, PLM2, which has homology to the forkhead associated-domain found in several transcription factors and kinases (30), and two uncharacterized ORFs (YER004W and YBR070C). Five of these genes: RNR2, RNR4, RAD51, DIN7, and PLM2 also were up-regulated in the TDR. In addition, in the TDR, the ribonucleotide reductase subunit RNR3, previously shown to be up-regulated by MMS and IR treatment (31, 32), was induced. Expression of these six genes was maximal when telomeres were shortest and returned to near wild-type levels once long telomeres were generated via recombination. Hence, these results showed that telomere shortening caused by telomerase deletion induces a DNA damage response. However, the TDR also was clearly distinguishable from other DNA damage responses because, as discussed below, a large number of genes also was induced or repressed in the TDR but not in response to MMS, IR, and HO endonuclease treatments (Figs. 3 and 8).
Figure 3.

The TDR is distinct from other DNA damage responses. The expression profiles of the ≈650 TDR genes were compared with their expression in reported profiles for DNA damage induced by MMS and IR treatment in both wild-type and mec1 strains (28, 36) and in reported profiles for an unrepaired HO endonuclease cut in cells arrested with nocodozole in G2/M (29). Additional experiments that were used to generate this cluster but are not shown were MMS treatment in a dun1 strain, mock irradiation controls, and control expression profiles of wild-type cells relative to a mec1 mutant (28, 36). The complete comparison can be downloaded from http://biochemistry.ucsf.edu/∼blackburn/TDR. Examples of genes from various clusters are given. Regions boxed in yellow highlight features of the TDR that are distinct from the DNA damage responses shown.
Expression of Energy Production Genes.
A marked up-regulation of genes involved in oxidative phosphorylation was observed in the TDR (Fig. 3). These changes were maximal when telomeres were shortest and included genes encoding multiple components of the F1F0 ATP synthetase and the electron transport chain. Such changes have not been reported for other DNA damage responses. In addition, tricarboxylic acid cycle genes, ethanol utilization genes, and SIP4, a transcriptional activator of gluconeogenesis genes also were induced. This pattern suggested that senescing cells had initiated a metabolic program similar to a diauxic shift, in which depletion of glucose from the growth medium results in a shift from anaerobic to aerobic respiration (ref. 15, and Fig. 9, which is published as supporting information on the PNAS web site). Direct measurement of the glucose concentration in the medium at the end of each passage showed that no significant depletion of glucose had occurred (data not shown). The induction of energy production genes despite high glucose levels suggested that telomere shortening/dysfunction alters the metabolic program.
To test whether aerobic respiration might be important for survival of Δtlc1 cells, we compared Δtlc1 mutants to Δtlc1Δ pet100 double mutants by using a liquid growth assay (5). Pet100p is required for cytochrome c oxidase assembly, and null mutants are deficient in respiration (33). We found no significant differences in the rates of senescence between the two strains (data not shown). Hence, respiration per se does not delay or accelerate senescence. However, when the mitochondria of tlc1 mutants were visualized directly, they were seen to proliferate significantly during senescence (Fig. 4b). This proliferation was apparent in the vast majority of enlarged senescent cells (data not shown). In contrast, the mitochondria appeared normal early in the time course and in survivors (Fig. 4 a and c).
Figure 4.
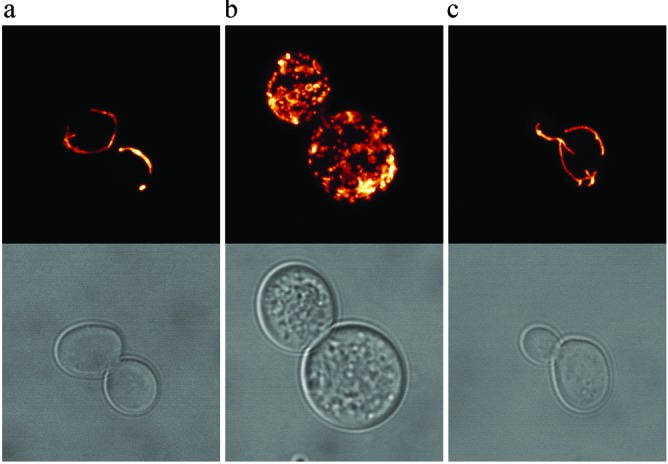
Confocal imaging of GFP-labeled mitochondria from representative presenescent (a), senescent (b), and survivor (c) cells. (Upper) Projection of fluorescence images collected along x and y planes of the GFP-labeled sample. The fluorescence signal is pseudocolored using an orange-to-white gradient that reflects pixel intensity. (Lower) Brightfield views of the cells.
The Environmental Stress Response in Telomerase-Deficient Cells.
Treatment with DNA-damaging agents activates a Mec1p-mediated ESR (28). The ESR is a stereotypical pattern of changes in the expression of approximately 900 genes evoked by a large variety of environmental stresses, including heat shock, osmotic shock, DTT, nitrogen starvation, and peroxide (11). Approximately 50% of the genes up-regulated in the ESR were also induced in the TDR (see Fig. 10, which is published as supporting information on the PNAS web site). Over half of these contained the STRE (stress responsive element) promoter element, which mediates transcriptional induction under a variety of stresses (34). This subset of TDR genes encodes chaperones (see Fig. 11, which is published as supporting information on the PNAS web site), heat shock proteins, metabolic genes, and kinases (17). A common response to stresses is the increased storage of trehalose and glycogen (34, 35), and genes involved in their synthesis also were induced in the TDR. Genes that are repressed in the ESR also were generally repressed in the TDR, although to a lesser degree; only about 10% of these genes were down-regulated twofold or more in the TDR (Fig. 10).
Notably, up-regulation of a large but specific subset of these ESR genes persisted in survivors, suggesting that the long, heterogeneous telomeres of survivors are sensed as being aberrant, thus keeping this subset of ESR genes continually up-regulated. These genes may play a role in the adaptation to loss of telomerase function.
A Telomerase Deletion Signature.
We used hierarchical clustering to simultaneously compare the TDR with the reported genome-wide expression responses to diverse environmental stress conditions and DNA-damaging agents (11, 28, 29, 36). This analysis revealed a small set of genes, of both known and unknown function, that were all specifically induced at least threefold in both Δtlc1 time courses, but were rarely, if ever, induced under the other conditions used for this comparison. Together, we term these genes the telomerase deletion signature (Fig. 5). All of these genes except EMG1 and RPL37A, clustered together. This newly identified signature includes CAK1, a cyclin-dependent kinase activating kinase, CRP1, a putative cruciform DNA-binding protein (17), YHR115C, which contains a forkhead-associated (FHA) domain (a protein–protein interaction motif commonly found in DNA damage response genes; ref. 30), and three genes involved in ribosomal biogenesis and/or RNA processing, RRP43, EMG1, and BUD31 (17).
Figure 5.

Telomerase deletion signature genes. These genes are induced in the Δtlc1 experiments but are generally not induced in over 20 conditions of stress (11, 36) and DNA damage (28, 29, 36) that have been described.
Discussion
The discovery of the TDR reported here provides strong evidence that although loss of telomere structure and function leads to a general DNA damage response similar to that previously observed for MMS, IR, and HO endonuclease treatments, it also contains many features which distinguish it from these DNA damage responses. Thus, DNA breaks occurring because of telomere fusions and subsequent chromosome breakage are unlikely to account entirely for the response of senescent cells to telomerase deletion. Furthermore, the differences between the TDR and DNA damage responses indicate that telomere damage itself is not recognized solely as double-stranded DNA breaks.
One defining feature of the TDR is the telomerase deletion signature group of genes, which provides a new cellular readout with potential utility in assessing telomere perturbations of various types. At this point, it is difficult to speculate on the roles of the ribosomal biogenesis and/or RNA processing genes RRP43, EMG1, and BUD31 in the TDR (see also Fig. 10). However, other genes in the signature are more obvious candidates for roles in telomere-specific pathways that are activated after deletion of telomerase. CRP1, which binds DNA cruciforms (17), is a candidate for involvement in telomere recombination/repair processes. Based on the common functions of known FHA domain-containing proteins in DNA damage responses (30), we hypothesize that YHR115C may have a role in signaling responses to telomere damage/shortening. Finally, the up-regulation of the cyclin-dependent kinase activating kinase, CAK1 may reflect a cellular attempt to adapt to the cell cycle arrest in senescent cells, although a new role unrelated to its cell cycle functions is not excluded.
The TDR and other DNA damage responses, although distinct, do share many features including the up-regulation of DNA damage signature and ESR genes. Expression of the DNA damage signature cluster genes was maximal when telomeres were shortest, leading us to propose that their induction helps trigger the recombination pathway that is subsequently used to replicate telomeres. It will be informative to determine whether, like aspects of the DNA damage response (28), the expression profiles exhibited by the TDR also depend on MEC1. The response to telomere damage may be governed predominantly by TEL1, the MEC1 paralog and yeast homolog of the human ATM kinase, which is proposed to be a telomere-specific checkpoint gene in yeast (37, 38).
The up-regulation of energy production genes in the TDR uncovers an intriguing link between telomere damage and mitochondrial functions and biogenesis. The mechanism and significance of this link is not yet known. It is possible that derepression of subtelomeric silencing up-regulates an activator of oxidative phosphorylation genes. However, we note that derepression of telomeric silencing caused by deletion of the SIR genes does not result in a similar up-regulation of oxidative phosphorylation genes (17). Hence, a more active mechanism may exist for this up-regulation and the accompanying mitochondrial proliferation in response to telomere damage. It will be interesting to see whether this and other distinguishing features of the TDR may eventually also be found under other conditions of DNA damage. Unlike the deletion of telomerase, many of the methods that have been used to induce DNA damage thus far affect macromolecules (and therefore processes) other than DNA; such compounding effects complicate the identification of changes that would be induced by DNA damage alone.
The induction of ESR genes indicates that once telomeres become critically short in a Δtlc1 strain, cells enter a stressed mode. Many of the stress-related gene expression changes may be attributable to signaling from short telomeres. However, another finding was that a specific subset of this stress response is sustained in survivors, despite their having both elongated telomeres and apparently healthy growth with normal budding index. This finding is in contrast to the DNA damage signature genes, whose expression is up-regulated as telomeres shorten and returns to near wild-type levels in survivors. The persistence of a partial ESR in survivors suggests that although the telomeres of survivors are functional in most respects, they have an aberrant structure that is sensed by the cell. We hypothesize that the continued up-regulation in survivors of a subset of ESR genes, as well as of some non-ESR genes, may be one important adaptive strategy used by the cell for life without telomerase.
Supplementary Material
Acknowledgments
We thank P. Brown, S. Elledge, J. Haber, D. Botstein, K. Anders, and A. Gasch for sharing unpublished results; P. Spellman and D. Botstein for assistance and valuable discussions; and A. Gasch for insightful discussions and critical reading of the manuscript. We also thank G. Pesce and P. Walter for reagents, assistance with microscopy, and useful discussions; Blackburn lab members; T. Tlsty and P. Harbury for reading of the manuscript; the University of California, San Francisco yeast microarray consortium for chip manufacture; and Irma Easter for media preparation. S.N. is a fellow of the Leukemia and Lymphoma Society. This work was supported by grants from the National Institutes of Health and a Steven and Michelle Kirsch Foundation Award (to E.H.B.).
Abbreviations
- TDR
telomerase deletion response
- ESR
environmental stress response
- MMS
methyl methane sulfonate
- IR
ionizing radiation
Footnotes
This paper was submitted directly (Track II) to the PNAS office.
References
- 1.Garvik B, Carson M, Hartwell L. Mol Cell Biol. 1995;15:6128–6138. doi: 10.1128/mcb.15.11.6128. [DOI] [PMC free article] [PubMed] [Google Scholar]
- 2.Karlseder J, Broccoli D, Dai Y, Hardy S, de Lange T. Science. 1999;283:1321–1325. doi: 10.1126/science.283.5406.1321. [DOI] [PubMed] [Google Scholar]
- 3.Lundblad V. Mutat Res. 2000;451:227–240. doi: 10.1016/s0027-5107(00)00052-x. [DOI] [PubMed] [Google Scholar]
- 4.Lundblad V, Blackburn E H. Cell. 1993;73:347–360. doi: 10.1016/0092-8674(93)90234-h. [DOI] [PubMed] [Google Scholar]
- 5.Singer M S, Gottschling D E, Wotton D, Shore D. Science. 1994;266:404–409. doi: 10.1126/science.7545955. [DOI] [PubMed] [Google Scholar]
- 6.Johnson F B, Marciniak R A, McVey M, Stewart S A, Hahn W C, Guarente L. EMBO J. 2001;20:905–913. doi: 10.1093/emboj/20.4.905. [DOI] [PMC free article] [PubMed] [Google Scholar]
- 7.Teng S C, Zakian V A. Mol Cell Biol. 1999;19:8083–8093. doi: 10.1128/mcb.19.12.8083. [DOI] [PMC free article] [PubMed] [Google Scholar]
- 8.Teng C S, Chang J, McCowan B, Zakian A V. Mol Cell. 2000;6:947–952. doi: 10.1016/s1097-2765(05)00094-8. [DOI] [PubMed] [Google Scholar]
- 9.Chen Q, Ijpma A, Greider C W. Mol Cell Biol. 2001;21:1819–1827. doi: 10.1128/MCB.21.5.1819-1827.2001. [DOI] [PMC free article] [PubMed] [Google Scholar]
- 10.Cohen H, Sinclair D A. Proc Natl Acad Sci USA. 2001;98:3174–3179. doi: 10.1073/pnas.061579598. [DOI] [PMC free article] [PubMed] [Google Scholar]
- 11.Gasch A P, Spellman P T, Kao C M, Carmel-Harel O, Eisen M B, Storz G, Botstein D, Brown P O. Mol Biol Cell. 2000;11:4241–4257. doi: 10.1091/mbc.11.12.4241. [DOI] [PMC free article] [PubMed] [Google Scholar]
- 12.Prescott J, Blackburn E H. Genes Dev. 1997;11:528–540. doi: 10.1101/gad.11.4.528. [DOI] [PubMed] [Google Scholar]
- 13.Spellman P T, Sherlock G, Zhang M Q, Iyer V R, Anders K, Eisen M B, Brown P O, Botstein D, Futcher B. Mol Biol Cell. 1998;9:3273–3297. doi: 10.1091/mbc.9.12.3273. [DOI] [PMC free article] [PubMed] [Google Scholar]
- 14.Cherry J M, Ball C, Weng S, Juvik G, Schmidt R, Adler C, Dunn B, Dwight S, Riles L, Mortimer R K, Botstein D. Nature (London) 1997;387:67–73. [PMC free article] [PubMed] [Google Scholar]
- 15.DeRisi J L, Iyer V R, Brown P O. Science. 1997;278:680–686. doi: 10.1126/science.278.5338.680. [DOI] [PubMed] [Google Scholar]
- 16.Eisen M B, Spellman P T, Brown P O, Botstein D. Proc Natl Acad Sci USA. 1998;95:14863–14868. doi: 10.1073/pnas.95.25.14863. [DOI] [PMC free article] [PubMed] [Google Scholar]
- 17.Wyrick J J, Holstege F C, Jennings E G, Causton H C, Shore D, Grunstein M, Lander E S, Young R A. Nature (London) 1999;402:418–421. doi: 10.1038/46567. [DOI] [PubMed] [Google Scholar]
- 18.Westermann B, Neupert W. Yeast. 2000;16:1421–1427. doi: 10.1002/1097-0061(200011)16:15<1421::AID-YEA624>3.0.CO;2-U. [DOI] [PubMed] [Google Scholar]
- 19.Shore D. Curr Opin Genet Dev. 2001;11:189–198. doi: 10.1016/s0959-437x(00)00178-7. [DOI] [PubMed] [Google Scholar]
- 20.Zhou J, Hidaka K, Futcher B. Mol Cell Biol. 2000;20:1947–1955. doi: 10.1128/mcb.20.6.1947-1955.2000. [DOI] [PMC free article] [PubMed] [Google Scholar]
- 21.Brigati C, Kurtz S, Balderes D, Vidali G, Shore D. Mol Cell Biol. 1993;13:1306–1314. doi: 10.1128/mcb.13.2.1306. [DOI] [PMC free article] [PubMed] [Google Scholar]
- 22.Chua P R, Roeder G S. Genes Dev. 1997;11:1786–1800. doi: 10.1101/gad.11.14.1786. [DOI] [PubMed] [Google Scholar]
- 23.Conrad M N, Dominguez A M, Dresser M E. Science. 1997;276:1252–1255. doi: 10.1126/science.276.5316.1252. [DOI] [PubMed] [Google Scholar]
- 24.Thompson D A, Stahl F W. Genetics. 1999;153:621–641. doi: 10.1093/genetics/153.2.621. [DOI] [PMC free article] [PubMed] [Google Scholar]
- 25.Cho R J, Campbell M J, Winzeler E A, Steinmetz L, Conway A, Wodicka L, Wolfsberg T G, Gabrielian A E, Landsman D, Lockhart D J, Davis R W. Mol Cell. 1998;2:65–73. doi: 10.1016/s1097-2765(00)80114-8. [DOI] [PubMed] [Google Scholar]
- 26.Kyrion G, Liu K, Liu C, Lustig A J. Genes Dev. 1993;7:1146–1159. doi: 10.1101/gad.7.7a.1146. [DOI] [PubMed] [Google Scholar]
- 27.Jelinsky S A, Samson L D. Proc Natl Acad Sci USA. 1999;96:1486–1491. doi: 10.1073/pnas.96.4.1486. [DOI] [PMC free article] [PubMed] [Google Scholar]
- 28.Gasch A P, Huang M, Metzner S, Botstein D, Elledge S J, Brown P O. Mol Biol Cell. 2001;12:2987–3003. doi: 10.1091/mbc.12.10.2987. [DOI] [PMC free article] [PubMed] [Google Scholar]
- 29.Lee S E, Pellecioli A, Demeter J, Vaze M P, Gasch A P, Malkova A, Brown P O, Botstein D, Stearns T, Foiani M, Haber J E. Biological Responses to DNA Damage. Vol. 65. Plainview, NY: Cold Spring Harbor Lab. Press; 2000. pp. 303–314. [DOI] [PubMed] [Google Scholar]
- 30.Huang M, Elledge S J. Biological Responses to DNA Damage. Vol. 65. Plainview, NY: Cold Spring Harbor Lab. Press; 2000. pp. 413–421. [DOI] [PubMed] [Google Scholar]
- 31.Huang M, Zhou Z, Elledge S J. Cell. 1998;94:595–605. doi: 10.1016/s0092-8674(00)81601-3. [DOI] [PubMed] [Google Scholar]
- 32.Jelinsky S A, Estep P, Church G M, Samson L D. Mol Cell Biol. 2000;20:8157–8167. doi: 10.1128/mcb.20.21.8157-8167.2000. [DOI] [PMC free article] [PubMed] [Google Scholar]
- 33.Church C, Chapon C, Poyton R O. J Biol Chem. 1996;271:18499–18507. doi: 10.1074/jbc.271.31.18499. [DOI] [PubMed] [Google Scholar]
- 34.Estruch F. FEMS Microbiol Rev. 2000;24:469–486. doi: 10.1111/j.1574-6976.2000.tb00551.x. [DOI] [PubMed] [Google Scholar]
- 35.Francois J, Parrou J L. FEMS Microbiol Rev. 2001;25:125–145. doi: 10.1111/j.1574-6976.2001.tb00574.x. [DOI] [PubMed] [Google Scholar]
- 36.Sherlock G, Hernandez-Boussard T, Kasarskis A, Binkley G, Matese J C, Dwight S S, Kaloper M, Weng S, Jin H, Ball C A, et al. Nucleic Acids Res. 2001;29:152–155. doi: 10.1093/nar/29.1.152. [DOI] [PMC free article] [PubMed] [Google Scholar]
- 37.Greenwell P W, Kronmal S L, Porter S E, Gassenhuber J, Obermaier B, Petes T D. Cell. 1995;82:823–829. doi: 10.1016/0092-8674(95)90479-4. [DOI] [PubMed] [Google Scholar]
- 38.Morrow D M, Tagle D A, Shiloh Y, Collins F S, Hieter P. Cell. 1995;82:831–840. doi: 10.1016/0092-8674(95)90480-8. [DOI] [PubMed] [Google Scholar]
Associated Data
This section collects any data citations, data availability statements, or supplementary materials included in this article.