



Abstract
The Internet of Things (IoT) plays a significant part in the healthcare field. The growth of smart devices, smart sensors, and advanced lightweight communication protocols has created an opportunity to connect medical devices for monitoring biomedical signals and identifying patients’ illnesses without human involvement, known as the Internet of Medical Things (IoMT). The IoMT enables a medical method to connect various smart devices, such as hospital assets, wearable sensors, and medical examination instruments, to create an information platform. In recent times, the IoMT has been extensively utilized in various areas, including disease diagnosis, smart hospitals, infectious disease tracking, and remote health monitoring. Still, safety is one of the key requirements for the success of IoMT systems. Thus, at present, deep learning (DL) is considered a safe IoMT system, as it can enhance the system’s performance. In this manuscript, the Ensemble of Deep Learning and Metaheuristic Optimisation algorithms for the Critical Health Monitoring (EDLMOA-CHM) technique is proposed. The EDLMOA-CHM technique aims to develop and evaluate effective methods for monitoring health conditions in the IoMT to enhance healthcare system security and patient safety. Initially, the Z-score normalization method is employed in the data pre-processing step to clean, transform, and organize raw data into an appropriate format. For the feature selection process, the binary grey wolf optimization (BGWO) model is employed to identify and retain the most significant features in the dataset. The classification process utilizes ensemble models, including the Temporal Convolutional Network (TCN), the Attention-based Bidirectional Gated Recurrent Unit (A-BiGRU), and the Hybrid Deep Belief Network (HDBN) techniques. To further optimize model performance, the pelican optimization algorithm (POA) is utilized for hyperparameter tuning to ensure that the optimum hyperparameters are chosen for enhanced accuracy. To demonstrate the improved performance of the EDLMOA-CHM model, a comprehensive experimental analysis is conducted using the healthcare IoT dataset. The comparison analysis of the EDLMOA-CHM model demonstrated a superior accuracy value of 99.56% over existing techniques.
Keywords: Critical health monitoring, Internet of medical things, Ensemble deep learning, Metaheuristic optimisation algorithm, Feature selection
Subject terms: Computer science, Information technology
Introduction
Human health is crucial for leading a peaceful and prosperous life. As defined by the World Health Organisation (WHO), health is a state of physical and psychological well-being, free from disease and disability. Healthcare involves improving or maintaining health through the prevention, diagnosis, and treatment of sickness and wounds1. The conventional healthcare system often relies on manual handling and recording of patient data, case histories, diagnostics, medications, billing, and drug inventory, which can lead to human errors and negatively impact patient care. IoT-driven smart healthcare minimizes these errors and assists doctors in diagnosing illnesses more accurately and efficiently by connecting all crucial monitoring devices over a network with a decision support system2. Medical devices that can exchange data over a network without needing human-to-computer or human-to-human communication are known as the IoMT. Currently, IoMT is an essential technological domain in the healthcare field. It includes a network of interconnected medical networks and devices that gather, analyze, and share health data3. This permits remote monitoring, diagnosis, and treatment of patients, transforming traditional healthcare services. An IoMT is an intelligent system mainly composed of sensors and electronic components to capture patient’s biomedical signals, a processing unit to inspect the signal, a network module to send the data through a network, a shortage unit either for short-term or long-term use, and a display system with artificial intelligence (AI) techniques to support decision-making as per the doctor’s needs4.
Despite its advantages, securing IoMT devices and healthcare infrastructures remains a key concern. The medical data in IoMT must be safeguarded throughout all stages, including collection, transmission, and storage5. IoMT has significantly transformed the healthcare field by offering personalized and targeted treatments. The widespread use of medical devices in worldwide healthcare settings has brought several benefits6. However, it has also raised significant concerns about privacy and security. Unlike other systems, IoMT can directly impact patients’ lives and raise privacy issues if personal identities are exposed. Therefore, ensuring security is essential for the effective operations of IoMT systems7. The current healthcare setups collect and handle a large volume of critical and frequent medical data, making important decisions based on it8. Even if they can’t fully access the clinic’s network, they may still illegally retrieve private and sensitive medical information. The healthcare systems and devices can result in serious physical harm and dangerous situations for patients9. For this reason, protecting privacy has become a key concern in today’s digital age. Conventional security measures are no longer acceptable to improve their tactics and apply sophisticated hacking methods. As a result, DL and machine learning (ML) techniques are used to monitor patients in IoMT10. The development of computing and data handling technologies has enabled the application of DL and ML methods on a broader scale, allowing for the accurate monitoring of health conditions. Figure 1 represents the general structure of IoMT.
Fig. 1.

General architecture of IoMT.
In this manuscript, the Ensemble of Deep Learning and Metaheuristic Optimisation algorithms for the Critical Health Monitoring (EDLMOA-CHM) technique is proposed. The EDLMOA-CHM technique aims to develop and evaluate effective methods for monitoring health conditions in the IoMT to enhance healthcare system security and patient safety. Initially, the Z-score normalization method is employed in the data pre-processing step to clean, transform, and organize raw data into an appropriate format. For the feature selection process, the binary grey wolf optimization (BGWO) model is employed to identify and retain the most significant features in the dataset. The classification process utilizes ensemble models, including the Temporal Convolutional Network (TCN), the Attention-based Bidirectional Gated Recurrent Unit (A-BiGRU), and the Hybrid Deep Belief Network (HDBN) techniques. To further optimize model performance, the pelican optimization algorithm (POA) is utilized for hyperparameter tuning to ensure that the optimum hyperparameters are chosen for enhanced accuracy. To demonstrate the improved performance of the EDLMOA-CHM model, a comprehensive experimental analysis is conducted using the healthcare IoT dataset. The major contribution of the EDLMOA-CHM model is listed below.
The EDLMOA-CHM approach utilizes Z-score normalization to pre-process the raw data, ensuring effective cleaning and transformation by standardizing the data distribution, which enhances the quality and reliability of the input for subsequent feature selection and classification processes.
The EDLMOA-CHM technique integrates the BGWO model to perform effective feature selection, effectively mitigating dimensionality and improving the model’s capability to concentrate on the most relevant and informative features, thereby enhancing overall classification accuracy and computational efficiency.
The EDLMOA-CHM methodology employs ensemble techniques, namely TCN, A-BiGRU, and HDBN approaches, which improve accuracy and robustness through the complementary capabilities of temporal convolution, attention-based sequence learning, and deep belief representation, thereby enhancing overall prediction performance.
The EDLMOA-CHM model employs the POA technique for precise hyperparameter tuning, which systematically searches the parameter space to identify optimal settings, thereby significantly enhancing the predictive accuracy, convergence efficiency, and overall stability of the model during both training and evaluation phases.
The EDLMOA-CHM method presents a novel and robust approach by incorporating BGWO-based feature selection with a POA-tuned ensemble of TCN, A-BiGRU, and HDBN classifiers, which effectively balances feature relevance and model optimization. This integrated strategy improves classification accuracy by employing the strengths of diverse DL methods, while the advanced optimization techniques ensure efficient training and improved generalization across complex datasets.
Literature survey
Babar et al.11 proposed a model by integrating software-defined networking (SDN) with DL techniques. The framework utilizes bidirectional long short-term memory (BiLSTM) method for detecting network attacks and convolutional neural network (CNN) for optimal fog node selection, ensuring efficient data processing and enhanced Quality of Service (QoS) in smart Healthcare-Cyber-Physical Internet of Things (H-CIoT) environments. Lakshmanaprakash et al.12 presented a deep optimized network (DON) model. The approach employs coot optimized feature selection (COFS) to improve data relevance, and a convoluted recurrent attention network (CRAN) whose hyperparameters are fine-tuned using the Cray Fish Optimization (CFO) method for high-accuracy classification. Jiang et al.13 introduced a privacy-preserving, high-accuracy emotion recognition framework using electroencephalography (EEG) signals. The model also integrates a fuzzy ensemble-based federated learning (FL) model incorporating temporal convolutional network (TCN), long short-term memory (LSTM), and gated recurrent unit (GRU), along with a Gompertz function-based fuzzy ranking mechanism and an asynchronous dropout strategy to ensure secure and efficient model aggregation. Baseer et al.14 presented a robust coronary artery disease prediction model by incorporating the IoMT with AI. It utilizes TabNet for efficient feature selection and extraction, and CatBoost for accurate classification of heart disease risks using real-time physiological data from IoMT-enabled devices.
Ramani et al.15 introduced a comprehensive healthcare framework named Optimized Data Management and Secured Federated Learning (ODMSM-FL) methodology, which integrates FL, blockchain (BC), and decentralized data management. Ali et al.16 recommended a new hybrid DL-assisted homomorphic encryption (HE) technique for Industrial IoMT (IIoMT) for dealing with those difficulties employing a consortium BC. Incorporating HE alongside the recommended IIoMT device is a key achievement of this study. Ashok and Gopikrishnan17 presented a dynamically reconfigurable BC-based model. The model utilizes elephant herding optimization (EHO) and grey wolf optimization (GWO) methodologies to continuously optimize encryption and hashing parameters, ensuring robust protection against diverse attack types while maintaining network performance. Shukla et al.18 improved health monitoring and prediction in the IoMT by incorporating a hybrid hierarchical DL technique with metaheuristic optimization techniques. It utilizes the self-regularized quantum coronavirus optimization algorithm (SQCOA) model for effective feature selection, integrated with optimized LSTM (OLSTM) and hierarchical convolutional spiking neural network (HCSNN) technique for accurate feature learning and prediction. Table 1 summarizes the key techniques, methodologies, datasets, and performance results of the existing studies on critical health monitoring.
Table 1.
Details of the dataset.
| Health Status | No. of Samples |
|---|---|
|
Unhealthy (in need of medical attention) |
113 |
| Healthy | 87 |
| Total Samples | 200 |
Table 1.
Summary of existing studies highlighting key techniques, methodologies, datasets, and performance outcomes across related research.
| Reference Number | Objective | Method | Dataset | Measures |
|---|---|---|---|---|
| Babar et al.11 |
To develop a secure, intelligent, and efficient SDN-driven DL framework |
SDN, BiLSTM, DL, CNN |
CICIDS2019 Dataset |
Accuracy, Precision, Recall, F1-Score, TPR, FNR |
|
Lakshmanaprakash et al.12 |
To develop an IoMT- enabled DON model for efficient disease diagnosis and real- time health monitoring |
COFS, CRAN, CFO |
Open-Source Medical Datasets |
Accuracy, Efficiency, Time Complexity |
| Jiang et al.13 |
To develop a privacy-preserving and accurate EEG- based emotion recognition system using FL |
TCN, LSTM, GRU, Gompertz Fuzzy Rank, Asynchronous Dropout Algorithm |
GAMEEMO, SEED, DEAP |
Accuracy, F1-Score |
| Baseer et al.14 |
To develop a predictive model for coronary artery disease using AI and IoMT |
IoMT-based Data Acquisition, TabNet, CatBoost, Real-Time Data Processing |
Diverse Patient Profiles |
Accuracy, Interpretability, Prediction Speed |
| Ramani et al.15 |
To develop an optimized and secure data management framework |
ODMSM-FL, BC- based Security, Decentralized Architecture |
IoMT-Generated Medical Data |
Accuracy, Latency, Security, Throughput, Convergence Rate |
| Ali et al.16 |
The objective is to develop a secure and efficient hybrid DL model |
Hybrid DL, Homomorphic Encryption, Consortium BC, Edge-Cloud Collaboration |
Encrypted EMR Data |
Security, Efficiency, Latency |
|
Ashok and Gopikrishnan17 |
To develop a dynamically reconfigurable hybrid metaheuristic BC model |
EHO, GWO, BC, Dual Fitness Functions |
Simulated IoMT Attack Scenarios |
Attack Detection Speed, Throughput, Packet Delivery Ratio |
| Shukla et al.18 |
To develop a hybrid hierarchical DL with optimization models |
SQCOA, OLSTM, HCSNN |
IoMT sensor data |
Accuracy, Prediction Performance |
Despite the improvements in DL and FL for smart H-CIoT and IIoMT systems, various limitations still exist. Several techniques depend on accuracy but often overlook computational efficiency and scalability in real-world heterogeneous networks. Data privacy and security mechanisms, although incorporated, need additional robustness against growing threats. Furthermore, various methods rely on centralized training or assume ideal network conditions, restricting their adaptability. The research gap lies in addressing these challenges by developing lightweight, secure, and scalable models that can effectively process data in real-time across diverse IoMT environments while maintaining data privacy and resilience.
Proposed methodology
In this manuscript, the EDLMOA-CHM technique is proposed. The EDLMOA-CHM technique aims to develop and evaluate effective methods for monitoring health conditions in the IoMT, enhancing healthcare system security and patient safety. To accomplish this, the EDLMOA-CHM method comprises several stages, including data pre-processing, feature selection, ensemble classification process, and parameter tuning of the model. Figure 2 depicts the overall working flow procedure of the EDLMOA-CHM method.
Fig. 2.
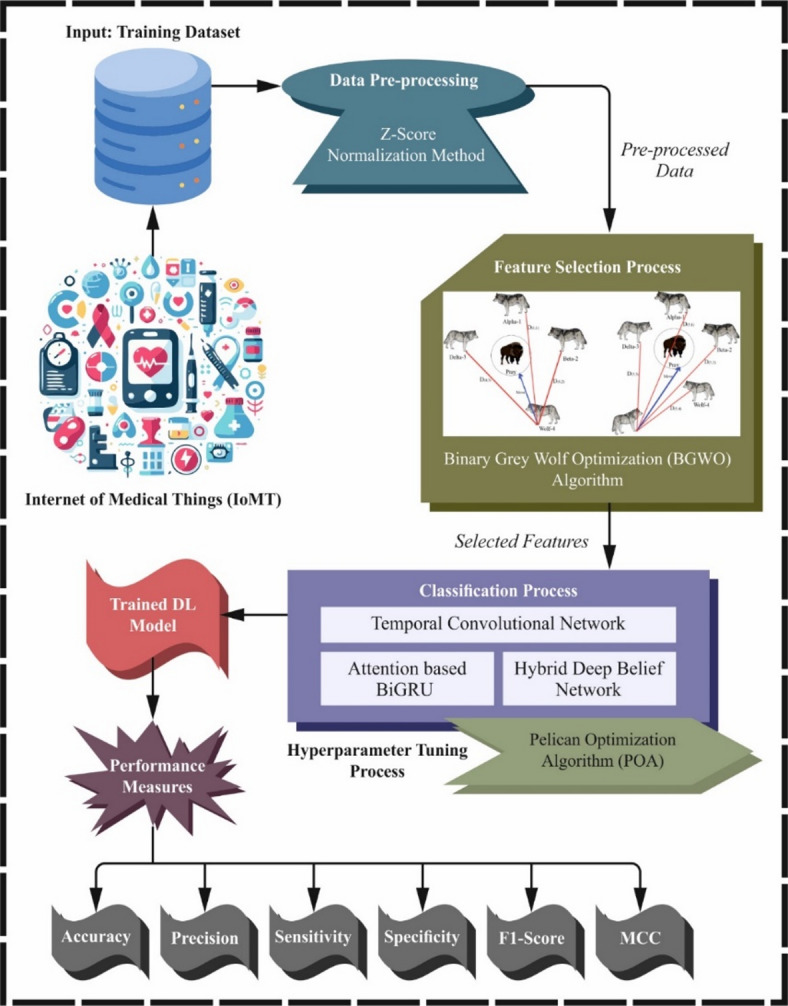
Overall working flow procedure of EDLMOA-CHM model.
Data pre-processing stage
Initially, the Z-score normalization method is employed to transform and organize raw data into an appropriate format19. This model is chosen for its capability to standardize features by centring them around the mean with a unit standard deviation, which effectively assists in handling data with varying scales. This technique ensures that extreme values do not disproportionately influence the scaling process, unlike methods such as min-max scaling. The model is also less sensitive to outliers, resulting in enhanced convergence during model training and improved stability of learning algorithms. Additionally, it maintains the distribution shape of the data, making it appropriate for models that usually assume distributed input features. Overall, Z-score normalization offers a balanced and reliable method for preparing data, resulting in more accurate and robust model performance compared to other scaling techniques.
The measure of standard errors was represented by the Z-Score, a conventional standardization and normalization model, which specifies that the raw data value is the deviation from the complete population mean. It was optimally positioned between  and
and  . The dataset was standardized to the previously specified scale with different sizes. The z-score is a device used for stabilizing data. To compute the rating, remove the complete population average from the unrefined data point and split the outcome by the standard deviation. The outcome preferably ranges from to , specifying the sum of standard deviations that a point diverges from the mean, as defined in Eq. (1), where y denotes the median value of a particular sample,
  is the standard deviation, and
  is the median.
 |
1 |
Here,  represents the standardized value of a data point, where is the mean and is the standard deviation of the dataset.
BGWO-based feature selection process
For the feature selection process, the BGWO technique is employed20. This model is chosen for its robust balancing capability between exploration and exploitation, and is motivated by the social hierarchy and hunting behaviour of grey wolves. This method effectually avoids local optima and converges faster, which is critical for high-dimensional datasets, unlike other optimization techniques. Its binary nature allows for the seamless handling of discrete feature selection problems, making it more suitable than continuous optimization methods. Moreover, BGWO requires fewer control parameters and is computationally efficient, resulting in mitigated complexity while maintaining high accuracy. These merits make BGWO a robust and reliable choice for choosing the most relevant features, ultimately improving the performance and interpretability of the model.
The GWO lengthens the continuous GWO (CGWO) to address different problem areas, such as feature selection. Solution vectors in BGWO are dual and restricted to the points which denote the searching region. The alpha  , beta (
 ), and delta
  wolves are updated in every place of the wolves, suggesting the best three solutions discovered thus far. The updated equations for all wolves are directed by the location vectors
  ,
,  , and
, and  and are specified by:
 |
2 |
Whereas crossover operations among binary solutions  were specified by the Crossover symbols
  . The inspiration of alpha, beta, and delta wolves on the
  movement is characterized by vectors
  which are described as demonstrated:
 |
3 |
Here,  refers to the alpha wolf’s location vector in dimension d,
  means binary step, which is computed below:
 |
4 |
Now,  denotes a continuous-valued step size in dimension d described by the sigmoidal function, and
  denotes a randomly generated number extracted from the uniform distribution:
 |
5 |
Here,  and
and  have values derived from another equation. To attain BGWO, the delta, alpha, and beta solution assistants are incorporated using the stochastic crossover model. For all dimensions, the output of the crossover can be determined by:
 |
6 |
Whereas the dual values for 1st, 2nd, and 3rd solutions in dimensions d are  , and
, and  , correspondingly, and the is once again a randomly generated number from the uniform distribution. Discovering a feature subset that provides the best trade-off among classification performance and the nominated feature counts becomes very important, as the BGWO tactic plays a crucial role.
The fitness function (FF) is projected to have a balance among the nominated feature amounts in all solutions (least) and the classification precision (highest) attained by employing these preferred features. Equation (7) symbolizes the FF to calculate a solution.
 |
7 |
Here,  characterizes the classification error rate.
  refers to the designated subset cardinality, and
  denotes the complete feature set;
  and are dual parameters similar to the significance of classifier excellence and subset length.
Ensemble classification process
Afterwards, the ensemble models such as TCN, GRU, and HDBN are employed for the classification process. The ensemble techniques are chosen for their robust capability, where TCN captures long-range temporal dependencies, GRU efficiently handles sequential data with reduced complexity, and HDBN outperforms in learning hierarchical feature representations. Together, they provide a comprehensive and robust framework that improves classification accuracy and generalization compared to using individual models alone.
TCN model
CNNs are typically designed for processing grid-like input instances, such as images. By substituting the commonly used 2D convolutional kernel with a 1D kernel, CNNs21. The effective CNN for sequence modelling is called temporal CNN (TCN). With every successive layer, the rate of dilation  doubled, and the input sequence’s middle value is skipped through the convolution. This idea enhances the maximum input length examined and addressed in the receptive area P. This model inspects longer sequences by using dilation, while maintaining smaller model dimensions.
 |
8 |
Whereas  denotes the convolutional filter’s kernel size, X the number of TCN stacks, and the rate of dilation. It includes the single block
  and a kernel size
  with dilation
  .
.
Attention-based BiGRU model
GRU is the most effective type of RNN, overcoming several concerns related to conventional RNNs, including the issues of exploding and vanishing gradients during training22. GRU can hold a small framework in contrast to RNN, combining the ‘input’ and ‘forget’ gates into a single ‘update’ gate, making it less computationally intensive while simultaneously being able to acquire dependencies through longer sequences. This efficacy makes GRU particularly beneficial for modelling sequential data, time series, and other applications where long-term and short-term dependencies are essential. In this context, LSTM and deeper bi-directional RNNs, such as GRU, are employed for recognizing temporal dependencies.
BI-GRU is a variant of the fundamental GRU, which concurrently considers previous and upcoming context during training. Bidirectional encoding enhances the methodology for examining sequential information because it reveals dependencies among the data, which cannot be seen in one-directional encoding. BI-GRU can be improved by incorporating data from both sequence ends, as the shortcomings of a unidirectional technique have been complemented by data from the other sequence end. Thus, BI-GRU can acquire more significant data.
Nevertheless, a single GRU layer is weaker and acquires a modest temporal pattern. This drawback is addressed in the Stacked GRU technique, which employs multiple layers of GRU. Within the Stacked GRU, the output of every layer is passed on to the succeeding layer, where learning aspects are enhanced, and layers can study deep relations in the information. A similar unit also facilitates the methodology for learning more from the hierarchical form.
The attention-based BiGRU method combines BiGRU with an attention mechanism (AM) to focus on the most substantial portions of the input sequence. In contrast to what occurs in static techniques, not every time step contributes to a similar output. The aspects aid in offering diverse significance to steps, permitting the method to concentrate on moments which is more significant for the final decision. While pairing with BI-GRU, the AM could enhance the mechanism, allowing it to weigh the more essential inputs. The AM enables the dynamic selection of unfocused and focused parts of an input, thereby improving interpretability and precision. Figure 3 depicts the structure of the attention-based BiGRU model.
Fig. 3.

Structure of the attention-based Bi-GRU model.
HDBN model
The HDBN model is employed to remove hierarchical and higher-level representations from the input data. The primary step involves the complete utilization of supervised and unsupervised learning to accurately identify composite relationships and designs that occur in data23. Specifically, the primary objective is to build a strong representation through unsupervised pre-training of RBMs with supervised fine-tuning.
HDBN is constructed as an RBM stack, where each RBM is located at a specific level of the hierarchy. Pre-training is performed layer-wise, beginning with the raw input and continuing deep within the network. Every RBM includes a visible layer  which demonstrates an input, and a hidden layer
  . The dual layers are linked through a probability-based function.
The energy function for the particular RBM can be specified as:
 |
9 |
Whereas,  and
and  represent hidden and visible units, respectively.
  refers to weight linking to
 and
and  denote biased terms for the hidden and visible units.
  denotes the RBM’s parameters. The combined likelihood distribution of v and h is demonstrated utilizing the distribution of Boltzmann:
 |
10 |
Whereas Z denote the partition function guaranteeing standardization:
 |
11 |
In pre-training, each RBM is trained individually using Contrastive Divergence  to minimize divergence. The parameters
  are upgraded iteratively:
 |
12 |
Whereas  denotes the rate of learning, and the terms
  and
and  signify expectation in terms of the model and data distributions, correspondingly.
Afterwards, the RBMs are pre-trained, and then the complete stack is perfected through the use of supervised learning. The biases  and weights are modified by reducing the supervised loss function:
 |
13 |
Here,  refers to the true label, and
  denotes forecast output,
  denotes a term of regularisation.
POA-based parameter tuning model
To further optimize model performance, the POA is utilized for hyperparameter tuning to ensure that the optimum hyperparameters are chosen for enhanced accuracy24. This technique is selected for its robust global search capabilities and fast convergence rate, which effectively avoids premature convergence issues common in other optimization methods. The model demonstrates excellence in striking a balance between adaptive exploration and exploitation, ensuring effective hyperparameter optimization. This methodology also illustrates higher accuracy and robustness in tuning complex ensemble models compared to conventional techniques. The model is also suitable for enhancing classification results while minimizing computational overhead.
The POA is a population-based optimizer model, whereas pelicans symbolize possible solutions within the optimizer environment. Every population member recommends values for the optimizer variables, depending on their locations, which are primarily randomized within predetermined lower and upper limits. This initialization procedure initiates the hunt for the best solutions, directed by the constraints of the problem, as defined by Eq. (14):
 |
14 |
Now,  characterizes the
  variable value for the candidate solution. N signifies the complete population member counts (pelicans). M represents the optimization variable counts. displays a randomly generated number that gives values between
  ,1).
,1).  and
and  characterize the upper and lower bounds, correspondingly, for
  variable. The population is structured into a matrix in Eq. (15). This systematic model enables empirical evaluation and manipulation of each solution in the optimizer procedure.
 |
15 |
During this method, the pelican’s population is characterized by the matrix X, where  explicitly indicates the location of the pelican. The model imitates the attacking and hunting behaviours of pelicans to upgrade the candidate solution proficiently. These behaviours are incorporated towards the best areas.
Step 1- Behaviour of hunting Eq. (16): The novel location of the pelican in dimension j in stage 1 is estimated as:
 |
16 |
Whereas  specifies the novel location of the pelican in dimension j (Stage 1).
  represents the hunting position in dimension
  I describe a randomly formed number, which captures both 1 and 2.
  indicates the objective function value at position
 describes the value of the objective function at
  A randomly generated number between ,1) is signified by . This stage estimates nearby points based on the pelican’s current location to direct the search towards an enhanced solution.
Step 2- Behaviour of attacking (Eq. (17): The novel location of the pelican in dimension j in stage 2 is considered as:
 |
17 |
Now,  signifies the new location of the pelican in the dimension (Stage 2). R indicates a constant. t means the present iteration counter. T designates maximal iteration counts.
  exhibits a feature that decreases the vicinity radius in time, guaranteeing convergence.
This stage mimics the attacking behaviour of the pelican, allowing the model to dynamically address the search area while gradually narrowing the search towards the best areas.
Position Updated Mechanism (Eq. 18): After Stage 2, the model estimates whether to reject or accept the novel location according to the objective function value:
 |
18 |
Whereas  illustrates the new position of the pelican after stage 2.
  denotes an objective function value at the original position
 means the value of the objective function at the present location
  . This updated method ensures that the model only receives locations that improve the solution, thereby preserving sensitivity to changes in the search region while facilitating convergence.
The fitness choice is a significant feature prompting the performance of the POA model. The procedure of hyperparameter selection contains the solution encoding method to measure the efficiency of the candidate solution. The POA method prioritizes precision as a key standard for designing FF, as demonstrated.
 |
19 |
 |
20 |
Here,  and
and  illustrate the true and false positive values.
Experimental outcome
The performance validation of the EDLMOA-CHM model is examined under the healthcare IoT dataset25. It comprises 200 total instances under dual health status, such as unhealthy and healthy, as portrayed in Table 1. There are 13 features, but only 10 are chosen.
Figure 4 presents the correlation matrix generated by the EDLMOA-CHM approach. The outcomes state that the EDLMOA-CHM method efficiently identifies and classifies two classes.
Fig. 4.

Correlation matrix of EDLMOA-CHM model.
Figure 5 displays a comprehensive set of histograms and kernel density estimation (KDE) plots for various features used in attack detection within an IoMT dataset. Each subplot contrasts distributions for two classes, likely 0 for healthy and 1 for abnormal conditions.
Fig. 5.

Histogram and KDE outcome of EDLMOA-CHM model.
Figure 6 illustrates the confusion matrices generated by the EDLMOA-CHM approach across various epochs. The results imply that the EDLMOA-CHM technique accurately detects and classifies healthy and unhealthy classes.
Fig. 6.

Confusion matrices of EDLMOA-CHM technique (a-f), Epochs 500–3000.
The health monitoring detection of EDLMOA-CHM approach is verified under different epochs in Table 2; Fig. 7. On 500 epochs, the EDLMOA-CHM approach achieves an average  ,
,  ,
,  ,
,  ,
,  , and
, and  of 95.93%, 95.93%, 95.93%, 95.93%, 95.93% and 91.86%, respectively. Moreover, for 1500 epochs, the EDLMOA-CHM approach achieves an average , , , , , and of 97.66%, 97.32%, 97.66%, 97.66%, 97.47%, and 94.98%, respectively. Also, for 2500 epochs, the EDLMOA-CHM approach achieves an average , , , , , and of 98.67%, 98.33%, 98.67%, 98.67%, 98.48% and 97.01%, respectively. In addition, for 3000 epochs, the EDLMOA-CHM model achieves an average , , , , , and of 99.56%, 99.43%, 99.56%, 99.56%, 99.49%, and 98.99%, respectively.
Table 2.
Health monitoring recognition of EDLMOA-CHM model under distinct epochs.
| Classes |

|

|

|

|
|
|
|---|---|---|---|---|---|---|
| Epoch − 500 | ||||||
| Unhealthy | 96.46 | 96.46 | 96.46 | 95.40 | 96.46 | 91.86 |
| Healthy | 95.40 | 95.40 | 95.40 | 96.46 | 95.40 | 91.86 |
| Average | 95.93 | 95.93 | 95.93 | 95.93 | 95.93 | 91.86 |
| Epoch − 1000 | ||||||
| Unhealthy | 96.46 | 97.32 | 96.46 | 96.55 | 96.89 | 92.89 |
| Healthy | 96.55 | 95.45 | 96.55 | 96.46 | 96.00 | 92.89 |
| Average | 96.51 | 96.39 | 96.51 | 96.51 | 96.44 | 92.89 |
| Epoch − 1500 | ||||||
| Unhealthy | 96.46 | 99.09 | 96.46 | 98.85 | 97.76 | 94.98 |
| Healthy | 98.85 | 95.56 | 98.85 | 96.46 | 97.18 | 94.98 |
| Average | 97.66 | 97.32 | 97.66 | 97.66 | 97.47 | 94.98 |
| Epoch − 2000 | ||||||
| Unhealthy | 96.46 | 100.00 | 96.46 | 100.00 | 98.20 | 96.03 |
| Healthy | 100.00 | 95.60 | 100.00 | 96.46 | 97.75 | 96.03 |
| Average | 98.23 | 97.80 | 98.23 | 98.23 | 97.98 | 96.03 |
| Epoch − 2500 | ||||||
| Unhealthy | 97.35 | 100.00 | 97.35 | 100.00 | 98.65 | 97.01 |
| Healthy | 100.00 | 96.67 | 100.00 | 97.35 | 98.31 | 97.01 |
| Average | 98.67 | 98.33 | 98.67 | 98.67 | 98.48 | 97.01 |
| Epoch − 3000 | ||||||
| Unhealthy | 99.12 | 100.00 | 99.12 | 100.00 | 99.56 | 98.99 |
| Healthy | 100.00 | 98.86 | 100.00 | 99.12 | 99.43 | 98.99 |
| Average | 99.56 | 99.43 | 99.56 | 99.56 | 99.49 | 98.99 |
Fig. 7.

Average values of EDLMOA-CHM technique (a-f), Epochs 500–3000.
In Fig. 8, the training (TRNG) and validation (VALID) outcomes of the EDLMOA-CHM method under Epoch 3000 are shown. The figure emphasized that both values display an increasing trend, indicating the EDLMOA-CHM approach’s efficiency with upgraded performance across numerous iterations. Moreover, both remain close to the epochs, specifying marginal overfitting and demonstrating the EDLMOA-CHM approach’s boosted efficiency.
Fig. 8.
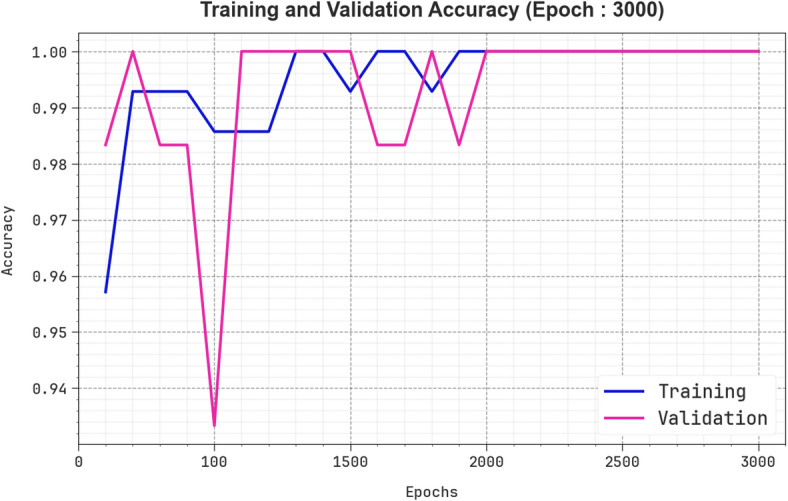
curve of EDLMOA-CHM method under Epoch 3000.
In Fig. 9, the TRNG loss and VALID loss graphs for the EDLMOA-CHM methodology are presented at Epoch 3000. It is indicated that both values exhibit a falling trend, reflecting the effectiveness of the EDLMOA-CHM approach in stabilizing the trade-off. The persistent fall further confirms the EDLMOA-CHM approach’s enhanced performance.
Fig. 9.

Loss curve of EDLMOA-CHM method under Epoch 3000.
In Fig. 10, the precision-recall (PR) curve investigation of the EDLMOA-CHM approach, conducted under Epoch 3000, provides insight into its performance by mapping Precision against Recall for each class. The figure demonstrates that the EDLMOA-CHM technique consistently achieves elevated PR values across various classes, indicating its ability to retain a significant proportion of true positive predictions among all positive predictions (precision), while also capturing a substantial portion of actual positives (recall). The stable increase in PR values across all classes demonstrates the efficacy of the EDLMOA-CHM approach during the classification step.
Fig. 10.
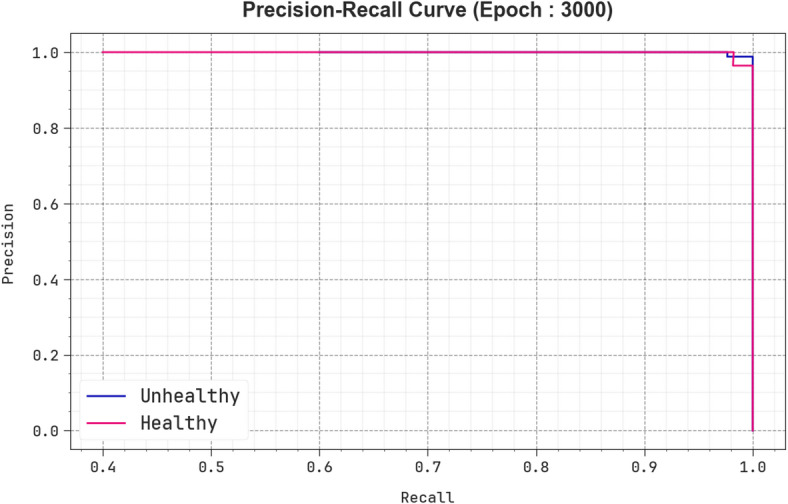
PR curve of EDLMOA-CHM method under Epoch 3000.
In Fig. 11, the ROC curve of the EDLMOA-CHM approach is studied under Epoch 3000. The outcomes indicate that the EDLMOA-CHM methodology achieves improved ROC values across all classes, demonstrating significant skill in distinguishing between them. This consistent pattern of superior ROC values across numerous classes indicates the skilful performance of the EDLMOA-CHM methodology in forecasting classes, highlighting its strong nature in the classification process.
Fig. 11.
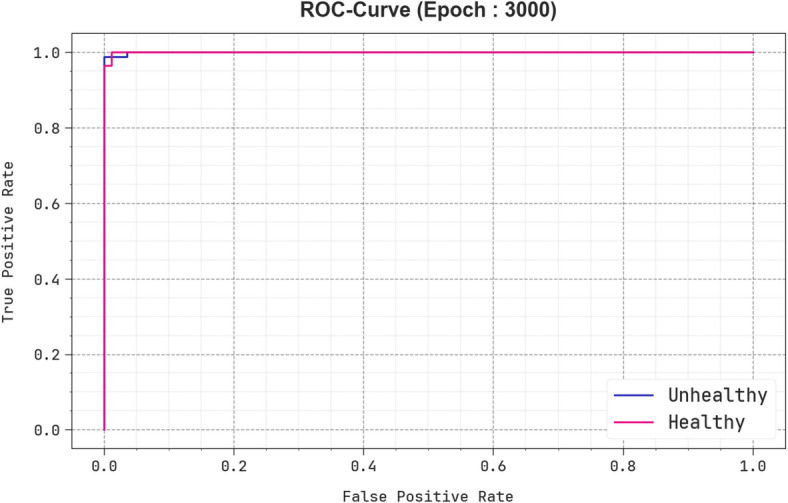
ROC curve of EDLMOA-CHM method under Epoch 3000.
Table 3 presents a comparative analysis of the EDLMOA-CHM approach with existing methods across several key measures.
Table 3.
Comparative analysis of EDLMOA-CHM model with existing approaches.
| Approach |

|

|

|

|

|
|---|---|---|---|---|---|
| Traditional FL | 85.82 | 89.76 | 90.28 | 83.40 | 95.38 |
| BC HER | 89.00 | 80.06 | 95.63 | 84.57 | 85.04 |
| DT | 77.78 | 85.33 | 97.89 | 79.02 | 84.52 |
| NB | 81.20 | 86.86 | 86.62 | 98.26 | 85.80 |
| MLP | 81.20 | 96.87 | 93.87 | 98.80 | 87.23 |
| K-means | 75.00 | 92.13 | 91.65 | 84.16 | 81.85 |
| CLSTM | 97.50 | 95.53 | 98.44 | 97.23 | 92.15 |
| EDLMOA-CHM | 99.56 | 99.43 | 99.56 | 99.56 | 99.49 |
Figure 12 illustrates the simulation results of the EDLMOA-CHM method with the present approaches under  , and
, and 26–28. Under , the EDLMOA-CHM method has greater of 99.56%. In contrast, the Traditional FL, BC HER, decision tree (DT), naïve bayes (NB), MLP, K-means, and CLSTM methodologies have achieved low of 85.82%, 89.00%, 77.78%, 81.20%, 81.20%, 75.00%, and 97.50%, correspondingly. Moreover, for , the EDLMOA-CHM method attained a greater of 99.49%, whereas the Traditional FL, BC HER, DT, NB, MLP, K-means, and CLSTM methodologies attained low of 95.38%, 85.04%, 84.52%, 85.80%, 87.23%, 81.85%, and 92.15%, correspondingly.
Fig. 12.

 , and
, and outcome of EDLMOA-CHM model with existing approaches.
Figure 13 depicts and results of the EDLMOA-CHM method using existing models. Under, the EDLMOA-CHM approach has a higher of 99.56%, while the Traditional FL, BC HER, DT, NB, MLP, K-means, and CLSTM techniques have obtained a lower of 90.28%, 95.63%, 97.89%, 86.62%, 93.87%, 91.65%, and 98.44%, respectively. Moreover, based on  the EDLMOA-CHM model has the highest of 99.56% however, the Traditional FL, BC HER, DT, NB, MLP, K-means, and CLSTM methodologies have the least
 of 83.40%, 84.57%, 79.02%, 98.26%, 98.80%, 84.16%, and 97.23%, correspondingly.
Fig. 13.

 and outcome of EDLMOA-CHM model with existing approaches.
In Table 4; Fig. 14, the computation time (CT) of the EDLMOA-CHM approach is compared with that of existing methods. The EDLMOA-CHM approach achieves a lower CT of 6.98 s while the Traditional FL, BC HER, DT, NB, MLP, K-means, and CLSTM approaches attained higher CT of 12.46 s, 24.42 s, 16.21 s, 22.58 s, 11.55 s, 21.46 s, and 11.08 s, respectively.
Table 4.
CT outcome of EDLMOA-CHM technique with existing methods.
| Approach | CT (sec) |
|---|---|
| Traditional FL | 12.46 |
| BC HER | 24.42 |
| DT | 16.21 |
| NB | 22.58 |
| MLP | 11.55 |
| K-means | 21.46 |
| CLSTM | 11.08 |
| EDLMOA-CHM | 6.98 |
Fig. 14.

CT outcome of EDLMOA-CHM technique with existing methods.
Conclusion
In this paper, the EDLMOA-CHM technique is proposed. The EDLMOA-CHM technique aims to develop and evaluate suitable methods for monitoring health conditions in the IoMT, thereby enhancing the healthcare system and improving patient safety. Initially, the Z-score normalization method is employed in the data pre-processing phase to clean, transform, and organize raw data into an appropriate format. For the feature selection process, the BGWO model is employed to identify the most suitable features in a dataset. Afterwards, the ensemble models, namely TCN, the attention-based BiGRU, and HDBN, are used for the classification process. To further optimize model performance, the POA is utilized for hyperparameter tuning to ensure that the optimum hyperparameters are selected for enhanced accuracy. To demonstrate the improved performance of the EDLMOA-CHM model, a comprehensive experimental analysis is conducted using the healthcare IoT dataset. The comparison analysis of the EDLMOA-CHM model demonstrated a superior accuracy value of 99.56% over existing techniques.
Author contributions
Conceptualization, Data curation and Formal analysis, Investigation and Methodology, Funding Support, Project administration and Resources, Supervision, Validation and Visualization, Writing—original draft: Mai Alduailij.
Data availability
The data that support the findings of this study are openly available in the Kaggle repository at https://www.kaggle.com/datasets/ziya07/healthcare-iot-data, reference number25.
Competing interests
The authors declare no competing interests.
Ethics approval
This article does not contain any studies with human participants performed by any of the authors.
Footnotes
Publisher’s note
Springer Nature remains neutral with regard to jurisdictional claims in published maps and institutional affiliations.
References
- 1.Zhang, T. et al. A joint deep learning and internet of medical Things-driven framework for elderly patients. IEEE Access.8, 75822–75832 (2020). [Google Scholar]
- 2.Raj, R. J. S. et al. Optimal feature selection-based medical image classification using a deep learning model in the Internet of Medical Things. IEEE Access8, 58006–58017 (2020).
- 3.Ding, Y. et al. DeepEDN: a deep-learning-based image encryption and decryption network for internet of medical things. IEEE Internet Things J.8 (3), 1504–1518 (2020). [Google Scholar]
- 4.Mohsin, M. K., Almasoodi, A. Y. J. & Qassim, M. Differential equation of COVID-19 with constraint algebraic equation and sustainable health development with applications in neutrosophic environment. Int. J. Neutrosophic Sci. (IJNS)26, 2 (2025).
- 5.Ahmad, S. et al. Deep learning enabled disease diagnosis for secure internet of medical things. Comput. Mater. Continua73, 1 (2022).
- 6.Manickam, P. et al. Artificial intelligence (AI) and internet of medical things (IoMT) assisted biomedical systems for intelligent healthcare. Biosensors12 (8), 562 (2022). [DOI] [PMC free article] [PubMed]
- 7.Pustokhina, I. V. et al. An effective training scheme for deep neural networks in edge computing-enabled Internet of Medical Things (IoMT) systems. IEEE Access8, 107112–107123 (2020).
- 8.Saheed, Y. K. & Arowolo, M. O. Efficient cyber attack detection on the internet of medical things-smart environment based on deep recurrent neural network and machine learning algorithms. IEE Access.9, 161546–161554 (2021). [Google Scholar]
- 9.Almaiah, M. A., Ali, A., Hajjej, F., Pasha, M. F. & Alohali, M. A. A lightweight hybrid deep learning privacy-preserving model for FC-based industrial internet of medical things. Sensors22 (6), 2112 (2022). [DOI] [PMC free article] [PubMed]
- 10.Sleem, A. & Elhenawy, I. Collaborative segmentation of COVID-19 from non-IID topographies in the internet of medical things (IoMT). J. Intell. Syst. Internet Things7, 2 (2022).
- 11.Babar, M. et al. An efficient and hybrid deep learning-driven model to enhance security and performance of healthcare internet of things. IEEE Access (2025).
- 12.Lakshmanaprakash, S., Abirami, A., Madanachitran, R., Mekala, R. & Vaishali, V. H. DON: Deep Optimized Network model based on Coot and Convoluted Recurrent learning algorithms for healthcare monitoring in IoMT systems. Measurement242, 116226 (2025).
- 13.Jiang, W. et al. Fuzzy ensemble-based federated learning for EEG-based emotion recognition in Internet of Medical Things. J. Ind. Inf.Integr.2025, 100789 (2025).
- 14.Baseer, K. K. et al. Healthcare diagnostics with an adaptive deep learning model integrated with the Internet of Medical Things (IoMT) for predicting heart disease. Biomed. Signal Process. Control92, 105988 (2024).
- 15.Ramani, R., Mary, A. R., Raja, S. E. & Shunmugam, D. A. Optimized data management and secured federated learning in the Internet of Medical Things (IoMT) with blockchain technology. Biomed. Signal Process. Control93, 106213 (2024).
- 16.Ali, A. et al. A novel homomorphic encryption and consortium blockchain-based hybrid deep learning model for industrial internet of medical things. IEEE Trans. Netw. Sci. Eng.10 (5), 2402–2418 (2023). [Google Scholar]
- 17.Ashok, K. & Gopikrishnan, S. Improving the security performance of healthcare data in the internet of medical things using a hybrid metaheuristic model. Int. J. Appl. Math. Comput. Sci.33, 4 (2023).
- 18.Shukla, P. K. et al. Attaining an IoMT-based Health monitoring and prediction: a hybrid hierarchical deep learning model and metaheuristic algorithm. Neural Comput. Appl.2023, 1–18 (2023).
- 19.Mhana, A. et al. Strengthening cloud data protection based on a novel cybersecurity framework. Appl. Data Sci. Anal.2025, 155–164 (2025).
- 20.Karadayı Ataş, P. A novel cluster-based binary grey Wolf optimizer to solve the feature selection problem for Uncovering the genetic links between non-Hodgkin lymphomas and rheumatologic diseases. Health Inform. Sci. Syst.13 (1), 1–22 (2025). [DOI] [PMC free article] [PubMed] [Google Scholar]
- 21.Walther, D. et al. Deep learning-driven active sheet positioning using linear actuators in laser beam butt welding of thin steel sheets. J. Adv. Join. Process.2025, 100303 (2025).
- 22.Alhussan, A. A., Metwally, M. & Towfek, S. K. Predicting CO2 emissions with advanced deep learning models and a hybrid Greylag Goose Optimization algorithm. Mathematics13(9), 1481 (2025).
- 23.Prabaharan, G. et al. Optimized disease prediction in healthcare systems using HDBN and CAEN framework. MethodsX2025, 103338 (2025). [DOI] [PMC free article] [PubMed]
- 24.Lari, D. S., Nafar, M., Abbasi, A. R. & Bahmani-Firouzi, B. Probabilistic scheduling of microgrid resilience: Integrating renewables, storage and demand response in unit commitment and reconfiguration. Int. J. Electr. Power & Energy Syst.168, 110710 (2025).
- 25.https://www.kaggle.com/datasets/ziya07/healthcare-iot-data (2024).
- 26.Ali, A. A. et al. Securing electronic health records using blockchain-enabled federated learning for IoT-based smart healthcare. Clinical eHealth (2025).
- 27.Al-Wesabi, F. N. et al. Revolutionizing healthcare: an IoT-driven approach to remote patient health monitoring and management during the pandemic and beyond. Alexandria Eng. J.126, 358–367 (2025). [Google Scholar]
- 28.Wali, G. & Bulla, C. Advancing bionic solution through artificial intelligence in healthcare IoT environment. Procedia Comput. Sci.252, 715–727 (2025). [Google Scholar]
Associated Data
This section collects any data citations, data availability statements, or supplementary materials included in this article.
Data Availability Statement
The data that support the findings of this study are openly available in the Kaggle repository at https://www.kaggle.com/datasets/ziya07/healthcare-iot-data, reference number25.