

Abstract
We have devised an approach to cancer class prediction from gene expression profiling, based on an enhancement of the simple nearest prototype (centroid) classifier. We shrink the prototypes and hence obtain a classifier that is often more accurate than competing methods. Our method of “nearest shrunken centroids” identifies subsets of genes that best characterize each class. The technique is general and can be used in many other classification problems. To demonstrate its effectiveness, we show that the method was highly efficient in finding genes for classifying small round blue cell tumors and leukemias.
The problem of class prediction has recently received a great deal of attention in the context of DNA microarrays. Here the task is to classify and predict the diagnostic category of a sample on the basis of its gene expression profile. A problem of particular importance is the diagnosis of cancer type based on microarray data. Conventional diagnosis of cancer has been based on examination of the morphological appearance of stained tissue specimens in the light microscope. This method is subjective and depends on highly trained pathologists. Microarrays offer hope that cancer classification can be objective and highly accurate, which could provide clinicians with the information to choose the most appropriate forms of treatment. Recent proposals to solve this problem have utilized statistical methods (1–3) and artificial neural networks (4).
The problem of classification by microarrays is challenging because:
there are a large number of inputs (genes) from which to predict classes and a relatively small number of samples, and
it is important to identify which genes contribute most to the classification.
In this paper, we propose a simple approach that performs well and is easy to understand and interpret. Our method has distinct advantages over previous methods, especially when there are more than two classes.
As our motivating example, we analyzed data for small round blue cell tumors (SRBCT) of childhood (4). These data, consisting of expression measurements on 2,308 genes, were obtained from glass-slide cDNA microarrays, prepared according to the standard National Human Genome Research Institute protocol. The tumors are classified as Burkitt lymphoma (BL), Ewing sarcoma (EWS), neuroblastoma (NB), or rhabdomyosarcoma (RMS). A total of 63 training samples and 25 test samples were provided, although five of the latter were not SRBCTs. Using a complex neural network approach, ref. 4 achieved a test error of 0% and identified 96 genes for the classification.
As a starting point, we analyzed these data by the conventional method of nearest-centroid classification (see, e.g., ref. 5). Fig. 1 (light grey bars) shows the training-set centroids (average expression of each gene) for each of the four classes. The overall gene expression centroid has been subtracted so these values should be thought of as differences from the overall centroid. To apply the method of nearest centroid classification, we take the gene expression profile of each test sample (array) and compute its squared distance from each of the four class centroids. The predicted class is the one whose centroid is closest to the expression profile of the test sample. This procedure makes 5 errors on the 20 test samples (2 errors on the training samples) and has the major drawback that it uses all 2,308 genes. For practical applications, it would be more attractive if many fewer genes were needed.
Figure 1.

Centroids (grey) and shrunken centroids (red) for the SRBCT dataset. The overall centroid has been subtracted from the centroid from each class. The horizontal units are log ratios of expression. From left to right, the numbers of training samples for each class are 8, 23, 12, and 20. The order of the genes is arbitrary.
To achieve this goal, we propose a simple modification of the nearest-centroid method, called “nearest shrunken centroid.” This approach uses “de-noised” versions of the centroids as prototypes for each class. The shrunken centroids, derived by using a method described below, are the red bars in Fig. 1. Classification is made to the nearest shrunken centroid or prototype. This approach yields zero test and zero training errors. In addition, only 43 genes have a nonzero red bar for one or more classes in Fig. 1 and hence are the only ones required for the classification. The amount of shrinkage is determined by cross-validation.
Nearest shrunken centroids can be used in unsupervised problems as well. For example, it is standard procedure to use hierarchical clustering methods on expression arrays to discover clusters in the samples (6). The methods described here can identify minimal subsets of the genes that succinctly characterize each cluster.
Methods
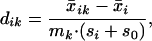
Let xij be the expression for genes i = 1, 2, … p and samples j = 1, 2, … n. We have classes 1, 2, … K, and let Ck be indices of the nk samples in class k. The ith component of the centroid for class k is x̄ik = ∑j∈Ckxij/nk, the mean expression value in class k for gene i; the ith component of the overall centroid is x̄i = ∑ xij/n.
In words, we shrink the class centroids toward the overall centroids after standardizing by the within-class standard deviation for each gene. This standardization has the effect of giving higher weight to genes whose expression is stable within samples of the same class. Such standardization is inherent in other common statistical methods such as linear discriminant analysis.
Let
 |
1 |
where si is the pooled within-class standard deviation for gene i:
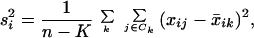 |
2 |
and mk = 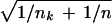 makes the mk⋅si equal to the estimated standard error of the numerator in dik. In the denominator, the value s0 is a positive constant (with the same value for all genes), included to guard against the possibility of large dik values arising by chance from genes with low expression levels. We set s0 equal to the median value of the si over the set of genes. A similar strategy was used in the sam methodology of ref. 7.
Thus dik is a t statistic for gene i, comparing class k to the overall centroid. We rewrite Eq. 1 as
 |
3 |
Our method shrinks each dik toward zero, giving d′ik and yielding shrunken centroids or prototypes
 |
4 |
The shrinkage we use is called soft thresholding: each dik is reduced by an amount Δ in absolute value and is set to zero if its absolute value is less than zero. Algebraically, soft thresholding is defined by
 |
5 |
where + means positive part (t+ = t if t > 0 and zero otherwise). Because many of the x̄ik values will be noisy and close to the overall mean x̄i, soft thresholding usually produces more reliable estimates of the true means (8, 9).
This method has the desirable property that many of the components (genes) are eliminated from the class prediction as the shrinkage parameter Δ is increased. Specifically, if for a gene i, dik is shrunken to zero for all classes k, then the centroid for gene i is x̄i, the same for all classes. Thus gene i does not contribute to the nearest-centroid computation. We choose Δ by cross-validation, as illustrated below.
Results
Choosing the Amount of Shrinkage.
Fig. 2 shows the training, cross-validation, and test errors for different values of the shrinkage parameter Δ. We used 10-fold cross-validation, dividing the set of samples at random into 10 approximately equal-size parts. The 10 parts were roughly balanced, ensuring that the classes were distributed proportionally among each of the 10 parts. Ten-fold cross-validation works as follows: we fit the model on 90% of the samples and then predict the class labels of the remaining 10% (the test samples). This procedure is repeated 10 times, with each part playing the role of the test samples and the errors on all 10 parts added together to compute the overall error (see ref. 5 for details). Fig. 2 shows the results, from no shrinkage (Left) to complete shrinkage (Right). Both the cross-validated and test error were minimized near Δ = 4.34, which is the value we used to produce the red bars in Fig. 1. The upper axis shows the number of active genes with at least one nonzero component, d′ik, for each value of Δ. At Δ = 4.34, there are 43 active genes.
Figure 2.

SBRCT classification: training (tr, green), cross-validation (cv, red), and test (te, blue) errors are shown as a function of the threshold parameter Δ. The value Δ = 4.34 is chosen and yields a subset of 43 selected genes.
The Genes That Classify SRBCTs.
Fig. 3 shows the shrunken differences d′ik for the 43 genes having at least one nonzero difference. Comparing these genes to the 96 genes identified in ref. 4, the two lists have 27 genes in common. Fig. 4 shows the heat map of our 43 genes. The horizontal rows of the map represent genes, whereas the columns represent samples. Each pixel represents the expression of one gene in one experiment: the colors depict intensity (log expression ratio) from blue (large negative) to yellow (large positive). We used hierarchical clustering to order the genes within each of the horizontal partitions and to order the samples within each vertical partition.
Figure 3.

Shrunken differences d′ik for the 43 genes having at least one nonzero difference. The genes with nonzero components in each class are almost mutually exclusive.
Figure 4.

(Top) Heat map of the chosen 43 genes. Within each of the horizontal partitions, we have ordered the genes by hierarchical clustering, and similarly for the samples within each vertical partition. (Bottom) Heat map of three genes reported in the literature to characterize SRBCT tumors. They are c-myc (Top), CD45 (Middle) and myogenin (Bottom).
Consider the 2,308 × 4 = 9,232 unshrunken t statistics dik. The 43rd largest in absolute value is 4.34 (there are about 43 nonzero components in the model). Using the Bonferroni adjustment, in the context of 9,232 t statistics, this value would be barely significant at the 0.05 level. This example illustrates another way in which our procedure differs from the more common approach of screening genes by significance of their individual t statistics. Our method uses soft thresholding rather than screening and focuses on misclassification error, which is the relevant measure for class prediction problems.
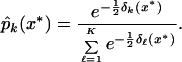
Class Probabilities and Discriminant Functions.
We classify test samples to the nearest shrunken centroid, again standardizing by si + s0. We also correct for the relative number of samples in each class.
Suppose we have a test sample (a vector) with expression levels x* = (x*1, x*2, … x*p). We define the discriminant score for class k
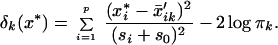 |
6 |
The first term in Eq. 6 is simply the standardized squared distance of x* to the kth shrunken centroid. The second term is a correction based on the class prior probability πk, where ∑ πk = 1. This prior probability gives the overall frequency of class k in the population. The classification rule is then
 |
7 |
If the smallest distances are close and hence ambiguous, the prior correction gives a preference for larger classes, because they potentially account for more errors. We usually estimate the πk by the sample priors π̂k = nk/n. If the sample prior is not representative of the population, either more realistic priors or equal priors πk = 1/K can be used.
We can use the discriminant scores to construct estimates of the class probabilities, by analogy to Gaussian linear discriminant analysis:
 |
8 |
Fig. 5 displays these probabilities for the training data (Upper) and test data (Lower). Most samples have good separation between the highest and next highest probability, demonstrating that the sample is unambiguously classified by the method.
Figure 5.

Estimated probabilities for the training data (Upper) and test data (Lower). Samples are partitioned by the true class (Upper) and the predicted class (Lower). All 63 of the training samples and all 20 of the test samples known to be SRBCT are correctly classified. Five of the test samples were non-SRBCT and hence should not be classified as such. The maximum estimated probability for each of these five samples is marked with a circle; they are below the maximum probabilities for the other test samples in each class.
Leukemia Classification
Leukemia data from high-density Affymetrix oligonucleotide arrays were previously analyzed in Golub et al. (1). There were 7,129 genes and 34 samples: 20 in class ALL (acute lymphocytic leukemia) and 14 in class AML (acute mylogenous leukemia). The results for the methods of Golub et al. and nearest shrunken centroids are shown in Table 1.
Table 1.
Comparison of leukemia classification methods
| Method | 10-Fold CV error | Test error | No. of genes |
|---|---|---|---|
| Golub et al. (1) | 3/38 | 4/34 | 50 |
| Nearest shrunken centroid | 1/38 | 2/34 | 21 |
Golub et al. report a test error rate of 4/34 for their procedure (defined in the Appendix), using 50 genes to obtain their results. We found that if the number of genes was reduced to less than 47, the test error increased. The results for the nearest shrunken centroid method are shown in Fig. 6. The minimum cross-validation error occurs near Δ = 1.4 but leaves about 1,000 genes. In practice, this minimum error solution might be of interest. Here, to obtain a more manageable set of genes, we chose instead Δ = 4.06, the point at which the cross-validation error starts to rise quickly, yielding only 21 genes. Our method was superior to their procedure in both cross-validation error on the training data and test error.
Figure 6.

Leukemia classification: training (tr, green), cross-validation (cv, red), and test (te, blue) errors. The value Δ = 4.06 yields a subset of 21 genes.
Discussion
The method of nearest shrunken centroids was successful in finding genes that accurately predict classes. The method found a set of 43 genes that was able to assign SBRCTs to one of four classes, BL, EWS, NB, and RMS, with 100% accuracy. This result was superior to the neural network method of Khan et al. (4), which required 96 genes. Of our 43 genes, 27 were also found by the neural network method. Thus, 69 of the genes from the neural network are not required for classification.
We also identified six genes not identified in ref. 4. Cold-shock domain protein A was underexpressed in NB. Farnesyl-diphosphate farnesyltransferase 1, neurofibromin 1, presenilin 2, homolog of mouse mesoderm specific transcript, and tissue plasminogen activator were overexpressed in RMS. It is interesting to note that cold-shock domain protein A is expressed in B cells and skeletal muscle but not in brain, consistent with our finding that it is expressed 6-fold less in NB compared to BL, EWS, and RMS. However, of the five genes with increased expression in RMS, neurofibromin 2 and tissue plasminogen activator are generally not expressed in muscle or heart tissue, and presenilin is expressed in brain as well as muscle and heart. Thus, genes that were predictive of a specific tumor did not always reflect the expression levels in the tissue from which the tumor was derived.
It is interesting to compare our list of 43 genes with genes that are presently considered to be diagnostic for SBRCTs. Several gene products are measured by immunostaining to distinguish the SBRCTs from each other: common leukocyte antigen (CD45) is specific for BL; MIC2 (CD99) is specific for EWS (10), chromogranin A and synaptophysin are specific for NB (11); and desmin, muscle-specific actin, myogenin, and MyoD1 are used for RMS (12, 13). MIC2 is on our list of genes (Fig. 3), but the other 7 genes are not. In addition, several genes play oncogenic roles in the SBRCTs. C-myc is activated as a result of chromosomal translocation to one of the immunoglobulin loci in BL. N-myc is commonly amplified in NB (14). One of the fusion proteins EWS/FLI-1 or EWS/ERG is overexpressed from chromosomal translocation in EWS (15). One of the fusion proteins PAX3/FKHR or PAX7/FKHR is expressed in RMS (16). We could find only three of the aforementioned genes in the cDNA microarray of ref. 4; their data are displayed in Fig. 4 to demonstrate their shortcomings in comparison to the genes identified by nearest shrunken centroids.
Our method was also superior to the method of Golub et al. in finding genes for leukemia classification. We found 21 genes that distinguished acute mylogenous leukemia (AML) from acute lymphocytic leukemia (ALL) with a lower error rate than the genes identified in ref. 1. Our list of 43 genes included myeloperoxidase and barely missed terminal deoxynucleotidyl transferase, which were not identified in ref. 1 but are known to be excellent markers for AML and ALL, respectively.
One goal of our method is to find the smallest set of genes that can accurately classify samples. The efficiency of our method in finding a relatively small number of predictive genes will facilitate the search for new diagnostic tools. There is often significant correlation in the expression patterns of groups of genes in an experiment. Hence, after a minimal gene list is found, it may be useful to search for other genes that are highly correlated with the genes in this list. Gene interaction is another important issue. Because genes often work in biological pathways, there could be strong interactions between genes in the same pathway. Careful post hoc analysis will be required to discover such interactions.
The success of our methodology has implications for improving the diagnosis of cancer. The method efficiently finds and ranks genes that can distinguish one type of tumor from another. Ultimately, it may be used to search for genes that are predictive for response to chemotherapy. For SBRCTs and leukemias analyzed here, the predictive genes are attractive candidates for raising antibodies suitable for immunostaining. Immunohistochemistry has an advantage for analyzing difficult specimens, because it allows the pathologist to localize the stain to tumor cells. In addition, our results suggest that RNA-based diagnostic tests may soon become feasible, based on either small-scale microarrays or quantitative PCR.
Acknowledgments
We thank two referees for their helpful comments. R.T. was supported by National Institutes of Health (NIH) Grant 2 R01 CA72028 and National Science Foundation (NSF) Grant DMS-9971405. T.H. was supported by NSF grant DMS-9803645 and NIH grant ROI-CA-72028-01. G.C. was supported by National Cancer Institute Grant 5R01 CA77302 and a Burroughs-Wellcome Clinical Scientist Award.
Abbreviations
- SRBCT
small round blue cell tumors
- BL
Burkitt lymphoma
- EWS
Ewing sarcoma
- NB
neuroblastoma
- RMS
rhabdomyosarcoma
Appendix
Relationship to Other Approaches.
The discriminant scores in Eq. 6 are similar to that used in linear discriminant analysis (LDA), which arises from using the Mahalanobis metric in computing distance to centroids:
 |
9 |
Here we are using a vector notation, and W is the pooled within-class covariance matrix. With thousands of genes and tens of samples (p ≫ n), W is huge, and any sample estimate will be singular (hence its inverse is undefined). Our scores can be seen to be a heavily restricted form of LDA, necessary to cope with the large number of variables (genes). The differences are that:
we assume a diagonal within-class covariance matrix for W, without which this LDA would be ill-conditioned and would fail;
we use shrunken centroids rather than simple centroids as a prototype for each class;
as the shrinkage parameter Δ increases, an increasing number of genes will have all their d′ik = 0, k = 1, … , K, because of the soft thresholding in Eq. 5. Such genes contribute no discriminatory information in Eq. 6 and in fact cancel in Eq. 8.
Refs. 1 and 2 present linear scoring procedures for the two-class problems, which are very similar to each other and also to our procedure and hence LDA in the two-class case. Both methods work essentially by:
selecting a set of genes based on a two-sample t statistic, and then
forming a linear classifier in the selected x*i using these t statistics as weights.
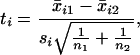
We describe the procedures in turn, using our own re-expression and terminology but remaining faithful to the original in each case. Ref. 2 uses a standard t test at level α to select differentially expressed genes in two breast cancer types. They then construct a “compound covariate” class predictor, which they threshold to classify a sample into one of the two classes. Their compound covariate is
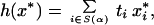 |
10 |
where x* is the gene expression vector for the sample to be classified, ti is the t statistic for comparing the two classes in the training data, and S(α) is the subset of genes with a significant t statistic at level α. They use as a threshold the same compound formula applied to (x̄1 + x̄2)/2. Here
 |
11 |
where si is the pooled within-class standard deviation for gene i as before, hence (ignoring irrelevant constants in n1 and n2)
 |
12 |
Samples are assigned to class 1 if H(x*) > 0 and to class 2 otherwise.
Ref. 1 uses a very similar procedure. Golub et al. screen the genes using the absolute value of a “correlation measure”
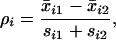 |
13 |
where si1 and si2 are the class 1 and class 2 standard deviations for gene i. This is very similar to a t statistic, using a somewhat unorthodox estimate of the common standard deviation. They then form a “weighted vote,” which is equivalent to using the linear function
 |
14 |
Again, if G(x*) > 0, samples are assigned to class 1 and otherwise to class 2. The actual screening procedure used by ref. 1 is fairly complex and depends on a parameter m (the number of genes retained per class); m is determined by cross-validation.
We can re-express our discriminant scores in Eq. 6 for the two-class case. Rather than picking the maximum of  1(x*) and
  2(x*), we can form the difference and threshold at zero. These differences, after a little manipulation, can be seen to be
 |
The sums are over the set S (Δ) of genes remaining after soft-thresholding. Here it is clear that if both genes are shrunk to the overall mean, they drop out of the sum.
The three procedures are similar in form but differ in the details:
The LDA score uses a variance in the denominator, whereas the other two scores use standard deviations. The variance is a more natural quantity, because it arises from the squared standardized distance.
The selection methods are different. Refs. 1 and 2 both use hard thresholding of the t statistic as the basis of selection (hard thresholding selects only those genes whose t statistics fall above a threshold). Our selection is based on soft thresholding of t statistics. Soft thresholding is known to perform better in other settings (see, e.g., ref. 17).
We use cross-validation to select Δ, and Golub et al. (1) use it to select their m. We could not determine whether Hedenfalk et al. (2) use cross-validation to select α, although it would be reasonable to do so.
Our procedure can adjust the classification according to the class prior probabilities.
Our procedure provides estimates of probabilities in Eq. 8 for each of the classes.
Our nearest prototype procedure works for more than two classes.
With more than two classes, the method of nearest shrunken centroids uses soft thresholds for all of the differences between the class centroids and the overall centroid. In the process, it chooses different sets of genes for characterizing each class, as illustrated in Fig. 3.
The neural network approach (4) can be interpreted as a form of dampened discriminant analysis. In that paper, Khan et al. actually use a linear network, using the first 10 principal components (eigengenes). In statistical parlance, this is known as principal components regression and requires no iterative learning procedure or learning curves. Principal component regression is a hard-threshold version of ridge regression. Khan et al. (4) do use a model-averaging procedure, similar to “bagging” (18) but based on 3-fold cross-validation, to regularize the procedure further. Although their procedure also produced zero training and test errors on the SRBCT data, it is far more complex than nearest shrunken centroids. With so many genes and so few samples, it is very likely that restricted versions of simpler statistical methods will do as well as or better than neural networks, as is the case here.
Software and Computational Details.
The computations involved in the shrunken nearest centroid method are straightforward. We have developed a program similar to the popular sam package to implement nearest shrunken centroid classification. This program incorporates methods for automatic threshold choice and graphical methods for application of the procedure to the results of an unsupervised clustering procedure. Details may be found at http://www-stat.stanford.edu/∼tibs/PAM.
References
- 1.Golub T, Slonim D, Tamayo P, Huard C, Gaasenbeek M, Mesirov J, Coller H, Loh M, Downing J, Caligiuri M, et al. Science. 1999;286:531–536. doi: 10.1126/science.286.5439.531. [DOI] [PubMed] [Google Scholar]
- 2.Hedenfalk I, Duggan D, Chen Y, Radmacher M, Bittner M, Simon R, Meltzer P, Gusterson B, Esteller M, Raffeld M, et al. N Engl J Med. 2001;344:539–548. doi: 10.1056/NEJM200102223440801. [DOI] [PubMed] [Google Scholar]
- 3.Hastie T, Tibshirani R, Botstein D, Brown P. Genome Biol. 2001;2:1–12. doi: 10.1186/gb-2001-2-1-research0003. [DOI] [PMC free article] [PubMed] [Google Scholar]
- 4.Khan J, Wei J, Ringner M, Saal L, Ladanyi M, Westermann F, Berthold F, Schwab M, Antonescu C, Peterson C, et al. Nat Med. 2001;7:673–679. doi: 10.1038/89044. [DOI] [PMC free article] [PubMed] [Google Scholar]
- 5.Hastie T, Tibshirani R, Friedman J. The Elements of Statistical Learning; Data Mining, Inference and Prediction. New York: Springer; 2001. [Google Scholar]
- 6.Eisen M, Spellman P, Brown P, Botstein D. Proc Natl Acad Sci USA. 1998;95:14863–14868. doi: 10.1073/pnas.95.25.14863. [DOI] [PMC free article] [PubMed] [Google Scholar]
- 7.Tusher V, Tibshirani R, Chu C. Proc Natl Acad Sci USA. 2001;98:5116–5121. doi: 10.1073/pnas.091062498. [DOI] [PMC free article] [PubMed] [Google Scholar]
- 8.Donoho D, Johnstone I. Biometrika. 1994;81:425–455. [Google Scholar]
- 9.Tibshirani R. J R Stat Soc B. 1996;58:267–288. [Google Scholar]
- 10.Kovar H, Dworzak M, Strehl S. Oncogene. 1990;5:1067–1070. [PubMed] [Google Scholar]
- 11.Pagani A, Macri L, Rosolen A, Toffolatti L, Stella A, Bussolati G. Diagn Mol Pathol. 1998;7:36–43. doi: 10.1097/00019606-199802000-00007. [DOI] [PubMed] [Google Scholar]
- 12.Altmannsberger M, Weber K, Droste R, Osborn M. Am J Pathol. 1985;118:85–95. [PMC free article] [PubMed] [Google Scholar]
- 13.Wang N, Marx J, McNutt M, Rutledge J, Gown A. Am J Pathol. 1995;147:1799–1810. [PMC free article] [PubMed] [Google Scholar]
- 14.Boon K, Caron H, van Asperen R, Valentijn L, Hermus M, van Slui P, Roobeek I, Weis I, Voute P, Schwab M, et al. EMBO J. 2001;20:1383–1393. doi: 10.1093/emboj/20.6.1383. [DOI] [PMC free article] [PubMed] [Google Scholar]
- 15.Folpe A, Hill C, Parham D, O'Shea P, Weiss S. Am J Surg Pathol. 2000;24:1657–1662. doi: 10.1097/00000478-200012000-00010. [DOI] [PubMed] [Google Scholar]
- 16.Anderson J, Gordon T, McManus A, Mapp T, Gould S. Br J Cancer. 2001;85:831–835. doi: 10.1054/bjoc.2001.2008. [DOI] [PMC free article] [PubMed] [Google Scholar]
- 17.Donoho D, Johnstone I. Biometrika. 1994;81:425–455. [Google Scholar]
- 18.Breiman L. Mach Learn. 1996;26:123–140. [Google Scholar]