

Abstract
The 140-residue protein α-synuclein (AS) is able to form amyloid fibrils and as such is the main component of protein inclusions involved in Parkinson's disease. We have investigated the structure and dynamics of full-length AS fibrils by high-resolution solid-state NMR spectroscopy. Homonuclear and heteronuclear 2D and 3D spectra of fibrils grown from uniformly 13C/15N-labeled AS and AS reverse-labeled for two of the most abundant amino acids, K and V, were analyzed. 13C and 15N signals exhibited linewidths of <0.7 ppm. Sequential assignments were obtained for 48 residues in the hydrophobic core region. We identified two different types of fibrils displaying chemical-shift differences of up to 13 ppm in the 15N dimension and up to 5 ppm for backbone and side-chain 13C chemical shifts. EM studies suggested that molecular structure is correlated with fibril morphology. Investigation of the secondary structure revealed that most amino acids of the core region belong to β-strands with similar torsion angles in both conformations. Selection of regions with different mobility indicated the existence of monomers in the sample and allowed the identification of mobile segments of the protein within the fibril in the presence of monomeric protein. At least 35 C-terminal residues were mobile and lacked a defined secondary structure, whereas the N terminus was rigid starting from residue 22. Our findings agree well with the overall picture obtained with other methods and provide insight into the amyloid fibril structure and dynamics with residue-specific resolution.
Keywords: EM, protein structure, amyloid, Parkinson's disease, protein aggregation
The ability of a protein to form amyloid fibrils is increasingly recognized as a general property of all polypeptide sequences (1). It is a phenomenon common to numerous neurodegenerative diseases such as Alzheimer's and Parkinson's diseases and spongiform encephalopathies (2, 3). Thus, the investigation of the mechanism(s) of protein misfolding as well as the detailed structures of amyloid fibrils is of paramount interest (4, 5). Parkinson's disease is defined by the presence of intracellular inclusions in dopaminergic neurons, the so-called Lewy bodies, which contain a high content of fibrils formed from the 140-aa cytoplasmic protein α-synuclein (AS) (6). The question of whether the mature fibrils themselves or rather proto-filaments or folding intermediates are the neurotoxic species responsible for the cell death of dopaminergic neurons is still a subject of great controversy (7–9).
AS belongs to the class of natively unfolded proteins, i.e., it lacks a well-defined secondary structure (10, 11), although long-range interactions have been shown to stabilize an aggregation-autoinhibited global protein architecture (12). Three regions of the protein can be classified. (i) The amphipathic N terminus (residues 1–60) consists of imperfect 11-mer repeats, with the consensus motif KTKEGV. (ii) The predominantly hydrophobic middle, also known as non-Aβ component region (residues 61–95), is by itself highly amyloidogenic (13). (iii) The highly acidic and proline (P)-rich C terminus (residues 96–140) has been shown to inhibit aggregation (12, 14, 15).
Upon aggregation, a large fraction of AS undergoes a transition from random-coil structure to the cross-β conformation typical of amyloid fibrils, as revealed by circular dichroism spectroscopy, x-ray, and electron diffraction (14, 16). Atomic force microscopy and EM studies of synthetic fibrils grown under different conditions revealed a polymorphic nature (17). Protease digestion of filaments assembled in vitro showed that both N and C termini are subject to protease K digestion, whereas a core region comprising residues 31–109 is protease resistant (18). Likewise, EPR studies on fibrils grown from site-directed spin-labeled AS are indicative of a well-ordered central region comprising residues 34–101, with parallel, in-register β-strands (19). Although all these studies provided valuable insight into the overall molecular arrangement, they did not yield site-specific structural information at the resolution that can be attained by NMR spectroscopy.
Significant progress has recently been achieved in using magic angle spinning (MAS) (20) NMR to characterize amyloid fibrils (5, 21–26). A high-resolution 3D structure and a structural model have been obtained of a 10-residue peptide fragment of transthyretin (25) as well as for the amyloid-β (Aβ) (1–40) peptide (24) in fibrillar form. Furthermore, measurements performed on Aβ amyloid peptides suggested that the supramolecular structure depends on the exact length of the particular peptide sequence (see, e.g., ref. 5 and references therein) and that different fibril morphologies have different underlying molecular structures correlated with different neuronal toxicities (27). Moreover, recent results obtained on amyloid fibrils formed by the HET-s prion protein suggest that fibril structure correlates with prion infectivity (28).
Studies conducted on fibrils grown from full-length AS were complicated by the chain length, the repetitiveness of amino acid motifs, and the difficulty to recombinantly produce isotope labeling at specific amino acid residues. Our spectroscopic analysis included the use of 3D correlation experiments, reverse isotope labeling (29), and novel solid-state NMR experimental strategies that permit spectral simplification by exploiting different degrees of molecular mobility (30). The measurements led to the conclusion that AS fibrils contain a central region that is rich in β-strand segments, a highly flexible C terminus, and a disordered N terminus. Variations in solid-state NMR spectra of different samples were found for the central β-strand region, suggesting that at least two distinct fibril nucleation mechanisms exist for the formation of AS fibrils. EM studies indicated a correlation between molecular structure and fibril morphology, as in recent observations on Aβ fibrils (27). The elucidation of structural details of AS fibril formation at atomic resolution may help to delineate the relationship between fibril morphologies and neurotoxicity.
Materials and Methods
Sample Preparation. AS expression and purification: Escherichia coli. For solid-state NMR measurements, AS was expressed in E. coli cultures grown in minimal medium supplemented with 15N-NH4Cl and 13C6-d-glucose. The protein was purified according to established protocols (17). To reduce spectral overlap in 2D spectroscopy (see Table 1, which is published as supporting information on the PNAS web site), preparations included reverse-labeled AS fibrils, in which two of the amino acids occurring most frequently in the sequence, V and K, were added in natural abundance to the growth medium (U-[13C,15N\K,V]) (29). An additional set of samples was prepared in which isotope-labeled monomers were diluted with unlabeled monomers in a ratio of 1:2.
Fibrillization in vitro. Fibrillization was achieved by incubating AS solutions with protein concentrations between 220 and 350 μM in 25 mM Tris·HCl, pH 7.5/0.01% sodium azide in glass vials at 37°C with continuous stirring with micro stir bars at 300 rpm (multiple drive stirrer Telesystem HP15S, Variomag, Daytona Beach, FL) until the concentration of fibrillized protein reached a steady state according to a stained thioflavin T fluorescence assay (31) (incubation time of ≈3 weeks). The solutions were centrifuged at 215,000 × g with a TL 100 ultracentrifuge (Beckman Coulter), yielding a gel-like pellet containing ≈8 mg of AS fibrils, which was then transferred into the rotor by centrifugation.
EM. Amyloid fibers, resuspended from the pellet, were prepared on a glow discharged carbon foil and stained with 1% uranyl acetate. The samples were evaluated with a CM 120 TEM (FEI, Eindhoven, The Netherlands). Pictures were taken with a 2,048 × 2,048 TemCam 224A camera (TVIPS, Gauting, Germany) in spot mode at 195,000-fold magnification at -1.15-μm defocus.
Solid-State NMR Experiments and Analysis. All NMR experiments were conducted by using 2.5- and 4-mm triple-resonance (1H,13C,15N) probe heads at static magnetic fields of 18.8, 14.1, and 9.4 T corresponding to 800-, 600-, and 400-MHz proton resonance frequencies (Bruker Biospin, Karlsruhe, Germany). Through-space transfer experiments involved broadband (1H,13C) and chemical-shift selective (32) (15N,13C) Hartmann-Hahn (33) cross-polarization (CP) schemes. SPINAL64 (34) proton decoupling was applied during through-space and through-bond correlation experiments by using radio-frequency fields of 75–90 kHz. For dipolar double-quantum excitation, the SPC5 (35) scheme was used. Sequential (15N,13C) resonance assignments were obtained by combining 2D and 3D NCACX-, NCOCX-, and CANCOCX-type correlation experiments (36, 37) with results of (13C,13C) correlation experiments performed under weak coupling conditions (38). MAS rates between 8 and 15 kHz were used at sample temperatures between -14°C and -5°C. For homonuclear through-bond polarization transfer, total through-bond-correlation spectroscopy (TOBSY) schemes were used (39–41). Selection of regions with high mobility was achieved by applying insensitive nuclei enhanced by polarization transfer (INEPT) magnetization transfer from protons to carbon atoms (42), and regions with intermediate mobility were selected by combining a proton T2-filter with CP magnetization transfer.
Secondary chemical shifts were related to backbone torsion angles by using the program talos (43). As a complementary method, proton–proton distances relevant for the determination of backbone torsion angles were probed indirectly by using the NHHC correlation experiment (44). A (1H,1H) mixing time of 80 μs, bracketed by short 1H,X CP transfers for contact times of 90 μs (X = 13C) and 200 μs (X = 15N) was used.
Results
Assignments of the Signals in the Core Region. To obtain sequential resonance assignments of AS, we used a set of 2D and 3D NC and CC correlation experiments. As an example, Fig. 1 shows results of two 2D (13C,13C) spin diffusion (SD) (45) experiments conducted under weak coupling conditions (38), with short (20 ms, red) and long (150 ms, blue) mixing times on U-[13C,15N\K,V] AS. Although at short mixing times the spectrum was dominated by intraresidue cross-peaks, interresidue correlations such as those indicated in Fig. 1 for the stretch G84–A89 could be identified for longer mixing times. Because of strong reduction of 13C-labeled V and K residues, the spectral overlap in the Cα/Cα region was sufficiently limited so as to allow the assignment of all six threonine (T) residues not involved in KTK repeat units. To separate signal sets in an additional dimension, NC correlation experiments (36) were conducted by using SPECIFIC CP (32) transfers and SD 13C,13C mixing blocks. Comparison of NCACX and NCOCX correlation spectra of reverse-labeled and uniformly labeled AS revealed that the natural abundance V added to the minimal medium is subject to transaminase reactions, whereas K is not, as it has been observed previously for protein expression in E. coli (46, 47) (see Fig. 6, which is published as supporting information on the PNAS web site). These facts could be used for further spectral editing. 13C and 15N chemical shift assignments were independent on the degree of isotope labeling.
Fig. 1.

CC correlation experiments using SD magnetization transfer, conducted on U-[13C,15N\K,V] AS fibrils. Measurements were performed at 18.8 T, at -8°C and a spinning speed of 12.5 kHz. Mixing-times for SD were 20 ms (red) and 150 ms (blue). Total experiment times were 5.5 h (red) and 8.5 h (blue); the maximum t1 evolution times were 4 ms for both experiments. As an example, intraresidue (red) and interresidue (blue) cross-peaks for amino acids of the stretch G84–I88 are indicated. For a complete resonance assignment, see Table 1.
Analysis of a series of CC and NC 2D and 3D (see Fig. 7, which is published as supporting information on the PNAS web site) spectra led to de novo assignment of 48 aa in the central region from L38 to V95 (see Fig. 8, which is published as supporting information on the PNAS web site.) At least 10 different T resonance sets resulting from the 10 T residues distributed equally over the N terminus and the non-Aβ component region between residue 22 and 92 were identified in the NCACX spectra, whereas none of the signals characteristic for P were detected in heteronuclear NC-correlation or double-quantum correlation spectra. Likewise, only one of the two isoleucine (I) residues, I88 from the non-Aβ component region, gave rise to NC cross-correlations, whereas I112 from the C terminus did not generate cross-correlation signals. However, in SD spectra with mixing times of >20 ms, intraresidual cross-peaks for these residues could be identified, with secondary chemical shifts corresponding to random coil conformation. These findings indicate that the N terminus starting from residue 22 is rigid enough to allow for NC-transfer and CC-double-quantum filtering, whereas the C terminus starting from residue 107 seems highly mobile.
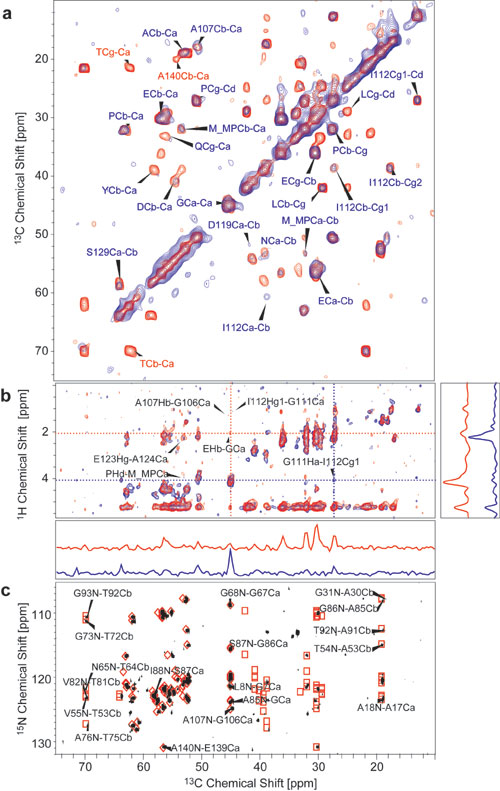
C Terminus: Mobility. To investigate different degrees of molecular mobility, we complemented dipolar transfer experiments shown in Fig. 2 with techniques that employ through-bond mixing (30). In Fig. 2, four 1D 13C NMR spectra of U-[13C,15N\K,V] AS fibrils recorded with MAS after different excitation schemes are displayed. An INEPT (42) proton-to-carbon transfer selectively excites mobile regions of the sample, as this scheme involves transverse proton evolution times of up to 6 ms. The corresponding 13C NMR spectrum (Fig. 2a) revealed rather narrow lines (≈0.5 ppm) with resonance sets typical for all amino acids occurring in the sequence of AS. Because of the lack of a pronounced secondary structure, the secondary chemical shifts are <0.3 ppm for all amino acids. Therefore, resonances for different amino acids of the same type cannot be resolved in a homonuclear CC-correlation spectrum, except for the Cα resonances of amino acids preceding P, which are typically 2 ppm lower than the random coil shifts (48, 49). The resonances in the CP/MAS spectrum (Fig. 2b), resulting from more rigid regions of the sample, were inhomogeneously broadened because of the existence of many different, well-defined conformations for each amino acid type, with Cα and Cβ chemical shifts typical for β-sheet secondary structure. The spectrum obtained by 90° pulse excitation (Fig. 2c), which is not sensitive to mobility, roughly corresponds to the sum of spectrum a and b. The 2D CC and NC correlation spectra obtained with INEPT and TOBSY transfer schemes as described in ref. 30 (see Fig. 9, which is published as supporting information on the PNAS web site) exhibited signals for all amino acids present in the protein chain, with 13Cα and 15N chemical shifts matching exactly the values obtained for monomeric AS (C. W. Bertoncini, C. Fernández, M. Zweckstetter, and C. Griesinger, personal communication), indicating the presence of monomers in the fibrillized sample. These monomers were the result of incomplete fibrillization with incorporation of residual monomers into the gel-like fibril sample and/or of an equilibrium (50) between monomers and fibrils within this sample. Thus, to identify mobile regions of fibrils in the presence of monomers, it was necessary to combine a T2 relaxation filter, which filters out rigid parts with strong dipolar couplings, with a CP transfer (see Fig. 10, which is published as supporting information on the PNAS web site). This procedure selects molecules that are unable to rotate freely, i.e., molecules presumably embedded in or associated with immobilized fibrils. In Fig. 2d,a 13C spectrum recorded with an initial transverse proton dephasing delay of 200 μs followed by a CP pulse of 1 ms is displayed. As in the INEPT-spectrum of Fig. 2a, most of the lines were well resolved with chemical shifts typical for random-coil conformations, indicating that the well-structured rigid parts of the fibril are absent from the spectrum. However, the relative intensities of signals arising from different amino acid types varied from those of the INEPT spectrum: Although the four resonance lines corresponding to the four aliphatic carbon atoms of P were enhanced in comparison with the INEPT-spectrum, the characteristic T Cβ resonance was missing from this spectrum, suggesting that at least amino acids 22–92 in fibrillized AS are immobile, whereas the mobile parts of AS are rich in P and E, amino acids with a high occurrence in the C terminus. A 2D CC correlation spectrum involving homonuclear TOBSY transfer after a T2 filter on protons combined with CP (see Figs. 9 and 10) showed cross-peaks characteristic of all amino acids occurring in the C terminus, with random coil chemical shifts. Cα shifts of all methionines (M), one alanine (A), and one aspartic acid (D) signal were characteristic for amino acids followed by P, applying to A107, M116, M127, and D119 (48, 49) (see Table 1). Furthermore, 2D H,C correlation spectra with proton–proton mixing yielded some interresidue contacts that agree well with motifs from the C terminus (see Table 1). The totality of the data indicates that the C terminus in AS fibrils is rather mobile and lacks a defined secondary structure, a result that agrees well with investigations by EPR of spin-labeled samples (19) and antibody labeling (51).
Fig. 2.

13C-MAS-NMR spectra recorded at 9.4 T at -5°C with a spinning speed of 8 kHz, with 512 scans each. Spectrum a, INEPT excitation; spectrum b, CP/MAS with a contact time of 1 ms; spectrum c, direct excitation with a 90° pulse on 13C; spectrum d, a transverse relaxation filter with a proton dephasing delay of 200 μs followed by a CP transfer of 1 ms.
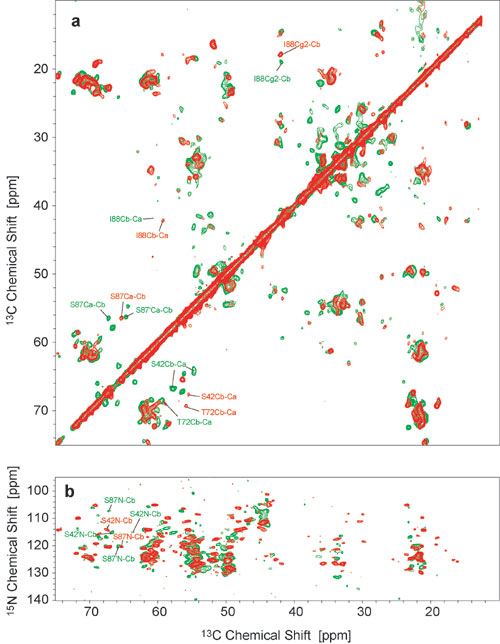
Molecular-Level Polymorphism. Although all five samples investigated were fibrillized under nearly identical conditions, the preparation can result in two distinct types of fibrils, which we will refer to in the following as the more ordered A-form (three samples, red in Fig. 3a) and the more disordered B-form (2 samples, green in Fig. 3a). A comparison of the 2D NCA correlation spectrum is shown in Fig. 3a, and the corresponding CC correlation spectra are given in Fig. 11, which is published as supporting information on the PNAS web site. The 13C resonances of backbone and side chains did not differ by >5 ppm, the 15N shift differences between both samples were more pronounced and extended to up to 13 ppm. Significant 13C and 15N shift differences were observed particularly for amino acids in the stretch from E83 to I88. Variations in chemical shift values also were found for side-chain atoms, with significant shift changes being observed for methyl groups of T54, A77, A78, and I88.
Fig. 3.

Polymorphism in two different types of AS fibrils (red, batch A; green, batch B). (a) NCA correlation spectra. Spectra were recorded at 18.8 T, with a spinning frequency of 11 kHz at temperatures of -13°C. Maximum t1 evolution times were 8 ms, and total experiment times were 4–5 h. (b and c) EM pictures of negatively stained fibrils of type A (b) and type B (c). The samples were stained with 1% uranyl acetate. (Scale bar: 400 Å; Inset: 200 Å.)
For S42, T72, S87, and I88 as well as at least one nonassigned T residue from one of the KTK-repeats in the N terminus, a second set of resonances with smaller intensity was identified in sample B. The corresponding chemical shifts indicate that a small amount of fibrils of type A is still present in sample B. Likewise, one of the three A samples showed some weak cross-peak patterns typical for sample B. This finding suggests that fibrils of both types are formed by competing mechanisms, which are highly sensitive to minor variations in the experimental conditions, such as exact protein concentration, pH, stirring velocity, and temperature. Although the degree of disorder in sample B is greater, sequence-specific assignments for this sample were possible for 32 aa in the central region from L38 to V95 (Table 1).
Four solid-state NMR samples, two corresponding to form A and form B, each, were subsequently investigated by EM. The EM pictures of fibrils of types A and B are given in Fig. 3 b and c, respectively. The diameters of fibrils of type A (Fig. 3b) ranged from 100 to 170 Å, with an overall appearance suggesting a helical twist. The fibrils of type B (Fig. 3c) appeared to be composed of one or two untwisted strands with a diameter of ≈120 Å each. These results suggested that the differences in molecular structure detected by solid-state NMR were correlated with distinct fibril morphologies.
Secondary Structure in the Core Region. The chemical-shift assignments in both AS sample types were used to determine conformation-dependent chemical shifts and monitor the backbone structure for the core region. A talos (43) analysis of Cα and Cβ secondary chemical shifts yielded torsion angles mainly characteristic of β-strands for most of the residues in the core regions of both samples (see Fig. 5 a and b). To further characterize the secondary structure, we conducted an NHHC correlation experiment with a longitudinal proton–proton mixing time of 90 μs on a KV reverse-labeled sample of type A, where one part of the labeled protein was cofibrillized with two parts of natural abundance protein. As discussed in ref. 52, cross-correlations for this mixing time are dominated by Ni+1H-HCαi contacts resulting from neighboring amino acids located in β-strands (with G Cα atoms being an exception). In Fig. 4, the resulting spectrum is compared with the Ni+1Cαi correlations of those residues for which conformation-dependent chemical shifts predict a β-strand arrangement (red circles). All these predicted cross-peaks appeared in the spectrum, except for the G93N–T92Cα cross-correlation, where the 15N chemical shift of G93 in the diluted sample differs by 1.5 ppm from the value in the undiluted sample.
Fig. 5.

Characterization of the core region (residues 38–95) of AS. (a and b) φ (diamonds) and Ψ (squares) torsion angles classified as good by talos analysis for samples A (red) and B (green), respectively (with error bars as given). Filled symbols in a indicate angles, which were not classified as good by talos but were confirmed by Ni+1Cαi cross-correlations in the NHHC spectrum. White arrows indicate β-strands; gray lines are nonassigned amino acids; straight lines are assigned amino acids for which shift analysis did not give well-defined torsion angles; curved lines are turn or loop regions according to the NHHC spectrum; dashed lines indicate resonance doubling in sample B. (c) Absolute value of the 15N chemical shift differences between samples A and B. (d) rms deviation (rmsd) values for Cα and Cβ shift differences between samples A and B, given as rmsd = |ΔδCα| for Gly and [0.5(ΔδCα2 + ΔδCβ2)]1/2 for all other residues.
Fig. 4.

A 2D NHHC spectrum of AS fibrils (A form) grown from U-[13C,15N\K,V] AS diluted 1:2 with natural abundance AS. The spectrum was recorded at a static magnetic field of 18.8 T with a spinning speed of 11 kHz at a temperature of -13°C. The maximum t1 evolution time was 4 ms, and the total experiment time was 113 h. The spectrum was processed with exponential multiplication with a line-broadening factor of 50 Hz in both dimensions. Red circles represent Ni+1Cαi cross-correlations for amino acids involved in β-strands according to chemical-shift analysis, including also Ni+1Cα(V)i cross-peaks due to residual carbon labeling in V residues. Red squares represent Ni+1Cαi cross-correlations for amino acids not involved in β-strands according to their chemical shift. Blue squares represent intraresidue N-Cα correlation for Gly residues. For several correlations, sequential residue numbers are given.
As a comparison, Ni+1Cαi cross-correlations for residue pairs, for which the secondary shift analysis did not predict a β-strand conformation, are given as red squares in Fig. 4. The interresidue correlations A85N–G84Cα, G86N–A85Cα, and G68N–G67Cα did clearly not appear in the spectrum. This result indicates that the G84–G86 and the G67–A69 motifs are located in loops or turn regions between the β-strands. These two segments also form the linkers between the immobile domains III and IV as well as II and III, respectively, in monomeric AS (12). For E83, the amino acid preceding the GAG motif, conformation-dependent chemical shifts suggest a configuration typical for left-handed helices. However, only the interresidue Cα/N, but not the intraresidue cross-peak that would be expected for such a structure, was visible in the NHHC spectrum. This finding might be attributable to residual mobility of amino acids close to a turn motif. Furthermore, intraresidue N-Cα correlations for G residues appeared in the spectrum. Moreover, Ni+1Cαi cross-correlations, with amino acid i being V, which are due to residual 13C-labeling of V Cα atoms in the K,V-reverse-labeled sample were found. In addition to the cross-peaks corresponding to assigned amino acid pairs, the spectrum contains many more cross-peaks for which either the nitrogen shift or the Cα shift was not assigned. These cross-peaks could be identified as Ni+1Cαi cross-correlations as well by comparison to the NCOCX spectrum.
A summary of our solid-state NMR characterization of AS fibrils is given in Fig. 5. Diagrams a and b show the φ and Ψ torsion angles estimated from the analysis of solid-state NMR chemical shifts for sample type A (a) and B (b). In addition to the residue-specific torsion angles in the protein core region, secondary structure elements are given. In Fig. 5c, the absolute values of the 15N shift differences between both samples are plotted where available; Fig. 5d displays the rms deviation values for Cα and Cβ chemical shifts in both samples. For residues with peak doubling in sample B, the more intense resonance was taken. In summary, NHHC data confirm the analysis of conformation-dependent chemical shifts and support a high β-sheet content of the central core of fibrillar AS. For both fibril types, the central region consists mainly of well-defined β-strands. Although the 13C chemical shifts of Cα and Cβ have rms deviations of up to 2.5 ppm, the secondary structure suggested by the secondary chemical shifts does not differ substantially. The 15N chemical shift differences between sample A and B take values of up to 13 ppm, the most pronounced differences being found for the turn motif EGAG83–86 and the subsequent β-strand from S87 to V95. These findings suggest that the secondary structure and the lengths of the β-sheets in the center of the fibril core are relatively well conserved within different forms, whereas the turn regions, the relative arrangements of the β-strands, and the tertiary structure seem to be subject to more variations across different sample types. Especially the last β-strand seems to experience a different environment in the two forms, whereas the central β-strand from E61 to N65 appears to be the most conserved. For amino acid residues before 38, a sequential assignment could not be made because of the high repetitiveness of the sequence. However, the absence of T Cα and Cβ resonances from the T2-filtered 13C NMR spectra of sample type A as well as the number of T Cβ resonances in the NCACX spectra indicate that the N terminus is rather rigid from residue 22 onwards. Depending on the sample type, one or two T resonances with secondary chemical shifts characteristic for α-helical conformations were found. These findings indicate that the β-strand region does not extend over the whole N terminus, and the appearance of > 10 T Cβ resonances even in the NCACX spectrum of the more ordered A form support the assumption of a statically disordered N terminus (19).
Discussion
Examination of fibrils grown from full-length AS by solid-state MAS NMR spectroscopy led to the characterization of distinct regions in the fibrillized protein. The β-sheet rich core region comprises at least residues 38–95. The precise determination of the N-terminal extent of the core structure was not feasible because of the high repetitiveness of amino acids in this region. However, a T2 relaxation filter combined with a CP transfer as well as heteronuclear NC correlation experiments revealed that the backbone is rigid from at least residue 22 onwards with some degree of static disorder. The C terminus, starting from at least residue A107, is unstructured and mobile. This structural organization of AS within amyloid fibrils is in good agreement with previous data obtained by protease digestion studies and EPR spectroscopy (18, 19).
The absence of signals for several amino acid residues in the spectra based on dipolar transfer schemes has been observed before for fibrils grown from a 79-residue fragment of a prion protein (26, 28); in this case, the missing signals were attributed to inhomogeneous line broadening due to disorder. In the present study, we were able to identify the mobile regions of the fibril with the help of a T2-relaxation filter combined with a CP transfer, even in the presence of residual monomers in the fibrillized samples. The highly acidic and P-rich C terminus was shown to be highly mobile and completely devoid of secondary structure, corroborating earlier findings according to which this part of the protein prevents fibrillization, acting as a built-in chaperone (15, 31).
For the central protein region comprising residues 38–95, residue-specific resonance assignments were obtained for 48 aa. The correlation of chemical shifts of backbone atoms with secondary structure allowed the estimation of backbone torsion angles for 38 aa in the core region, which were corroborated by the identification of corresponding interresidue NH–HC contacts (52). Extended regions of β-strands could be identified within the core region as well as turn or loop regions. The most evident turn or loop regions between β-strands were identified as residues 66–68 and 83–86. These G-rich regions flank an extended β-strand (residues 69–82), with a possible interruption at G73. This β-strand comprises the amino acid stretch 71–82 known to be critical for aggregation (53). Interestingly, the turns/loops 66–68 and 83–86 form also the linkers between the more immobile domains II, III, and IV that had been identified in the monomeric form of AS (12). Thus, the turn or loop regions and potentially also the domains may be conserved in the transition from the monomer to the fibril.
Although our study confirms the predominant β-sheet character of the core region of AS fibrils, the exact molecular structure seems to be highly sensitive to variations in the fibrillization conditions. The identification of two different fibril types by NMR, which correspond to different fibril morphologies as observed by EM, suggests that at least two distinct fibril nucleation mechanisms exist for AS. Variations in protein secondary structure may lead to a different arrangement of the β-sheets and side-chain packing. In the case of mammalian and yeast prions, it has been shown that different strains associated with different phenotypes, incubation times, and pathologies correlate with variations in the protein conformation (54, 55). In addition, different fibril morphologies of Aβ amyloid have significantly different toxicities in neuronal cell cultures (27). Similarly, different variants of AS fibrils might have an impact on neurotoxicity and might play a role in different synucleinopathies caused by misfolding of AS (56).
Supplementary Material
Acknowledgments
We thank Christian Griesinger for continuous support of this project. We thank Thomas M. Jovin, Markus Zweckstetter, and Christian Griesinger for discussions. We also thank Karin Giller for expert technical assistance. This work was conducted within the scientific scope of the Deutsche Forschungsgemeinschaft Center for Molecular Physiology of the Brain and the Graduiertenkolleg GRK 782 in Göttingen (Germany). H.H. was supported by a Liebig Fellowship from the Stiftung Stipendien-Fonds of the Fonds der Chemischen Industrie.
Author contributions: H.H., W.H., and M.B. designed research and wrote the paper; H.H., W.H., S.B., O.C.A., and D.R. performed research; and H.H. and M.B. analyzed data.
This paper was submitted directly (Track II) to the PNAS office.
Abbreviations: MAS, magic angle spinning; CP, cross-polarization; SD, spin diffusion; Aβ, amyloid β; AS, α-synuclein; INEPT, insensitive nuclei enhanced by polarization transfer.
References
- 1.Dobson, C. M. (2003) Nature 426, 884-890. [DOI] [PubMed] [Google Scholar]
- 2.Soto, C. (2003) Nat. Rev. Neurosci. 4, 49-60. [DOI] [PubMed] [Google Scholar]
- 3.Dobson, C. M. (2001) Philos. Trans. R. Soc. London. B 356, 133-145. [DOI] [PMC free article] [PubMed] [Google Scholar]
- 4.Forman, M. S., Trojanowski, J. Q. & Lee, V. M. (2004) Nat. Med. 10, 1055-1063. [DOI] [PubMed] [Google Scholar]
- 5.Tycko, R. (2004) Curr. Opin. Struct. Biol. 14, 96-103. [DOI] [PubMed] [Google Scholar]
- 6.Cookson, M. R. (2005) Annu. Rev. Biochem. 74, 29-52. [DOI] [PubMed] [Google Scholar]
- 7.Caughey, B. & Lansbury, P. T. (2003) Annu. Rev. Neurosci. 26, 267-298. [DOI] [PubMed] [Google Scholar]
- 8.Giasson, B. I. & Lee, V. M. Y. (2003) Cell 114, 1-8. [DOI] [PubMed] [Google Scholar]
- 9.Dev, K. K., Hofele, K., Barbieri, S., Buchman, V. L. & van der Putten, H. (2003) Neuropharmacology 45, 14-44. [DOI] [PubMed] [Google Scholar]
- 10.Weinreb, P. H., Zhen, W. G., Poon, A. W., Conway, K. A. & Lansbury, P. T. (1996) Biochemistry 35, 13709-13715. [DOI] [PubMed] [Google Scholar]
- 11.Eliezer, D., Kutluay, E., Bussell, R. & Browne, G. (2001) J. Mol. Biol. 307, 1061-1073. [DOI] [PubMed] [Google Scholar]
- 12.Bertoncini, C. W., Jung, Y.-S., Fernandez, C. O., Hoyer, W., Griesinger, C., Jovin, T. M. & Zweckstetter, M. (2005) Proc. Natl. Acad. Sci. USA 102, 1430-1435. [DOI] [PMC free article] [PubMed] [Google Scholar]
- 13.Iwai, A., Yoshimoto, M., Masliah, E. & Saitoh, T. (1995) Biochemistry 34, 10139-10145. [DOI] [PubMed] [Google Scholar]
- 14.Serpell, L. C., Berriman, J., Jakes, R., Goedert, M. & Crowther, R. A. (2000) Proc. Natl. Acad. Sci. USA 97, 4897-4902. [DOI] [PMC free article] [PubMed] [Google Scholar]
- 15.Li, W., West, N., Colla, E., Pletnikova, O., Troncoso, J. C., Marsh, L., Dawson, T. M., Jakala, P., Hartmann, T., Price, D. L. & Lee, M. K. (2005) Proc. Natl. Acad. Sci. USA 102, 2162-2167. [DOI] [PMC free article] [PubMed] [Google Scholar]
- 16.Conway, K. A., Harper, J. D. & Lansbury, P. T. (2000) Biochemistry 39, 2552-2563. [DOI] [PubMed] [Google Scholar]
- 17.Hoyer, W., Antony, T., Cherny, D., Heim, G., Jovin, T. M. & Subramaniam, V. (2002) J. Mol. Biol. 322, 383-393. [DOI] [PubMed] [Google Scholar]
- 18.Miake, H., Mizusawa, H., Iwatsubo, T. & Hasegawa, M. (2002) J. Biol. Chem. 277, 19213-19219. [DOI] [PubMed] [Google Scholar]
- 19.Der-Sarkissian, A., Jao, C. C., Chen, J. & Langen, R. (2003) J. Biol. Chem. 278, 37530-37535. [DOI] [PubMed] [Google Scholar]
- 20.Andrew, E. R., Bradbury, A. & Eades, R. G. (1958) Nature 182, 1659. [Google Scholar]
- 21.Lansbury, P. T., Costa, P. R., Griffiths, J. M., Simon, E. J., Auger, M., Halverson, K. J., Kocisko, D. A., Hendsch, Z. S., Ashburn, T. T., Spencer, R. G. S., et al. (1995) Nat. Struct. Biol. 2, 990-998. [DOI] [PubMed] [Google Scholar]
- 22.Benzinger, T. L. S., Gregory, D. M., Burkoth, T. S., Miller-Auer, H., Lynn, D. G., Botto, R. E. & Meredith, S. C. (1998) Proc. Natl. Acad. Sci. USA 95, 13407-13412. [DOI] [PMC free article] [PubMed] [Google Scholar]
- 23.Laws, D. D., Bitter, H. M. L., Liu, K., Ball, H. L., Kaneko, K., Wille, H., Cohen, F. E., Prusiner, S. B., Pines, A. & Wemmer, D. E. (2001) Proc. Natl. Acad. Sci. USA 98, 11686-11690. [DOI] [PMC free article] [PubMed] [Google Scholar]
- 24.Petkova, A. T., Ishii, Y., Balbach, J. J., Antzutkin, O. N., Leapman, R. D., Delaglio, F. & Tycko, R. (2002) Proc. Natl. Acad. Sci. USA 99, 16742-16747. [DOI] [PMC free article] [PubMed] [Google Scholar]
- 25.Jaroniec, C. P., MacPhee, C. E., Bajaj, V. S., McMahon, M. T., Dobson, C. M. & Griffin, R. G. (2004) Proc. Natl. Acad. Sci. USA 101, 711-716. [DOI] [PMC free article] [PubMed] [Google Scholar]
- 26.Siemer, A. B., Ritter, C., Ernst, M., Riek, R. & Meier, B. H. (2005) Angew. Chem. Int. Ed. Engl. 44, 2441-2444. [DOI] [PubMed] [Google Scholar]
- 27.Petkova, A. T., Leapman, R. D., Guo, Z., Yau, W.-M., Mattson, M. P. & Tycko, R. (2005) Science 307, 262-265. [DOI] [PubMed] [Google Scholar]
- 28.Ritter, C., Maddelein, M.-L., Siemer, A. B., Luhrs, T., Ernst, M., Meier, B. H., Saupe, S. J. & Riek, R. (2005) Nature 435, 844-848. [DOI] [PMC free article] [PubMed] [Google Scholar]
- 29.Vuister, G. W., Kim, S. J., Wu, C. & Bax, A. (1994) J. Am. Chem. Soc. 116, 9206-9210. [Google Scholar]
- 30.Andronesi, O. C., Becker, S., Seidel, K., Heise, H., Young, H. S. & Baldus, M. (2005) J. Am. Chem. Soc. 127, 12965-12974. [DOI] [PubMed] [Google Scholar]
- 31.Hoyer, W., Cherny, D., Subramaniam, V. & Jovin, T. M. (2004) Biochemistry 43, 16233-16242. [DOI] [PubMed] [Google Scholar]
- 32.Baldus, M., Petkova, A. T., Herzfeld, J. & Griffin, R. G. (1998) Mol. Phys. 95, 1197-1207. [Google Scholar]
- 33.Hartmann, S. R. & Hahn, E. L. (1962) Phys. Rev. 128, 2042-2053. [Google Scholar]
- 34.Fung, B. M., Khitrin, A. K. & Ermolaev, K. (2000) J. Magn. Reson. 142, 97-101. [DOI] [PubMed] [Google Scholar]
- 35.Hohwy, M., Rienstra, C. M., Jaroniec, C. P. & Griffin, R. G. (1999) J. Chem. Phys. 110, 7983-7992. [Google Scholar]
- 36.Baldus, M. (2002) Prog. Nucl. Magn. Reson. Spectrosc. 41, 1-47. [Google Scholar]
- 37.Astrof, N. S., Lyon, C. E. & Griffin, R. G. (2001) J. Magn. Reson. 152, 303-307. [DOI] [PubMed] [Google Scholar]
- 38.Seidel, K., Lange, A., Becker, S., Hughes, C. E., Heise, H. & Baldus, M. (2004) Phys. Chem. Chem. Phys. 6, 5090-5093. [Google Scholar]
- 39.Baldus, M. & Meier, B. H. (1996) J. Magn. Reson. Ser. A 121, 65-69. [Google Scholar]
- 40.Baldus, M., Iuliucci, R. J. & Meier, B. H. (1997) J. Am. Chem. Soc. 119, 1121-1124. [Google Scholar]
- 41.Hardy, E. H., Verel, R. & Meier, B. H. (2001) J. Magn. Reson. 148, 459-464. [DOI] [PubMed] [Google Scholar]
- 42.Morris, G. A. & Freeman, R. (1979) J. Am. Chem. Soc. 101, 760-762. [Google Scholar]
- 43.Cornilescu, G., Delaglio, F. & Bax, A. (1999) J. Biomol. NMR 13, 289-302. [DOI] [PubMed] [Google Scholar]
- 44.Lange, A., Luca, S. & Baldus, M. (2002) J. Am. Chem. Soc. 124, 9704-9705. [DOI] [PubMed] [Google Scholar]
- 45.Bloembergen, N. (1949) Physica 15, 386-426. [Google Scholar]
- 46.Muchmore, D. C., McIntosh, L. P., Russell, C. B., Anderson, D. E. & Dahlquist, F. W. (1989) Methods Enzymol. 177, 44-73. [DOI] [PubMed] [Google Scholar]
- 47.Waugh, D. S. (1996) J. Biomol. NMR 8, 184-192. [DOI] [PubMed] [Google Scholar]
- 48.Wishart, D. S., Bigam, C. G., Holm, A., Hodges, R. S. & Sykes, B. D. (1995) J. Biomol. NMR 5, 67-81. [DOI] [PubMed] [Google Scholar]
- 49.Schwarzinger, S., Kroon, G. J. A., Foss, T. R., Chung, J., Wright, P. E. & Dyson, H. J. (2001) J. Am. Chem. Soc. 123, 2970-2978. [DOI] [PubMed] [Google Scholar]
- 50.Carulla, N., Caddy, G. L., Hall, D. R., Zurdo, J., Gairi, M., Feliz, M., Giralt, E., Robinson, C. V. & Dobson, C. M. (2005) Nature 436, 554-558. [DOI] [PubMed] [Google Scholar]
- 51.Spillantini, M. G., Crowther, R. A., Jakes, R., Hasegawa, M. & Goedert, M. (1998) Proc. Natl. Acad. Sci. USA 95, 6469-6473. [DOI] [PMC free article] [PubMed] [Google Scholar]
- 52.Seidel, K., Etzkorn, M., Heise, H., Becker, S. & Baldus, M. (2005) Chembiochem. 11, 1638-1647. [DOI] [PubMed] [Google Scholar]
- 53.Giasson, B. I., Murray, I. V. J., Trojanowski, J. Q. & Lee, V. M. Y. (2001) J. Biol. Chem. 276, 2380-2386. [DOI] [PubMed] [Google Scholar]
- 54.Chien, P., Weissman, J. S. & DePace, A. H. (2004) Annu. Rev. Biochem. 73, 617-656. [DOI] [PubMed] [Google Scholar]
- 55.Prusiner, S. B., Scott, M. R., DeArmond, S. J. & Cohen, F. E. (1998) Cell 93, 337-348. [DOI] [PubMed] [Google Scholar]
- 56.Goedert, M. (2001) Nat. Rev. Neurosci. 2, 492-501. [DOI] [PubMed] [Google Scholar]
Associated Data
This section collects any data citations, data availability statements, or supplementary materials included in this article.