

Abstract
The bioactivity of galectin-1 in cell growth regulation and adhesion prompted us to answer the questions whether ligand presence and a shift to an aprotic solvent typical for bioaffinity chromatography might alter the shape of the homodimeric human lectin in solution. We used small angle neutron and synchrotron x-ray scattering studies for this purpose. Upon ligand accommodation, the radius of gyration of human galectin-1 decreased from 19.1 ± 0.1 Å in the absence of ligand to 18.2 ± 0.1 Å. In the aprotic solvent dimethyl sulfoxide, which did not impair binding capacity, galectin-1 formed dimers of a dimer, yielding tetramers with a cylindrical shape. Intriguingly, no dissociation into subunits occurred. In parallel, NMR monitoring was performed. The spectral resolution was in accord with these data. In contrast to the properties of the human protein, a nonhomologous agglutinin from mistletoe sharing galactose specificity was subject to a reduction in the radius of gyration from ∼62 Å in water to 48.7 Å in dimethyl sulfoxide. Evidently, the solvent caused opposite responses in the two tested galactoside-binding lectins with different folding patterns. We have hereby proven that ligand presence and an aprotic solvent significantly affect the shape of galectin-1 in solution.
INTRODUCTION
Lectins constitute a superfamily of ubiquitously distributed proteins which are described and characterized in a steadily increasing number of publications (Rüdiger et al., 2000). They are defined as carbohydrate-binding proteins which are distinct from immunoglobulins, do not enzymatically alter the structure of their ligands, and do not act as sensor/transport proteins for free mono- or disaccharides. The current interest in the analysis of lectins and protein-carbohydrate interactions originates mainly from two areas. First, due to the emergence of the concept that oligosaccharides can serve as information-storing code units (Solís et al., 2001; Gabius et al., 2002), these carbohydrate-specific binding proteins can be assigned to mediate crucial cell activities including fertilization, cell growth and apoptosis, cell adhesion and migration, endocytosis, and immune mediator production/release (Gabius, 1987, 2000, 2001a; Lis and Sharon, 1998; Sinowatz et al., 1998; André et al., 1999; Reuter and Gabius, 1999; Rorive et al., 2001; Angata and Brinkman-van der Linden, 2002; Dahms and Hancock, 2002; Weigel and Yik, 2002). Second, lectins have the ability to bind glycans with distinct structures. They can thus be employed as versatile tools to isolate and characterize diverse glycans of medical or technological interest (Cummings, 1997; Cartellier et al., 2002). In this area of application, e.g., when working with glycolipids, it will be necessary to use organic solvents; for example, an aprotic solvent such as dimethyl sulfoxide (DMSO) to substitute the natural aqueous environment for disrupting micelles formed by glycolipids. An illustrative example for such an application is the purification of glycolipids by lectin affinity chromatography performed in tetrahydrofuran (Smith and Torres, 1989). Another emerging approach using aprotic solvents is the conformational analysis of bound carbohydrate ligands by transferred nuclear Overhauser effect spectroscopy exploiting the water-exchangeable hydroxyl protons as sensors (Siebert et al., 2000). However, it is currently not generally known how the solvent change will affect lectin structures and consequently the ligand-binding properties.
Because water is the natural solvent for proteins (Israelachvili and Wennerström, 1996), most studies of biological interaction have focused on an aqueous environment. A notable exception is the study of nonaqueous enzymology. Spurred by the technological interest to exploit enzyme activity in organic solvent for synthetic procedures, considerable progress has been achieved in the analysis of response of enzyme activities toward solvent changes (Singer, 1962; Klibanov, 2001; Mattos and Ringe, 2001). Intriguingly, enzymes such as lipase, lysozyme, and subtilisin retained their activities in organic solvents (Klibanov, 2001; Sandoval et al., 2001). Furthermore, they were found to exhibit remarkable changes of their properties including altered specificity, increased thermal stability, and molecular memory (Fitzpatrick et al., 1993; Dai and Klibanov, 1999; Klibanov, 2001). These properties prompted their exploitation in large-scale synthetic procedures, in which using an organic solvent as reaction medium can offer advantages such as increased solubility of hydrophobic compounds and an improved recovery of products (Sandoval et al., 2001; Lee and Dordick, 2002).
To initiate the detailed analysis of solvent-dependent alterations of lectin structure, we selected an endogenous lectin from the galectin family as a role model based on the following reasons: 1), galectins are widely present in human and animal tissues with relevance for mediation of the mentioned cellular processes (Kaltner and Stierstorfer, 1998; André et al., 1999; Gabius, 2001b; Lahm et al., 2001; Cooper, 2002; Danguy et al., 2002; Rabinovich et al., 2002); 2), the application of endogenous lectins for analytical and medical procedures is preferable to that of plant lectins, because these two types of lectins differ in their fine-specificities, rendering physiological considerations based on measurements with plant lectins problematic, and because the tissue product will be nonimmunogenic enabling therapeutic trials (Rabinovich et al., 1999, 2002; Gabius, 2001a,b); 3), galectins from mammals, other vertebrates, and also invertebrates share a general folding pattern, i.e., the jellyroll motif, with pentraxins, the intracellular chaperones calnexin/calreticulin and transporter ERGIC53/p58, neurexins, and leguminous lectins (Gabius, 1997; Lis and Sharon, 1998; Shirai et al., 1999; Varela et al., 1999; Bianchet et al., 2000; Rüdiger and Gabius, 2001; Loris, 2002), the results therefore harboring relevance beyond the galectin family; 4), galectin-1 has been demonstrated to bind to neutral glycolipids and gangliosides with biological implication for cell adhesion and growth control (Mahanthappa et al., 1994; Kopitz et al., 1998, 2001), enabling purification of bioactive glycolipids by using galectin-1 in affinity chromatography as demonstrated for glycoproteins (Gabius et al., 1991); 5), human galectin-1 has been shown to trigger clinically relevant processes such as tumor invasion into parenchyma in glioblastoma, T-cell apoptosis in the Sézary syndrome and immunological disorders such as autoimmune diseases, and induction of nonclassical apoptosis in neuroblastoma with relevance for tumor regression (Kopitz et al., 2001; Rorive et al., 2001; Camby et al., 2002; Rabinovich et al., 2002; Rappl et al., 2002); 6), the quaternary structure of this galectin is indispensable for ligand cross-linking triggering signaling (Villalobo and Gabius, 1998; Brewer, 2002); and 7), galectin-1 has been shown by ligand assays and NMR spectroscopy to retain carbohydrate-specific binding in DMSO (Siebert et al., 2000). As mentioned above, this property affords access to conformational parameters of the otherwise elusive hydroxyl protons to improve the description of the ligand's bound-state topology. Such information is essential for further refinements in drug design by rational affinity enhancements (Gabius, 1998; Rüdiger et al., 2000; André et al., 2001). Based on this reasoning we decided to assay the properties of human galectin-1 as a model system in DMSO (as aprotic solvent) relative to water.
To gain insight into the response of protein structure to exposure to an organic solvent, investigation of the protein's conformation in water is the first step. Monitoring protein structure in the aprotic solvent then allows direct comparison of these structure data with those obtained in aqueous environment, as previously performed for the enzyme subtilisin Carlsberg (Griebenow and Klibanov, 1997). For such a comparison to be completed, the availability of the atomic structure from x-ray crystallography and/or from NMR spectroscopy is very helpful. Fitzpatrick et al. (1993, 1994) elucidated this enzyme's crystal structure in acetonitrile and in water. A major conclusion of their work was that its structure in the organic solvent was significantly rigidified (i.e., a reduction in mobility) compared to that when being dissolved in water. This change was reflected on the level of the overall average B factor decreasing from 13.8 Å2 to 10.4 Å2. This parameter is a measure for the relative mobility of atoms. However, because the crystal packing force might influence this aspect of protein behavior, it is necessary to further analyze proteins free in solution (in aqueous and nonaqueous media). As also briefly demonstrated in our study, the scope of analysis of proteins with molecular masses beyond 10–12 kDa by NMR spectroscopy will often be severely restricted. At this stage, other approaches to measure structural parameters of proteins come into play.
Solution scattering provides information on the overall size and shape of proteins in solution under conditions which are close (if not identical) to being physiological (Zaccai and Jacrot, 1983; Vachette and Svergun, 2000). Recent studies have even proven that low-resolution structures of biological macromolecules including proteins can be successfully calculated from solution scattering curves using ab initio approaches (Chacón et al., 1998; Svergun, 1999; Byron and Gilbert, 2000; Svergun et al., 2001). Also, solution scattering has proven valuable to determine dynamic conformation transition of proteins at various solvent conditions (Réat et al., 2000; Tehei et al., 2001; Paciaroni et al., 2002). In the present study, small angle neutron scattering (SANS) and small angle x-ray scattering (SAXS) experiments were performed to study the conformation of human galectin-1 in water and in the organic solvent. With the available data set of the crystal structure of the closely related bovine galectin-1 (Bourne et al., 1994; Liao et al., 1994), we analyzed the solution scattering data of human galectin-1 in water and DMSO in detail. By employing the ab initio-method referred to as dummy atom model (DAM), we also obtained information, if and to what extent the shape and quaternary structure of galectin-1 change in DMSO. To address the issue whether the behavior observed for human galectin-1 will only be encountered for a protein with the jellyroll-like motif, we further tested another galactose-binding lectin which retains ligand-binding capacity in DMSO (Siebert et al., 2000). It is a toxic protein from mistletoe, referred to as Viscum album agglutinin (VAA). Its folding pattern, closely related to that of ricin, is a double trefoil structure in crystals (Sweeney et al., 1998).
MATERIALS AND METHODS
Materials
N-Acetyllactosamine and [D6]DMSO (deuteration grade >99.9%) were purchased from Sigma Chemical (Steinheim, Germany). D2O (deuteration grade >99.8%) was obtained from Merck (Darmstadt, Germany). A high-purity water system was used to produce H2O. All other reagents were of analytical grade.
Purification of galectin-1 and VAA
Human galectin-1 was purified from placenta using affinity chromatography on lactosylated Sepharose 4B as the crucial step, and standard electrophoresis and gel filtration analyses as well as hemaglutination assays were used to ascertain purity (Gabius et al., 1985, 1987; Gabius, 1990). To protect galectin-1 against oxidative inactivation, it was treated with a cysteine-modifying reagent, iodoacetamide, during elution from the affinity resin (Powell and Whitney, 1984; Whitney et al., 1986). Further quality control included spectroscopic analysis (UV spectra, circular dichroism) using the data from Sharma et al. (1990) as reference values. The galectin-1 fractions were extensively dialyzed against water and lyophilized. The purification of VAA started from aqueous extracts of dried mistletoe leaves and also used affinity chromatography on lactosylated Sepharose as the crucial step as previously described (Gabius, 1990). Analysis by gel filtration, gel electrophoresis, ligand binding, and cell growth assays ascertained the maintenance of the disulfide bridge between the two subunits of the AB-toxin and its biological activity after lyophilization (André et al., 2001; Gabius et al., 2001).
Preparation of samples
The buffers were filtrated through 0.2 μm Millipore membranes to remove any particle contaminations. To prepare the aqueous solution of the protein under study, lyophilized galectin-1 powder was dissolved in 20 mM phosphate buffer (pH 7.2, prepared with H2O for SAXS and dynamic light scattering experiments; pD 7.2, prepared with D2O for SANS experiments). The required pD (D2O) and pH (H2O) values of the buffers were obtained by mixing standard solutions after calculation using the pKa-values of the phosphate salts. The pH value of the buffer using H2O was confirmed by a glass electrode measurement (deviation between measurement and theoretical calculation was 0.02). The protein solutions were centrifuged to remove any insoluble material. Because galectin-1 is highly soluble in phosphate buffer, its concentration in the buffer was calculated by weight balance. To ensure that there was no water in organic solution of galectin-1, neat [D6]DMSO was added to lyophilized galectin-1 powder. After gently shaking, the remaining fraction of protein not dissolved in DMSO was removed by centrifugation at 5000 rpm for 10 min, and the supernatants were centrifuged a second time under the same condition to ensure removal of residual undissolved material. The galectin-1 concentration in DMSO was measured by the Bradford method using pure galectin-1 in phosphate buffer as standard (Bradford, 1976). To yield the same concentration in DMSO as that in water, the galectin-1 amount required was doubled due to solubility problems. Solutions containing VAA were prepared using essentially the same procedure. Interestingly, lyophilized powder of VAA is very soluble in neat DMSO and a concentration of 9.6 mg/ml can readily be reached, whereas its solubility after lyophilization was rather restricted in phosphate buffer, nearly half of VAA remaining insoluble. To keep all parameters constant except for the choice of the solvent, lyophilized samples were routinely used as starting material.
NMR experiments
500 MHz 1H-NMR spectra were recorded with an AMX 500 spectrometer at 300 K using lectin solutions in either D2O or [D6]DMSO. As starting material, 3 mg of lectin was dissolved in 0.5 ml solvent. To obtain spectra free of artifacts for direct comparison, parameter settings (td = 32 k; sw = 16 ppm; p1 = 30°; d1 = 0.1 s; and ns = 80) were kept constant.
SANS experiments
The SANS experiments were performed on the instrument SANS-1 at the Geesthacht Neutron Facility GeNF, Geesthacht, Germany (Stuhrmann et al., 1995). Four sample-to-detector distances (from 0.7 to 7 m) were employed to cover the range of the modules of the scattering vectors q (q = 4π sin θ/λ, where 2θ is the scattering angle and λ is the wavelength) from 0.01 to 0.25 Å−1. In all experiments, the neutron wavelength λ was 8.5 Å (measured by routine time-of-flight experiments) with a wavelength resolution of 10% (full width at half-maximum value). The calibration of q was performed by scattering measurements of silver behenate. The samples were kept in quartz cells (Hellma, Müllheim, Germany) with a path length of 1 mm, which were placed in a thermostatic sample holder to maintain isothermal conditions.
The two-dimensional isotropic scattering patterns were azimuthally averaged, converted to an absolute scale, and corrected for detector efficiency by using the incoherent scattering pattern of pure water (Wignall and Bates, 1987). The background from the solvent and sample cell was subtracted from the raw patterns by conventional procedures (Cotton, 1991).
SAXS experiments
Following standard experimental procedures (Koch and Bordas, 1983; Boulin et al., 1988), the SAXS experiment was performed on the instrument X33 NCS at the European Molecular Biology Laboratory outstation in Hamburg, Germany. The measurements were carried out with a position-sensitive gas detector at a wavelength of 1.5 Å. The modules of the scattering vector were calibrated by using collagen (periodicity of 65 nm) and tripalmitin (periodicity of 4.06 nm) as standards. The data were normalized to the incident beam and corrected for detector response. Scattering by the buffer background, which was detected before and after the sample measurements, was subtracted from the data of the sample. All procedures involving statistical error estimation were performed using the program SAPOKO (D.I. Svergun and M.H.J. Koch, unpublished results).
Diffusion coefficients
The experimental diffusion coefficient of the protein in phosphate buffer was measured by dynamic light scattering using the DYNAPro99 system (Protein Solution, Lakewood, NJ). The laser wavelength was 8312 Å and the scattering angle was 90°. The program Hydro (Garcia de la Torre et al., 2000) was used to estimate the theoretical diffusion coefficient from the protein crystal structure. The method was based on bead-modeling strategies. Starting from the atomic structure of a protein, the program first constructs a filling model in which the protein is represented by a particle filled with beads arranged in the most closely packed hexagonal lattice. In the next step, all internal beads are removed and the program finally obtains a rough shell model which is an adequate description of the hydrodynamic properties (e.g., diffusion coefficient) of an arbitrarily shaped particle.
IFT analysis of the scattering data
To obtain the radii of gyration of the particles and their pair distance distribution function p(r), the indirect Fourier transformation (IFT) method was employed to process scattering data. The IFT method does not require a pre-assumption regarding the shape of the particles. In the IFT method (Glatter, 1977), the radius of gyration of particles is given as
 |
(1) |
where Dmax is the upper limit for the maximum particle dimension which satisfies p(r) = 0 at r > Dmax, and p(r) is the pair distance distribution function of a particle. The p(r) function is approximated by a linear combination of a finite number of cubic B-spline functions ϕi(r),
 |
(2) |
where the expansion coefficients ci are fitting parameters determined from the scattering data. The values of Dmax were carefully chosen to ensure accurate fitting of the experimental data and smooth p(r) functions. In the present work, IFT analyses were performed by the program GNOM using perceptual criteria (Svergun, 1992) and/or by the Fortran program GLATTER.FOR provided by Pedersen (Pedersen et al., 1990; Pedersen, 1997), in which background such as incoherent scattering by protons of the sample can be taken into account. These two procedures of analysis gave identical results.
Scattering data evaluation from atomic coordinates
The scattering data were further evaluated from atomic coordinates using the program CRYSON for SANS data (Svergun et al., 1998) and the program CRYSOL for SAXS data (Svergun et al., 1995). In both programs, the scattering from the protein is calculated as
 |
(3) |
where A(q) is the atomic scattering amplitude from the protein in vacuum, E(q) and B(q) refer to the scattering from the excluded volume and the solvent shell, respectively, ρs is the density of the bulk solvent, and ρb is the density of the solvent layer. In the aqueous system (D2O or H2O), a default value of 1.1 × ρs is employed for ρb in the calculation (Svergun et al., 1998). For the protein in DMSO, we assumed that the density of the solvent layer ρb is identical to the density of the bulk solvent ρs.
Model fitting
Simple geometrical arrangements such as an ellipsoid or a cylinder are often used to gauge the shape of particles such as micelles and proteins (Pedersen, 1997; He et al., 2000, 2002). The shape parameters for these simple topologies can be determined by fitting the scattering data. The detailed mathematical descriptions of the cylindrical and ellipsoidal models are given in the literature (Feigin and Svergun, 1987; Pedersen, 1997; He et al., 2002).
To analyze the mixture properties of the protein in solution (e.g., mixture of monomer and oligomers), the programs OLIGOMER and MIXTURE were employed. These programs can be obtained from the web site of the European Molecular Biology Laboratory outstation Hamburg (http://www.embl-hamburg.de/ExternalInfo/Research/Sax/program.html).
Calculation of galectin-1 structure in DMSO
The shape of the galectin-1 in DMSO was calculated from the neutron scattering data using the program DAMIN (i.e., ab initio shape determination by simulated annealing using a single phase dummy atom model (DAM), as described by Svergun, 1999). Looseness and interconnectivity criteria were employed in DAM to ensure that the obtained model is physically meaningful. In the calculation procedure, a sphere with a diameter Dmax is filled by a regular grid of points corresponding to a dense hexagonal packing of small spheres (dummy atoms) of the radius r0 (r0 ≪ Dmax). The structure of the DAM is defined by a configuration vector X assigning an index to each atom (“0” corresponds to solvent and “1” to the solute particle). Scattering intensity from DAM was calculated and compared to the experimental scattering curve. This fitting process was performed using simulated annealing to achieve the global minimization of f(X):
 |
(4) |
where α > 0 is the weight of the looseness penalty, P(X) is the function describing the average looseness, and χ is the discrepancy which is defined as
 |
(5) |
where N is the number of experimental points, I(q) is the calculated intensity, Iexp(q) is the experimental intensity, and σ is the standard deviation of the experimental intensity. Detailed description of DAM can be found in the literature (Svergun, 1999).
It should be noted that the experimental scattering intensity was subtracted by a constant before being fitted by the DAMIN program. The data after subtraction are referred to as shape-scattering data. This treatment ensured that the data did not contain internal structure information of the protein. The constant was determined by the slope in the curve of I × q4 against q4 at high angle. Thus, the intensity after subtraction decays as q−4 at high q-value, following Porod's law for homogeneous particles (Porod, 1982; Svergun, 1999).
RESULTS AND DISCUSSION
Monitoring the scattering profile of galectin-1 in aqueous solution and comparison of structural aspects in solution and crystal
To study structural aspects of human galectin-1 in solution, SANS and SAXS analyses were carried out, starting with monitoring in aqueous solution. Except for an early report on human galectin-1 after storage (Hirabayashi et al., 1987), the majority of respective contributions on this topic agreed on the result obtained by gel filtration and hemaglutination that this prototype galectin is a homodimer in buffered solution (Gabius et al., 1985; Allen et al., 1987; Nambiar et al., 1987; Giudicelli et al., 1997). It is also known that bovine galectin-1 exists as a dimer in the crystal phase (Bourne et al., 1994; Liao et al., 1994). β-Sheet hydrogen bonding across the monomer surface in the interface and formation of a hydrophobic core stabilized the contact (Liao et al., 1994; Varela et al., 1999). Because the amino-acid sequence of human galectin-1 (Hirabayashi and Kasai, 1988; Abbott and Feizi, 1989; Couraud et al., 1989; Hirabayashi et al., 1989; Bladier et al., 1991) shows a high identity (86%, pairwise alignments) to that of bovine galectin-1 (Abbott et al., 1989), the available crystal structure of bovine galectin-1 (PDB entry 1SLT) was confidently employed to evaluate the scattering data using the program CRYSOL. Also, homology modeling with calculation of surface accessibilities for selected amino acid residues (i.e., His, Tyr, and Trp) and the experimental determination of these parameters by the laser photo-CIDNP (chemically induced dynamic nuclear polarization) technique for human and bovine galectin-1 underscored the validity of this approach (Siebert et al., 1997). In Fig. 1 A, the experimental SAXS spectra and the theoretical curve predicted by CRYSOL on the basis of crystallographic data illustrated in Fig. 1 B are compared. In the theoretical prediction, default parameters (the theoretical excluded volume and a hydration layer density of 1.1 g/ml) were employed. At low q-values, experimental and theoretical data sets are evidently in good agreement. At high q-values, although discrepancies between the experimental points and the theoretical curve were observed, these differences were within the limit of experimental errors (fitting results with χ = 0.559). This result lends credence to the conclusion that human galectin-1 has a similar conformation in crystal and in aqueous solution, corroborating the mentioned experimental evidence. In addition, we performed monitoring of the scattering spectra in SANS and determination of the diffusion coefficient. Unequivocally, the results from these experimental approaches delineated the homodimeric nature of human galectin-1 in buffered aqueous solution. The comparison between the experimental results and the theoretical value calculated from the atomic coordinates of the crystal structure are summarized in Table 1. The experimental values from three different measurements obviously accord remarkably well with those predicted from atomic coordinates. Crystal packing will thus not affect the structural parameters, as determined in solution by the applied methods. One particular aspect of Table 1 deserves further comment.
FIGURE 1.

(A) Comparison of the experimental SAXS spectra of human galectin-1 with the theoretical prediction (solid curve) based on the atomic structure. Experimental condition was 9 mg/ml galectin-1 in 20 mM phosphate buffer (H2O), pH 7.2, measured at room temperature. In the theoretical calculation by the program CRYSOL, the density of the hydration layer at the protein-solvent interface was assumed to be 10% higher than that of the bulk solution (Svergun et al., 1998). (B) The crystal structure of bovine galectin-1 (PDB entry 1SLT) was employed in the prediction. The structure on the right was rotated counterclockwise by 90° around the x-axis. The axes in the bottom were drawn in the scale rod of 1 nm.
TABLE 1.
Comparison of experimental results and theoretically calculated data of galectin-1 in aqueous solution
| Experiments
|
Calculation from crystal structure
|
|||
|---|---|---|---|---|
| Experimental conditions* | Measured value† | Calculated value‡ | Program§ | |
| SAXS | c = 9 mg/ml, in H2O, room temperature | Rg = 20.8 ± 0.3 Å | Rg = 20.6 Å (20.9 Å) | CRYSOL |
| SANS | c = 7.6 mg/ml, in D2O, T = 298 K | Rg = 19.1 ± 0.1 Å | Rg = 18.6 Å (18.9 Å) | CRYSON |
| DLS | c = 1 mg/ml, in H2O, T = 293 K | D = 7.9 × 10⁻⁷ cm2/s | D = 8.2 × 10⁻⁷ cm2/s | Hydro |
All experiments were performed in 20 mM phosphate buffer (pH 7.2 for H2O and pD 7.2 for D2O).
Rg, radius of gyration; D, diffusion coefficient.
Calculated from the atomic coordinates of bovine galectin-1 available in the Protein Data Bank (PDB entry 1SLT), the values in brackets were calculated based on the atomic coordinates of galectin-1 from amphibian species (Vasta et al., 1997; Bianchet et al., 2000) using PDB entry 1GAN.
Default parameter values in the programs were employed, and there was no fitting of the experimental data.
As shown in Table 1, the radius of gyration of galectin-1 measured by SAXS (20.8 Å) is larger than that assessed by SANS (19.1 Å). Recently, this general phenomenon that SAXS and SANS data can give different radii of gyration for an identical protein was explained by Svergun et al. (1998). At the protein-solvent interface, there is a tightly bound hydration layer whose density is higher than that of the bulk solvent. Due to the different scattering length densities of molecules for SANS and SAXS, the comparatively very dense hydration layer can contribute markedly to the radius of gyration measured from SAXS in a positive way, whereas it affects that from SANS negatively (Svergun et al., 1998). This phenomenon results in a higher value for the radius of gyration of proteins from SAXS data than that from SANS data. Having verified the validity of these experimental approaches for this protein under study, we next addressed the issue whether binding of the ligand can affect structural parameters of galectin-1 in solution.
Another aspect deserves special attention at this stage. To keep experimental conditions similar (if not identical) and also to facilitate solvent exchange, we worked with lyophilized proteins. Our results revealed that the structure of the rehydrated protein in aqueous medium is indistinguishable from the crystal structure excluding a major structure change or denaturation, as discussed for other protein types (Griebenow and Klibanov, 1995). These insights into global aspects of galectin-1 structure are in agreement with lessons drawn from the activity assays after rehydration (Siebert et al., 2000). Regarding the comparison between structural aspects in the crystal and in solution, we next addressed the question as to whether and to what extent binding of the ligand to the carbohydrate recognition domain affects this receptor's overall shape. It is in fact an open question whether ligand diffusion into a crystal is capable to trigger those conformational alterations in the highly packed arrangement, which might occur for individual protein molecules free in solution.
Effect of ligand presence on the conformation of galectin-1
N-Acetyllactosamine is a proven high-affinity ligand for galectin-1. In isothermal titration calorimetrical experiments at 300 K, ΔG of binding by bovine galectin-1 was determined to be −5.5 kcal/mol (Ahmad et al., 2002). Oligomers of this ligand, i.e., poly-N-acetyllactosamine, are present in glycan chains of natural galectin ligands such as laminin and lysosome-associated membrane proteins (André et al., 1999). Topological consequences of the binding process have been delineated in the case of the ligand. The disaccharide can exhibit three different low-energy conformations defined by distinct φ, ψ-combinations of the dihedral angles of the glycosidic bond, and the combination of molecular modeling with NMR spectroscopic measurements demonstrated that galectin-1 and its homologs selected the syn conformation of the ligand from the ensemble of the three conformers present in solution (Siebert et al., 1996; Gabius, 1998; Asensio et al., 1999; Alonso-Plaza et al., 2001). Our experimental design will enable us to monitor structural properties of the receptor upon ligand binding in solution. The ligand effect on galectin-1 structure was studied by SANS. In Fig. 2 A, the scattering spectra of galectin-1 in the presence and the absence of 10 mM N-acetyllactosamine are compared. At low angle, the scattering intensities in the presence of ligand were lower than those in the absence of the ligand. On the contrary, the presence of ligand resulted in an increase of the intensities at high angle. These scattering data were further analyzed by the IFT methods to obtain their p(r) function and the radius of gyration. The radius of gyration of human galectin-1 in the presence of the ligand was 18.2 ± 0.1 Å whereas the value in the absence of the ligand was 19.1 ± 0.1 Å. Because of the small inherent error (0.1 Å) in our determination of the radius of gyration, this measured difference is generally considered to be a significant indication for a structure change of a protein (Krueger et al., 1998). This result suggests that galectin-1 has a compressed structure after accommodating the ligand. Further evidence for this conclusion is given by the p(r) function. As shown in Fig. 2 B, the peak of the p(r) function slightly shifted toward a smaller r-value in the presence of the ligand. This impact of the ligand on galectin-1 structure prompted further analysis of a parameter known to affect ligand affinity with respect to galectin structure. In this context, it should be noted that the spectra of scattering at low concentrations (2.1 and 3.0 mg/ml) of the protein were also measured at low angle (0.01–0.1 Å−1). The data (not shown) normalized with concentration (intensities divided by the concentration) were in good agreement with the data at the high concentration (7.6 mg/ml) discussed above. This quality control affirms that the solutions were within the dilute region and the interparticle interactions can reliably be ignored, satisfying the conditions for successful application of the IFT method.
FIGURE 2.

SANS behavior of human galectin-1 in the absence (Curve 1) and presence (Curve 2) of 10 mM N-acetyllactosamine. (A) SANS spectra of galectin-1 in 20 mM phosphate buffer (D2O), pD 7.2, galectin-1 concentration, c = 7.6 mg/ml, and Temperature, T = 298 K; (B) p(r) function of the scattering data. The p(r) function was normalized to set the integrated area value of the p(r) function to “1”. In the absence of ligand (Curve 1), the radius of gyration, Rg, was 19.1 ± 0.1 Å; in the presence of ligand (Curve 2), the Rg was 18.2 ± 0.1 Å.
Temperature effect in aqueous solution
Alteration of the temperature in a series of measurements in isothermal titration calorimetry has revealed the influence of this parameter on the affinity of galectin-1 with its ligands. At 287 K the ΔG-value for N-acetyllactosamine increased to −5.7 kcal/mol (Ahmad et al., 2002). The binding constant of bovine galectin-1 with N-acetyllactosamine also followed a van't Hoff-typical pattern, ranging from 6.5 × 10⁴ M−1 at 281 K to 1.0 × 10⁴ M−1 at 298 K (Schwarz et al., 1998; Ahmad et al., 2002). Further examples for the temperature dependence of binding of a panel of ligands by bovine, hamster, and sheep galectin-1 have also been reported (Ramkumar et al., 1995; Gupta et al., 1996; Schwarz et al., 1998). To study any temperature effect on lectin conformation, especially its quaternary structure, the SANS spectra of galectin-1 in phosphate buffer at a concentration of 7.6 mg/ml in the presence of 10 mM N-acetyllactosamine were measured at 288 K and 298 K, respectively. As shown in Fig. 3 A, the scattering spectra at the two temperatures are nearly identical. Also, their pair distance functions disclosed no evidence for a notable difference (Fig. 3 B). These data indicate that no significant change of the ligand-induced effect occurred within the tested temperature range (288 K–298 K). Explicitly, no oligomerization or dimer dissociation appears to be likely, attributing changes in the binding constant to the immediate microenvironment of the binding sites. Having thus characterized the aggregation status of galectin-1 in solution, we proceeded toward our further aim to analyze its shape in the aprotic solvent.
FIGURE 3.

Comparison of SANS behavior of galectin-1 at 288 K and at 298 K. Experimental condition was 20 mM phosphate buffer (D2O), pD 7.2, and galectin-1, c = 7.6 mg/ml, in the presence of 10 mM N-acetyllactosamine.
Monitoring the scattering profile in DMSO
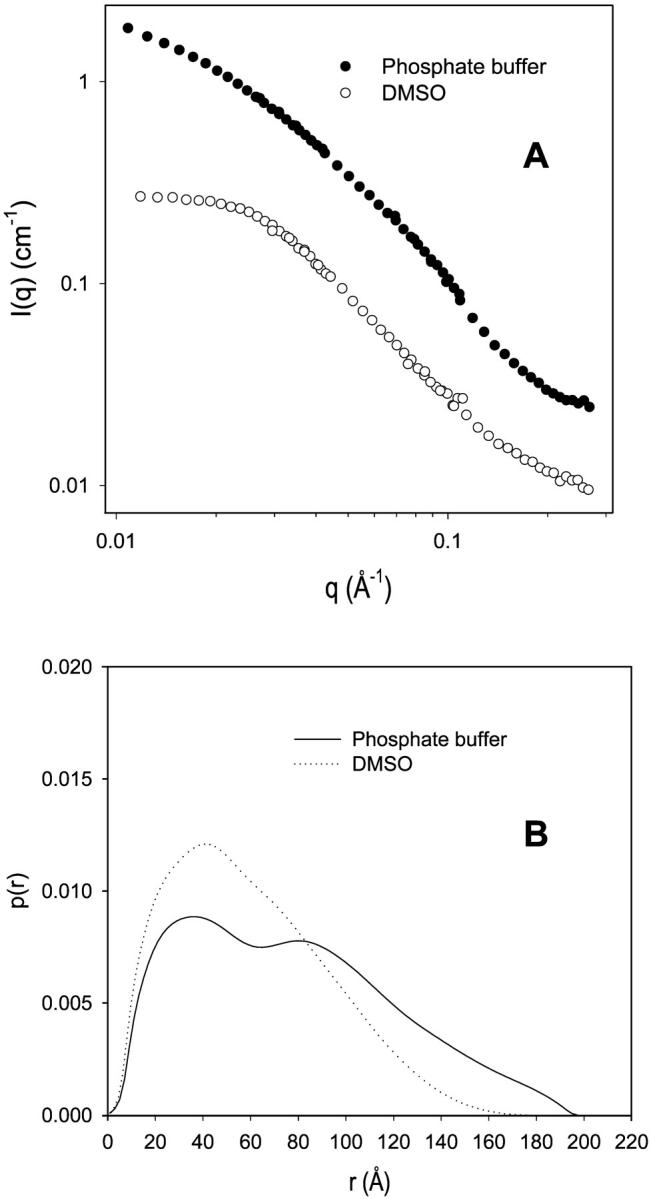
As given in detail in the Methods section, lyophilized galectin-1 was dissolved in pure DMSO at a concentration of 8.1 mg/ml for routine measurements. The scattering behavior of galectin-1 in phosphate buffer and DMSO is compared in Fig. 4. Using the IFT method, the radii of gyration of galectin-1 in phosphate buffer and DMSO were calculated to be 19.1 and 32.6 Å, respectively. Obviously, oligomerization of human galectin-1 occurred in DMSO. But its extent was limited and defined, not leading to large and heterogeneous aggregate complexes. This event was also reflected by the fair degree of signal resolution in one-dimensional 1H-NMR spectra of the lectin in [D6]DMSO relative to that in D2O (data not shown).
FIGURE 4.

Comparison of SANS behavior of human galectin-1 in phosphate buffer and in pure DMSO. (A) SANS spectra of galectin-1 in the two solvents; (B) p(r) function of the scattering data. Curve 1, 7.6 mg/ml galectin-1 in 20 mM phosphate buffer, pD 7.2; T = 298 K. Curve 2, 8.1 mg/ml galectin-1 in pure DMSO; T = 298 K. The Rg in phosphate buffer and DMSO were 19.1 and 32.6 Å, respectively.
The comparison of the p(r) function for this protein in the two solvents disclosed a further structural alteration. Notably, the shape of galectin-1 in DMSO became obviously elongated. As shown in Fig. 4 B, the two p(r) functions for galectin-1 in phosphate-buffered aqueous solution and in DMSO have their maximum value around the r-value of 20 Å. However, the maximum dimension Dmax in DMSO (115 Å) is considerably larger than that in phosphate buffer (65 Å). Because galectin-1 forms a dimer in phosphate buffer, the p(r) function is in line with establishment of a dimer of dimers (i.e., tetramer of monomers) for galectin-1 in solution of DMSO. To obtain a more detailed insight into the shape of galectin-1 in DMSO, further data analysis was performed by model fitting.
Shape of galectin-1 in DMSO
The IFT method gains access to certain parameters of the structure of proteins such as their radius of gyration and p(r) function. As discussed in the preceding paragraphs, the p(r) function of galectin-1 in DMSO satisfied characteristics of an elongated particle. This result provided the starting point for extending the modeling of structural aspects. To get these calculations started, we chose a simple geometry, i.e., cylinder, to fit the experimental scattering data. Fitting the experimental curve with the cylindrical model resulted in a cylinder with a radius of 18.4 Å and a length of 115 Å. As illustrated by Curve 4 in Fig. 5, the cylindrical model can approximately describe the scattering data at low angle values. When moving to larger angles, deviations became apparent. To check whether this emerging discrepancy is due to coexistence of monomers and oligomers, the program MIXTURE was employed. As the exclusive calculation showed, there was little improvement of the fitting by assuming that there were mixtures of polydisperse components (data not shown). Also, fitting the data by the program OLIGOMER provided evidence that the solution apparently contained no significant amount of monomers, dimers, or other oligomers (for instance, octamers) besides tetramers.
FIGURE 5.

Theoretical fitting of the experimental spectra of human galectin-1 in DMSO. Experimental conditions: 8.1 mg/ml galectin-1 in pure DMSO; T = 298 K. Curve 1, original scattering data affording information on shape and internal structure; Curve 2, shape-scattering data (original data after subtraction of a constant of 0.0066; see Material and Methods for details); Curve 3, a simple tetramer model by association of two dimers using dimer atomic coordinates from the crystal structure (PDB entry 1SLT); Curve 4, a cylinder model with a radius of 18.4 Å and a length of 115 Å; and Curve 5, calculated by ab initio-method, using the program DAMIN.
The low-resolution shape of galectin-1 in DMSO was determined by the ab initio program DAMIN. As expected, the scattering curve computed by DAMIN program gave best fitting (Curve 5 in Fig. 5, with χ = 1.069) for the shape-scattering data. Starting from different random approximations, several independent calculation procedures were performed which arrived at similar protein shapes. In Fig. 6 A, a typical representation of the calculated shape of galectin-1 in DMSO is presented. It clearly shows that human galectin-1 exists as a tetramer in DMSO. Calculation with the DAMIN program gave a total excluded DAM volume of 66.7 nm3. Note in this context that the volume of the dimer in D2O is 35.7 nm3, estimated from the crystal structure (PDB entry 1SLT) by the program CRYSON. This difference suggests that association of two dimers appears to be a plausible approximation for the protein shape in DMSO, actual definition of the interface contacts in DMSO remaining to be elucidated by crystallography.
FIGURE 6.

Visualization of the shape of human galectin-1 in DMSO. (A) The low-resolution structure in DMSO was obtained from shape-scattering data by the ab initio-method using the program DAMIN (curve 5 in Fig. 5). The model bead (illustrated by a unit sphere) has a radius of r0 = 3.5 Å, and this arrangement was visualized using the program RASMOL. The structure on the right was rotated counterclockwise by 90° around the y-axis. (B) Shape of the simply constructed tetramer by connecting two dimers to form a cylindrical shape using the crystal structure of bovine galectin-1 (PDB entry 1SLT). The x- and y-axes are drawn in the scale rod of 1 nm.
To test our deduction computationally, a simple tetramer (Fig. 6 B) was constructed by connecting two dimers to form a cylindrical shape using the crystal structure of bovine galectin-1 (PDB entry 1SLT) as information on basic aspects of conformation in aqueous solution. The constructed simple tetramer was used by the program CRYSON to predict a corresponding scattering curve theoretically. As shown in Fig. 5, the scattering curve predicted by this simple tetrameter (Curve 3 in Fig. 5, with χ = 3.268) is similar to the theoretical curve calculated by DAMIN program (curve 5 in Fig. 5). However, in the range of high-angle values, DAM gave an improved extent of fitting of the shape-scattering data. As expected, the protein shape (Fig. 6 A) resulting from the application of the DAMIN program is apparently the best model for the shape of human galectin-1 in DMSO under the tested experimental conditions. To delineate whether the described behavior will also emerge at a concentration different from the routinely used one, we accordingly extended the analysis of human galectin-1 structure in DMSO.
Effect of galectin-1 concentration on its aggregation in DMSO
To obtain scattering data with sufficient statistical validity for calculating the shape of galectin-1 in DMSO, a protein concentration of 8.1 mg/ml was routinely employed in scattering experiments. It is known that oligomer formation of proteins in aqueous solution can depend on the protein concentration, rendering it reasonable to assume an effect of this parameter on oligomerization of galectin-1 in DMSO. Hence, we also measured SANS spectra of galectin-1 at concentrations lower than 8.1 mg/ml in DMSO. In Table 2, the radii of gyration at three different galectin-1 concentrations are comparatively listed. Despite the conspicuous experimental error at the concentration of 1.8 mg/ml, the respective value at this experimental condition is close to that at 8.1 mg/ml. Considering that the statistical error increases when lowering the protein concentration, we did not perform further measurements at even lower concentrations. Regarding the issue of quaternary structure, the presented results revealed that the tetramer is the preferred quaternary structure of galectin-1 in DMSO in the tested concentration range. To examine whether this property will also arise for another galactoside-binding lectin, thereby defining a common feature for lectins with this specificity, we measured the respective properties of the mistletoe lectin that, similar to galectin-1, maintains ligand binding in DMSO (Siebert et al., 2000).
TABLE 2.
Radius of gyration of galectin-1 in DMSO at different protein concentrations
| Concentration (mg/ml) | Radius of gyration Rg (Å) | Maximum particle dimension Dmax (Å) |
|---|---|---|
| 1.8 | 34.8 ± 1.5 | 110 |
| 5.4 | 33.5 ± 0.7 | 110 |
| 8.1 | 32.6 ± 0.4 | 115 |
Scattering data of VAA in water and DMSO
In detail, we carried a comparative analysis of VAA in the two solvents under the same experimental conditions as used for galectin-1. The resulting scattering spectra of VAA in phosphate-buffered water and DMSO are illustrated in Fig. 7. At the small angle range, the scattering density in water increased quickly as the scattering vector q decreased (Fig. 7 A). This behavior indicates that there were indeed large protein aggregates in water. In contrast, the scattering curve in DMSO did not show this type of trend, and the scattering density reached a plateau at small angles. The given data were further analyzed by the IFT method yielding the plots presented in Fig. 7 B. The scattering data in water resulted in a poor p(r) function, whereas a smooth p(r) function was obtained from the scattering data in DMSO. By using Dmax = 180 Å, the radius of gyration in DMSO was calculated to be 48.7 Å. In water, the radius of gyration was calculated to be 62 Å by using Dmax = 200 Å. It should be noted that the radius of gyration in water was not a precise value because of the poor fitting of the data. At any rate, the data intimate that a substantial extent of aggregation of VAA occurred in water. This result can readily be reconciled with the solubility properties and the improved level of signal resolution in NMR spectra for VAA in the aprotic solvent relative to that using D2O as solvent (data not shown). Moreover, gel filtration of the lectin and its carbohydrate-binding B subunit in phosphate buffer indicated tetramer formation for the hololectin at 50 μg/ml and interactions between the lectin subunits leading to dimerization (Sweeney et al., 1998). Compared to ricin, these authors noted an enhanced tendency of the mistletoe's AB-toxin for aggregation. Compared to galectin-1, the differences in the response to solvent exchange are obvious. They preclude general predictions for the quaternary structure of a lectin in the aprotic solvent, when classifying lectins solely based on their carbohydrate specificity, a common classification scheme (Wu et al., 2001).
FIGURE 7.
Comparison of SANS behavior of VAA in 20 mM phosphate buffer, pD 7.2, and in neat DMSO. Both spectra were recorded at 298 K. (A) SANS spectra of VAA in the two solvents; (B) p(r) function of the scattering data.
Correlation of scattering data for galectin-1 with its behavior during thermal denaturation and biological implications
Physicochemical stress can be imposed on a protein by various factors, in our case by the solvent exchange. Differential scanning calorimetry is another means to study respective responses of the protein structure, in that case to a temperature increase. In this context, it is interesting to note that sheep and bovine galectin-1 had shown a distinct behavior upon further temperature increases reaching the threshold to denature the protein. Determined by differential scanning calorimetry, sheep galectin-1 yielded transition peaks at Tm values of 333.8 K and 340.0 K, respectively, pointing to presence of tetramers (dimer of dimers) and octamers (tetramer of dimers) (Surolia et al., 1997), whereas data for bovine galectin-1 are indicative of formation of a tetramer at the denaturation temperature (Schwarz et al., 1998). Notably, galectin-1 maintained the association even in the thermally unfolded state, a behavior setting it apart from leguminous lectins which share the global jellyroll-like folding pattern (Loris, 2002). Thus, the two physicochemical stress factors, i.e., solvent exchange and thermal denaturation, appeared to elicit identical responses, warranting further comparison of the influence of the ligand at physiological and increased temperatures on lectin structure. Because the ligand accommodation brought about a significant change in the radius of gyration, which we reported above (Fig. 2), it is reasonable to assume that oligomer formation could be different in the presence of ligand if one raises the temperature to values denaturing the protein. Indeed, the presence of ligand led to dissociation of octamers of sheep galectin-1 to tetramers at 350 K and of tetramers of bovine galectin-1 to dimers at a temperature slightly above 350 K (Surolia et al., 1997; Schwarz et al., 1998). Although the oligomer status was reduced by ligand binding, the dimer did not dissociate in both cases. Equally important, these results illustrate that ligand binding significantly affects the properties of portions of galectin-1 involved in oligomer formation which are not in the immediate vicinity of the carbohydrate-binding site.
Taking our data and these results together, the ligand-induced changes in solution could harbor biological relevance. Because mammalian galectin-1 is known to be engaged in protein-protein interactions besides carbohydrate binding, e.g., targeting the oncogenic H-Ras (12 V) and the pre-B cell receptor (Paz et al., 2001; Brewer, 2002; Elad-Sfadia et al., 2002; Gauthier et al., 2002; Liu et al., 2002), this potential for an intramolecular cross-talk with implication for cross-linking properties and signal triggering (Brewer, 2002; Elad-Sfadia et al., 2002) deserves to be tested. Literally, Gauthier et al. (2002) devised a model in which galectin-1 can simultaneously contact protein and carbohydrate ligands in the pre-B/stromal cell synapse. Precedents for an intramolecular cross-talk between such sites, i.e., the influence of lactose binding on protein-protein interaction, have been presented for the chimera-type galectin-3 (bcl-2 and CBP70 as protein targets) and the elastin/laminin receptor (Mecham et al., 1991; Sève et al., 1994; Yang et al., 1996). Noting a conformational change in the C-type lectin from Sarcophaga peregrina after binding of galactose and the lactose-induced oligomer formation of the Ca2+-dependent sea cucumber lectin (Komano et al., 1992; Fujisawa et al., 1997; Kuwahara et al., 2002), this aspect and its functional implications on protein-protein interactions deserve further interest. It is an open question whether crystal packing of a protein will hinder this reactivity toward ligand binding by diffusion into the crystal, establishing this biophysical method as a main source of information in solution.
CONCLUSIONS
The quaternary structure of lectins has been recognized as an essential factor in signal triggering, e.g., by virtue of cross-linking of membrane ligands by prototype galectins (Villalobo and Gabius, 1998; Brewer, 2002). For our pilot study on lectins after a solvent exchange, we selected a representative of this subgroup of a large family of endogenous lectins, i.e., galectin-1, as a role model. It folds into the general jellyroll-like pattern, a versatile motif for generating different types of oligomers (Rüdiger and Gabius, 2001; Loris, 2002). When working in water, we confirmed the dimeric nature of human galectin-1 as seen in the crystal. Differences of shape properties were within the limits of inherent error when comparing crystal and solution structures. A notable result is the impact of ligand binding on this lectin's structure as determined by our solution-scattering experiments. The compact structure attained in the presence of the ligand together with the peculiar behavior of galectin-1 in the cited studies using differential scanning calorimetry revealed a remarkable importance of binding-site occupation for the shape of the lectin. Corroborating our data, an indication for this ligand-dependent conformational change had been inferred by monitoring tyrosine signals in the laser photo CIDNP technique, and molecular modeling also pointed to occurrence of long-range conformational effects on structure by site-specific mutations (Siebert et al., 1997).
The second aspect of this report concerns the behavior of galectin-1 in an aprotic solvent. Similar to the current development using enzymes in organic solvents for technological purposes, lectins retaining target specificities in an organic medium also offer a variety of potential biotechnological applications. Unlike small lectins such as hevein or carbohydrate-binding peptides with their inherently high degree of flexibility (Siebert et al., 2000, 2002), galectin-1's activity was not harmed when exposed to pure DMSO, opening the route also to technological applications. Instead of dissociation into subunits, galectin-1 dimers were quantitatively converted to tetramers. Importantly, ab initio-derived shape characteristics of galectin-1 in DMSO from the scattering data confirmed a cylindrical topology of human galectin-1 in the aprotic solvent. Because the scattering technique can be readily applied to other proteins in organic solvent, as herein demonstrated for the mistletoe lectin, if a concentration of several mgs/ml can be reached, this type of characterization of conformational responses of lectins to ligand presence and solvent change promises to provide further insights on intra- and intermolecular interactions.
Acknowledgments
We thank Dr. D. I. Svergun at the European Molecular Biology Laboratory outstation Hamburg for providing the most recent programs used in scattering data analysis and for the access to the SAXS beam line. The authors are grateful to Dr. V. Garamus and Dr. R. Willumeit at the GKSS Research Center, Geesthacht for helpful discussion and kind support on SANS measurements.
The 500 MHz 1H-NMR spectra were recorded at the Stichting Scheikundig Onderzoek in Nederland (SON) Nuclear Magnetic Resonance (NMR) Large Scale Facility in Utrecht, Netherlands, funded by the Access to Research Infrastructures program of the European Community (EC). The generous financial support of Wilhelm Sander-Stiftung, Munich, Germany, is gratefully acknowledged.
Dedicated to Prof. Dr. F. Cramer on the occasion of his 80th birthday.
Lizhong He's present address is Max-Planck-Institut für Polymerforschung, Ackermannweg 10, D-55021 Mainz, Germany.
References
- Abbott, W. M., and T. Feizi. 1989. Evidence that the 14 kDa soluble β-galactoside-binding lectin in man is encoded by a single gene. Biochem. J. 259:291–294. [DOI] [PMC free article] [PubMed] [Google Scholar]
- Abbott, W. M., A. Mellor, Y. Edwards, and T. Feizi. 1989. Soluble bovine galactose-binding lectin—cDNA cloning reveals the complete amino-acid sequence and an antigenic relationship with the major encephalitogenic domain of myelin basic-protein. Biochem. J. 259:283–290. [DOI] [PMC free article] [PubMed] [Google Scholar]
- Ahmad, N., H.-J. Gabius, H. Kaltner, S. André, I. Kuwabara, F.-T. Liu, S. Oscarson, T. Norberg, and C. F. Brewer. 2002. Thermodynamic binding studies of cell surface carbohydrate epitopes to galectins-1, -3, and -7. Evidence for differential binding specificities. Can. J. Chem. 80:1096–1104. [Google Scholar]
- Allen, H. J., C. Karakousis, M. S. Piver, M. Gamarra, H. Nava, B. Forsyth, B. Matecki, A. Jazayeri, D. Sucato, E. Kisailus, and R. DiCioccio. 1987. Galactoside-binding lectin in human tissues. Tumour Biol. 8:218–229. [DOI] [PubMed] [Google Scholar]
- Alonso-Plaza, J. M., M. A. Canales, M. Jiménez, J. L. Roldán, A. García-Herrero, L. Iturrino, J. L. Asensio, F. J. Cañada, A. Romero, H.-C. Siebert, S. André, D. Solís, H.-J. Gabius, and J. Jiménez-Barbero. 2001. NMR investigations of protein-carbohydrate interactions: insights into the topology of the bound conformation of a lactose isomer and β-galactosyl xyloses to mistletoe lectin and galectin-1. Biochim. Biophys. Acta. 1568:225–236. [DOI] [PubMed] [Google Scholar]
- André, S., S. Kojima, N. Yamazaki, C. Fink, H. Kaltner, K. Kayser, and H.-J. Gabius. 1999. Galectins-1 and -3 and their ligands in tumor biology. J. Cancer Res. Clin. Oncol. 125:461–474. [DOI] [PubMed] [Google Scholar]
- André, S., R. J. Pieters, I. Vrasidas, H. Kaltner, I. Kuwabara, F.-T. Liu, R. M. J. Liskamp, and H.-J. Gabius. 2001. Wedgelike glycodendrimers as inhibitors of binding of mammalian galectins to glycoproteins, lactose maxiclusters and cell surface glycoconjugates. Chem Bio Chem. 2:822–830. [DOI] [PubMed] [Google Scholar]
- Angata, T., and E. C. M. Brinkman-van der Linden. 2002. I-type lectins. Biochim. Biophys. Acta. 1572:294–316. [DOI] [PubMed] [Google Scholar]
- Asensio, J. L., J. F. Espinosa, H. Dietrich, F. J. Cañada, R. R. Schmidt, M. Martín-Lomas, S. André, H.-J. Gabius, and J. Jiménez-Barbero. 1999. Bovine heart galectin-1 selects a distinct (syn) conformation of C-lactose, a flexible lactose analogue. J. Am. Chem. Soc. 121:8995–9000. [Google Scholar]
- Bianchet, M. A., H. Ahmed, G. R. Vasta, and L. M. Amzel. 2000. Soluble β-galactosyl-binding lectin (galectin) from toad ovary: crystallographic studies of two protein-sugar complexes. Proteins. 40:378–388. [DOI] [PubMed] [Google Scholar]
- Bladier, D., J.-P. Le Caër, R. Joubert, M. Caron, and J. Rossier. 1991. β-Galactoside soluble lectin from human brain: complete amino acid sequence. Neurochem. Int. 18:275–281. [DOI] [PubMed] [Google Scholar]
- Bradford, M. M. 1976. A rapid and sensitive method for the quantitation of microgram quantities of protein utilizing the protein-dye binding. Anal. Biochem. 72:248–254. [DOI] [PubMed] [Google Scholar]
- Brewer, C. F. 2002. Binding and cross-linking properties of galectins. Biochim. Biophys. Acta. 1572:255–262. [DOI] [PubMed] [Google Scholar]
- Boulin, C. J., R. Kempf, A. Gabriel, and M. H. J. Koch. 1988. Data acquisition systems for linear and area x-ray detectors using delay-line readout. Nucl. Instr. Method. 269:312–320. [Google Scholar]
- Bourne, Y., B. Bolgiano, D.-I. Liao, G. Strecker, P. Cantau, O. Herzberg, T. Feizi, and C. Cambillau. 1994. Cross-linking of mammalian lectin (galectin-1) by complex biantennary saccharides. Nat. Struct. Biol. 1:863–870. [DOI] [PubMed] [Google Scholar]
- Byron, O., and R. J. C. Gilbert. 2000. Neutron scattering: good news for biotechnology. Curr. Opin. Biotechnol. 11:72–80. [DOI] [PubMed] [Google Scholar]
- Camby, I., N. Belot, F. Lefranc, N. Sadeghi, Y. de Launoit, H. Kaltner, S. Musette, F. Darro, A. Danguy, I. Salmon, H.-J. Gabius, and R. Kiss. 2002. Galectin-1 modulates human glioblastoma cell migration into the brain through modifications to the actin cytoskeleton and levels of expression of small GTPases. J. Neuropathol. Exp. Neurol. 61:585–596. [DOI] [PubMed] [Google Scholar]
- Cartellieri, S., O. Hamer, H. Helmholz, and B. Niemeyer. 2002. One-step affinity purification of fetuin from fetal bovine serum. Biotechnol. Appl. Biochem. 35:83–89. [DOI] [PubMed] [Google Scholar]
- Chacón, P., F. Morán, J. F. Díaz, E. Pantos, and J. M. Andreu. 1998. Low-resolution structures of proteins in solution retrieved from x-ray scattering with a genetic algorithm. Biophys. J. 74:2760–2775. [DOI] [PMC free article] [PubMed] [Google Scholar]
- Cooper, D. N. W. 2002. Galectinomics: finding themes in complexity. Biochim. Biophys. Acta. 1572:209–231. [DOI] [PubMed] [Google Scholar]
- Cotton, J. P. 1991. Introduction to scattering experiments. In Neutron, X-Ray and Light Scattering: Introduction to an Investigative Tool for Colloidal and Polymeric Systems. P. Lindner, and T. Zemb, editors. North-Holland, Amsterdam. pp.19–33.
- Couraud, P.-O., D. Casentini-Borocz, T. S. Bringman, J. Griffith, M. McGrogan, and G. E. Nedwin. 1989. Molecular cloning, characterization, and expression of a human 14-kDa lectin. J. Biol. Chem. 264:1310–1316. [PubMed] [Google Scholar]
- Cummings, R. D. 1997. Lectins as tools for glycoconjugate purification and characterization. In Glycosciences: Status and Perspectives. H.-J. Gabius, and S. Gabius, editors. Chapman and Hall, London-Weinheim. 191–199.
- Dai, L.-Z., and A. M. Klibanov. 1999. Striking activation of oxidative enzymes suspended in nonaqueous media. Proc. Natl. Acad. Sci. USA. 96:9475–9478. [DOI] [PMC free article] [PubMed] [Google Scholar]
- Dahms, N. M., and M. K. Hancock. 2002. P-type lectins. Biochim. Biophys. Acta. 1572:317–340. [DOI] [PubMed] [Google Scholar]
- Danguy, A., I. Camby, and R. Kiss. 2002. Galectins and cancer. Biochim. Biophys. Acta. 1572:285–293. [DOI] [PubMed] [Google Scholar]
- Elad-Sfadia, G., R. Haklai, E. Ballan, H.-J. Gabius, and Y. Kloog. 2002. Galectin-1 augments Ras activation and diverts Ras signals to Raf-1 at the expense of phosphoinositide 3-kinase. J. Biol. Chem. 277:37169–37175. [DOI] [PubMed] [Google Scholar]
- Feigin, L. A., and D. I. Svergun. 1987. Structural Analysis by Small Angle X-Ray and Neutron Scattering. Plenum Press, New York.
- Fitzpatrick, P. A., A. C. U. Steinmetz, D. Ringe, and A. M. Klibanov. 1993. Enzyme crystal structure in a neat organic solvent. Proc. Natl. Acad. Sci. USA. 90:8653–8657. [DOI] [PMC free article] [PubMed] [Google Scholar]
- Fitzpatrick, P. A., D. Ringe, and A. M. Klibanov. 1994. X-ray crystal structure of cross-linked subtilisin Carlsberg in water vs. acetonitrile. Biochem. Biophys. Res. Commun. 198:675–681. [DOI] [PubMed] [Google Scholar]
- Fujisawa, T., H. Kuwahara, Y. Hiromasa, T. Niidome, H. Aoyagi, and T. Hatakeyama. 1997. Small-angle x-ray scattering study on CEL-III, a hemolytic lectin from Holothuroidea Cucumaria echinata, and its oligomer induced by the binding of specific carbohydrate. FEBS Lett. 414:79–83. [DOI] [PubMed] [Google Scholar]
- Gabius, H.-J. 1987. Endogenous lectins in tumors and the immune system. Cancer Invest. 5:39–46. [DOI] [PubMed] [Google Scholar]
- Gabius, H.-J. 1990. Influence of type of linkage and spacers on the interaction of β-galactoside-binding proteins with immobilized affinity ligands. Anal. Biochem. 189:91–94. [DOI] [PubMed] [Google Scholar]
- Gabius, H.-J. 1997. Animal lectins. Eur. J. Biochem. 243:543–576. [DOI] [PubMed] [Google Scholar]
- Gabius, H.-J. 1998. The how and why of protein-carbohydrate interaction: a primer to the theoretical concept and a guide to application in drug design. Pharmaceut. Res. 15:23–30. [DOI] [PubMed] [Google Scholar]
- Gabius, H.-J. 2000. Biological information transfer beyond the genetic code: the sugar code. Naturwissenschaften. 87:108–121. [DOI] [PubMed] [Google Scholar]
- Gabius, H.-J. 2001a. Glycohistochemistry: the why and how of detection and localization of endogenous lectins. Anat. Histol. Embryol. 30:3–31. [DOI] [PubMed] [Google Scholar]
- Gabius, H.-J. 2001b. Probing the cons and pros of lectin-induced immunomodulation: case studies for the mistletoe lectin and galectin-1. Biochimie. 83:659–666. [DOI] [PubMed] [Google Scholar]
- Gabius, H.-J., R. Engelhardt, F. Cramer, R. Bätge, and G. A. Nagel. 1985. Pattern of endogenous lectins in a human epithelial tumor. Cancer Res. 45:253–257. [PubMed] [Google Scholar]
- Gabius, H.-J., P. L. Debbage, R. Engelhardt, R. Osmers, and W. Lange. 1987. Identification of endogenous sugar-binding proteins (lectins) in human placenta by histochemical localization and biochemical characterization. Eur. J. Cell Biol. 44:265–272. [PubMed] [Google Scholar]
- Gabius, H.-J., B. Wosgien, M. Hendrys, and A. Bardosi. 1991. Lectin localization in human nerve by biochemically defined lectin-binding glycoproteins, neoglycoprotein and lectin-specific antibody. Histochemistry. 95:269–277. [DOI] [PubMed] [Google Scholar]
- Gabius, H.-J., F. Darro, M. Remmelink, S. André, J. Kopitz, A. Danguy, S. Gabius, I. Salmon, and R. Kiss. 2001. Evidence for stimulation of tumor proliferation in cell lines and histotypic cultures by clinically relevant low doses of the galactoside-binding mistletoe lectin, a component of proprietary extracts. Cancer Invest. 19:114–126. [DOI] [PubMed] [Google Scholar]
- Gabius, H.-J., S. André, H. Kaltner, and H.-C. Siebert. 2002. The sugar code: functional lectinomics. Biochim. Biophys. Acta. 1572:165–177. [DOI] [PubMed] [Google Scholar]
- Garcia de la Torre, J., M. L. Huertas, and B. Carrasco. 2000. Calculation of hydrodynamic properties of globular proteins from their atomic-level structure. Biophys. J. 78:719–730. [DOI] [PMC free article] [PubMed] [Google Scholar]
- Gauthier, L., B. Rossi, F. Roux, E. Termine, and C. Schiff. 2002. Galectin-1 is a stromal cell ligand of the pre-B cell receptor (BCR) implicated in synapse formation between pre-B and stromal cells and in pre-BCR triggering. Proc. Natl. Acad. Sci. USA. 99:13014–13019. [DOI] [PMC free article] [PubMed] [Google Scholar]
- Giudicelli, V., D. Lutomski, M. Levi-Strauss, D. Bladier, R. Joubert-Caron, and M. Caron. 1997. Is human galectin-1 activity modulated by monomer/dimer equilibrium? Glycobiology. 7:viii–x. [DOI] [PubMed] [Google Scholar]
- Glatter, O. 1977. A new method for the evaluation of small angle scattering data. J. Appl. Crystallogr. 10:415–421. [Google Scholar]
- Griebenow, K., and A. M. Klibanov. 1995. Lyophilization-induced reversible changes in the secondary structure of proteins. Proc. Natl. Acad. Sci. USA. 92:10969–10976. [DOI] [PMC free article] [PubMed] [Google Scholar]
- Griebenow, K., and A. M. Klibanov. 1997. Can conformational changes be responsible for solvent and excipient effects on the catalytic behavior of subtilisin Carlsberg in organic solvents? Biotechnol. Bioeng. 53:351–362. [DOI] [PubMed] [Google Scholar]
- Gupta, D., M. Cho, R. D. Cummings, and C. F. Brewer. 1996. Thermodynamics of carbohydrate binding to galectin-1 from Chinese hamster ovary cells and two mutants. Biochemistry. 35:15236–15243. [DOI] [PubMed] [Google Scholar]
- He, L.-Z., V. Garamus, B. Niemeyer, H. Helmholz, and R. Willumeit. 2000. Determination of micelle structure of octyl-β-glucoside in aqueous solution by small angle neutron scattering and geometric analysis. J. Mol. Liq. 89:239–249. [Google Scholar]
- He, L.-Z., V. Garamus, S. S. Funari, M. Malfois, R. Willumeit, and B. Niemeyer. 2002. Comparison of small-angle scattering methods for the structural analysis of octyl-β-maltopyranoside micelles. J. Phys. Chem. B. 106:7596–7604. [Google Scholar]
- Hirabayashi, J., and K.-I. Kasai. 1988. Complete amino-acid sequence of a β-galactoside-binding lectin from human placenta. J. Biochem. 104:1–4. [DOI] [PubMed] [Google Scholar]
- Hirabayashi, J., H. Kawasaki, K. Suzuki, and K.-I. Kasai. 1987. Further characterization and structural studies on human placenta lectin. J. Biochem. 101:987–995. [DOI] [PubMed] [Google Scholar]
- Hirabayashi, J., H. Ayaki, G.-I. Soma, and K.-I. Kasai. 1989. Cloning and nucleotide sequence of a full-length cDNA for human 14 kDa β-galactoside-binding lectin. Biochim. Biophys. Acta. 1008:85–91. [DOI] [PubMed] [Google Scholar]
- Israelachvili, J., and H. Wennerström. 1996. Role of hydration and water structure in biological and colloid interaction. Nature. 379:219–224. [DOI] [PubMed] [Google Scholar]
- Kaltner, H., and B. Stierstorfer. 1998. Animal lectins as cell adhesion molecules. Acta Anat. 161:162–179. [DOI] [PubMed] [Google Scholar]
- Klibanov, A. M. 2001. Improving enzymes by using them in organic solvents. Nature. 409:241–246. [DOI] [PubMed] [Google Scholar]
- Koch, M. H. J., and J. Bordas. 1983. X-ray diffraction and scattering on disordered-systems using synchrotron radiation. Nucl. Instr. Meth. 208:461–469. [Google Scholar]
- Komano, H., T. Kurama, Y. Nagasawa, and S. Natori. 1992. Evidence for an increase in positive surface charge and an increase in susceptibility to trypsin of Sarcophaga lectin (from the flesh fly, Sarcophaga peregrina) on its interaction with galactose, a hapten sugar of the lectin. Biochem. J. 284:227–230. [DOI] [PMC free article] [PubMed] [Google Scholar]
- Kopitz, J., C. von Reitzenstein, M. Burchert, M. Cantz, and H.-J. Gabius. 1998. Galectin-1 is a major receptor for ganglioside GM1, a product of the growth-controlling activity of a cell surface ganglioside sialidase, on human neuroblastoma cells in culture. J. Biol. Chem. 273:11205–11211. [DOI] [PubMed] [Google Scholar]
- Kopitz, J., C. von Reitzenstein, S. André, H. Kaltner, J. Uhl, V. Ehemann, M. Cantz, and H.-J. Gabius. 2001. Negative regulation of neuroblastoma cell growth by carbohydrate-dependent surface binding of galectin-1 and functional divergence from galectin-3. J. Biol. Chem. 276:35917–35923. [DOI] [PubMed] [Google Scholar]
- Krueger, S., I. Gorshkova, J. Brown, J. Hoskins, K. H. McKenney, and F. P. Schwarz. 1998. Determination of the conformations of cAMP receptor protein and its T127L, S128A mutant with and without cAMP from small angle neutron scattering measurements. J. Biol. Chem. 273:20001–20006. [DOI] [PubMed] [Google Scholar]
- Kuwahara, H., T. Yamasaki, T. Hatakeyama, H. Aoyagi, and T. Fujisawa. 2002. Oligomerization process of the hemolytic lectin CEL-III purified from a sea cucumber, Cucumaria echinata. J. Biochem. 131:751–756. [DOI] [PubMed] [Google Scholar]
- Lahm, H., S. André, A. Höflich, J. R. Fischer, B. Sordat, H. Kaltner, E. Wolf, and H.-J. Gabius. 2001. Comprehensive galectin fingerprinting in a panel of 61 human tumor cell lines by RT-PCR and its implications for diagnostic and therapeutic procedures. J. Cancer Res. Clin. Oncol. 127:375–386. [DOI] [PubMed] [Google Scholar]
- Lee, M.-Y., and J. S. Dordick. 2002. Enzyme activation for nonaqueous media. Curr. Opin. Biotechnol. 13:376–384. [DOI] [PubMed] [Google Scholar]
- Liao, D.-I., G. Kapadia, H. Ahmed, G. R. Vasta, and O. Herzberg. 1994. Structure of S-lectin, a developmentally regulated vertebrate β-galactoside-binding protein. Proc. Natl. Acad. Sci. USA. 91:1428–1432. [DOI] [PMC free article] [PubMed] [Google Scholar]
- Lis, H., and N. Sharon. 1998. Lectins: carbohydrate-specific proteins that mediate cellular recognition. Chem. Rev. 98:637–674. [DOI] [PubMed] [Google Scholar]
- Liu, F.-T., R. J. Patterson, and J. L. Wang. 2002. Intracellular functions of galectins. Biochim. Biophys. Acta. 1572:263–273. [DOI] [PubMed] [Google Scholar]
- Loris, R. 2002. Principles of structures of animal and plant lectins. Biochim. Biophys. Acta. 1572:198–208. [DOI] [PubMed] [Google Scholar]
- Mahanthappa, N. K., D. N. W. Cooper, S. H. Barondes, and G. A. Schwarting. 1994. Rat olfactory neurons can utilize the endogenous lectin, L-14, in a novel adhesion mechanism. Development. 120:1373–1384. [DOI] [PubMed] [Google Scholar]
- Mattos, C., and D. Ringe. 2001. Proteins in organic solvents. Curr. Opin. Struct. Biol. 11:761–764. [DOI] [PubMed] [Google Scholar]
- Mecham, R. P., L. Whitehouse, M. Hay, A. Hinek, and M. P. Sheetz. 1991. Ligand affinity of the 67-kD elastin/laminin binding protein is modulated by the protein's lectin domain: visualization of elastin/laminin-receptor complexes with gold-tagged ligands. J. Cell Biol. 113:187–194. [DOI] [PMC free article] [PubMed] [Google Scholar]
- Nambiar, M. P., D. Basu, and P. S. Appukuttan. 1987. Physicochemical properties and binding-site amino acid residues of galactoside-binding protein of human placenta. J. Biosci. 11:331–338. [Google Scholar]
- Paciaroni, A., S. Cinelli, and G. Onori. 2002. Effect of the environment on the protein dynamical transition: a neutron scattering study. Biophys. J. 83:1157–1164. [DOI] [PMC free article] [PubMed] [Google Scholar]
- Paz, A., R. Haklai, G. Elad-Sfadia, E. Ballan, and Y. Kloog. 2001. Galectin-1 binds oncogenic H-Ras to mediate Ras membrane anchorage and cell transformation. Oncogene. 20:7486–7493. [DOI] [PubMed] [Google Scholar]
- Pedersen, J. S. 1997. Analysis of small angle scattering data from colloids and polymer solution: modeling and least-squares fitting. Adv. Colloid Interface Sci. 70:171–210. [Google Scholar]
- Pedersen, J. S., D. Posselt, and K. Mortensen. 1990. Analytical treatment of the resolution function for small angle scattering. J. Appl. Crystallogr. 23:321–333. [Google Scholar]
- Porod, G. 1982. General theory. In Small Angle X-Ray Scattering. O. Glatter, and O. Kratky, editors. Academic Press, London. 17–51.
- Powell, J. T., and P. L. Whitney. 1984. Endogenous ligands of rat lung β-galactoside-binding protein (galaptin) isolated by affinity chromatography on carboxyamidomethylated-galaptin-sepharose. Biochem. J. 233:769–774. [DOI] [PMC free article] [PubMed] [Google Scholar]
- Rabinovich, G. A., G. Daly, H. Dreja, H. Tailor, C. M. Riera, J. Hirabayashi, and Y. Chernajovsky. 1999. Recombinant galectin-1 and its genetic delivery suppress collagen-induced arthritis via T-cell apoptosis. J. Exp. Med. 190:385–398. [DOI] [PMC free article] [PubMed] [Google Scholar]
- Rabinovich, G. A., N. Rubinstein, and M. A. Toscano. 2002. Role of galectins in inflammatory and immunomodulatory processes. Biochim. Biophys. Acta. 1572:274–284. [DOI] [PubMed] [Google Scholar]
- Ramkumar, R., A. Surolia, and S. K. Podder. 1995. Energetics of carbohydrate binding by a 14 kDa S-type mammalian lectin. Biochem. J. 308:237–241. [DOI] [PMC free article] [PubMed] [Google Scholar]
- Rappl, G., H. Abken, J. M. Muche, W. Sterry, W. Tilgen, S. André, H. Kaltner, S. Ugurel, H.-J. Gabius, and U. Reinhold. 2002. CD4+CD7− leukemic T-cells from patients with Sézary syndrome are protected from galectin-1-triggered T-cell death. Leukemia. 16:840–845. [DOI] [PubMed] [Google Scholar]
- Réat, V., R. Dunn, M. Ferrand, J. L. Finney, R. M. Daniel, and J. C. Smith. 2000. Solvent dependence of dynamic transitions in protein solutions. Proc. Natl. Acad. Sci. USA. 97:9961–9966. [DOI] [PMC free article] [PubMed] [Google Scholar]
- Reuter, G., and H.-J. Gabius. 1999. Eukaryotic glycosylation: whim of nature or multipurpose tool? Cell. Mol. Life Sci. 55:368–422. [DOI] [PMC free article] [PubMed] [Google Scholar]
- Rorive, S., N. Belot, C. Decaestecker, F. Lefranc, L. Gordower, S. Micik, C.-A. Maurage, H. Kaltner, M.-M. Ruchoux, A. Danguy, H.-J. Gabius, I. Salmon, R. Kiss, and I. Camby. 2001. Galectin-1 is highly expressed in human gliomas with relevance for modulation of invasion of tumor astrocytes into the brain parenchyma. Glia. 33:241–255. [DOI] [PubMed] [Google Scholar]
- Rüdiger, H., and H.-J. Gabius. 2001. Plant lectins. Glycoconjug. J. 18:589–613. [DOI] [PubMed] [Google Scholar]
- Rüdiger, H., H.-C. Siebert, D. Solís, J. Jiménez-Barbero, A. Romero, C.-W. von der Lieth, T. Diaz-Mauriño, and H.-J. Gabius. 2000. Medicinal chemistry based on the sugar code: fundamentals of lectinology and experimental strategies with lectins as targets. Curr. Med. Chem. 7:389–416. [DOI] [PubMed] [Google Scholar]
- Sandoval, G. C., A. Marty, and J.-S. Condoret. 2001. Thermodynamic activity-based enzyme kinetics: efficient tool for nonaqueous enzymology. AICHE J. 47:718–726. [Google Scholar]
- Schwarz, F. P., H. Ahmed, M. A. Bianchet, L. M. Amzel, and G. R. Vasta. 1998. Thermodynamics of bovine spleen galectin-1 binding to disaccharides: correlation with structure and its effect on oligomerization at the denaturation temperature. Biochemistry. 37:5867–5877. [DOI] [PubMed] [Google Scholar]
- Sève, A. P., Y. Hadj-Sahraoui, M. Felin, M.-A. Doyennette-Moyne, M. Aubery, and J. Hubert. 1994. Evidence that lactose binding to CBP35 disrupts its interaction with CBP70 in isolated HL60 cell nuclei. Exp. Cell Res. 213:191–197. [DOI] [PubMed] [Google Scholar]
- Sharma, A., R. Chemelli., and H. J. Allen. 1990. Human splenic galaptin—physicochemical characterization. Biochemistry. 29:5309–5314. [DOI] [PubMed] [Google Scholar]
- Shirai, T., C. Mitsuyama, Y. Niwa, Y. Matsui, H. Hotta, T. Yamane, H. Kamiya, C. Ishii, T. Ogawa, and K. Muramoto. 1999. High-resolution structure of the conger eel galectin, congerin I, in lactose-liganded and ligand-free forms: emergence of a new structure class by accelerated evolution. Structure. 7:1223–1233. [DOI] [PubMed] [Google Scholar]
- Siebert, H.-C., M. Gilleron, H. Kaltner, C.-W. von der Lieth, T. Kožár, N. V. Bovin, E. Y. Korchagina, J. F. G. Vliegenthart, and H.-J. Gabius. 1996. NMR-based, molecular dynamics- and random walk molecular mechanics-supported study of conformational aspects of a carbohydrate ligand (Galβ1–2Galβ1R) for an animal galectin in the free and in the bound state. Biochem. Biophys. Res. Commun. 219:205–212. [DOI] [PubMed] [Google Scholar]
- Siebert, H.-C., R. Adar, R. Arango, M. Burchert, H. Kaltner, G. Kayser, E. Tajkhorshid, C.-W. von der Lieth, R. Kaptein, N. Sharon, J. F. G. Vliegenthart, and H.-J. Gabius. 1997. Involvement of laser photo-CIDNP (chemically induced dynamic nuclear polarization)-reactive amino acid side chains in ligand binding by galactoside-specific lectins in solution. Eur. J. Biochem. 249:27–38. [DOI] [PubMed] [Google Scholar]
- Siebert, H.-C., S. André, J. L. Asensio, F. J. Cañada, X. Dong, J. F. Espinosa, M. Frank, M. Gilleron, H. Kaltner, T. Kožár, N. V. Bovin, C.-W. von der Lieth, J. F. G. Vliegenthart, J. Jiménez-Barbero, and H.-J. Gabius. 2000. A new combined computational and NMR-spectroscopical strategy for the identification of additional conformational constraints of the bound ligand in an aprotic solvent. Chem Bio Chem. 1:181–195. [DOI] [PubMed] [Google Scholar]
- Siebert, H.-C., S.-Y. Lü, M. Frank, J. Kramer, R. Wechselberger, J. Joosten, S. André, K. Rittenhouse-Olson, R. Roy, C.-W. von der Lieth, R. Kaptein, J. F. G. Vliegenthart, A. J. R. Heck, and H.-J. Gabius. 2002. Analysis of protein-carbohydrate interaction at the lower size limit of the protein part (15-mer peptide) by NMR spectroscopy, electrospray ionization mass spectrometry, and molecular modeling. Biochemistry. 41:9707–9717. [DOI] [PubMed] [Google Scholar]
- Singer, S. J. 1962. The properties of proteins in nonaqueous solvents. Adv. Protein Chem. 17:1–68. [Google Scholar]
- Sinowatz, F., J. Plendl, and S. Kölle. 1998. Protein-carbohydrate interactions during fertilization. Acta Anat. 161:196–205. [DOI] [PubMed] [Google Scholar]
- Smith, D. F., and V. Torres. 1989. Lectin affinity chromatography of glycolipids and glycolipid-derived oligosaccharides. Methods Enzymol. 179:30–45. [DOI] [PubMed] [Google Scholar]
- Solís, D., J. Jiménez-Barbero, H. Kaltner, A. Romero, H.-C. Siebert, C.-W. von der Lieth, and H.-J. Gabius. 2001. Towards defining the role of glycans as hardware in information storage and transfer: basic principles, experimental approaches and recent progress. Cells Tissues Organs. 168:5–23. [DOI] [PubMed] [Google Scholar]
- Stuhrmann, H. B., N. Burkhard, G. Dietrich, R. Junemann, W. Meerwin, M. Shmitt, J. Wadzack, R. Willumeit, J. Zhao, and K. H. Nierhaus. 1995. Proton and deuteron spin targets in biological structure research. Nucl. Instr. A. 356:124–132. [Google Scholar]
- Surolia, A., C. P. Swaminathan, R. Ramkumar, and S. K. Podder. 1997. Unusual structural stability and ligand induced alteration in oligomerization of a galectin. FEBS Lett. 409:417–420. [DOI] [PubMed] [Google Scholar]
- Svergun, D. I. 1992. Determination of the regularization parameter in indirect-transform methods using perceptual criteria. J. Appl. Crystallogr. 25:495–503. [Google Scholar]
- Svergun, D. I. 1999. Restoring low resolution structure of biological macromolecules from solution scattering using simulated annealing. Biophys. J. 76:2879–2886. [DOI] [PMC free article] [PubMed] [Google Scholar]
- Svergun, D. I., C. Barberato, and M. H. J. Koch. 1995. CRYSOL—a program to evaluate x-ray solution scattering of biological macromolecules from atomic coordinates. J. Appl. Crystallogr. 28:768–773. [Google Scholar]
- Svergun, D. I., S. Richards, M. H. J. Koch, Z. Sayers, S. Kuprin, and G. Zaccai. 1998. Protein hydration in solution: experimental observation by x-ray and neutron scattering. Proc. Natl. Acad. Sci. USA. 95:2267–2272. [DOI] [PMC free article] [PubMed] [Google Scholar]
- Svergun, D. I., M. V. Petoukhov, and M. H. J. Koch. 2001. Determination of domain structure of proteins from x-ray solution scattering. Biophys. J. 80:2946–2953. [DOI] [PMC free article] [PubMed] [Google Scholar]
- Sweeney, E. C., A. G. Tonevitsky, R. A. Palmer, H. Niwa, U. Pfüller, J. Eck, H. Lentzen, I. I. Agapov, and M. P. Kirpichnikov. 1998. Mistletoe lectin I forms a double trefoil structure. FEBS Lett. 431:367–370. [DOI] [PubMed] [Google Scholar]
- Tehei, M., D. Madern, C. Pfister, and G. Zaccai. 2001. Fast dynamics of halophilic malate dehydrogenase and BSA measured by neutron scattering under various solvent conditions influencing protein stability. Proc. Natl. Acad. Sci. USA. 98:14356–14361. [DOI] [PMC free article] [PubMed] [Google Scholar]
- Vachette, P., and D. I. Svergun. 2000. Small-angle x-ray scattering by solutions of biological macromolecules. In Structure and Dynamics of Biomolecules. E. Fanchon, G. Geissler, J.-L. Hodeau, J.-R. Regnard, and P. A. Timmins, editors. Oxford University Press, New York. 199–237.
- Varela, P. F., D. Solís, T. Diaz-Mauriño, H. Kaltner, H.-J. Gabius, and A. Romero. 1999. The 2.15 Å crystal structure of CG-16, the developmentally regulated homodimeric chicken galectin. J. Mol. Biol. 294:537–549. [DOI] [PubMed] [Google Scholar]
- Vasta, G. R., H. Ahmed, L. M. Amzel, and M. A. Bianchet. 1997. Galectins from amphibian species: carbohydrate specificity, molecular structure, and evolution. Trends Glycosci. Glycotechnol. 9:131–144. [Google Scholar]
- Villalobo, A., and H.-J. Gabius. 1998. Signaling pathways for transduction of the initial message of the glycocode into cellular responses. Acta Anat. 161:110–129. [DOI] [PubMed] [Google Scholar]
- Weigel, P. H., and J. H. N. Yik. 2002. Glycans as endocytosis signals: the cases of the asialoglycoprotein and hyaluronan/chondroitin sulfate receptors. Biochim. Biophys. Acta. 1572:341–363. [DOI] [PubMed] [Google Scholar]
- Wignall, G. D., and F. S. Bates. 1987. Absolute calibration of small angle neutron-scattering data. J. Appl. Crystallogr. 20:28–40. [Google Scholar]
- Whitney, P. L., J. T. Powell, and G. L. Sanford. 1986. Oxidation and chemical modification of lung β-galactoside-specific lectin. Biochem. J. 238:683–689. [DOI] [PMC free article] [PubMed] [Google Scholar]
- Wu, A. M., S.-C. Song, M.-S. Tsai, and A. Herp. 2001. A guide to the carbohydrate specificities of applied lectins-2. Adv. Exp. Med. Biol. 491:551–585. [DOI] [PubMed] [Google Scholar]
- Yang, R.-Y., D. K. Hsu, and F.-T. Liu. 1996. Expression of galectin-3 modulates T-cell growth and apoptosis. Proc. Natl. Acad. Sci. USA. 93:6737–6742. [DOI] [PMC free article] [PubMed] [Google Scholar]
- Zaccai, G., and B. Jacrot. 1983. Small angle neutron scattering. Annu. Rev. Biophys. Bioeng. 12:139–157. [DOI] [PubMed] [Google Scholar]