

Abstract
A central theme in prion protein research is the detection of the process that underlies the conformational transition from the normal cellular prion form (PrPC) to its pathogenic isoform (PrPSc). Although the three-dimensional structures of monomeric and dimeric human prion protein (HuPrP) have been revealed by NMR spectroscopy and x-ray crystallography, the process underlying the conformational change from PrPC to PrPSc and the dynamics and functions of PrPC remain unknown. The dimeric form is thought to play an important role in the conformational transition. In this study, we performed molecular dynamics (MD) simulations on monomeric and dimeric HuPrP at 300 K and 500 K for 10 ns to investigate the differences in the properties of the monomer and the dimer from the perspective of dynamic and structural behaviors. Simulations were also undertaken with Asp178Asn and acidic pH, which is known as a disease-associated factor. Our results indicate that the dynamics of the dimer and monomer were similar (e.g., denaturation of helices and elongation of the β-sheet). However, additional secondary structure elements formed in the dimer might result in showing the differences in dynamics and properties between the monomer and dimer (e.g., the greater retention of dimeric than monomeric tertiary structure).
INTRODUCTION
Transmissible spongiform encephalopathies are neurodegenerative diseases that are attributable to the structural transformation of cellular prion (PrPC) to its anomalous isoform (PrPSc). In humans, these diseases include kuru, Creutzfeldt-Jakob disease, fatal familial insomnia, and Gerstmann-Sträussler-Scheinker syndrome; in sheep, scrapie; and in cattle, bovine spongiform encephalopathy. The most important aspect of prion disease is the conformational transition of PrPC to PrPSc, both of which are isoforms with identical amino acid sequence. However, comparison of the secondary structures shows that PrPC is ∼42% helical with a very low (∼3%) β-sheet content, whereas PrPSc consists of 30% α-helices and 43% β-sheets. Although the precise physiological role of PrPC and the chemical differences between PrPC and PrP remain unknown, it appears that the differences are conformational (Pan et al., 1993; Safar et al., 1993).
The three-dimensional structures of monomeric PrPCs from various sources have been determined by NMR spectroscopy (Riek et al., 1996; Donne et al., 1997; Zhang et al., 1997; Lopez et al., 2000; Zahn et al., 2000) and found to be very similar among many species. The N-terminal region (residues 23–124) is flexible, and the C-terminal region (residues 125–228) that contains the globular domains is well structured. All of these structures contain intramolecular disulfide bridges, three α-helices, and a short double-stranded β-sheet (Fig. 1 a). Recent x-ray crystallographic studies determined the dimeric form of human PrPC (Knaus et al., 2001). The dimer is the result of three-dimensional swapping of the C-terminal helix 3 and rearrangement of the disulfide bonds (Fig. 1 b). The transition process from PrPC to PrPSc has been explained by two popular models. According to the heterodimer model (Prusiner, 1991; Cohen et al., 1994), PrPSc induces the conformational change of PrPC by contact. The nucleation-dependent polymerization model of Lansbury and Caughey (1995), on the other hand, suggests that PrPSc acts as a crystal seed at the starting point for crystal-like growth of a PrPSc oligomer and that conformational change occurs via transient interaction between PrPC and PrPSc. Several mutations in the primary structure of PrPC are known to segregate in a variety of transmissible spongiform encephalopathies (Prusiner, 1996). In this study, we selected the Asp178Asn (D178N) mutation known to be associated with fatal familial insomnia (Met129/Asn178). In the D178N mutation, the change from a positively charged to an uncharged residue may affect the hydrogen-bonding network and salt bridge (Riek et al., 1998). Recombinant forms of human and murine PrPC manifest a pH-dependent conformational change in the pH range of 4.4–6, a loss of helix, and a gain of strands (Swietnicki et al., 1997; Hornemann and Glockshuber, 1998). Lower pH values accelerated conversion in a cell-free conversion assay (Kocisko et al., 1995). Thus, acidic pH may play a role in facilitating the conformational change that ultimately results in the formation of PrPSc.
FIGURE 1.

Schematic ribbon diagram of HuPrPc: (a) monomer; (b) dimer.
More recent conformational conversion models focus on intra- and intermolecular disulfide bonds (Welker et al., 2001, 2002; Tompa et al., 2002). Some experiments have suggested that intramolecular disulfide bonds in PrPC are required for its conversion to PrPSc (Muramoto et al., 1996; Herrmann and Caughey, 1998; Maiti and Surewicz, 2001). To weaken these disulfide bonds, a hypothetical molecular chaperone may be necessary (Telling et al., 1995; Kaneko et al., 1997).
Dimerization is usually required for proteins to evolve oligomeric proteins (Monod et al., 1965). With respect to PrP, Meyer et al. (2000) reported a monomer-dimer equilibrium under native conditions in a fraction of PrPC from bovine brain (Meyer et al., 2000). Others have suggested that three-dimensional domain-swapping-dependent oligomerization is an important step in the conformational change of PrPC to PrPSc (Knaus et al., 2001; Riley et al., 2002; Tompa et al., 2002). However, the function and dynamics of the dimeric form of PrPC remain to be elucidated.
Molecular dynamics (MD) simulations are widely used to simulate the motion of molecules to gain a deeper understanding of the chemical reactions, fluid flow, phase transitions, and other physical phenomena due to molecular interactions (Hansson et al., 2002). Rapidly increasing computational power has made MD simulation a powerful tool for studying the structure and dynamics of biologically important molecules. Taking into account all electrostatic interactions by using the particle-mesh Ewald (PME) method, relatively long (2–3 ns) simulations with the explicit solvent water box can be carried out (Darden et al., 1993, 1999). Day et al. (2002) have shown that by increasing the temperature, protein unfolding can be accelerated without changing the pathway of unfolding, and that this method is suitable for elucidating the details of protein unfolding at minimal computational expense. With these methods, one can obtain proper trajectories that reflect the conformational and dynamic characteristics of molecules at each time point during simulation.
Most reported MD simulations of PrPC have been reported (Zuegg and Greedy, 1999; Guilbert et al., 2000; Wong et al., 2000; Parchment and Essex, 2000; El-Bastawissy et al., 2001; Gsponer et al., 2001; Okimoto et al., 2002), involved short simulation times of <2 ns or were performed using the AMBER ff94 force field (Cornell et al., 1995), and all of the previously reported simulation targets were the monomer. Higo et al. (2001) used the multi-canonical method to show that the ff96 force field (Kollman et al., 1997) reproduces the energy landscape more correctly than does the ff94 force field both in vacuo and in solvent water. We now report the first MD simulation of the dimeric PrPC conformation. The aim of our study was to assess differences in the functions and dynamics of the PrP monomer and dimer. We performed eight 10-ns MD simulations of PrPC dimer and monomer using the AMBER ff96 potential under different experimental conditions: a temperature of 300 K and 500 K, D178N mutant, and acidic pH.
MATERIALS AND METHODS
All simulations were performed with the AMBER 7 program package (Case et al., 2002) using the ff96 force field. The starting structures were human cellular prion protein (HuPrPC) entry 1QM2 (residues 125–228; Zahn et al., 2000) as a monomer model and 1I4M (chain A, residues 119–226; chain B: residues 227–334; Knaus et al., 2001) as a dimer model in the Brookhaven Protein Data Bank (Berman et al., 2000; Westbrook et al., 2002). We built the dimeric form of PrPC from 1I4M using Insight II. There are disulfide bonds between Cys179–Cys214 in the monomer and between Cys179–Cys311 and Cys214–Cys287 in the dimer. To establish an acidic pH environment, Asp, Glu, and His residues were protonated. The systems were surrounded with a 20-Å layer of TIP3P water molecules (Jorgensen et al., 1983) and neutralized by sodium ions using the LeaP module of AMBER 7. The number of solvent water molecules and counterions in each system are shown in Table 1. The solvated proteins with their counterions were minimized by 1000 conjugate gradient steps, heated from 0 to 300 K during 35 ps at temperature increments of 50 K every 5 ps, and kept at 300 K within 20 ps using the constant pressure and temperature algorithm (Berendsen et al., 1984). The SHAKE algorithm (Ryckaert et al., 1977) and PME algorithm with nonbonded cutoffs of 8 Å were used during heating. After equilibration, the production MD phase was carried out at 300 or 500 K for 10 ns using the constant volume and temperature ensemble and the PME algorithm with nonbonded cutoffs of 8 Å during simulation. All simulations were performed on the Magi (massively parallel computer for genome informatics) cluster running SCore 4.1 (Hori et al., 1996) at the Computational Biology Research Center. During the data-collection stage, the structures were saved to file every 250 fs. Secondary structures were analyzed using DSSP software (Kabsch and Sander, 1983), and images of simulated proteins were generated using MOLMOL software (Koradi et al., 1996).
TABLE 1.
Simulation conditions
| No. of ions | No. of water molecules | |
|---|---|---|
| WT | ||
| Monomer | 3 Na+ | 6814 |
| Dimer | 8 Na+ | 9374 |
| D178N | ||
| Monomer | 2 Na+ | 6807 |
| Dimer | 6 Na+ | 9373 |
| Acidic pH | ||
| Monomer | 15 Cl− | 7168 |
| Dimer | 28 Cl− | 9714 |
RESULTS AND DISCUSSION
Simulation stability
Fig. 2 shows the Cα root-mean-square deviations (RMSDs) from the initial structures of globular domains of HuPrPs. In this paper, we define residues 129–223 [including strand 1 (S1), helix 1 (H1), strand 2 (S2), helix 2 (H2), and helix 3 (H3)] of the monomer and dimer (chain A) as globular domains. As we encountered few differences in the Cα RMSD values for each dimeric subunit (data not shown), averaged data were used to present our results. In Fig. 2, a–c, simulation data at 300 K are shown as control data. In the simulation at 300 K, the Cα RMSD values for both the monomer and the dimer remained relatively low for a duration of 10 ns, although the monomer deviated from the initial structure more than the dimer. The average RMSD values of the monomer and dimer in the last 5 ns were 2.18 and 1.27 Å, respectively. In Fig. 2 a, at 500 K, the Cα RMSD values of the monomer increased and reached 9.01 Å at 6.6 ns. In contrast, the Cα RMSD values of the dimer increased gently; the peak deviation was 4.7 Å at 9.2 ns. The average RMSD values of the monomer and dimer in the last 5 ns were 6.63 Å and 3.23 Å, respectively, indicating that the monomer increased faster than the dimer. This tendency was a characteristic common to simulations at 300 K and 500 K. In Fig. 2, b and c, under conditions of D178N and acidic pH, the Cα RMSD values of both the monomer and the dimer showed the same tendency as they did at 300 K. At D178N, the peak values of Cα RMSD values were 2.76 Å and 1.32 Å, respectively. The average Cα RMSD values of the monomer and dimer in the last 5 ns were 1.72 Å and 1.44 Å, respectively, indicating that little conformation change occurred in the protein tertiary structure. At acidic pH values, the monomer and dimer peak Cα RMSD values were 2.86 Å at 4.45 ns and 2.81 Å at 9.94 ns, respectively. The average RMSD values of the monomer and dimer in the last 5 ns were 2.01 Å and 2.05 Å.
FIGURE 2.

RMSD values of Cα from the initial structures. (a–c) Red and blue lines indicate RMSD values of the dimer and the monomer at 300 K, respectively. (a) Green and pink lines indicate RMSD values of the dimer and the monomer at 500 K, respectively. (b) Green and pink lines indicate RMSD values of the dimer and the monomer at D178N, respectively. (c) Green and pink lines indicate RMSD values of the dimer and the monomer at acidic pH, respectively.
Secondary structure evolution
Figs. 3 and 4 show the secondary structure evolution during simulation as determined by the DSSP program (Kabsch and Sander, 1983). Figs. 5 and 6 are ribbon illustrations of snapshots of the trajectories. Figs. 3 a and 5 a depict simulation results of monomer HuPrP at 300 K. Although residues 152–156 of the H1 region formed a 310-helix or H-bonds over a 0.0–7.0-ns period, after 8.0 ns they formed an α-helix. Other secondary structure elements (S1, S2, H2, and H3) were retained throughout the simulation; however, several elongated S1 and S2 elements were observed until 4.0 ns (see the snapshot at 3.0 ns in Fig. 5 c). As shown in Figs. 3 b and 5 b, at ∼2.0 ns at 500 K, the monomer began to unfold in the β-sheet and at the C-terminus of H2 and H3. It appears that the degradation of the helices corresponds with the increase in Cα RMSD observed from 2.0 to 4.0 ns (Fig. 2 a). We noted subsequent changes in the secondary structure at 4.0–6.0 ns: 1), the transient formation of nonnative β-sheets at residues 129–130 and 222–223 and residues 132–133 and 159–160 and their unfolding, 2), the unfolding of the C-terminus of H2, and 3), the unfolding and refolding of H1 (Fig. 5 d). These changes produced a rapid increase in the Cα RMSD of the monomer to 7.2 Å at 4.6 ns (Fig. 2 a). Although the simulation at 500 K was denaturation simulation, we can consider the results as conformational search at 500 K. Fig. 5 d shows the denaturation state of H1 at 4.55 ns, the elongated S1 and S2 elements, and the additional β-sheet at 4.65 ns. Glockshuber et al. (1997) and Korth et al. (1997) demonstrated that the structure of H1 is different between PrPC and PrPSc and suggested this region might form β-sheet. There were notable changes in secondary structure elements from 6.0 to 7.0 ns. There were some instances of fluctuation in the loop and the Cα RMSD value reached 9.01 Å at 6.6 ns. At 300 and 500 K, comparison with the monomer revealed that the dimer contained two additional structural elements, helices H′ (residues 194–197 and 302–305) and a β-sheet S′ (residues 191–193 and 299–301), that formed subunit interfaces (Fig. 3, c and d). At 300 K, all elements including S′ and H′ were retained throughout the simulation, although there was slight disruption at some points (see Fig. 3 c). The C-terminus of H1 tended to form a 310-helix. In H2, H3, and H′, there were several H-bonds. At 500 K, the C-terminus of helices crumbled like that of monomer (Fig. 3 d). Our results imply that in both the monomer and the dimer, there is a tendency for H1, H2, and H3 to unfold, and that they share conformational vulnerability in these regions. Although in both the monomer and dimer we noted a similar tendency for the denaturation of several regions, the dimeric form retained a remnant of the initial structure (Fig. 5 e). S1, S2, and S′ were retained throughout the simulation. In fact, as shown in Fig. 2 a, the Cα RMSD values of the dimer increased more slowly than those of the monomer. Intersubunit interactions of H′, S′, and H1 and its molecular size (weight) may contribute to solidity of the dimer.
FIGURE 3.
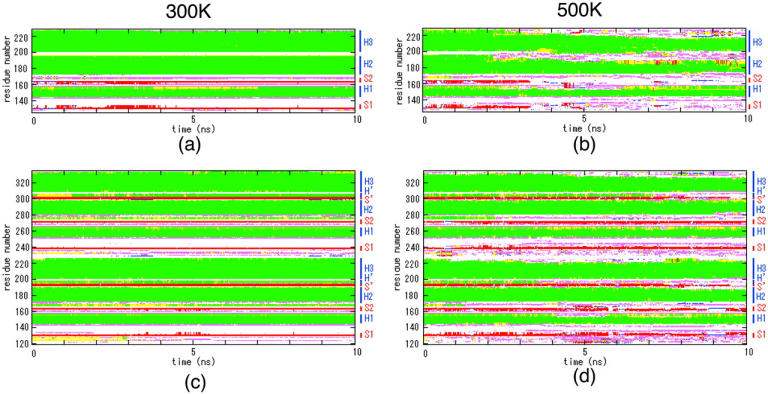
Secondary structure as a function of simulation time determined with DSSP. (a) Monomer at 300 K; (b) monomer at 500 K; (c) dimer at 300 K; and (d) dimer at 500 K. The α-helix is shown in green, the 310-helix in light green boxes, the β-strand in red boxes, the β-bridge in blue boxes, the bend in pink boxes, and the H-bond in yellow boxes.
FIGURE 4.
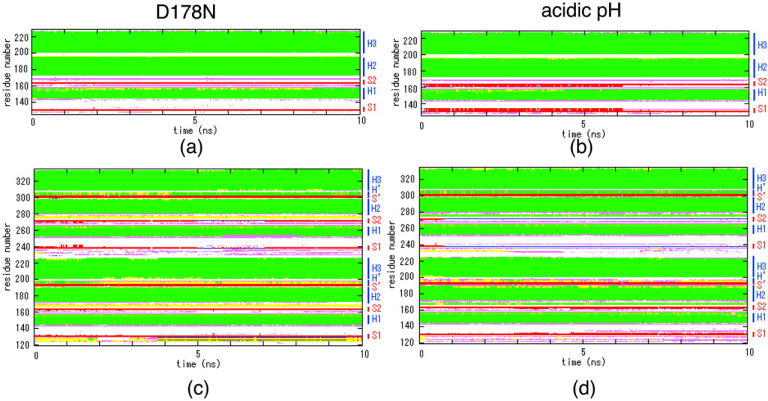
Secondary structure as a function of simulation time determined with DSSP. (a) Monomer at acidic pH and (b) dimer at acidic pH. The α-helix is shown in green, the 310-helix in light green boxes, the β-strand in red boxes, the β-bridge in blue boxes, the bend in pink boxes, and the H-bond in yellow boxes.
FIGURE 5.

(a) Temporal history of the monomer at 300 K; (b) temporal history of the monomer at 500 K; (c) one snapshot of the monomer at 300 K; (d) details of temporal history of the monomer at 500 K around 4.6 ns; (e) temporal history of the dimer at 300 K; and (f) temporal history of the dimer at 500 K.
FIGURE 6.

Temporal history of (a) the monomer at D178N; (b) the monomer at acidic pH; (c) the dimer at D178N; and (d) the dimer at acidic pH.
At D178N, residues 167–169 and 275–277 (residues 167–169 in chain B) in the dimer were mainly H-bonds; however, the helices were similar to those seen at 300 K (Fig. 4, a and c). In both the monomer and dimer, we noted several elongations of β-sheets, which were more pronounced in the monomer (Fig. 4, a and c, and Fig. 6, a and c).
At acidic pH values, several H-bonds were formed at the C-terminus of H1 in the dimer; however, the helices were similar to those seen at 300 K (Fig. 4, b and d). In both the monomer and dimer, we noted several elongations of β-sheets, which were more pronounced in the monomer (Fig. 4, b and d, and Fig. 6, b and d).
Percentage of secondary structure
Fig. 7 shows the percentage (abundance ratio) of secondary structures per residue throughout the simulation. At 300 K, the α-helix, H1, and H2 were longer in the monomer than the dimer. In H1, there seemed to be a predilection for elongating to the C-terminus side (Fig. 7 a) and a simultaneous tendency of the C-terminus to form a 310-helix in the monomer. S1 tended to elongate to the C-terminus side whereas S2 exhibited a tendency for elongation to the N-terminus side (Fig. 5 c) in both the monomer and dimer. S′ remained intact throughout the simulation.
FIGURE 7.
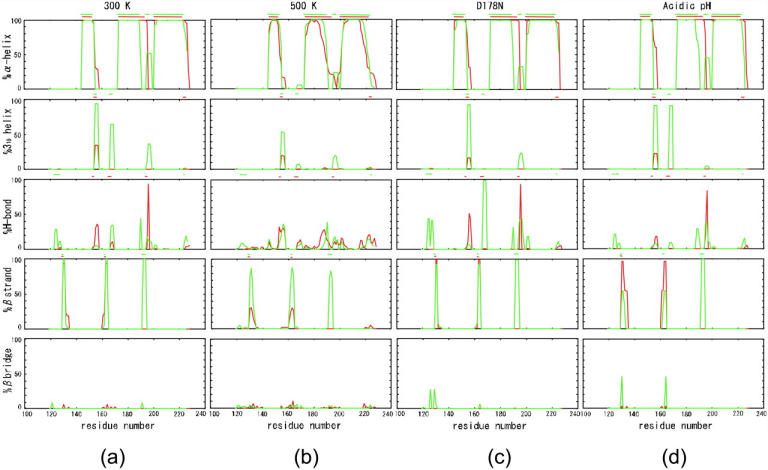
Percentage of secondary structure per residue during simulations at (a) 300 K, (b) 500 K, (c) D178N, and (d) acidic pH. Red and green indicate the monomer and dimer, respectively. Lines above each figure show the initial structure.
At 500 K, fewer α-helices, 310-helices, and β-sheets were formed than at 300 K (Fig. 7 b). Monomeric H1, H2, and H3 tended to denature more than their dimeric counterparts. H2 tend to elongate to the C-terminus side whereas H3 exhibited a tendency for elongation to the N-terminus side in the monomer. Fewer S1 and S2 elements were noted in the monomer than the dimer. S1 tended to elongate to the C-terminus side whereas S2 exhibited a tendency for elongation to the N-terminus side in both the monomer and dimer (Fig. 5 d).
Many of the secondary structures in both the monomer and dimer were similar at D178N to those observed at 300 K, confirming the Cα RMSD values from the initial structure findings (Fig. 2 b). In comparison with 300 K, at D178N residues 167–169 (both ends of the dimeric PrPc) revealed an H-bond instead of a 310-helix in the dimer. In the dimer, S1 and S2, but especially monomeric elements, tend to elongate to the C-terminus side and the N-terminus side, respectively.
At acidic pH values, some secondary structures were different from those seen at 300 K (Fig. 7 d) and the elongation of H1 in the monomer to the C-terminus side was more pronounced. Dimeric residues 167–169 mainly formed 310-helices. S1 and S2 in the dimer of chain A decreased probability to form β-sheets and it made β-bridges instead (Figs. 5 b and 6 b). In both the monomer and dimer, S1 and S2, but especially monomeric elements, tend to elongate to the C-terminus side and the N-terminus side, respectively (Figs. 5 and 6).
Fig. 7 shows that in both the monomer and the dimer but especially in the monomeric elements, S1 and S2 tended to elongate to the C-terminus side and the N-terminus side, respectively, at 300 K and acidic pH.
Positional RMSD from the average structure
Because we were unable to detect major differences in the results obtained at 300 K, D178N, and acidic pH, we present our results obtained with simulations at 300 K and 500 K. Fig. 8 shows Cα RMSD values from the mean structure as a function of residue number and is suitable for describing the flexibility differences among the residues. Because there were few differences between the RMSD profiles of chains A and B in the dimer (data not shown), only chain A is depicted. In order, the Cα RMSD values increased for the dimer at 300 K, the monomer at 300 K, the dimer at 500 K, and the monomer at 500 K. Fluctuations at positions 1 (Arg136), 2 (Phe141), 3 (Tyr157), and 4 (Asp168) were far larger than were fluctuations of other residues. The residues exhibiting the large fluctuations correspond with the loop regions, and at 300 K, only loop regions manifested fluctuations. Interestingly, a region adjacent to position 4 (residues 169–171) is a putative binding site for protein X (Kaneko et al., 1997), and NMR showed it to be flexible(Viles et al., 2001). Resonances of the loop are not observed in HuPrP due to conformational exchange. At position 6 (Gly195), the Cα RMSD values in the monomer increased to 19.9 Å at 500 K. At the same temperature, the same residue of the dimer increased to only 5.96 Å. This is consistent with Fig. 3 d, which shows that S′ and H′ stabilized this region. The smallest fluctuations were observed at positions 5 (Cys179) and 7 (Cys214) in H2 and H3, where residues Cys179–Cys214 of the monomer, and Cys179–Cys322 and Cys214–Cys287 of the dimer are connected by disulfide bridges and contribute to the stabilization of neighboring regions. It appears that H2 and H3 form a relatively stable core of the protein and MD simulations of the prion from Syrian hamster indicated that the remainder of the protein has a degree of conformational plasticity (Parchment and Essex, 2000). Studies that mapped antibodies to various epitopes on PrP (Peretz et al., 1997) also support the hypothesis that a core of the molecule containing H2 and H3 remains intact after the conversion of PrPC to PrPSc.
FIGURE 8.

Cα RMSD values from the average structure as a function of residue number. Red, blue, green, and pink lines indicate RMSD values of the dimer at 300 K, monomer at 300 K, dimer at 500 K, and monomer at 500 K, respectively.
Cα contact maps
Analyses of the close contacts throughout the simulations are shown in Fig. 9. The degree of each native contact during the simulations is depicted in red, pink, green, yellow, and blue in decreasing order. In Fig. 9, a and b, region 1 is the area of contact between S1 and H1 to just after S2, region 2 facilitates contact between S2 and H2, region 3 between H2 and H3, region 4 from the loop just after H1 to the loop connecting S2 with H2, and in region 5, contact occurs between the area just before S1 to H1 and H3. Monomers and dimers share many similarities in these regions. Regions 6 and 7, however, are unique to the dimer and comprise the dimer interface. Region 6 is the contact between H1 of chain A and H1 of chain B, and region 7 provides for contact between H′ and S′ of chain A and their counterparts in chain B. Fig. 9 d shows that during simulation at 500 K, most of the native interactions in the dimer lasted longer than those in the monomer (Fig. 9 b).
FIGURE 9.

Cα contact maps. (a) Monomer at 300 K; (b) monomer at 500 K; (c) dimer at 300 K; and (d) dimer at 500 K. The distance of Cα was 11 A. The existence ratio of contact 0–20% is shown in blue, 20–40% in yellow, 40–60% in green, 60–80% in pink, and 80–100% in red.
SUMMARY
PrP exists in not only a monomeric but also a dimeric form (Meyer et al., 2000; Knaus et al., 2001). Recent models suggest that dimerization plays an important role in the conformational change of PrPC to PrPSc (Tompa et al., 2002). Although earlier MD simulations have yielded information on the monomeric form of PrPC, data on its dimeric form remain scarce. To elucidate the conformational change of PrPC to PrPSc, the dynamics of the dimeric form of PrPC must be known. Therefore, we performed totally monomeric 40-ns simulations and dimeric 40-ns simulation in various conditions. Our conclusion that the monomer started denaturing earlier than the dimer is based on results we obtained in our study of Cα RMSD values from the initial structures (see Fig. 2), of secondary structure evolution during simulation (see Fig. 3), and of structures representative of conformational changes (see Fig. 5). Our results also showed that α-helices in both the monomer and dimer denatured in a similar manner (see Fig. 3). As the rate of protein denaturation is molecular weight-dependent, the greater retention of dimeric than monomeric tertiary and secondary structures is expected. However, we observed that in the dimer, the helices were denatured more readily whereas the tertiary structure was retained more than in the monomer. This suggests that the dimer interface, H' helices (residues 194–197 and 302–305), and an S′ β-sheet (residues 191–193 and 299–301) play an important role in the inhibition of tertiary structure of denaturalization. Although the discussion above was based on the simulation at 500 K, which was performed only one time for each prion model, the results potentially have biological importance. In our simulations, S1 and S2 in the dimer and especially the monomer tended to elongate to the C- and N-terminal sides, respectively, under most of the experimental conditions (see Figs. 4–7). This suggests that the monomeric form of PrPC is more likely to gain β-sheets. Our results suggest that if dimerization plays an important role in the transition from PrPC to PrPSc, some factors are required to enhance it. Kaneko et al. (1997) posited the existence of a molecular chaperone, protein X, and Tompa et al. (2002) proposed a disulfide-reshuffling model that is based on contacts between PrPC and PrPSc dimers and disulfide rearrangement(s). Our simulations were performed mainly on the well-ordered part of HuPrPC (residues 125–228 in the monomer and 119–226 and 227–334 in the dimer, termed the C-terminal region). In addition, N-terminal residues 90–124, truncated in the present model, are required for α-helix-to-β-sheet transition and for prion disease infectivity (Prusiner, 1982; Pan et al., 1993; Muramoto et al., 1996). Current simulation models will continue to yield insights into the structure, function, and dynamics of PrP, and work is continuing in our laboratory to elucidate the dynamics, structural change(s), and other factors that involve the monomeric and dimeric forms of PrP.
CONCLUSION
Ours is the first reported exploration of the dynamics of dimeric PrPC, residues 119–226, using MD simulation to assess whether the dimer is essential for the conformational transition of PrPC to PrPSc. Our results showed that denaturation of helices and elongation of the β-sheet were common to both the monomer and dimer. However, additional secondary structure elements formed in the dimer might result in the greater retention of dimeric than monomeric tertiary structure. Our results suggest that if dimerization plays an important role in the transition from PrPC to PrPSc, some factors are required to enhance it. At present, we cannot rule out the possibility that dimerization of HuPrP is a necessary step in the transition from PrPC to PrPSc. Efforts are under way in our laboratory to perform simulations of PrP 27–30, residues 90–231, to gain a better understanding of the underlying process(es) of conformational change from PrPC to PrPSc.
Acknowledgments
The authors thank Dr. M. Gromiha, Dr. S. Nakamura, Dr. K. Shimizu, Dr. M. Suwa, and Dr. T. Hirokawa for helpful discussions.
References
- Berendsen, H. J. C., J. P. M. Postma, W. F. Vangunsteren, A. Dinola, and J. R. Haak. 1984. Molecular-dynamics with coupling to an external bath. J. Chem. Phys. 81:3684–3690. [Google Scholar]
- Berman, H. M., T. N. Bhat, P. E. Bourne, Z. Feng, G. Gillil, H. Weissig, and J. Westbrook. 2000. The Protein Data Bank and the challenge of structural genomics. Nat. Struct. Biol. 7:957–959. [DOI] [PubMed] [Google Scholar]
- Case, D. A., D. A. Pearlman, J. W. Caldwell, T. E. Cheatham III, J. Wang, W. S. Ross, C. L. Simmerling, T. A. Darden, K. M. Merz, R. V. Stanton, A. L. Cheng, J. J. Vincent, M. Crowley, V. Tsui, H. Gohlke, R. J. Radmer, Y. Duan, J. Pitera, I. Massova, G. L. Seibel, U. C. Singh, P. K. Weiner, and P. A. Kollman. 2002. Assisted Model Building with Energy Refinement 7 (AMBER 7). University of California, San Francisco, CA.
- Cohen, F. E., K.-M. Pan, Z. Huang, M. Baldwin, R. J. Fletterick, and S. B. Prusiner. 1994. Structural clues to prion replication. Science. 264:530–531. [DOI] [PubMed] [Google Scholar]
- Cornell, W. D., P. Cieplak, C. I. Bayly, I. R. Gould, K. M. Merz, Jr., D. M. Ferguson, D. C. Spellmeyer, T. Fox, J. W. Caldwell, and P. A. Kollman. 1995. A second generation force field for the simulation of proteins, nucleic acids, and organic molecules. J. Am. Chem. Soc. 117:5179–5197. [Google Scholar]
- Darden, T., L. Perera, L. Li, and L. Pedersen. 1999. New tricks for modelers from the crystallography toolkit: the particle mesh Ewald algorithm and its use in nucleic acid simulations. Structure Fold. Des. 7:R55–R60. [DOI] [PubMed] [Google Scholar]
- Darden, T., D. York, and L. Pedersen. 1993. Particle mesh Ewald: an N·log (N) method for Ewald sums in large systems. J. Chem. Phys. 98:10089–10092. [Google Scholar]
- Day, R., B. Bennion, S. Ham, and V. Daggett. 2002. Increasing temperature accelerates protein unfolding without changing the pathway of unfolding. J. Mol. Biol. 322:189–203. [DOI] [PubMed] [Google Scholar]
- Donne, D. G., J. H. Viles, D. Groth, I. Mehlhorn, T. L. James, F. E. Cohen, S. B. Prusiner, P. E. Wright, and H. J. Dyson. 1997. Structure of the recombinant full-length hamster prion protein PrP(29–231): the N terminus is highly flexible. Proc. Natl. Acad. Sci. USA. 94:13452–13457. [DOI] [PMC free article] [PubMed] [Google Scholar]
- El-Bastawissy, E., M. H. Knaggs, and I. H. Gilbert. 2001. Molecular dynamics simulations of wild-type and point mutation human prion protein at normal and elevated temperature. J. Mol. Graph. Model. 20:145–154. [DOI] [PubMed] [Google Scholar]
- Glockshuber, R., S. Hornemann, R. Riek, G. Wider, M. Billeter, and K. Wuthrich. 1997. Three-dimensional NMR structure of a self-folding domain of the prion protein PrP(121–231). Trends Biochem. Sci. 22:241–242. [DOI] [PubMed] [Google Scholar]
- Gsponer, J., P. Ferrara, and A. Caflisch. 2001. Flexibility of the murine prion protein and its Asp178Asn mutant investigated by molecular dynamics simulations. J. Mol. Graph. Model. 20:169–182. [DOI] [PubMed] [Google Scholar]
- Guilbert, C., F. Ricard, and J. C. Smith. 2000. Dynamic simulation of the mouse prion protein. Biopolymers. 54:406–415. [DOI] [PubMed] [Google Scholar]
- Hansson, T., C. Oostenbrink, and W. F. van Gunsteren. 2002. Molecular dynamics simulations. Curr. Opin. Struct. Biol. 12:190–196. [DOI] [PubMed] [Google Scholar]
- Herrmann, L. M., and B. Caughey. 1998. The importance of the disulfide bond in prion protein conversion. Neuroreport. 9:2457–2461. [DOI] [PubMed] [Google Scholar]
- Higo, J., N. Ito, M. Kuroda, S. Ono, N. Nakajima, and H. Nakamura. 2001. Energy landscape of a peptide consisting of alpha-helix, 3(10)-helix, beta-turn, beta-hairpin and other disordered conformations. Protein Sci. 10:1160–1171. [DOI] [PMC free article] [PubMed] [Google Scholar]
- Hori, A., H. Tezuka, Y. Ishikawa, N. Soda, H. Konaka, and M. Maeda. 1996. Implementation of gang-scheduling on workstation cluster. In IPPS'96 Workshop on Job Scheduling Strategies for Parallel Processing, Vol. 1162 of Lecture Notes Computer Science. D. G. Feitelson and L. Rudolph, editors. Springer-Verlag. 76–83.
- Hornemann, S., and R. Glockshuber. 1998. A scrapie-like unfolding intermediate of the prion protein domain PrP(121–231) induced by acidic pH. Proc. Natl. Acad. Sci. USA. 95:6010–6014. [DOI] [PMC free article] [PubMed] [Google Scholar]
- Jorgensen, W., J. Chandreskhar, J. Madura, R. Imprey, and M. Klein. 1983. Comparison of simple potential functions for simulating water. J. Chem. Phys. 79:926–935. [Google Scholar]
- Kabsch, W., and C. Sander. 1983. Dictionary of protein secondary structure: pattern recognition of hydrogen-bonded and geometrical features. Biopolymers. 22:2577–2637. [DOI] [PubMed] [Google Scholar]
- Kaneko, K., L. Zulianello, M. Scott, C. M. Cooper, A. C. Wallace, T. L. James, F. E. Cohen, and S. B. Prusiner. 1997. Evidence for protein X binding to a discontinuous epitope on the cellular prion protein during scrapie prion propagation. Proc. Natl. Acad. Sci. USA. 94:10069–10074. [DOI] [PMC free article] [PubMed] [Google Scholar]
- Knaus, K. J., M. Morillas, W. Swietnicki, M. Malone, W. K. Surewicz, and V. C. Yee. 2001. Crystal structure of the human prion protein reveals a mechanism for oligomerization. Nat. Struct. Biol. 8:770–774. [DOI] [PubMed] [Google Scholar]
- Kocisko, D. A., S. A. Priola, G. J. Raymond, B. Chesebro, P. T. Lansbury, Jr., and B. Caughey. 1995. Species specificity in the cell-free conversion of prion protein to protease-resistant forms: a model for the scrapie species barrier. Proc. Natl. Acad. Sci. USA. 92:3923–3927. [DOI] [PMC free article] [PubMed] [Google Scholar]
- Kollman, P. A., R. Dixon, W. Cornell, T. Fox, C. Chipot, and A. Pohorille. 1997. The development/application of a ‘minimalist’ organic/biochemical molecular mechanic force field using a combination of ab initio calculations and experimental data. In Computer Simulation of Biomolecular Systems, Vol. 3. A. Wilkinson, P. Weiner, and W. F. van Gunsteren, editors. Elsevier. 83–96.
- Koradi, R., M. Billeter, and K. Wüthrich. 1996. MOLMOL: a program for display and analysis of macromolecular structures. J. Mol. Graph. 14:51–55. [DOI] [PubMed] [Google Scholar]
- Korth, C., B. Stierli, P. Streit, M. Moser, O. Schaller, R. Fischer, W. Schulz-Schaeffer, H. Kretzschmar, A. Raeber, U. Braun, F. Ehrensperger, S. Hornemann, R. Glockshuber, R. Riek, M. Billeter, K. Wuthrich, and B. Oesch. 1997. Prion (PrPSc)-specific epitope defined by a monoclonal antibody. Nature. 390:74–77. [DOI] [PubMed] [Google Scholar]
- Lansbury, P. T., Jr., and B. Caughey. 1995. The chemistry of scrapie infection: implications of the ‘ice 9’ metaphor. Chem. Biol. 2:1–5. [DOI] [PubMed] [Google Scholar]
- Lopez, G. F., R. Zahn, R. Riek, and K. Wuthrich. 2000. NMR structure of the bovine prion protein. Proc. Natl. Acad. Sci. USA. 97:8334–8339. [DOI] [PMC free article] [PubMed] [Google Scholar]
- Maiti, N. R., and W. K. Surewicz. 2001. The role of disulfide bridge in the folding and stability of the recombinant human prion protein. J. Biol. Chem. 276:2427–2431. [DOI] [PubMed] [Google Scholar]
- Meyer, R. K., A. Lustig, B. Oesch, R. Fatzer, A. Zurbriggen, and M. Vandevelde. 2000. A monomer-dimer equilibrium of a cellular prion protein (PrPC) not observed with recombinant PrP. J. Biol. Chem. 275:38081–38087. [DOI] [PubMed] [Google Scholar]
- Monod, J., J. Wyman, and J.-P. Changeux. 1965. On the nature of allosteric transitions: a plausible model. J. Mol. Biol. 12:88–118. [DOI] [PubMed] [Google Scholar]
- Muramoto, T., M. Scott, F. E. Cohen, and S. B. Prusiner. 1996. Recombinant scrapie-like prion protein of 106 amino acids is soluble. Proc. Natl. Acad. Sci. USA. 93:15457–15462. [DOI] [PMC free article] [PubMed] [Google Scholar]
- Okimoto, N., K. Yamanaka, A. Suenaga, M. Hata, and T. Hoshino. 2002. Computational studies on prion proteins: effect of Ala117→Val mutation. Biophys. J. 82:2746–2757. [DOI] [PMC free article] [PubMed] [Google Scholar]
- Pan, K. M., M. Baldwin, J. Nguyen, M. Gasset, A. Serban, D. Groth, I. Mehlehorn, Z. Huang, R. J. Fletterick, F. E. Cohen, and S. B. Prusiner. 1993. Conversion of alpha-helices into beta-sheets features in the formation of the scrapie prion proteins. Proc. Natl. Acad. Sci. USA. 90:10962–10966. [DOI] [PMC free article] [PubMed] [Google Scholar]
- Parchment, O., and J. Essex. 2000. Molecular dynamics of mouse and Syrian hamster PrP: implications for activity. Proteins 38:327–340. [PubMed] [Google Scholar]
- Peretz, D., R. A. Williamson, Y. Matsunaga, H. Serban, C. Pinilla, R. B. Bastidas, R. Rozenshteyn, T. L. James, R. A. Houghten, F. E. Cohen, S. B. Prusiner, and D. R. Burton. 1997. A conformational transition at the N terminus of the prion protein features in formation of the scrapie isoform. J. Mol. Biol. 273:614–622. [DOI] [PubMed] [Google Scholar]
- Prusiner, S. B. 1982. Novel proteinaceous infectious particles cause scrapie. Science. 216:136–144. [DOI] [PubMed] [Google Scholar]
- Prusiner, S. B. 1991. Molecular biology of prion diseases. Science 252:1515–1522. [DOI] [PubMed] [Google Scholar]
- Prusiner, S. B. 1996. Molecular biology and pathogenesis of prion diseases. Trends Biochem. Sci. 21:482–487. [DOI] [PubMed] [Google Scholar]
- Riek, R., S. Hornemann, G. Wider, M. Billeter, R. Glockshuber, and K. Wuthrich. 1996. NMR structure of the mouse prion protein domain PrP(121–321). Nature. 382:180–182. [DOI] [PubMed] [Google Scholar]
- Riek, R., G. Wider, M. Billeter, S. Hornemann, R. Glockshuber, and K. Wuthrich. 1998. Prion protein NMR structure and familial human spongiform encephalopathies. Proc. Natl. Acad. Sci. USA. 95:11667–11672. [DOI] [PMC free article] [PubMed] [Google Scholar]
- Riley, M. L., C. Leucht, S. Gauczynski, C. Hundt, M. Brecelj, G. Dodson, and S. Weiss. 2002. High-level expression and characterization of a glycosylated covalently linked dimer of the prion protein. Protein Eng. 15:529–536.12082172 [Google Scholar]
- Ryckaert, J. P., G. Ciccotti, and H. J. C. Berendsen. 1977. Numerical integration of the Cartesian equations of motion of a system with constraints: molecular dynamics of n-alkanes. J. Comput. Phys. 23:327–341. [Google Scholar]
- Safar, J., P. P. Roller, D. C. Gajdusek, and C. J. Gibbs. 1993. Thermal stability and conformational transitions of scrapie amyloid (prion) protein correlate with infectivity. Protein Sci. 2:2206–2216. [DOI] [PMC free article] [PubMed] [Google Scholar]
- Swietnicki, W., R. Petersen, P. Gambetti, and W. K. Surewicz. 1997. pH-dependent stability and conformation of the recombinant human prion protein PrP(90–231). J. Biol. Chem. 272:27517–27520. [DOI] [PubMed] [Google Scholar]
- Telling, G. C., M. Scott, J. Mastrianni, R. Gabizon, M. Torchia, F. E. Cohen, S. J. DeArmond, N. Stahl, and S. B. Prusiner. 1995. Prion propagation in mice expressing human and chimeric PrP transgenes implicates the interaction of cellular PrP with another protein. Cell. 83:79–99. [DOI] [PubMed] [Google Scholar]
- Tompa, P., G. E. Tusnady, P. Friedrich, and I. Simon. 2002. The role of dimerization in prion replication. Biophys. J. 82:1711–1718. [DOI] [PMC free article] [PubMed] [Google Scholar]
- Viles, J. H., D. Donne, G. Kroon, S. B. Prusiner, F. E. Cohen, H. J. Dyson, and P. E. Wright. 2001. Local structural plasticity of the prion protein. Analysis of NMR relaxation dynamics. Biochemistry. 40:2743–2753. [DOI] [PubMed] [Google Scholar]
- Welker, E., L. D. Raymond, H. A. Scheraga, and B. Caughey. 2002. Intramolecular versus intermolecular disulfide bonds in prion proteins. J. Biol. Chem. 277:33477–33481. [DOI] [PubMed] [Google Scholar]
- Welker, E., W. J. Wedemeyer, and H. A. Scheraga. 2001. A role for intermolecular disulfide bonds in prion diseases? Proc. Natl. Acad. Sci. USA 98:4334–4336. [DOI] [PMC free article] [PubMed] [Google Scholar]
- Westbrook, J., Z. Feng, S. Jain, T. N. Bhat, N. Thanki, V. Ravichandran, G. L. Gilliland, W. Bluhm, H. Weissig, D. S. Greer, P. E. Bourne, and H. M. Berman. 2002. The Protein Data Bank: unifying the archive. Nucleic Acids Res. 30:245–248. [DOI] [PMC free article] [PubMed] [Google Scholar]
- Wong, N. K. C., D. V. Renouf, S. Lehmann, and E. F. Hounsell. 2000. Glycosylation of prions and its effect on protein conformation relevant to amino acid mutations. J. Mol. Graph. Model. 18:126–134. [DOI] [PubMed] [Google Scholar]
- Zahn, R., A. Liu, T. Luhrs, R. Riek, C. von Schroetter, F. L. Garcia, M. Billeter, L. Calzolai, G. Wider, and K. Wuthrich. 2000. NMR solution structure of the human prion protein. Proc. Natl. Acad. Sci. USA. 97:145–150. [DOI] [PMC free article] [PubMed] [Google Scholar]
- Zhang, H., J. Stockel, I. Mehlhorn, D. Groth, M. A. Baldwin, S. B. Prusiner, T. L. James, and F. E. Cohen. 1997. Physical studies of conformational plasticity in a recombinant prion protein. Biochemistry. 36:3543–3553. [DOI] [PubMed] [Google Scholar]
- Zuegg, J., and J. E. Greedy. 1999. Molecular dynamics simulations of human prion protein: importance of correct treatment of electrostatic interactions. Biochemistry. 38:13862–13876. [DOI] [PubMed] [Google Scholar]