

Abstract
Important routes to lipid vesicles (liposomes) are detergent removal techniques, such as dialysis or dilution. Although they are widely applied, there has been only limited understanding about the structural evolution during the formation of vesicles and the parameters that determine their properties. We use time-resolved static and dynamic light scattering to study vesicle formation in aqueous lecithin-bile salt mixtures. The kinetic rates and vesicle sizes are found to strongly depend on total amphiphile concentration and, even more pronounced, on ionic strength. The observed trends contradict equilibrium calculations, but are in agreement with a kinetic model that we present. This model identifies the key kinetic steps during vesicle formation: rapid formation of disklike intermediate micelles, growth of these metastable micelles, and their closure to form vesicles once line tension dominates bending energy. A comparison of the rates of growth and closure provides a kinetic criterion for the critical size at which disks close and thus for the vesicle size. The model suggests that liposomes are nonequilibrium, kinetically trapped structures of very long lifetime. Their properties are hence controlled by kinetics rather than thermodynamics.
INTRODUCTION
Vesicles, in particular lipid vesicles (liposomes), have an impact on a variety of areas, which range from fundamental science to biotechnology. Vesicles serve as models for cell membranes and allow the study of the basic mechanisms of membrane function, such as fusion (Lichtenberg, 1995; Lasic and Barenholz, 1996). Furthermore, liposomes of controllable size are used as biocompatible and protective structures to encapsulate labile molecules, such as proteins, nucleic acids or drugs, for pharmaceutical, cosmetic or chemical applications; they are also vital to the study of membrane proteins, including determining their structure via two-dimensional crystallization (Lasic, 1993; Lasch, 1995; Lasic, 1997; Rosoff, 1996; Ollivon et al., 2000).
Different methods are used to prepare lipid vesicles using detergent removal techniques: dilution, dialysis, gel exclusion chromatography, adsorption onto polymeric materials, temperature changes, or biochemical reactions (Ollivon et al., 2000). All these methods rely on the very high solubility of detergents compared to lipids. A reduction of the monomeric detergent concentration, for example by dialysis, removes detergent from the aggregates that are present initially, typically spherical or elongated micelles. This change in composition may then induce vesicle formation. Although techniques based on detergent removal are widely used, only limited information is available on the mechanism by which mixed micelles transform into vesicles. A better knowledge of the nonequilibrium behavior could help to optimize the detergents, conditions, and procedures used for vesicle formation.
More generally, little is known about the nonequilibrium behavior of surfactant aggregates, whereas their equilibrium properties are well studied (Evans and Wennerström, 1994). From a physicochemical point of view, particularly interesting are transformations between different monolayer and bilayer topologies (Lipowsky, 1991; Hyde et al., 1997), with the micelle-to-vesicle transition being a classic example. The properties of vesicles are extensively studied theoretically and experimentally in a number of different systems (Schurtenberger et al., 1985; Kaler et al., 1989; Hjelm et al., 1990; Long et al., 1994; Schönfelder and Hoffmann, 1994; Lin et al., 1994; Egelhaaf and Schurtenberger, 1994; Pedersen et al., 1995; Oberdisse et al., 1996; Danino et al., 1997; Cantu et al., 1997; Safran et al., 1990, 1991; Andelman et al., 1994; Fattal et al., 1995). Nevertheless, there has been only limited understanding of their formation and of the sequence of any intermediate structures (Almog et al., 1986, 1990; Edwards and Almgren, 1990, 1991; Walter et al., 1991; Edwards et al., 1993; Silvander et al., 1996; O'Connor et al., 1997; Campbell et al., 1998; Brinkmann et al., 1998; Egelhaaf and Schurtenberger, 1999; Chen et al., 1999; Xia et al., 2002; Schmölzer et al., 2002). It is still not conclusively decided what determines the final (“end-state”) properties of vesicles formed by detergent removal; equilibrium calculations (Safran et al., 1990, 1991) give the wrong trends for the dependence of liposome size on bilayer composition (Schurtenberger et al., 1985; Hjelm et al., 1990; Long et al., 1994; Egelhaaf and Schurtenberger, 1994; Kozlov and Andelman, 1996), although they are in agreement with experiments on catanionic surfactant vesicles (for example Kaler et al. (1989)). This suggests that the end-state liposomes are metastable structures that cannot achieve thermal equilibrium on observable timescales. There is, however, no clear consensus yet on whether liposomes represent a true equilibrium state or a metastable state of very long lifetime.
Here we study the nonequilibrium behavior of aqueous lecithin-bile salt mixtures, which are prime examples of mixed amphiphile solutions that exhibit a spontaneous micelle-to-vesicle transition (Schurtenberger et al., 1985; Hjelm et al., 1990; Long et al., 1994; Egelhaaf and Schurtenberger, 1994; Pedersen et al., 1995). They are of direct importance in biochemistry, physiology, and pharmacy, with the micelle-to-vesicle transition exploited in studies as mentioned above, and implicated in gallstone formation and digestion (Lichtenberg, 1995). In addition, they are well-controlled model systems, and we use them as such in this study of liposome reconstitution.
In aqueous lecithin-bile salt mixtures, different structures are observed with decreasing total concentration: spherical micelles—elongated, polymerlike micelles—vesicles. This sequence can be rationalized based on the concept of spontaneous curvature. The average spontaneous curvature of a monolayer comprising lecithin and bile salt depends on its composition: lecithin alone forms aggregates of low spontaneous curvature whereas bile salt alone forms highly curved (spherical) micelles. At high bile salt content, therefore, spherical or elongated mixed micelles form. Because bile salt is far more soluble than lecithin, a subsequent dilution causes the composition of the aggregates to change, so that the bile salt content is reduced and the spontaneous monolayer curvature decreased. With increasing dilution factor progressively longer, flexible cylindrical micelles are observed, until at higher dilution factors the end state comprises near-monodisperse, unilamellar vesicles whose size decreases with dilution factor (Schurtenberger et al., 1985; Hjelm et al., 1990; Long et al., 1994; Egelhaaf and Schurtenberger, 1994; Pedersen et al., 1995; Arleth et al., 2003).
Time-resolved light and neutron scattering experiments suggest that on a sudden dilution spherical or elongated micelles very quickly change into disklike micelles (within 1 s), which then transform into vesicles in a much slower process, typically 1 h (Egelhaaf and Schurtenberger, 1999). In this system, vesicle formation seems thus to occur along the following path: spherical or elongated micelles—disklike micelles—vesicles. Disklike intermediates have also been suggested under different conditions and for different systems (Walter et al., 1991; Edwards and Almgren, 1991; Luk et al., 1997; O'Connor et al., 1997; Schmölzer et al., 2002).
Note that when a series of samples of varying composition is prepared by dilution, different end-state structures can arise. Each end state might either represent a true equilibrium state, whose structure forms reversibly and does not depend on the preparation method, or a nonequilibrium metastable state, whose structure is generally path dependent and might have a very long life time. (Note that full equilibration is not guaranteed merely by the fact that a structure forms spontaneously.) As mentioned above, the end states observed in the present system range from spherical micelles via progressively longer cylindrical micelles to vesicles. The cylindrical micelles therefore represent compositional intermediates between spherical micelles and vesicles; such intermediates have been extensively studied. This paper mainly addresses kinetic intermediates that form dynamically during the process between an initial state of micelles and an end state comprising vesicles. For the system described here, disklike micelles have been found to arise as kinetic intermediates in this process (Egelhaaf and Schurtenberger, 1999). However, because they remain reactive (with a lifetime of hours), they are not seen as compositional intermediates in the sequence of end states created by varying composition.
We have performed new time-resolved static and dynamic light scattering experiments to elucidate the pathway of vesicle formation and the role of kinetics in determining the end-state properties of the liposomes. Crucially, we not only varied the final total amphiphile concentration c, but also investigated the dependence on salt (NaCl) concentration cs. (Note that all “global” parameters are collected in Table 1.) We expect cs to control the electrostatic interactions between negatively charged bile salt molecules and to influence bile salt solubility (Small, 1973), while having only marginal effects on the properties of the neutral lecithin within the range of cs studied here (Meyuhas et al., 1997). We use a bile salt (taurochenodeoxycholate) with a very low solubility, which shifts the vesicular region to very low lipid concentrations. Under these conditions, interactions between aggregates have a negligible effect on the light scattering results.
TABLE 1.
All “global” parameters used across different sections
| A | Rim area of disklike micelle |
|---|---|
| At | Total rim area density |
| aD, aL | Headgroup area of detergent and lipid, respectively |
| c | Concentration |
| cs | Salt concentration |
| cmcD, cmcL | Critical micellar concentration of detergent and lipid, respectively |
| D | Diffusion coefficient |
| d | Dilution factor |
| Ed | dlvo interaction energy |
| Et | Topological energy barrier |
| e | Electronic charge |
| f | Attempt frequency |
| H | Hamaker constant |
| h | Surface-to-surface distance |
| hf | Distance at which fusion occurs |
| I | Scattering intensity |
| 𝒦ij | Rate coefficient (kernel) of the Smoluchowski equation |
| k | Boltzmann's constant |
| L | Rim length of disklike micelle |
| NA | Avogadro's constant |
| n, nv | Number density of disklike micelles and vesicles, respectively |
| q | Scattering vector |
| R | Vesicle radius |
| Rh | Hydrodynamic radius |
| r | Radius of the central part of a disklike micelle |
| S | Reaction surface |
| T | Temperature |
| t | Time |
| Va | van der Waals interaction potential |
| Vd | dlvo interaction potential |
| Ve | Electrostatic interaction potential |
| Vf | Vesiculation index |
| vD, vL | Molecular volume of detergent and lipid, respectively |
| αb | Energy gain upon binding of one detergent molecule to the rim |
| αm | Micellization energy |
| ɛ | Dielectric constant of water |
| η | Viscosity |
 |
Mean, Gaussian and effective bending modulus, respectively |
| κD | Debye length |
| Λ | Line tension |
| ρ | Thickness of surfactant layer |
| σ | Surface (rim) charge density |
| σΓ | Polydispersity index |
| τc | Closure time |
| τg, τG | Growth time and total growth time, respectively |
| τz | Zimm time |
| φb | Bulk volume fraction of detergent |
| φD, φL | Volume fraction of detergent and lipid, respectively |
| φr | Rim surface fraction covered by detergent |
| ψ0 | Electrostatic potential |
| Ωd, Ωt | Effective dlvo and topological Boltzmann factor, respectively |
Note that subscripts i and j refer to parameters of disks formed from i and j initial disklike micelles, respectively.
Although there have been several attempts at qualitative descriptions, thermodynamic models or simulations of the formation of vesicles (Lasic, 1982, 1987, 1988; Thompson, 1990; Lasic, 1991; Goltsov and Barsukov, 2000; Yamamoto et al., 2002), here we develop a kinetic model, which we test by making a quantitative comparison between our calculations and measurements. (A brief description of our model can be found in Leng et al. (2002).) The important steps in vesicle formation are assumed to be those between the rapidly formed, disklike intermediate micelles and the end-state vesicles. First the disklike micelles grow by coalescence, which is described using a set of Smoluchowski rate equations. They are based on interactions between disks comprising the standard dlvo potential with, in addition, a local packing contribution to describe the formation of a “neck” between two disks. We then describe how large disks become unstable and close to form vesicles. This is due to incomplete coverage of their perimeter by bile salt, which yields a significant line tension. A comparison of growth time and closure time leads to a kinetic criterion for disk closure to form vesicles. Based on this kinetic criterion, vesicle size can be predicted and is in good agreement with our experimental results. This composition-dependent kinetic criterion, and not thermodynamics, is thus thought to control the end-state vesicle size.
MATERIALS AND METHODS
Sample preparation
Lecithin (egg yolk lecithin (grade 1), Lipid Products, South Nutfield, Surrey, UK) and bile salt (taurochenodeoxycholic acid sodium salt, Fluka, Gillingham, Dorset, UK) were dissolved in ethanol in a lecithin-to-bile salt molar ratio of 0.9 and dried under low pressure (Small et al., 1969; Egelhaaf and Schurtenberger, 1994). Then buffer (50 mM Tris, pH 8.0) was added to obtain a stock solution with a total lipid concentration of 50 mg/ml, which corresponds to lecithin and detergent (bile salt) volume fractions  and
and  , respectively. The stock solution was flushed with nitrogen and equilibrated for a few days at a temperature T = 23°C.
To obtain samples with the desired dilution factor d (defined as the concentration of the stock solution divided by the sample concentration) and salt concentration cs, the stock solution was diluted with buffer that also contained sodium chloride (NaCl). The samples were flushed with nitrogen, sealed, and kept at 23°C for at least two weeks. In the following we include the ionic strength originating from the buffer, 28.2 mM “effective” salt concentration, in the total salt concentration cs. We neglect, however, the contribution from counterions of bile salt (Na+), because their concentration, less than ∼1 mM, is much smaller than the concentration of added salt (cs ≥ 50 mM).
Before the light scattering measurements, ∼1 ml of sample is transferred into cylindrical scattering cells (10 mm inner diameter) and centrifuged at 5000 rpm and 23°C for 1 h to remove dust particles from the scattering volume. Samples for time-resolved experiments were prepared as follows: a small amount of the initial solution (d = 2, prepared as described above) is transferred into a scattering cell and centrifuged at 5000 rpm and 23°C for 30 min. It is then rapidly diluted with buffer of a given ionic strength, which has been repeatedly filtered using a Millipore filter (pore size 0.1 μm) to remove dust particles. Subsequently the sample is gently shaken and put into the light scattering instrument. The time from mixing until the first measurement is accurately determined and is typically 30 s.
Light scattering
Static (SLS) and dynamic (DLS) light scattering experiments were performed with an ALV goniometer modified to use fiber-optical detection (Gisler et al., 1995) and equipped with an ALV-5000 correlator and an argon ion laser (Coherent, Innova 90, λ = 514.8 nm). Measurements were made at 23°C and five different scattering angles θ (30°, 50°, 70°, 90°, and 110°). For the DLS measurements, several individual autocorrelation functions were determined at each angle. They were individually analyzed using a second-order cumulant analysis (Koppel, 1972), which yields the average decay rate 〈Γ(q)〉 and a polydispersity index  where q = (4πnref/λ) sin (θ/2) is the scattering vector and nref the refractive index of water. The average decay rate is then converted to the collective diffusion coefficient D = 〈Γ(q)〉/q2 and hydrodynamic radius Rh = kT/6πηD where k is Boltzmann's constant and η = 10−3 Pa s the solvent viscosity. The results were subsequently averaged for each angle. SLS was used to determine the average scattered intensity as a function of scattering vector I(q). The extrapolation to zero scattering vector, I(q → 0), was based on the form factor for a suspension of polydisperse shells with average radius R = Rh, thickness 2ρ = 50 Å (Small, 1967; Pedersen et al., 1995) and a Gaussian size distribution; the radius and its polydispersity were deduced from DLS. In the kinetic measurements, the time dependences of the average scattering intensity I(t) and intensity autocorrelation function, from which D(t) and Rh(t) are obtained, were monitored at one scattering angle (θ = 90°) with an individual measurement time of 5 s.
EXPERIMENTAL RESULTS
General phase behavior
First we examine a range of salt concentrations cs and dilutions d to determine the conditions that lead to vesicles only. Samples were kept at T = 23°C for at least two weeks before they were visually inspected and investigated by static and dynamic light scattering. These measurements yield the hydrodynamic radius Rh, polydispersity index σΓ, and the scattered intensity extrapolated to zero scattering vector I(q → 0), which is proportional to the average molar mass of the aggregates and the concentration (or 1/d).
Fig. 1 shows the cs-dependences for samples with d = 50, which is also typical for other dilutions. At low cs, Rh, and I(q → 0) show a pronounced increase whereas σΓ is approximately constant with σΓ ≈ 0.1. The data is consistent with the formation of near-monodisperse vesicles, which has, under similar conditions, already been reported (Schurtenberger et al., 1985; Egelhaaf and Schurtenberger, 1994; Cohen et al., 1998; Degovics et al., 2000). In the range cs ≈ 200–700 mM a modest, approximately linear increase in the detected average hydrodynamic radius Rh is observed (see also open symbols in Fig. 6) with a concomitant, significant rise in polydispersity. At the same time a dramatic drop in the scattered intensity is detected. This indicates the existence of another type of aggregate of lower scattering power, probably micelles that might coexist with vesicles (Long et al., 1994; Egelhaaf and Schurtenberger, 1994; Pedersen et al., 1995). This is expected for vesicular bile salt-to-lecithin ratios exceeding the maximal amount of bile salt that can be accommodated by vesicles (the “saturation concentration”) (Lichtenberg, 1995; Roth et al., 2000). At even higher cs ≳ 700 mM, both, Rh and I(q → 0) suddenly drop, indicating that only a small fraction of small aggregates are present in the scattering volume. Consistent with these results, the onset of bulk phase separation can be detected. By polarized light microscopy, this can be identified as lamellar phase coexisting with excess buffer. Here we are interested in the range of salt concentrations cs and dilutions d where only vesicles are present (Fig. 2, hatched area), which is determined from the dramatic change in I(q → 0) and the change in slope of Rh (solid line, Fig. 1).
FIGURE 1.
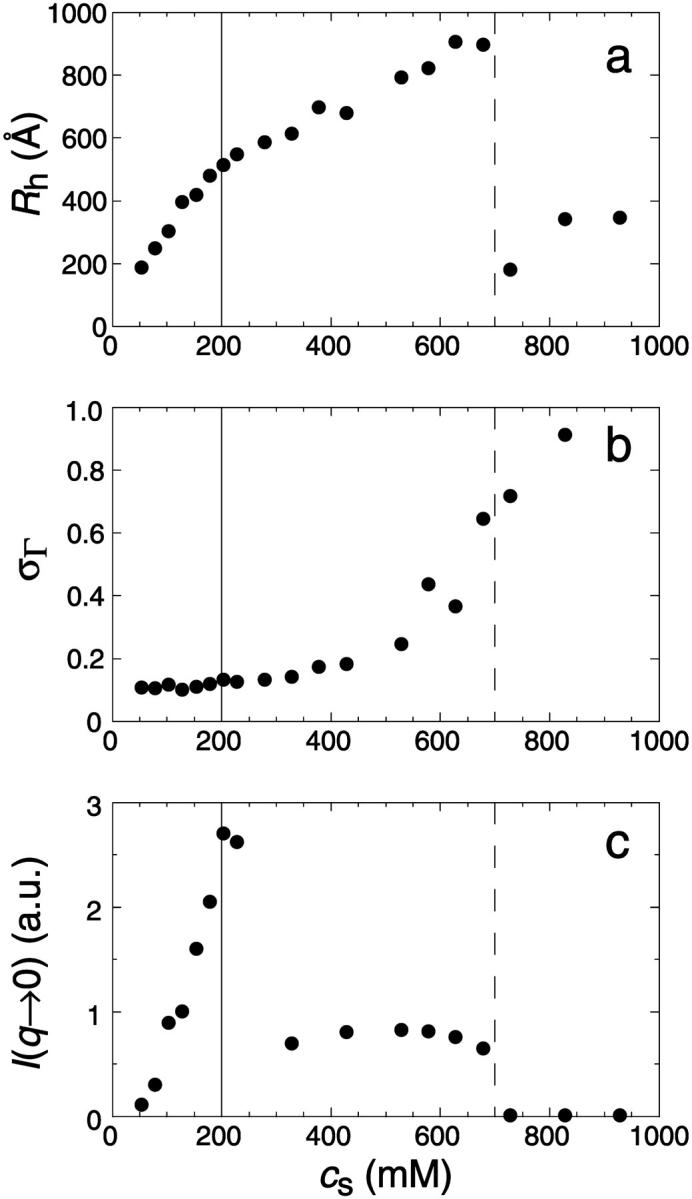
(a) Average hydrodynamic radius Rh, (b) polydispersity index σΓ, and (c) average scattered intensity I(q → 0) as a function of salt concentration cs for samples diluted to d = 50 and left at 23°C for at least two weeks. The different regimes are separated by vertical lines.
FIGURE 6.

Hydrodynamic radius Rh measured in the end state as a function of salt concentration cs for different final dilutions d (•: 40, ▪: 80, ▴: 120). Solid symbols correspond to vesicular samples and open symbols to samples beyond the vesicular region.
FIGURE 2.

Diagram indicating the range of salt concentrations cs and dilutions d for which only vesicles are observed (hatched area). The data points refer to changes in the light scattering behavior (Fig. 1, solid lines), while the line is a guide to the eye.
Relaxation after a dilution step
The relaxation after a rapid dilution step from an initial dilution d = 2 to different final dilutions was followed by time-resolved static and dynamic light scattering. The time dependences of the average scattering intensity I(t) and average collective diffusion coefficient D(t) were monitored with a time resolution of 5 s. Two typical examples are shown in Fig. 3. The normalized average scattering intensity I(t)/I(0) increases with time. For low cs, a slow increase is followed by a faster rise and a slow leveling off (solid line, 180 mM), whereas for higher cs only a steep increase with saturation is observed (dashed line, 230 mM). On the other hand, the diffusion coefficient D(t) decreases with time, indicating an increase in aggregate size. The timescale and final value depend strongly on cs and, to a lesser extent, on the final dilution d. The kinetics proceeds faster as cs is increased or d decreased. Because the time dependences are nontrivial, it is difficult to fully describe them without an appropriate model. We therefore focus for a quantitative characterization on four measures that can be obtained model independently: the hydrodynamic radius immediately after the dilution step Rh(t → 0); the end-state hydrodynamic radius Rh(t → ∞); the normalized initial slope of the intensity, (1/I)(dI/dt)(t → 0), and the normalized initial slope of the diffusion coefficient, (1/D)(dD/dt)(t → 0), which both provide a characteristic timescale of the kinetics.
FIGURE 3.

Time evolution of (a) relative scattered intensity I(t)/I(0) and (b) diffusion coefficient D(t) after a rapid dilution step from an initial dilution d = 2 to a final dilution d = 60 for two salt concentrations cs (solid line: 180 mM, dashed line: 230 mM). The individual measurement time was 5 s.
Size of the intermediate aggregates
In agreement with previous time-resolved light and neutron scattering experiments (Egelhaaf and Schurtenberger, 1999), the measurements indicate that upon a sudden dilution, intermediate aggregates form rapidly (in less than a second) compared to the timescale of the experiments. This suggests that an extrapolation of Rh to t = 0 yields the hydrodynamic radius of the intermediate aggregates. Rh(t → 0) is found to be ∼60 Å and hardly depends on cs or d.
Initial rate
The initial slopes of the time dependences of the scattered intensity I(t) and diffusion coefficient D(t) were determined as a function of salt concentration cs and final dilution d. The slopes were obtained by a second order polynomial fit and are converted into rates  according to:
 |
(1) |
Theoretically, the rate  can be related to the rate at which initial, intermediate aggregates coalesce to form aggregates of twice the mass (see “Growth”). Based on intermediate disklike aggregates (Egelhaaf and Schurtenberger, 1999) with a hydrodynamic radius of Rh ≈ 60 Å (see “Size of the intermediate aggregates”), we obtain the theoretical values βI = 1 and βD = 0.38 (Appendix A), which are used to convert the experimentally determined slopes to experimental rates
  (Eq. 1). Consistent values for the initial rate
  (Figs. 4 and 5) are obtained. On increasing cs,
  shows a steep increase spanning about two decades, which is more pronounced for lower final dilutions d (Fig. 4). This concurs with the increased screening of electrostatic interactions at higher cs, and also with the presence of higher charge on the disk, i.e., higher bile salt content, at lower d. In contrast, a much weaker dependence of
  on d is observed, whose absolute level, however, heavily depends on cs (Fig. 5), consistent with the strong dependence of
  on cs.
FIGURE 4.

Rate  obtained from the normalized initial slopes of the scattered intensity (•) and diffusion coefficient (○) as a function of salt concentration cs for different final dilutions d (a: 40, b: 60, c: 100). Model predictions are shown as lines with electrostatic interactions based on constant potential (solid line) and constant charge (dashed line), respectively. Parameters for calculations: aD = 200 Å2, αm = 10 kT and
  .
.
FIGURE 5.

Rate  obtained from the normalized initial slopes of the scattered intensity (•) and diffusion coefficient (○) as a function of final dilution d for different salt concentrations cs (a: 130 mM, b: 230 mM). Model predictions are shown as lines with electrostatic interactions based on constant potential (solid line) and constant charge (dashed line), respectively. Parameters for calculations: aD = 200 Å2, αm = 10 kT, and
End-state vesicle size
In addition to the time-resolved experiments, the end-state size was determined after the samples were left for at least two weeks at constant temperature (T = 23°C). In the vesicular region (for a larger range of parameters, see “General phase behavior”), the general dependence of Rh on cs is similar for all dilutions d studied, with typical dilution series shown in Fig. 6 (solid symbols). With increasing cs, Rh first moderately increases before a pronounced growth is observed, whose onset depends on d.
MODEL
We now examine theoretically the transition from micelles to vesicles and develop a simple model that describes the kinetic pathway, including the properties of the end-state vesicles. Our kinetic model (Fig. 7) assumes that the key kinetic steps during vesicle formation are those leading from the rapidly formed, intermediate disklike micelles to vesicles. First the disklike micelles grow by coalescence and then in a second stage the enlarged disklike micelles close to form vesicles. We also consider stacking of large disklike micelles, which competes with closure and could lead to a lamellar phase. For each step the theoretical predictions will be compared to our experimental data.
FIGURE 7.

Schematic representation of our kinetic model of the micelle-to-vesicle transition. The fundamental steps and their typical timescales are shown: rapid formation of disklike intermediate micelles, successive growth of these micelles up to the critical radius r* followed by their closure to form vesicles. Ripening of these vesicles to their equilibrium size was not observed, but might occur on a very long timescale. Under certain conditions growth and closure might become slower than stacking, which could lead to the formation of lamellar phase as the end state.
Intermediate disklike micelles
Time-resolved light and neutron scattering experiments suggest that upon rapid dilution, which removes bile salt from the aggregates and thus decreases the average spontaneous curvature, spherical, or elongated micelles very quickly transform into metastable disklike micelles (Egelhaaf and Schurtenberger, 1999).
Geometry
The disklike micelles are composed of lecithin and bile salt. These two amphiphiles have very different properties. Lecithin tends to form aggregates of low spontaneous curvature, typically flat bilayers. In contrast, bile salt has a positive spontaneous curvature and self-assembles into highly curved (spherical) micelles when alone in solution. This suggests that the central part of the disk, which is similar to a flat bilayer, is mainly composed of lipids, whereas the bile salt is sequestered at the rim where the curvature is high (Fig. 8).
FIGURE 8.

Schematic cross section of a disklike micelle. The central bilayer part (radius r, thickness 2ρ) is formed by lipid (L), while the rim also contains bile salt (B). Micellar bile salt is in equilibrium with monomeric bile salt in solution. In contrast, the monomer solubility of lipid is low enough to be neglected.
We thus model the intermediate micelles as consisting of a central, flat part with radius r and thickness 2ρ surrounded by a semitoroidal rim that matches the central part and thus has a radius ρ (Fig. 8). The surface area A of the rim is
 |
(2) |
and its outer length L is
 |
(3) |
As the central part resembles a bilayer fragment, we take for its thickness a typical bilayer thickness, 2ρ = 50 Å (Small, 1967; Pedersen et al., 1995).
We will argue below (see “Reaction-limited growth of disklike micelles”) that the disks grow by coalescence and thus assume that disk radii only exist in discrete steps: ri = i1/2r1 with the radius of the initial disklike micelles r1 ≈ 80 Å as determined based on a hydrodynamic radius Rh(t → 0) ≈ 60 Å (see “Size of the intermediate aggregates”). The subscript i refers to a disk formed from i initial disklike micelles with radius r1; we distinguish parameters referring to disks of different radii by subscripts, but suppress them for brevity if only one size of disk or a disk in general is considered.
Composition
The samples are prepared by diluting a stock solution with lecithin and bile salt volume fractions  and
and  respectively. For a sample with dilution factor d, this implies a lecithin volume fraction
  and bile salt volume fraction
As mentioned above, we assume that the central, flat part is formed by lipids with bile salt sequestered at the highly curved rim (Fig. 8). The solubility of lecithin is very small (cmcL ≈ 10−10 M (Tanford, 1980)) and monomeric lipid in solution is thus neglected. The total area of the central parts of disks and of the vesicles is related to the total amount of lipid φL and assumed constant throughout the kinetic pathway (for these purposes we neglect lipid in the rim):
 |
(4) |
where vL = 1266 Å3 and aL = 72 Å2 are the volume and headgroup area of a lecithin molecule, respectively (Small, 1967; Huang and Mason, 1978; Cornell et al., 1980), and ni and nv are the number densities of disks of radii ri and vesicles of radius R, respectively. (Because experiments suggest that the vesicles are near monodisperse, we only consider one size of vesicles R.)
Bile salt is much more soluble and we must take bile salt in bulk solution into account (volume fraction φb). Its solubility depends on the ionic strength and lipid concentration, but is for the bile salt we used (taurochenodeoxycholic acid) typically cmcD ≈ 1 mM (Small, 1973; Duane, 1977). In principle, bile salt also enters into the central part of the disk (volume fraction φc). This is driven by the entropy of mixing, but opposed by the curvature elasticity of the mixed bilayer (Kozlov et al., 1997). Based on an estimated equilibrium constant K = φc/(φbφL) = 330 for the partitioning of bile salt between bulk and a bilayer (vesicles) (Schurtenberger et al., 1985; Schubert, 1992; Lasch, 1995; Heerklotz and Seelig, 2000), we estimate that for all conditions investigated only a small fraction (≲0.06) of micellar bile salt is located in the central part. We thus neglect bile salt in the flat, central part of the disks (φc ≈ 0). Bile salt is therefore assumed to be partitioned between bulk solution and rims of disks (area fraction φr). Conservation of the total amount of bile salt φD, partitioned between bulk and rims, thus reads:
 |
(5) |
where At is the total rim area density, vD the volume of a bile salt molecule with vD = 660 Å3 (Matsuoka et al., 1987), and aD the rim area covered by one bile salt molecule at complete coverage of the rim. Depending on the conditions, a range of values 150 Å2 ≲ aD ≲ 250 Å2 can be found in the literature (Small, 1973; Schurtenberger et al., 1983; Janich et al., 1998); we will use it as an adjustable parameter. Equation 5 considers the most general case of a distribution of disks of different radii ri. For the initial system, where only disks with radius r1 are present, it reduces to φD = φb + (vD/aD)φrA1n1.
The exchange of bile salt between bulk and rim occurs on a timescale of the order of 1 μs (Diamant and Andelman, 1996; Telgmann and Kaatze, 1997). It is thus very fast compared to the processes we aim to describe, which have characteristic times of at least a few seconds (Figs. 3, 4, and 5). We therefore assume local equilibrium. The area fraction φr of bile salt on the rim can then be related to the bulk volume fraction φb through Davies' isotherm, which describes the adsorption of ionic surfactant (Davies, 1958a, 1958b; Diamant and Andelman, 1996):
 |
(6) |
where e is the electronic charge, ψ0 the electrostatic potential at the interface and the micellization energy αm accounts for the energy gain when one bile salt molecule is added to a disklike micelle. To our knowledge, there is no value for αm available and we thus use it as an adjustable parameter. In using this isotherm, we neglect lateral interactions between bile salt molecules within a monolayer and between different disks, and assume that it remains valid for curved monolayers. We furthermore assume that bile salt in bulk only exists in monomeric form.
At the present pH (pH 8.0), lecithin is zwitterionic and thus overall neutral. Bile salt, however, is fully dissociated (Small, 1973) and carries a negative charge. We assume that it is also fully dissociated in the micelles. This leads to a surface charge density σ = eφr/aD and thus creates the electrostatic potential ψ0 at the interface. For a 1:1 electrolyte, such as NaCl, of molar concentration cs the surface charge density is related to the potential ψ0 of a single micelle by the Gouy-Chapman theory (Russel et al., 1991):
 |
(7) |
where  is the Debye length and ɛ the dielectric constant of water. (Note that cs accounts for the added NaCl and the ionic strength originating from the buffer, see “Sample preparation”). We assume that the curvature of the interface does not significantly alter the above equation, because for our samples the (smallest) radius of curvature ρ is larger than the Debye length
Solving Eqs. 5, 6, and 7 simultaneously yields the composition of the disklike micelles. This depends on solution conditions, such as salt concentration cs and dilution factor d, as well as molecular parameters, namely aD, vD, and αm. There is no analytical solution of this set of equations, but the general trends are as follows (Fig. 9): For given d, increasing salt concentration cs progressively screens the electrostatic interactions between bile salt molecules. This favors adsorption of bile salt molecules onto the rim and thus φr is increased (Fig. 9 a) and φb is decreased (Fig. 9 b). On the other hand, for given cs, upon dilution bile salt molecules leave the aggregates to maintain the monomer concentration and thus φr decreases (Fig. 9 a, inset). Due to the decrease in total concentration, also φb decreases (Fig. 9 b, inset). An increase in cs also affects the electrostatic potential ψ0, whereas dilution has only a weak effect on ψ0 (Fig. 9 c).
FIGURE 9.

Effect of salt concentration cs and dilution d on the composition and properties of disks. (a) Rim area fraction φr covered by bile salt and number of bile salt molecules per initial disk φrA1/aD (right axis); (b) bulk volume fraction φb of bile salt and molar concentration of monomeric bile salt φb/vDNA (right axis); (c) electrostatic energy eψ0; (d) relative line tension Λ/Λ0 and relative vesiculation index Vf/V0 as a function of salt concentration cs for different dilution factors d (solid line: d = 40, dashed line: d = 80, dotted line: d = 120). The dependences on dilution d are shown in the insets (solid line: cs = 50 mM; dashed line: cs = 150 mM; dotted line: cs = 500 mM). The insets have the same y axes as the main figures. Eqs. 5, 6, and 7 were solved simultaneously for the initial system, i.e., monodisperse disks with i = 1, and Eqs. 9 and 21 were used for panel d. Parameters: r1 = 80 Å, ρ = 25 Å, aD = 200 Å2, αm = 10 kT, and Λ0 = 0.3 kT/Å. These parameters imply V0 = 0.6 (Eq. 21).
The composition and properties of the disklike micelles also depend on their size r. This is illustrated in Fig. 10, which is based on a monodisperse population of disks of size r. With increasing r and fixed overall composition, the total rim area density At decreases (Fig. 10 a), because the total amount of lipid φL, and thus of bilayer, is constant (Eq. 4). This decrease in At results in an increasing rim coverage φr and bulk volume fraction φb with increasing radius r. In contrast, the electrostatic potential ψ0 is hardly affected by an increase in disk size.
FIGURE 10.

Effect of disk radius r on the properties of disks for a constant sample composition. (a) Relative total rim area density At(r)/At(r1) and (b) vesiculation index Vf as a function of normalized disk radius r/r1 for dilution d = 80 and different salt concentrations cs (solid line: cs = 50 mM, dotted line: cs = 500 mM). Eqs. 5, 6, and 7 were solved simultaneously to obtain the composition, and then Eqs. 2, 4, 9, and 21 were used. Disks are assumed to be monodisperse. Parameters: ρ = 25 Å, aD = 200 Å2, αm = 10 kT, and Λ0 = 0.3 kT/Å.
Mechanical properties
The mechanical properties of the disks are determined by the elasticity of the bilayer, which is characterized by the mean bending modulus κ and the Gaussian modulus  as well as a line tension Λ. Under all conditions investigated, φr is significantly smaller than 1, typically ∼0.5 (Fig. 9 a). This leads either to the exposure of hydrophobic chains on the perimeter of the central part or local stress on the lecithin monolayer when it bends around the rim to shield the hydrophobic chains. Both cause an excess energy per unit length of rim, which can be expressed as a line tension Λ.
Fromherz (1983) proposed a thermodynamic analogy between surfactant molecules that decrease surface tension and “edge-actant” molecules that decrease line tension. The decrease of Λ upon adsorption of edge-actant molecules is modeled using Gibbs relation for adsorption of bile salt on the rim (which is assumed to reproduce the correct trend also for curved monolayers):
 |
(8) |
where Aφr/LaD is the number of adsorbed bile salt molecules per unit length of rim. This relation links the change of Λ to the adsorption isotherm, which is harmonious with our description of bile salt partitioning between bulk and rim (Eq. 6). Using the Gibbs relation (Eq. 8) together with the Davies' isotherm (Eq. 6), we obtain:
 |
(9) |
where Λ0 is the line tension without bile salt (with experimental values Λ0 = 0.2–0.8 kT/Å, (Moroz and Nelson, 1997) and references therein). We will use Λ0 as an adjustable parameter. The parameter αb = Λ0LaD/A is the size-dependent energy gain upon binding of one bile salt molecule to the rim. It characterizes the ability of an edge actant to lower the line tension by providing a cover with high curvature, but also depends on the nature of the adsorbing surface (the rim). In contrast, the micellization energy αm (see “Composition”) is related to the energy gain when one bile salt molecule is added to a disklike micelle, which reflects the hydrophobic nature of the molecule. We will see (see “Dependence on salt concentration and dilution”) that the interplay between the (surfactant) hydrophobic effect and the (edge actant) ability to cover a highly curved surface determines the capability of a molecule to stabilize disks. Fig. 9 d illustrates how the line tension Λ is controlled by the salt concentration cs and dilution factor d: Increasing cs screens electrostatic interactions and thus favors adsorption of bile salt, i.e., increases φr (Fig. 9 a), which relieves packing stress at the rim and hence results in a decrease of the line tension Λ (Eq. 9). On the other hand, increasing dilution d, reduces the bile salt concentration and hence its adsorption (Fig. 9 a, inset), which leads to an increase in line tension Λ (Fig. 9 d, inset). The line tension Λ also depends on the size r of disks through the total rim area density At (Fig. 10).
Growth
Reaction-limited growth of disklike micelles
We assume a first stage in which disklike micelles, initially monodisperse, grow. The low solubility of lecithin precludes growth by molecular diffusion or Ostwald ripening. Growth is thus likely to proceed by coalescence (or “aggregation”). When aggregation of two particles occurs immediately at contact, the process is limited by diffusion and in general is fast. Under these conditions, the characteristic aggregation time for a suspension of spheres of number density n1 is τ ∼ 3η/4kTn1 (Russel et al., 1991). For the densities of our solutions (n1 = 1020–1022 m−3) and the viscosity of water η = 10−3 Pa s, we obtain τ ∼ 10−5–10−3 s. This is much faster than our experimentally observed timescales, which are tens of seconds (Figs. 4 and 5). This rules out a diffusion-limited mechanism and indicates that growth is slowed down by repulsive interactions between disks, which lead to an activation barrier and prevent immediate coalescence. In the limit of a very large repulsive potential (compared to kT), the aggregation is reaction limited and in general the aggregation probability is so small that particles explore all possible mutual configurations before aggregation proceeds (Ball et al., 1987). In principle, we thus have to take into account all possible relative orientations of disks with edge-to-edge, edge-to-face, and face-to-face representing the main classes. However, the experimentally determined initial growth rate  strongly depends on salt concentration cs (Fig. 4) suggesting that electrostatic interactions play a significant role. Because there is little charged bile salt in the flat, central part of the disk (in our model it is in fact neglected), the only configuration involving significant electrostatic interactions is edge-to-edge (Fig. 11). This indicates that this configuration is the dominant one for coalescence. This is corroborated by estimates of the activation barrier (see “Interactions between disklike micelles”) which are lower in the edge-to-edge geometry despite the electrostatic contribution.
FIGURE 11.

Schematic representation of the coalescence of two disklike micelles in a edge-to-edge configuration. (a) Integration over the coordinates of all configurations at separation h ≈ hf gives the reaction volume Sijξ with Sij the reaction surface and ξ the distance over which coalescence can typically occur. (b) The scaling for the reaction surface, Sij ∼ rj(ri + rj), is obtained by considering a disk of radius rj sampling all possible edge-to-edge configurations with a disk of radius ri.
Growth by coalescence is modeled using a set of Smoluchowski rate equations (Russel et al., 1991; Hänggi et al., 1990), which provide the relation between number densities nk of disks of radii rk:
 |
(10) |
The first term on the right-hand side describes the creation of a k-aggregate by binary collisions of i- and j-aggregates (i + j = k) whereas the second term represents the disappearance of k-aggregates by binary collisions with any other aggregate. Three-body collisions are thus not taken into account and the equation is hence only valid for dilute systems, a condition well satisfied in our experiments. The productive collisions, i.e., those collisions leading to coalescence, between i- and j-aggregates occur with rate coefficients 𝒦ij, the kernels of the Smoluchowski equations. They contain all the information on the reaction. Before we can calculate the kernels 𝒦ij and examine the growth of disks, a description of the interactions between disklike micelles is required.
Interactions between disklike micelles
For coalescence to occur, two disks must first approach each other. This is controlled by the interactions between disks, which depend on their distance and relative orientation. Then a topological connection between the disks, a “neck,” has to be formed before coalescence can be completed. In the following we try to estimate the topological barrier to coalescence (the “bare fusion barrier”), which is related to formation of a neck and is expected to be relatively high, and the dlvo interactions, which comprise electrostatic and van der Waals interactions. We will call the sum of topological barrier and dlvo potential at the fusion distance, which represents the overall barrier, the “fusion barrier.”
Topological barrier
Estimating the topological barrier Et involved in forming a “neck” between two disklike micelles is very difficult. It is, however, similar to the fusion of bilayers, for which several models exist (Leikin et al., 1987; Israelachvili, 1992; Siegel, 1993; Lentz, 1994; Chernomordik et al., 1995; Lee and Lentz, 1997, 1998; Markin and Albanesi, 2002; Kozlovsky and Kozlov, 2002). They suggest that the topological barrier in the face-to-face orientation is ∼25 kT. Above we argued that the strong cs-dependence of  indicates that the edge-to-edge orientation dominates. Compared to the face-to-face (and also face-to-edge) orientation, less surface of similar curvature is involved in the edge-to-edge orientation and we thus expect a significantly lower energy barrier, which nevertheless amounts to several kT. (The actual height of the topological barrier Et is contained in the adjustable parameter
  see “Initial growth”.) In the presence of bile salt, the spontaneous curvature will become positive. Because the topological barrier depends on the membrane curvature, with negatively curved intermediates involved in the transition, the energy cost of the deformation and hence Et will increase. We neglect this composition dependence and we also neglect possible compositional inhomogeneities, such as bile salt-depleted, “sticky” patches on the rim, which might lower Et.
Overcoming the bare fusion barrier of several kT is thus a strongly limiting step and leads to coalescence being reaction limited under all conditions investigated, even for high salt concentrations where electrostatic repulsion is negligible. Fusion occurs at a distance hf, which is of the order of a molecular length, typically two hydration layers and thus hf ≈ 10 Å (Leikin et al., 1987).
DLVO interactions
We will first examine dlvo interactions between flat monolayers and then use the Deryaguin approximation to account for the curvature of the monolayers (Israelachvili, 1992; White, 1983). dlvo interactions comprise van der Waals attraction and electrostatic repulsion. The van der Waals interaction energy per unit area is taken as (Israelachvili, 1992)
 |
(11) |
where h is the distance between the monolayers, and H the Hamaker constant of the lipid-water-lipid system (H ≈ 5 × 10⁻²¹ J (Israelachvili, 1992)). We neglect retardation effects.
The negatively charged bile salt molecules lead to a surface charge density σ = eφr/aD and thus control the electrostatic potential ψ0 at the monolayer (Eq. 7; Fig. 9 c). This results in an electrostatic repulsion between two monolayers. However, the calculation of the electrostatic interaction is complicated by the fact that the bile salt molecules (and thus the charges) are mobile. When exposed to an electric field, for instance caused by another monolayer, bile salt molecules could either move to a more distant point on the monolayer or leave the monolayer. Furthermore, the degree of bile salt dissociation could change. An exact determination of the electrostatic interaction thus requires knowledge on how the charge on each of two approaching monolayers is regulated in response to their growing electrostatic interaction. Whatever the charge regulation mechanism (Russel et al., 1991; Yaminsky et al., 1996; Dean and Sentenac, 1997; Tsao and Sheng, 2001), we expect it to be bracketed by the two limiting cases of constant surface charge and constant surface potential. A crossover between the two regimes might occur and can depend on the charge density of the monolayer; for higher charge densities σ and/or lower salt concentration cs the constant potential limit should provide a better description, whereas for lower σ and/or higher cs the constant charge regime should be more appropriate.
We only investigate conditions implying relatively low surface charge densities σ and/or high salt concentrations cs. Under these conditions, the electrostatic interaction energy per unit area based on constant charge,  and constant potential,
  respectively, can be approximated by (Russel et al., 1991):
 |
(12) |
The above Eqs. 11 and 12 describe dlvo interactions between flat monolayers at a distance h. We now use the Deryaguin approximation to take the curvature of the monolayers into account. Based on the total interaction energy per area Vd(h) = Va(h) + Ve(h), which can either be based on constant charge,  or constant potential,
  the interaction energy Ed(h) of approaching monolayers with arbitrary curvature and orientation can be calculated using (White, 1983):
 |
(13) |
with
 |
(14) |
where ci,  cj, and
  are the two principal curvatures of the two monolayers and ϕ is the angle between the principal axes of the two monolayers (Fig. 11 a). Note that the angle α (Fig. 11 a) is an implicit parameter in the curvatures. The Deryaguin approximation is only valid for radii of curvature large compared to the length scale of the interactions. The smallest radius of curvature ρ = 25 Å thus has to be larger than the largest Debye length
  which is satisfied for salt concentrations cs ≳ 20 mM and thus for all conditions investigated.
The interaction energy Ed(h) as a function of distance h exhibits a typical behavior with a primary maximum due to the electrostatic repulsion that vanishes at high salt concentration cs and/or low charge, i.e., small φr. More relevant is the interaction energy at the typical fusion distance Ed(hf). Fig. 12 shows its dependence on cs for the electrostatic interaction based on constant charge (a) and constant potential (b) respectively. In the case of constant charge,  is in the range 0–10 kT, whereas a constant potential results in lower values for
  0–3 kT, for the salt concentrations cs ≳ 50 mM studied here. Above ∼300 mM, electrostatic interactions are essentially screened and the contribution of dlvo interactions to the growth rate is expected to be negligible. (There is, however, still an effect of the salt concentration on the line tension Λ due to the salt-dependent bile salt partitioning between rim and bulk; see Fig. 9.)
FIGURE 12.

The dlvo interaction energy Ed(hf) between two initial disks in edge-to-edge configuration (with ϕ = 0) and for a typical fusion distance hf = 10 Å as a function of salt concentration cs for three dilution factors d (solid line: d = 40, dotted line: d = 80, dashed line: d = 120). The electrostatic interactions are based on (a) constant charge,  and (b) constant potential,
  respectively.
Rate coefficients
The total fusion barrier E = Et + Ed depends on the topological barrier Et as well as the dlvo contribution Ed(hf). Its maximum is located near the typical fusion distance hf and is in the order of 10–30 kT (see “Interactions between disklike micelles”). It thus represents a significant barrier to coalescence. This leads to a very small coalescence probability and forces particles to explore all possible configurations before coalescence occurs (reaction-limited regime). This justifies use of classical transition-state theory (Hänggi et al., 1990) for the calculation of fusion rates. Here we only outline the calculation of the rate coefficients, whose details can be found in Appendix B.
The rate coefficients, or kernels, 𝒦ij of the Smoluchowski rate equations are (Appendix B):
 |
(15) |
where  is the attempt frequency for coalescence (Eq. 45) with Di the diffusion coefficient, ξ the distance over which coalescence can typically occur (Figs. 11 a and 17 in Appendix B) and Sijξ the corresponding reaction volume. (Sij ≈ 4πrj(rj + ri) is the reaction surface for the edge-to-edge orientation, Fig. 11 and Eq. 38 in Appendix B; although i and j are not interchangeable in Sij, Eq. 10 ensures symmetry between i and j.) This relation suggests that the reaction surface can be partitioned according to the (strength of) interactions Eij, i.e., the weight given to a reaction subsurface by the Boltzmann factor. The kernel then consists of a sum of reaction subsurfaces weighted by their Boltzmann factors and interaction-dependent attempt frequencies. If a configuration involves a relatively large barrier and thus a small Boltzmann factor (and small weight), it may be disregarded in a first approximation. This is particularly interesting in the case of anisotropic objects, like disks, with strongly orientation-dependent interactions. In our case, the energy barrier for the edge-to-edge configuration is much smaller than for all other configurations. Using appropriate approximations, it turns out that the contributions from the bare fusion potential and from the dlvo interactions can be decoupled (Appendix B). This renders manipulations relatively simple and we obtain:
 |
(16) |
where Ωt is the effective Boltzmann factor related to the topological barrier and Ωd,ij an average dlvo Boltzmann factor. A value for Ωd,ij can be calculated and depends on the dilution factor d, salt concentration cs and sizes ri and rj. The bare fusion rate coefficient  contains several unknown constants, but also the dependence on the size of disks, i.e., ri and rj. Based on Eq. 16 all
  can be calculated according to
 |
(17) |
with  remaining the only adjustable parameter. Subsequently all kernels
  can be obtained through Eq. 16.
Initial growth
We can now calculate the rate of initial growth (dimerization)  which corresponds to the coalescence of two initial disks:
 |
(18) |
where we used Eq. 16. Because  does not depend on cs or d, it represents only a scale factor for
  We use
  as an adjustable parameter. The dependence of
  on cs and d is contained in Ωd,11n1 and is controlled by several parameters, among them the two fit parameters aD and αm, which determine the composition of the disklike micelles.
At constant dilution d, the dependence of  on salt concentration cs is controlled by two effects. Increasing cs screens the electrostatic interactions and thus tend to increase the rate
  At the same time the screened electrostatic interactions favor adsorption of bile salt (φr is increased) with a concomitant increase in charge, which then tends to decrease
  In general the first effect, the increase of
  with cs due to the screening of the electrostatic interactions, clearly dominates. The dependence of
  on dilution d is also governed by a delicate balance: First, dilution slows down coalescence, because the probability that two disks meet is reduced (n1 ∼ 1/d). Second, dilution reduces the amount of bile salt φr on the rim to maintain the level of monomeric bile salt φb, which due to the decreased charge of the disks reduces the electrostatic repulsion and thus speeds up coalescence. Which effect dominates is determined by the level of rim coverage φr. This is controlled, among other parameters, by the micellization energy αm and the rim area covered by one bile salt molecule aD, which are used as fit parameters. Depending on the value of αm the rate
  can either decrease or increase with d, or its behavior can depend on whether the electrostatic interactions are governed by constant potential or constant charge conditions. A very similar dependence is observed for aD.
Subsequent growth
Once  is determined all
  and thus all kernels 𝒦ij can be calculated (Eqs. 16 and 17). The Smoluchowski rate equations (Eq. 10) are thus completely determined and could in principle be solved (numerically) to obtain the time dependence of all densities {ni(t)}. One complication is that, as the disks grow, the total rim area density At decreases (Fig. 10 a). This leads to an increase of rim coverage φr (Eq. 5), which in turn results in time-dependent electrostatic interactions and thus ultimately Ωd,ij(t) and 𝒦ij(t). The Smoluchowski rate equations thus have to be solved numerically while updating all kernels 𝒦ij(t) after each time step.
We examine two limiting cases, which will provide bounds for the actual kinetics. Initially, the total rim area density At is maximum and will only decrease as the disks grow with time (Fig. 10 a), which results in an increase of φr. The initial area fraction  thus represents a lower bound to φr(t). An upper bound to φr is obtained by assuming an evolving, but always monodisperse size distribution of disks, i.e., only one size of disk is present at any given time; a monodisperse size distribution leads to the minimal total rim area. Based on a (hypothetical) monodisperse growth, we thus obtain an upper bound
  for φr(t). Hence, the time-dependent rim area fraction φr(t) is bracketed by
 |
(19) |
Initially  but then the area fraction φr(t) increases; yet it will never reach
  For these two limits, all kernels 𝒦ij can be calculated (Eqs. 16 and 17) and the Smoluchowski rate equations solved numerically (using an adaptive time-step Runge-Kutta scheme). This yields the temporal evolution of densities
  and
and  which then provide bounds for the actual kinetics.
Comparison with experimental data: rate of initial growth
As mentioned above (see “Interactions between disklike micelles” and “Subsequent growth”), a quantitative comparison between our kinetic model and time-resolved experiments (Figs. 4 and 5) is complicated by two factors: First, as the disklike micelles grow, the total rim area density At decreases with time and leads to a steady redistribution of bile salt (see “Subsequent growth”). We avoid this complication here, by concentrating on the initial rates  (see “Initial growth”). Second, calculation of the electrostatic interactions requires knowledge of how the bile salt on each of two approaching micellar rims is regulated in response to their growing electrostatic interaction. For the present geometry the details are intractable, but we can calculate lower and upper bounds of the rates by assuming constant charge and constant potential, respectively (see “Interactions between disklike micelles”). We thus compare the experimentally determined
  (Figs. 4 and 5) with these two bounds. Despite the uncertainty, these data sets contain sufficient information to constrain the free parameters; we obtain aD = (200 ± 50) Å2, αm = (10 ± 1.5) kT and
  In the next section, we will use the experimentally determined end-state vesicle size to further constrain the ranges of these values (see “Comparison with experimental data: vesicle size”).
Fits (obtained by visual inspection) are displayed in Figs. 4 and 5. The bounding estimates of  for constant potential (solid line) and constant charge (dashed line) are found to reproduce the experimental trends on variation of cs and d and bracket the experimental data under most conditions. They tend to agree better with the constant potential limit for strong electrostatic interactions, i.e., low cs and low d, and with the constant charge limit for weak electrostatic interactions, i.e., high cs and high d (Fig. 4). In general, the results for the dependence on salt concentration cs are better than on dilution d. This could be because, in our model, bile salt in the central part of the disks is neglected instead of introducing another isotherm (Heerklotz and Seelig, 2000); for varying dilution and thus changing bile salt concentration, this approximation should be more severe. Furthermore, we also neglected the formation of pure bile salt micelles, which would lead to a bile salt activity different from the bile salt concentration and the isotherm (Eq. 6) would no longer be valid; the consequence is expected to be similar to an additional partitioning of bile salt in the central part and the effect on the d-dependence should be stronger than on the cs-dependence.
Closure
After the coalescence period, the disklike micelles close to form vesicles. Bending and closure decrease the length of the rim and are thus driven by line tension Λ. This is, however, opposed by the bending modulus κ and Gaussian modulus  of the lecithin bilayer in the central part of the disk. Closure is also resisted by electrostatic repulsion in the closing rim (Betterton and Brenner, 1999) and the need to squeeze internal solvent through an increasingly smaller opening; we neglect both these effects. The balance between line tension and rigidity depends on the size of the disk; with increasing size the energy gained by eliminating the (growing) rim increases. Closure will thus become more favorable as the disk grows and the characteristic closure time τc is expected to decrease with increasing disk size. Comparing τc to the coalescence time defines a kinetic closure criterion that allows us to calculate the disk radius r* for which closure is faster than growth. This in turn determines the radius of the formed vesicles R = r*/2. At this point the end state is reached. The low solubility of lipid precludes ripening, and fusion of vesicles is also extremely slow in the absence of edges due to the large topological barriers involved (see “Ripening”). Within our model, the vesicle size is thus determined by kinetics rather than thermodynamics.
Closure mechanism
The elastic and line energy associated with the spherical deformation of a disk of radius r at constant area can be written as a function of the shape parameter p that ranges from 0 for a planar disk to 1 for a vesicle (p is defined as the ratio between the vesicle radius and the radius of curvature of the corresponding open vesicle or bent disk) (Fromherz, 1983):
 |
(20) |
where  is the elastic energy of a (closed) vesicle and
  a “vesiculation index,” which essentially is the ratio of line energy to bending energy. Vf hence characterizes the relative stability of disks and vesicles: for 0 < Vf < 1 disks are more stable than vesicles, for Vf = 1 they coexist with Ec(0) = Ec(1), for 1 < Vf < 2 disks are metastable, and for Vf > 2 disks are unstable and can close rapidly without the need to overcome any energy barrier.
The stability of disks is controlled by the vesiculation index Vf and hence three parameters: r, Λ, and  The role of
  for vesiculation has already been the subject of several studies (Helfrich, 1986; Safran et al., 1990; Porte and Ligoure, 1995). We assume that
  is independent of the composition of the sample and thus constant, with
  (Israelachvili, 1992). (This is consistent with our approximation that the central bilayer part consists of lipids only and does not contain bile salt.) We therefore concentrate in this study on the roles of r and Λ.
Using the dependence of Λ on the rim area fraction φr of bile salt (Eq. 9), Vf can directly be related to the adsorption of edge actant:
 |
(21) |
where  is the vesiculation index of detergent-free disks. For the initial disks (r1 = 80 Å,
  and Λ0 = 0.3 kT/Å) we obtain V0 = 0.6 and an energy barrier Ec ≈ 120 kT, indicating that the initial disks are kinetically stable toward closure. Presence of bile salt on the rim will decrease Λ and thus stabilize the disks further. The initial disklike micelles are stable toward closure mainly due to their (small) size. They will, however, grow (see “Growth”) and once the disk size r reaches Vf = 2, they will spontaneously transform to vesicles (Fig. 10 b).
Although vesicles form spontaneously for Vf > 2, a thermally induced shape transformation from disks to vesicles can already occur for Vf ≥ 1, which represents a transition between two states with an activation barrier. The characteristic time τc for the transformation from disks to vesicles depends on the height of the energy barrier (Eq. 20):
 |
(22) |
where τz = 6πηr3/kT is a “Zimm time” related to the rotational relaxation time of a disk (Doi and Edwards, 1988) and thus involves viscous dissipation in the liquid surrounding the disk as it closes. This dominates dissipation within the bilayer under the present conditions (Seifert and Langer, 1993). Growth of the disklike micelles results in a drop of the energy barrier that corresponds to the energy of a transition state made of an incomplete sphere with a circular rim (Fig. 7). This leads to a very rapid decrease in closure time τc beyond a certain disk radius, which depends on cs and d. A stability diagram for disks (Fig. 13) illustrates the interplay between size r and rim area fraction φr covered by bile salt (which controls Λ); τc decreases with increasing r and decreasing φr. It also shows that the closure time τc strongly changes within a very narrow range. This is due to the drastic effect of the exponential factor, whereas the prefactor has a rather weak influence. The values of φr and in particular r for which closure occurs, thus hardly depend on the time allowed for closure, and are very robust to the details of the closure criterion.
FIGURE 13.

Stability diagram of disks toward closure to form vesicles as a function of rim area fraction φr covered by bile salt and disk radius r. Bold lines correspond to Vf = 0, 1, and 2, which delimit regions of stable, metastable, and unstable disks. Shown are also lines of constant closure time τc = 10−3 s (solid line), 1 s (dashed line), and 103 s (dotted line), respectively. Parameters: aD = 200 Å2, Λ0 = 0.3 kT/Å, and 
Growth, closure, and end-state vesicle size
Because the initial disklike micelles are stable toward closure, they first grow (see “Growth”) until their radius reaches a threshold r* and closure becomes faster than growth. While the disks grow, the total rim surface At decreases and the rim area fraction φr covered by bile salt increases and stabilizes the disks by lowering the line tension Λ (Fig. 10). Therefore, r* and hence the vesicle size R, depend on the actual value of φr(t). This results in a time-dependent threshold r*(t). The mechanism of the growth process, which determines φr(t) and hence r*(t), is thus crucial for the determination of the vesicle size and polydispersity. To our knowledge, this connection, which demonstrates the importance of kinetics for the final vesicle size (or strictly, size distribution), has not been clearly identified before.
The threshold radius r* leads to a “sink” for disks with radius r ≥ r* because they form vesicles that are inert. The feedback of the changing disk composition on r* and hence the vesicle radius R, requires a numerical solution of the Smoluchowski rate equations with a continuous update of 𝒦ij(t) and r*(t). We can nevertheless qualitatively rationalize the trend of the end-state vesicle size R as a function of salt concentration cs and dilution d (Fig. 6). For constant dilution d, electrostatic repulsion between bile salt molecules is progressively screened upon increasing cs leading to faster growth, but also a higher tendency of the bile salt to cover the rim and thus a reduced line tension Λ with a resulting increase in closure time τc. Disks will thus grow further before they close. The dramatic increase of vesicle size R over a rather narrow range of cs (Fig. 6, d = 80 and 120) corresponds to the sharp drop in line tension Λ arising from a salt-induced increase of rim coverage φr (Fig. 9). On the other hand, for constant cs, increasing the dilution has a relatively small effect on the growth time (see “Initial growth”), but τc significantly drops in response to the decrease in φr and resulting increase in Λ (Fig. 9). With increasing dilution disks will thus close earlier, and smaller vesicles will form.
For a quantitative examination, we use the two previously described limits:  (Eq. 19). Equating φr(t) to its initial value
  the underestimated rim coverage leads to an overestimation of Λ and thus favors closure resulting in an underestimated vesicle size. An underestimated rim coverage also results in an underestimated electrostatic interaction and hence in an overestimated growth rate and an overestimated vesicle size. Due to the strong dependence of τc on φr and r (Fig. 13), the effect on Λ clearly dominates. For the same reason, monodisperse growth overestimates the vesicle size, so that Rini ≤ R < Rmono. We expect the lower bound to provide a better estimate for small final vesicles, when only limited growth occurred before closure, whereas the upper bound is more appropriate for large vesicles (but even in this case represents only a hypothetical limit). In these two limits we can calculate the total growth time τG, which we approximate by τG ≈ τG(i) = (𝒦iini)−1. (Because the growth time increases with disk size (see “Growth”), a better approximation would be τG = (𝒦1ini)−1, but this is not consistent with a monodisperse growth scheme.) The growth time τG is then compared to the closure time τc. Closure is expected to occur for τG ≥ τc (the “closure criterion” discussed previously). This defines the threshold disk radius r* and thus the end-state vesicle radius R = r*/2. The rate coefficients 𝒦ij (Eq. 16) and thus the growth time τG depend on the disk size r by a power law, whereas the closure time τc is related to r by an exponential factor (Eq. 22) and thus shows a much stronger dependence on r.
In practice, to determine the threshold disk radius r* as a function of salt concentration cs and dilution d we use the following algorithm: τG and τc are calculated for ri with i incremented until the closure criterion, τG ≥ τc, is met. In the limiting case of fixed disk composition,  is constant, whereas in the limit of monodisperse growth the equations determining the composition of the disks (Eqs. 5, 6, and 7) have to be solved at each step. Before a quantitative comparison of the final vesicle size with experimental data is presented (see “Comparison with experimental data: vesicle size”), we first examine the entire kinetics and the connection between the cs- and d-dependences.
In the limit  the rim coverage is known and kept constant. This allows us to calculate all rate coefficients 𝒦ij and to solve the Smoluchowski rate equations numerically. Vesicle formation is modeled by introducing a “sink” value r* above which disks close spontaneously and are removed from the process described by Eq. 10. The temporal evolution of densities {ni(t)} can then be determined and the time evolution of the total scattering intensity I(t) as well as the contributions by disks and vesicles can be calculated. A typical example is shown in Fig. 14. The initial increase of I(t) is caused by the growth of disks, whose contribution, however, soon decreases due to the closure of large disks to form vesicles. At the same time, the contribution of vesicles increases from zero intensity until the final scattered intensity is reached when all disks have been transformed to vesicles. The time dependence of the total scattered intensity I(t) is qualitatively very similar to the measured scattering intensity (Fig. 3). Both show an inflection point at early times that is related to the interplay between the disappearance of disks and the formation of vesicles. This implies a nonexponential time dependence and suggests that the kinetics of the transition is not well described by a simple first order kinetics or half-life.
FIGURE 14.

Calculated time evolution of the total normalized scattering intensity (solid line) and the contributions of disks (dashed line) and vesicles (dotted line). Calculations are based on the approximation of constant (initial) composition, electrostatic interactions with constant potential, and closure occurring at r* = r5. The other parameters are chosen to match our experimental conditions.
Dependence on salt concentration and dilution
As previously discussed, φr is a crucial parameter, which not only affects the electrostatic interactions and thus growth and τG, but, more importantly, line tension Λ and thus τc (Eqs. 9 and 22). This suggests that any combination of cs and d that produces the same φr, not only corresponds to the same aggregate composition, but, crucially, should result in similar kinetics and thus final vesicle size R. We now derive such a relation between cs and d for the special case of large disks (and thus large vesicles).
The disk size as a function of rim coverage φr diverges for a rim coverage  (Fig. 13), which corresponds to a vanishingly small line tension Λ. For Λ = 0, Eq. 9 yields
 |
(23) |
Furthermore, in the limit of large disks, the relative total rim area density At(r)/At(r1) vanishes and almost all bile salt is in bulk (Eq. 5):
 |
(24) |
Eqs. 6 and 7 now provide the relation between  and d for combinations, which produces the same
  :
:
 |
(25) |
with  given by Eq. 23 and
 |
(26) |
Here αb = aDΛ0L/A → aDΛ0/πρ for large disks with  (Eq. 9). The dependence of
  on d is governed by βd, which in turn is controlled by the balance between the micellization energy αm and the binding energy αb (see “Mechanical properties”). If the hydrophobic nature of the molecule dominates
  then
then  and
and  On the other hand, if the edge activity dominates
  then
then  and
and  In the intermediate regime,
  shows a strong dependence on d and diverges for d = 1/β.
Fig. 15 a shows agreement of the experimental trend in  with Eq. 25, producing the fit values β = 3.91 × 10⁻³ and B = 1.98 mM (see “Comparison with experimental data: vesicle size”). Furthermore, if we use these fitted values to normalize cs by the dilution-dependent
  we expect the vesicle radius to diverge for
  so that the data sets for different dilutions should lie on top of each other for large vesicle radii, i.e., close to
  This is observed (Fig. 16 b); in fact, the data collapse extends to very low
  This suggests that the above equivalence between cs and d (Eq. 25) not only holds for large vesicles, but is more generally valid.
FIGURE 15.

(a) Salt concentration  for which the disk radius diverges as a function of dilution d. The line is a fit based on Eq. 25 and yields β = 3.91 × 10⁻³ and B = 1.98 mM. The insert shows a semilogarithmic plot of the same data. (b) Binding energy aDΛ0/πρ as a function of micellization energy αm. The line corresponds to combinations satisfying β = 3.91 × 10⁻³. (c) Line tension in the absence of bile salt, Λ0, as a function of rim area aD covered by one bile salt molecule. The line corresponds to combinations satisfying B = 1.98 mM. Combinations in the hatched area are excluded because the calculation is based on the monodisperse growth regime (see text for details). The set of parameters that fits all our data best is represented by ⊕.
FIGURE 16.

End-state vesicle radius R as a function of (a) salt concentration cs for dilutions d = 80 (○) and d = 120 (•) and (b) normalized salt concentration  for different dilutions d (▴: 40, ⋄: 50, ▪: 60, ○: 80, •: 120) with
  calculated according to Eq. 25. Lines are calculated based on the monodisperse growth (solid line) and fixed composition (dashed line) approximations, respectively, using aD = 200 Å2, αm = 10 kT, and Λ0 = 0.3 kT/Å. The lines in panel b are calculated for d = 120.
Comparison with experimental data: vesicle size
The predictions of our model are now compared to the end-state vesicle size, which we determined by light scattering for different salt concentrations cs and dilutions d (Fig. 6). The data should be bracketed by the two limits of constant composition and monodisperse growth (Eq. 19). The fact that the model predicts only bounds rather than actual values complicates the fit procedure. Fit parameters are Λ0, aD, αm, and  note that preliminary estimates for the latter two parameters were already determined by fitting our kinetic data (see “Comparison with experimental data: rate of initial growth”). Their determination is based on Eq. 25, which is used to fit the experimentally determined dependence on dilution d of the salt concentration
  for which the vesicle radius diverges (Figs. 6 and 15 a). The effect of d on
  is found to be strong and we obtain β = (3.91 ± 0.01) × 10−3 and B = (1.98 ± 0.01) mM. The value of β depends on the binding energy aDΛ0/πρ and the micellization energy αm (Eq. 26) with the solid line in Fig. 15 b indicating all combinations consistent with β = 3.91 × 10⁻³. Because the binding energy depends on aDΛ0, fits for aD and Λ0 are coupled. They can, however, be determined using B (Eq. 25), which provides a relation between aD and Λ0 (solid line in Fig. 15 c). Because Eq. 25 is only strictly valid for the limit of monodisperse growth and large vesicles, B is an upper bound and thus values above the solid line in Fig. 15 c (hatched area) have to be excluded. These arguments can only guide the determination of the fit parameters. The values were refined by considering both limiting approximations for φr(t) (fixed composition and monodisperse growth; see “Growth, closure, and end-state vesicle size”), and both limits for the electrostatic interactions (constant charge and constant potential; see “Interactions between disklike micelles”). A comparison with all our data for the end-state vesicle size and initial growth rate, yields Λ0 = 0.3 kT/Å, aD = 200 Å2, αm = 10 kT, and
  as best values (⊕ in Fig. 15, b and c). These values lead to a consistent description of all our experimental data; the limits calculated based on our model bracket most of the kinetic data on the initial growth rate (Figs. 4 and 5) and the end-state vesicle size as a function of salt concentration cs and dilution d (Fig. 16). They also lead to a good collapse of the different dilution series (see “Dependence on salt concentration and dilution”; Fig. 16 b), which is very sensitive to the choice of parameters.
These values of the fit parameters agree well with literature values and other estimates where available. The value Λ0 = 0.3 kT/Å lies in the range of values, 0.2–0.8 kT/Å, cited in the literature (see “Mechanical properties”) (Moroz and Nelson, 1997). No value of aD exists for the adsorption on a rim. However, at the (flat) air-water interface aD ≈ 150 Å2 was found (Small, 1973), whereas the size and aggregation number of pure (spherical) bile salt micelles imply aD ≲ 250 Å2 (Schurtenberger et al., 1983; Janich et al., 1998). These values thus bracket our value of aD = 200 Å2. To our knowledge, αm has not been determined. It, however, controls the monomer concentration of bile salt, which has been determined (Small, 1973; Duane, 1977). According to our model, the partitioning constant of the isotherm reads:
 |
(27) |
which depends on composition, i.e., cs and d. It provides an estimate for the order of magnitude of the monomer concentration cb = K/vDNA. For αm = 10 kT, cs = 150 mM, and 50 ≤ d ≤ 150, we obtain 0.37 ≤ cb ≤ 0.55 mM (see also Fig. 9 b). This value is comparable to the bulk bile salt concentration in solutions containing lipid-bile salt mixed micelles (∼0.5 mM, (Small, 1973; Duane, 1977)).
Ripening
Ripening of our vesicles to their equilibrium size was not observed, but might occur on a very long timescale. The observed near-indefinite lifetime of the end-state liposomes, despite the fact that they are kinetic in origin, shows that both monomeric diffusion (Ostwald ripening) (Somoza et al., 1996; Zhdanov and Kasemo, 2000; Olsson and Wennerström, 2002) and vesicle fusion or fission (Golubovic and Golubovic, 1997) are ineffective in bringing these liposomes to thermal equilibrium. The first observation is consistent with the very low solubility of lecithin and the second with our finding that, among the disklike intermediates, coalescence is edge-to-edge and not face-to-face. In contrast, relaxation to equilibrium may occur more rapidly for vesicles more prone to fusion or fission and/or formed by more soluble amphiphiles, such as some mixtures of anionic and cationic surfactants (Kaler et al., 1989; Madani and Kaler, 1990; O'Connor et al., 1997; Marques, 2000; Schmölzer et al., 2002). The ability to ripen or fuse thus plays an important role in determining whether vesicles reach equilibrium or represent kinetically trapped, metastable states of very long lifetime and may give a new physicochemical basis for their classification (Marques, 2000). Moreover, there are indications (Edwards and Almgren, 1992; Lopez et al., 2001) that a coarsening mechanism leading to partial equilibration could be mediated by coexisting mixed micelles or simple bile salt micelles, if present.
Stacking
It is possible that under certain conditions disks cannot only grow and close, but also stack. This would prevent vesicle formation and could result in the development of lamellar (smectic A) phase as the end state. Stacking is driven by the van der Waals attraction between parallel disks, which for distances of ∼20 Å dominates for high enough salt concentrations cs over electrostatic repulsion and steric effects, such as hydration and protrusion. Although this is known to stabilize lamellar phases (Israelachvili, 1992), we have to consider the particular properties of disks, especially their finite size, the effect of a displacement of their centers and a tilt of the disk normals. The interaction energy shows a well, but this is significant only for a small fraction of configurations (nearly parallel, hardly displaced or tilted disks at an optimum distance) and for disks that have grown already. Stacking is thus a rare event leading to an “entropy barrier” and a reaction-limited mechanism rather than a diffusion-controlled process, although there might be no energy barrier to overcome. The characteristic stacking time τs depends on salt concentration cs, dilution d, and disk radius r and, for negligible electrostatic interactions (i.e., high cs), is estimated to be of a similar order of magnitude as the other timescales, the growth time τG and closure time τc. Stacking could therefore represent a possible path at high salt concentrations (Fig. 7). An accurate estimate of τs is, however, needed before a meaningful kinetic criterion can be developed for stacking to occur before vesiculation, leading to a smectic end state.
CONCLUSION AND OUTLOOK
Our semiquantitative kinetic model describes the fundamental kinetic steps during vesicle formation: rapid formation of disklike intermediate micelles, growth of these micelles, and closure to form vesicles (Fig. 7). It also identifies the important control parameters (d, cs, Λ,  αm), which determine the kinetics as well as the end-state vesicle size. The vesicle size results from the competition between growth and closure and thus a kinetic criterion. The fact that our model reproduces the experimental trends (including the kinetic rates as well as the end-state size of the vesicles) indicates that liposomes in our system, despite their spontaneous formation, are nonequilibrium metastable structures with a size controlled by kinetics, not thermodynamics. This explains why calculations based on thermodynamic equilibrium (Safran et al., 1990, 1991) fail to predict the experimentally observed dependence of vesicle size on composition (Schurtenberger et al., 1985; Hjelm et al., 1990; Long et al., 1994; Egelhaaf and Schurtenberger, 1994; Kozlov and Andelman, 1996).
Our model was developed and tested for aqueous mixtures of lecithin and bile salt. In particular the very low solubility of lipid molecules and the large energy barrier toward fusion or fission are key factors that prevent any significant equilibration of the vesicles once they are formed. This is in contrast to most surfactant systems, where self-assembly is fully reversible and the entire system reaches thermodynamic equilibrium in a relatively short time. A physicochemical classification of vesicles (Marques, 2000) may thus be based on the ability of vesicles to ripen or fuse. A complete picture should, however, also include stacking of (large) disklike micelles. A comparison of growth, closure, and stacking rates is expected to provide a kinetic criterion to decide whether vesicles are formed, as we have assumed, without creation of lamellar (smectic A) phase intervening. Although we suggest that vesicles are nonequilibrium, kinetically trapped structures with a very long lifetime, the lamellar (smectic A) phase could well be the real equilibrium state of the system. The proposed model therefore suggests a possible need to reconsider the phase behavior of lipid-detergent systems in the dilute regime.
Although our model is based on lecithin-bile salt mixtures, variants of the model could perhaps be applied to other systems, in particular other lipid-detergent mixtures (Jiskoot et al., 1986; Kaler et al., 1989; Edwards and Almgren, 1991; Silvander et al., 1996; O'Connor et al., 1997; Campbell et al., 1998; Brinkmann et al., 1998; Chen et al., 1999; Marques, 2000; Ollivon et al., 2000; Almgren, 2000; Xia et al., 2002; Schmölzer et al., 2002) or lipid-peptide mixtures (Dufourc et al., 1986; Saitoh et al., 1998; Suezaki et al., 1999), which undergo a similar micelle-to-vesicle transition. Because the parameters Λ,  and αm are independently accessible for various other systems, it should be possible to predict and understand their behavior based on the model we present here; we are currently investigating this. It might also be possible to control the vesicle formation and end-state vesicle size by choosing appropriate amphiphiles or amphiphile mixtures as well as favorable solution conditions. This offers the possibility, for mankind and nature, to prepare kinetically trapped structures, which can be less sensitive to environmental changes than equilibrium ones. This might be particularly interesting for the preparation of functional vesicles with encapsulated or incorporated molecules (Lasch, 1995; Rosoff, 1996); for the reconstitution of membrane proteins (Ollivon et al., 2000); or for the creation of two-dimensional crystals of membrane proteins (Rigaud et al., 2000). These studies should profit from an improved understanding of the micelle-to-vesicle transition, in particular the evolution of intermediate structures and the parameters controlling this sequence. Although our experiments used dilution to remove detergent (bile salt) from the aggregates, it should also be applicable to other detergent removal techniques, such as dialysis, temperature jumps, or biochemical reactions (Ollivon et al., 2000). The introduction of a kinetic criterion will also permit a comparison with other experimental timescales, such as the rate of detergent removal during dialysis. The influence of these rates on the properties of the end-state vesicles (Seras-Cansell et al., 1996; Ollivon et al., 2000) could then possibly be rationalized.
Particularly striking is the strong dependence of the end-state vesicle size on NaCl concentration which, through its effect on the (charged) bile salt, modulates the kinetics although there is little bile salt left in the end-state vesicles (at least for the higher dilutions). This illustrates that the kinetic pathways that arise under physiological conditions can sometimes best be studied by applying controlled deviations from these conditions. In many applications of liposomes, as mentioned previously, a large range of solution parameters must be searched to find the best conditions to ensure the desired end-state properties. It is hoped that knowledge about the dependence of the kinetic pathway on important control parameters, such as salt concentration, may help to reduce this effort. It is also interesting that under physiological conditions and using a physiological detergent (bile salt), vesicles form on a physiologically significant timescale of minutes.
Acknowledgments
We thank F. Clement and M. Fuchs for helpful discussions.
This work was supported by grants GR/M89829 and GR/R42733 from the Engineering and Physical Sciences Research Council.
APPENDIX A
Rate of initial growth
In our simultaneous static and dynamic light scattering experiments we determined the time dependence of the total scattered intensity I(t) and average diffusion coefficient D(t) (see “Relaxation after a dilution step”). Their normalized initial slopes were converted to rates  (Eq. 1). In this appendix we quantitatively link the experimentally determined initial slopes to our model, in particular the growth time (Eq. 18) and kernel 𝒦11 of the Smoluchowski rate equations (Eq. 10).
The total scattered intensity I(t) is the sum of the individual scattered intensities of all species present, because the concentrations of our samples are low enough (below ∼1 mg/ml) to neglect interactions between aggregates. During the very early stage, we only consider contributions from the initial disklike micelles and disklike micelles created by coalescence of two initial micelles (number densities ni, radii ri, thickness ρ):
 |
(28) |
Due to the small size of the disks, the form factor Pd(q, ri) ≈ 1 for our q-range. Using the first-order expansion of the Smoluchowski rate equations (Eq. 10) at t → 0,
 |
(29) |
we obtain for the initial slope of I(t)
 |
(30) |
With  and Eq. 18, the normalized initial slope hence is
 |
(31) |
The parameter βI in Eq. 1 is thus βI = 1.
To calculate the average diffusion coefficient D(t), the individual diffusion coefficients Di have to be weighted by the corresponding scattered intensities Ii(t). We again only take the two smallest disks into account and obtain
 |
(32) |
and
 |
(33) |
using Eqs. 29 and 31 and considering that D(0) = D1. The proportionality constant βD depends on the size of the disks. For disks with radii r1 = 80 Å and r2 = 21/2r1 and thickness 2ρ = 50 Å, as observed in our experiments, we obtain βD = 0.38.
APPENDIX B
Kernels
In this appendix we estimate the rate coefficients or kernels 𝒦ij of the Smoluchowski rate equations (Eq. 10). In our system the topological barrier dominates over the dlvo interactions (see “Interactions between disklike micelles”). They represent a significant barrier to coalescence with a height of typically 10–30 kT. The system is thus reaction limited and the kernels read (Ball et al., 1987):
 |
(34) |
where fij is the attempt frequency for coalescence, ξ the distance over which coalescence can occur, Sij the reaction surface (and thus ξSij the reaction volume, Fig. 11), and Eij the potential of the transition state (the “fusion barrier”). In a reaction limited regime, the reaction (i.e., coalescence) has a very low probability and many attempts to cross the high energy barrier are required until coalescence occurs. Phase space at the transition state is hence fully explored. We can thus use a statistical approach that is based on the calculation of the partition function restricted to the conditions where disks can coalesce, i.e., the transition state portion of phase space (Hänggi et al., 1990). As will be shown below, this provides an estimate of the reaction surface Sij and a decoupling approximation for the potential of the transition state Eij. This statistical approach does, however, not consider the characteristic timescale and will therefore not provide an estimate for the attempt frequency. The attempt frequency fij depends on the motion (diffusion) of the disks and their interaction potential. It can be estimated using a deterministic approach solving the “equations of motion” (Hänggi et al., 1990), which is often rather involved, particularly for anisotropic objects with orientation-dependent interactions. In the following we will combine these two approaches to obtain an estimate of the kernel 𝒦ij and its dependence on disk radii ri and rj and solution conditions, such as salt concentration cs and dilution d.
Reaction surface and fusion barrier
We first use the statistical approach to estimate the reaction surface Sij and to investigate the role of the fusion barrier Eij. The reaction surface is essentially the surface that two disks may sample before coalescence. For a disk of radius rj, which samples all configurations at the transition state near a disk of radius ri, the reaction surface scales as Sij ∼ rj(ri + rj) (Fig. 11 b) if we assume that all configurations have the same fusion barrier. This estimate does not take into account that different regions of the reaction surface, and thus different configurations 𝒞, have to be weighted by their (different) transition energies through their Boltzmann factors. To determine the Boltzmann-weighted reaction surface Zij = Sij exp(−Eij/kT), we calculate the partition function of the system Zij restricted to the transition state configurations 𝒞:
 |
(35) |
The fusion barrier Eij(𝒞) = Et(α) + Ed,ij (hf, ϕ, α) involves the bare edge-to-edge fusion energy Et(α) and the dlvo part Ed,ij (hf, ϕ, α) (see “Interactions between disklike micelles”). The orientations, i.e., ϕ and α, are illustrated in Fig. 11 a. The dlvo part shows a weak dependence on α (through the Deryaguin approximation, Eq. 14), which we neglect here. As a result of this approximation, the dlvo and bare fusion contribution become decoupled:
 |
(36) |
 |
(37) |
The first integral is essentially the average dlvo Boltzmann factor Ωd,ij. The second integral can be written as the product of the reaction surface Sij and topological Boltzmann factor Ωt. Both depend on the angular dependence of the bare fusion barrier Et(α), which, however, only affects the prefactors. We will use:
 |
(38) |
and
 |
(39) |
Little is known about the bare fusion barrier and we thus use Ωt as a fit parameter; it is, together with further unknown parameters, included in the fit parameter 
Attempt frequency
Now the motion of the aggregates is examined to obtain an estimate of the attempt frequency fij and length ξ. This involves solving a mutual diffusion equation. For the sake of simplicity, we examine two approaching spheres, which we expect to show the same trends as two disks. The diffusion equation gives the number Nj of spheres j undergoing diffusion toward a sphere i and subsequent aggregation per unit time (Russel et al., 1991):
 |
(40) |
where Eij(h) is the interaction potential and  the reaction surface with h the surface-to-surface distance between interacting spheres. With the boundary conditions nj(h → ∞) = nj and nj(h = hf) = 0, one obtains (Hänggi et al., 1990)
 |
(41) |
To solve this equation, we have to estimate the functional form of the fusion potential Eij(h). (Note that for the statistical approach above, we only considered the height of the barrier Eij(hf).) Based on earlier considerations, it is reasonable to assume that the fusion potential is peaked around hf and large, i.e.,  (Fig. 17). The exponential in Eq. 41 thus contributes mainly around h = hf. We hence expand Eij(h) around hf:
 |
(42) |
The penetration length of the potential ℓ is defined as
 |
(43) |
using the fact that we expand Eij around the maximum of Et. This expansion reduces the dlvo potential to a driving force (−kT/ℓ). The radius of curvature of the topological potential −ξ is given by
 |
(44) |
Although the following results and conclusions depend on this expansion, the trends are general (Hänggi et al., 1990). To calculate the integral in Eq. 41, we limit the integral to the range where we expect the major contribution: hf ≤ h ≤ hF with Eij(hF) = Eij(hf) − kT (Fig. 17). Using 𝒦ij = Nj/nj and Eq. 34, we obtain
 |
(45) |
and
 |
(46) |
with erf(x) the error function and 
FIGURE 17.

Schematic representation of the interaction potential between two disklike micelles as a function of their surface separation h. The total potential E(h) (“fusion potential,” solid line) consists of the topological barrier Et (“bare fusion potential,” dotted line) and dlvo interactions Ed(h) (dashed line). Fusion typically occurs at a separation hf, while disks may fuse over a distance ξ. An expansion of E around h = hf defines a “penetration length” ℓ and a “radius of curvature” ξ.
In the absence of any interaction other than the bare fusion potential, the penetration length diverges (ℓ → ∞ and thus x → 0) and  the process is governed by diffusion across the bare fusion barrier only. However, ℓ takes finite values if further interactions are present, which might either be repulsive (x > 0) or attractive (x < 0). Depending on whether the driving force introduced by the additional potential hinders (repulsive) or aids (attractive) crossing of the bare fusion barrier, ν(x) either decreases or increases. Therefore,
  reflects the modification of the attempt frequency by the additional (dlvo) potential. If the bare fusion potential is sharply peaked at hf relative to the length scale of changes in the additional potential, i.e.,
  then ν(x) ≈ 1 and
  independent of the nature of the additional potential. We assume that this is the case.
The combination of the attempt frequency fij and distance ξ, over which coalescence can occur, with the estimates from the statistical approach for the weighted reaction surface Sij (Eq. 38) and its Boltzmann factors (Eqs. 36, 37, and 39) yields the rate coefficients 𝒦ij (Eq. 34).
References
- Almgren, M. 2000. Mixed micelles and other structures in the solubilization of bilayer lipid membranes by surfactants. Biochim. Biophys. Acta. 1508:146–163. [DOI] [PubMed] [Google Scholar]
- Almog, S., T. Kushnir, S. Nir, and D. Lichtenberg. 1986. Kinetic and structural aspects of reconstitution of phosphatidylcholine vesicles by dilution of phosphatidylcholine sodium cholate mixed micelles. Biochemistry. 25:2597–2605. [DOI] [PubMed] [Google Scholar]
- Almog, S., B. J. Litman, W. Wimley, J. Cohen, E. J. Wachtel, Y. Barenholz, A. Ben-Shaul, and D. Lichtenberg. 1990. States of aggregation and phase-transformations in mixtures of phosphatidylcholine and octyl glucoside. Biochemistry. 29:4582–4592. [DOI] [PubMed] [Google Scholar]
- Andelman, D., M. M. Kozlov, and W. Helfrich. 1994. Phase transitions between vesicles and micelles driven by competing curvatures. Europhys. Lett. 25:231–236. [Google Scholar]
- Arleth, L., R. Bauer, L. H. Ogendal, S. U. Egelhaaf, P. Schurtenberger, and J. S. Pedersen. 2003. Growth behaviour of mixed wormlike micelles: a small-angle scattering study of the lecithin-bile salt system. Langmuir. 19:4096–4104. [Google Scholar]
- Ball, R. C., D. A. Weitz, T. A. Witten, and F. Leyvraz. 1987. Universal kinetics in reaction-limited aggregation. Phys. Rev. Lett. 58:274–277. [DOI] [PubMed] [Google Scholar]
- Betterton, M., and M. Brenner. 1999. Electrostatic edge instability of lipid membranes. Phys. Rev. Lett. 82:1598–1601. [Google Scholar]
- Brinkmann, U., E. Neumann, and B. H. Robinson. 1998. Thermodynamics and kinetics of vesicle—mixed micelle transitions of sodium tridecyl-6-benzene sulfonate/sodium dodecyl sulfate surfactant systems. J. Chem. Soc. Faraday Trans. 94:1281–1285. [Google Scholar]
- Campbell, S. E., Z. Zhang, S. E. Friberg, and R. Patel. 1998. Kinetics of formation of vesicles from lecithin/sodium xylenesulfonate micelles from stopped-flow measurements. Langmuir. 14:590–594. [Google Scholar]
- Cantu, L., M. Corti, and E. Delfavero. 1997. Self-aggregation of glyco-lipids in water: vesicle to micelle transition. J. Mol. Liq. 71:151–161. [Google Scholar]
- Chen, L., H. Shen, and A. Eisenberg. 1999. Kinetics and mechanism of the rod-to-vesicle transition of block copolymer aggregates in dilute solution. J. Phys. Chem. B. 103:9488–9497. [Google Scholar]
- Chernomordik, L., M. M. Kozlov, and J. Zimmerberg. 1995. Lipids in biological membrane fusion. J. Membr. Biol. 146:1–14. [DOI] [PubMed] [Google Scholar]
- Cohen, D. E., G. M. Thurston, R. A. Chamberlin, G. B. Benedek, and M. C. Carey. 1998. Laser light scattering evidence for a common wormlike growth structure of mixed micelles in bile salt—and straight-chain detergent—phosphatidylcholine aqueous systems: relevance to the micellar structure of bile. Biochemistry. 37:14798–14814. [DOI] [PubMed] [Google Scholar]
- Cornell, B. A., J. Middlehurst, and F. Separovic. 1980. The molecular packing and stability within highly curved phospholipid bilayers. Biochim. Biophys. Acta. 598:405–410. [DOI] [PubMed] [Google Scholar]
- Danino, D., Y. Talmon, and R. Zana. 1997. Vesicle-to-micelle transformation in systems containing dimeric surfactants. J. Colloid Interface Sci. 185:84–93. [DOI] [PubMed] [Google Scholar]
- Davies, J. T. 1958a. Adsorption of long-chain ions. I. Proc. Royal Soc. London A Mat. 245:417–428. [Google Scholar]
- Davies, J. T. 1958b. Adsorption of long-chain ions. II. Proc. Royal Soc. London A Mat. 245:429–433. [Google Scholar]
- Dean, D. S., and D. Sentenac. 1997. Surface charging mechanism for electrolytic soap films. Europhys. Lett. 38:645–650. [DOI] [PubMed] [Google Scholar]
- Degovics, G., A. Latal, and K. Lohner. 2000. X-ray studies on aqueous dispersions of dipalmitoyl phosphatidylglycerol in the presence of salt. J. Appl. Crystallogr. 33:544–547. [Google Scholar]
- Diamant, H., and D. Andelman. 1996. Kinetics of surfactant adsorption at fluid-fluid interfaces. J. Phys. Chem. 100:13732–13742. [Google Scholar]
- Doi, M., and S. F. Edwards. 1988. The Theory of Polymer Dynamics. Oxford University Press, Oxford.
- Duane, W. C. 1977. Taurocholate and taurochenodeoxycholate-lecithin micelles: the equilibrium of bile salt between aqueous phase and micelles. Biochem. Biophys. Res. Commun. 74:223–229. [DOI] [PubMed] [Google Scholar]
- Dufourc, E. J., J.-F. Faucon, G. Fourche, J. Dufourcq, T. Gulik-Krzywicki, and M. Le Maire. 1986. Reversible disc-to-vesicle transition of melittin-DPPC complexes triggered by the phospholipid acyl chain melting. FEBS. 201:205–209. [Google Scholar]
- Edwards, K., and M. Almgren. 1990. Kinetics of surfactant-induced leakage and growth of unilamellar vesicles. Progr. Coll. Polym. Sci. 82:190–197. [Google Scholar]
- Edwards, K., and M. Almgren. 1991. Solubilization of lecithin vesicles by C12E8. J. Colloid Interface Sci. 147:1–21. [Google Scholar]
- Edwards, K., and M. Almgren. 1992. Surfactant-induced leakage and structural change of lecithin vesicles: effect of surfactant headgroup size. Langmuir. 8:824–832. [Google Scholar]
- Edwards, K., J. Gustafsson, M. Almgren, and G. Karlsson. 1993. Solubilization of lecithin vesicles by a cationic surfactant: intermediate structures in the vesicle-micelle transition observed by cryo-transmission electron microscopy. J. Colloid Interface Sci. 161:299–309. [Google Scholar]
- Egelhaaf, S. U., and P. Schurtenberger. 1994. Shape transformation in the lecithin-bile salt system: from cylinders to vesicles. J. Phys. Chem. 98:8560–8573. [Google Scholar]
- Egelhaaf, S. U., and P. Schurtenberger. 1999. Micelle-to-vesicle transition: a time-resolved structural study. Phys. Rev. Lett. 82:2804–2807. [Google Scholar]
- Evans, D. F., and H. Wennerström. 1994. The Colloidal Domain—Where Physics, Chemistry, Biology, and Technology Meet. VCH Publishers, NewYork.
- Fattal, D. R., D. Andelman, and A. Ben-Shaul. 1995. The vesicle-micelle transition in mixed lipid-surfactant systems: a molecular model. Langmuir. 11:1154–1161. [Google Scholar]
- Fromherz, P. 1983. Lipid-vesicle structure: size control by edge-active agents. Chem. Phys. Lett. 94:259–266. [Google Scholar]
- Gisler, T., H. Rüger, S. U. Egelhaaf, J. Tschumi, P. Schurtenberger, and J. Ricka. 1995. Mode-selective dynamic light scattering: theory vs. experimental realization. Appl. Opt. 34:3546–3553. [DOI] [PubMed] [Google Scholar]
- Goltsov, A. N., and L. I. Barsukov. 2000. Synergetics of the membrane self-assembly: a micelle-to-vesicle transition. J. Biol. Phys. 26:27–41. [DOI] [PMC free article] [PubMed] [Google Scholar]
- Golubovic, L., and M. Golubovic. 1997. Nonequilibrium size distributions of fluid membrane vesicles. Phys. Rev. E. 56:3219–3230. [Google Scholar]
- Hänggi, P., P. Talkner, and M. Borkovec. 1990. Reaction-rate theory: fifty years after Kramers. Rev. Mod. Phys. 62:251–341. [Google Scholar]
- Heerklotz, H., and J. Seelig. 2000. Titration calorimetry of surfactant-membrane partitioning and membrane solubilization. Biochim. Biophys. Acta. 1508:69–85. [DOI] [PubMed] [Google Scholar]
- Helfrich, W. 1986. Size distribution of vesicles—the role of the effective rigidity of membranes. J. Phys. Paris. 47:321–329. [Google Scholar]
- Hjelm, R. P., M. H. Alkan, and P. Thiyagarajan. 1990. Small-angle neutron scattering studies of mixed bile salt-lecithin colloids. Mol. Cryst. Liq. Cryst. 180A:155–164. [Google Scholar]
- Huang, C., and J. T. Mason. 1978. Geometric packing constraints in egg phosphatidylcholine vesicles. Proc. Natl. Acad. Sci. USA. 75:308–310. [DOI] [PMC free article] [PubMed] [Google Scholar]
- Hyde, S. T., S. Andersson, Z. Blum, S. Lidin, K. Larsson, T. Landh, and B. W. Ninham. 1997. The Language of Shape—The Role of Curvature in Condensed Matter: Physics, Chemistry and Biology. Elsevier, Amsterdam.
- Israelachvili, J. 1992. Intermolecular and Surface Forces. Academic Press, San Diego.
- Janich, M., J. Lange, H. Graener, and R. Neubert. 1998. Extended light scattering investigations on dihydroxy bile salt micelles in low-salt aqueous solutions. J. Phys. Chem. B. 102:5957–5962. [Google Scholar]
- Jiskoot, W., T. Teerlink, E. C. Beuvery, and J. A. Crommelin. 1986. Preparation of liposomes via detergent removal from mixed micelles by dilution. Pharma. Weekblad Sci. 8:259–265. [DOI] [PubMed] [Google Scholar]
- Kaler, E. W., A. K. Murthy, B. E. Rodriguez, and J. A. N. Zasadzinski. 1989. Spontaneous vesicle formation in aqueous mixtures of single-tailed surfactants. Science. 245:1371–1374. [DOI] [PubMed] [Google Scholar]
- Koppel, D. E. 1972. Analysis of macromolecular polydispersity in intensity correlation spectroscopy: the method of cumulants. J. Chem. Phys. 57:4814–4820. [Google Scholar]
- Kozlov, M. M., and D. Andelman. 1996. Theory and phenomenology of mixed amphiphilic aggregates. Curr. Opin. Coll. Int. Sci. 1:362–366. [Google Scholar]
- Kozlov, M. M., D. Lichtenberg, and D. Andelman. 1997. Shape of phospholipid/surfactant mixed micelles: cylinders or disks? Theoretical analysis. J. Phys. Chem. B. 101:6600–6606. [Google Scholar]
- Kozlovsky, Y., and M. M. Kozlov. 2002. Stalk model of membrane fusion: solution of energy crisis. Biophys. J. 82:882–895. [DOI] [PMC free article] [PubMed] [Google Scholar]
- Lasch, J. 1995. Interaction of detergents with lipid vesicles. Biochim. Biophys. Acta. 1241:269–292. [DOI] [PubMed] [Google Scholar]
- Lasic, D. D. 1982. A molecular model for vesicle formation. Biochim. Biophys. Acta. 692:501–502. [DOI] [PubMed] [Google Scholar]
- Lasic, D. D. 1987. A general model of vesicles formation. J. Theor. Biol. 124:35–41. [Google Scholar]
- Lasic, D. D. 1988. The mechanism of vesicle formation. Biochem. J. 256:1–11. [DOI] [PMC free article] [PubMed] [Google Scholar]
- Lasic, D. D. 1991. Formation of membranes. Nature. 351:613. [DOI] [PubMed] [Google Scholar]
- Lasic, D. D. 1993. Liposomes: From Physics to Applications. Elsevier, Amsterdam.
- Lasic, D. D. 1997. Liposomes in Gene Delivery. CRC Press, Boca Raton.
- Lasic, D. D., and Y. Barenholz. (eds.). 1996. Handbook of Nonmedical Applications of Liposomes, Vol. 1–4. CRC Press, Boca Raton.
- Lee, J., and B. R. Lentz. 1997. Evolution of lipidic structures during model membrane fusion and the relation of this process to cell membrane fusion. Biochemistry. 36:6251–6259. [DOI] [PubMed] [Google Scholar]
- Lee, J., and B. R. Lentz. 1998. Secretory and viral fusion may share mehanistic events with fusion between curved lipid bilayers. Proc. Natl. Acad. Sci. USA. 95:9274–9279. [DOI] [PMC free article] [PubMed] [Google Scholar]
- Leikin, S. L., M. M. Kozlov, L. V. Chernomordik, V. S. Markin, and Y. A. Chizmadzhev. 1987. Membrane fusion: overcoming the hydration barrier and local restructuring. J. Theor. Biol. 129:411–425. [DOI] [PubMed] [Google Scholar]
- Leng, J., S. U. Egelhaaf, and M. E. Cates. 2002. Kinetic pathway of spontaneous vesicle formation. Europhys. Lett. 59:311–317. [Google Scholar]
- Lentz, B. R. 1994. Polymer-induced membrane-fusion—potential mechanism and relation to cell-fusion events. Chem. Phys. Lipids. 73:91–106. [DOI] [PubMed] [Google Scholar]
- Lichtenberg, D. 1995. Liposomes as a model for solubilization and reconstitution of membranes. In Handbook of Nonmedical Applications of Liposomes—Models for Biological Phenomena, Vol. 2. D. D. Lasic and Y. Barenholz, editors. CRC Press, Boca Raton. 199–218.
- Lin, Z., R. M. Hill, H. T. Davis, L. E. Scriven, and Y. Talmon. 1994. Cryo transmission electron microscopy study of vesicles and micelles in siloxane surfactant aqueous solutions. Langmuir. 10:1008–1011. [Google Scholar]
- Lipowsky, R. 1991. The conformation of membranes. Nature. 349:475–481. [DOI] [PubMed] [Google Scholar]
- Long, M. A., E. W. Kaler, and S. P. Lee. 1994. Structural characterization of the micelle-vesicle transition in lecithin-bile salt solutions. Biophys. J. 67:1733–1742. [DOI] [PMC free article] [PubMed] [Google Scholar]
- Lopez, O., M. Cocera, L. Coderch, J. L. Parra, L. Barsukov, and A. de la Maza. 2001. Octyl glucoside-mediated solubilization and reconstitution of liposomes: structural and kinetic aspects. J. Phys. Chem. B. 105:9879–9886. [Google Scholar]
- Luk, A. S., E. W. Kaler, and S. P. Lee. 1997. Structural mechanisms of bile salt-induced growth of small unilamellar cholesterol-lecithin vesicles. Biochemistry. 36:5633–5644. [DOI] [PubMed] [Google Scholar]
- Madani, H., and E. W. Kaler. 1990. Aging and stability of vesicular dispersions. Langmuir. 6:125–132. [Google Scholar]
- Markin, V. S., and J. P. Albanesi. 2002. Membrane fusion: stalk model revisited. Biophys. J. 82:693–712. [DOI] [PMC free article] [PubMed] [Google Scholar]
- Marques, E. F. 2000. Size and stability of catanionic vesicles: effects of formation path, sonication, and aging. Langmuir. 16:4798–4807. [Google Scholar]
- Matsuoka, H., J. P. Kratohvil, and N. Ise. 1987. Small-angle x-ray scattering from solutions of bile salts: sodium taurodeoxycholate in aqueous electrolyte solutions. J. Colloid Interface Sci. 118:387–396. [Google Scholar]
- Meyuhas, D., A. Bor, I. Pinchuk, A. Kaplun, Y. Talmon, M. M. Kozlov, and D. Lichtenberg. 1997. Effect of ionic strength on the self-assembly in mixtures of phosphatidylcholine and sodium cholate. J. Colloid Interface Sci. 188:351–362. [Google Scholar]
- Moroz, J. D., and P. Nelson. 1997. Dynamically stabilized pores in bilayer membranes. Biophys. J. 72:2211–2216. [DOI] [PMC free article] [PubMed] [Google Scholar]
- Oberdisse, J., C. Couve, J. Appell, J. F. Berret, C. Ligoure, and G. Porte. 1996. Vesicles and onions from charged surfactant bilayers: a neutron scattering study. Langmuir. 12:1212–1218. [Google Scholar]
- O'Connor, A. J., T. A. Hatton, and A. Bose. 1997. Dynamics of micelle-vesicle transitions in aqueous anionic/cationic surfactant mixtures. Langmuir. 13:6931–6940. [Google Scholar]
- Ollivon, M., S. Lesieur, C. Grabielle-Madelmont, and M. Paternostre. 2000. Vesicle reconstitution from lipid-detergent mixed micelles. Biochim. Biophys. Acta. 1508:34–50. [DOI] [PubMed] [Google Scholar]
- Olsson, U., and H. Wennerström. 2002. On the ripening of vesicle dispersions. J. Phys. Chem. B. 106:5135–5138. [Google Scholar]
- Pedersen, J. S., S. U. Egelhaaf, and P. Schurtenberger. 1995. Formation of polymer-like mixed micelles and vesicles in lecithin-bile salt solutions—a small-angle neutron scattering study. J. Phys. Chem. 99:1299–1305. [Google Scholar]
- Porte, G., and C. Ligoure. 1995. Mixed amphiphilic bilayers: bending elasticity and formation of vesicles. J. Chem. Phys. 102:4290–4298. [Google Scholar]
- Rigaud, J.-L., M. Chami, O. Lambert, D. Levy, and J.-L. Ranck. 2000. Use of detergents in two-dimensional crystallization of membrane proteins. Biochim. Biophys. Acta. 1508:112–128. [DOI] [PubMed] [Google Scholar]
- Rosoff, M. 1996. Vesicles. M. Rosoff, editor. Marcel Dekker, New York.
- Roth, Y., E. Opatowski, D. Lichtenberg, and M. M. Kozlov. 2000. Phase behaviour of dilute aqueous solutions of lipid-surfactant mixtures: effects of finite size of micelles. Langmuir. 16:2052–2061. [Google Scholar]
- Russel, W. B., D. A. Saville, and W. R. Schowalter. 1991. Colloidal Dispersions. Cambridge University Press, Cambridge.
- Safran, S. A., P. Pincus, and D. Andelmann. 1990. Theory of spontaneous vesicle formation in surfactant mixtures. Science. 248:354–356. [DOI] [PubMed] [Google Scholar]
- Safran, S. A., P. A. Pincus, D. Andelman, and F. C. MacKintosh. 1991. Stability and phase behavior of mixed surfactant vesicles. Phys. Rev. A. 43:1071–1078. [DOI] [PubMed] [Google Scholar]
- Saitoh, A., K. Takiguchi, Y. Tanaka, and H. Hotani. 1998. Opening-up of liposomal membranes by talin. Proc. Natl. Acad. Sci. USA. 95:1026–1031. [DOI] [PMC free article] [PubMed] [Google Scholar]
- Schmölzer, S., D. Gräbner, M. Gradzielski, and T. Narayanan. 2002. Millisecond-range time-resolved small-angle x-ray scattering studies of micellar transformations. Phys. Rev. Lett. 88:258301. [DOI] [PubMed] [Google Scholar]
- Schönfelder, E., and H. Hoffmann. 1994. From vesicles to micelles. Ber. Bunsenges. Phys. Chem. 98:842–852. [Google Scholar]
- Schubert, R. 1992. Gallensalz - Lipid - Wechselwirkungen in Liposomen und Mischmizellen, Habilitationsschrift. Universität Tübingen, Tübingen.
- Schurtenberger, P., N. Mazer, and W. Känzig. 1983. Static and dynamic light scattering studies of micellar growth and interactions in bile-salt solutions. J. Phys. Chem. 87:308–315. [Google Scholar]
- Schurtenberger, P., N. Mazer, and W. Känzig. 1985. Micelle to vesicle transition in aqueous solution of bile salt and lecithin. J. Phys. Chem. 89:1042–1049. [Google Scholar]
- Seifert, U., and S. A. Langer. 1993. Viscous modes of fluid bilayer-membranes. Europhys. Lett. 23:71–76. [Google Scholar]
- Seras-Cansell, M., M. Ollivon, and S. Lesieur. 1996. Generation of non-ionic monoalkyl amphiphile-cholesterol vesicles: evidence of membrane impermeability to octyl glucoside. STP Pharma Sci. 6:12–20. [Google Scholar]
- Siegel, D. P. 1993. Energetics of intermediates in membrane fusion: comparison of stalk and inverted micellar mechanisms. Biophys. J. 65:2124–2140. [DOI] [PMC free article] [PubMed] [Google Scholar]
- Silvander, M., G. Karlsson, and K. Edwards. 1996. Vesicle solubilization by alkyl sulfate surfactants: a cryo-TEM study of the vesicle to micelle transition. J. Colloid Interface Sci. 179:104–113. [Google Scholar]
- Small, D. M. 1967. Phase equilibria and structure of dry and hydrated egg lecithin. J. Lipid Res. 8:551–557. [PubMed] [Google Scholar]
- Small, D. M. 1973. The physical chemistry of cholanic acids. In The Bile Acids—Chemistry, Physiology, and Metabolism, Vol. 1. P. P. Nair and D. Kritchevsky, editors. Plenum Press, New York. 249–357.
- Small, D. M., S. A. Penkett, and D. Chapman. 1969. Studies on simple and mixed bile salt micelles by nuclear magnetic resonance spectroscopy. Biochim. Biophys. Acta. 176:178–189. [DOI] [PubMed] [Google Scholar]
- Somoza, A. M., U. M. B. Marconi, and P. Tarazona. 1996. Growth in systems of vesicles and membranes. Phys. Rev. E. 53:5123–5129. [DOI] [PubMed] [Google Scholar]
- Suezaki, Y., H. Ichinose, K. Takiguchi, and H. Hotani. 1999. A statistical mechanical theory for the adsoption of protein to liposomal membranes. Biophys. Chem. 80:119–128. [DOI] [PubMed] [Google Scholar]
- Tanford, C. 1980. The Hydrophobic Effect. Wiley Interscience, New York.
- Telgmann, T., and U. Kaatze. 1997. On the kinetics of the formation of small micelles. 2. Extension of the model of stepwise association. J. Phys. Chem. B. 101:7766–7772. [Google Scholar]
- Thompson, T. E. 1990. Phosphatidylcholine vesicles: structure and formation. Hepatology. 12:51S–55S. [PubMed] [Google Scholar]
- Tsao, H.-K., and Y.-J. Sheng. 2001. The electrostatic interaction of a charged particle with a surface: the effect of surface rearrangement. J. Colloid Interface Sci. 233:124–130. [DOI] [PubMed] [Google Scholar]
- Walter, A., P. K. Vinson, A. Kaplun, and Y. Talmon. 1991. Intermediate structures in the cholate-phosphatidylcholine vesicle-micelle transition. Biophys. J. 60:1315–1325. [DOI] [PMC free article] [PubMed] [Google Scholar]
- White, L. R. 1983. On the Deryaguin approximation for the interaction of macrobodies. J. Colloid Interface Sci. 95:286–288. [Google Scholar]
- Xia, Y., I. Goldmints, P. W. Johnson, T. A. Hatton, and A. Bose. 2002. Temporal evolution of microstructures in aqueous CTAB/SOS and CTAB/HDBS solutions. Langmuir. 18:3822–3828. [Google Scholar]
- Yamamoto, S., Y. Maruyama, and S. Hyodo. 2002. Dissipative particle dynamics study of spontaneous vesicle formation of amphiphilic molecules. J. Chem. Phys. 116:5842–5849. [Google Scholar]
- Yaminsky, V. V., B. W. Ninham, H. K. Christenson, and R. M. Pashley. 1996. Adsorption forces between hydrophobic monolayers. Langmuir. 12:1936–1943. [Google Scholar]
- Zhdanov, V. P., and B. Kasemo. 2000. Lipid-diffusion-limited kinetics of vesicle growth. Langmuir. 16:7352–7354. [Google Scholar]