

Abstract
While biological membrane fusion is classically defined as the leak-free merger of membranes and contents, leakage is a finding in both experimental and theoretical studies. The fusion stages, if any, that allow membrane permeation are uncharted. In this study we monitored membrane ionic permeability at early stages of fusion mediated by the fusogenic protein influenza hemagglutinin (HA). HAb2 cells, expressing HA on their plasma membrane, fused with human red blood cells, cultured liver cells PLC/PRF/5, or planar phospholipid bilayer membranes. With a probability that depended upon the target membrane, an increase of the electrical conductance of the fusing membranes (leakage) by up to several nS was generally detected. This leakage was recorded at the initial stages of fusion, when fusion pores formed. This leakage usually accompanied the “flickering” stage of the early fusion pore development. As the pore widened, the leakage reduced; concomitantly, the lipid exchange between the fusing membranes accelerated. We conclude that during fusion pore formation, HA locally and temporarily increases the permeability of fusing membranes. Subsequent rearrangement in the fusion complex leads to the resealing of the leaky membranes and enlargement of the pore.
INTRODUCTION
Influenza hemagglutinin (HA) is one of the best-characterized biological fusogenic proteins (White, 1996). At the initial stage of fusion, HA trimers interact, forming a fusion complex (Danieli et al., 1996; Blumenthal et al., 1996; Chernomordik et al., 1999). Within this complex, bilayers of the fusing membranes rearrange to form a fusion pore. The fusion pore, a narrow conductive pathway, is a common intermediate of cellular membrane fusion. The fusion pore developing in various situations (e.g., virus-induced fusion, fusion of secretory granules, or other intracellular vesicles) has been characterized morphologically (Palade, 1975; Chandler and Heuser, 1980; Curran et al., 1993; Frolov et al., 2000). The developed pore is essentially a membrane tubule connecting two fusing compartments. The wall of a developed fusion pore is likely lipidic and therefore not leaky (Curran et al., 1993; Lindau and Almers, 1995; Chernomordik et al., 1995; Frolov et al., 2000; Takahashi et al., 2002). However, before the fusion pore is formed, rearrangements of the fusing membranes require transient formation of nonbilayer structures that may be leaky. Indeed, in some model systems quite considerable leakage of the contents of compartments fused by HA has been reported. For example, leakage of encapsulated molecules with MW of up to 10,000 Da occurs during fusion of liposomes with influenza virus (Shangguan et al., 1996). Bromelain-released ectodomain of HA forms pores in liposomal membranes (Jiricek et al., 1997). Intact influenza virus (Wharton et al., 1986; Niles et al., 1990) and the short fusion peptide of HA (Han and Tamm, 2000) induce hemolysis of erythrocytes. Finally, HA fragments produce leaks in model membranes, and the membrane-perturbing and fusion-producing activities of these fragments appeared to correlate (Tsurudome et al., 1992; Colotto and Epand, 1997). However direct relations between 1), the content leakage averaged over big populations of fusion events, and 2), the local membrane rearrangements related to a fusion pore formation are questionable. Moreover, in other experimental systems, sensitive electrophysiological recording demonstrate tight fusion (Spruce et al., 1991; Tse et al., 1993).
To explain nonleaky fusion, the membrane rearrangements leading to pore formation are thought to be located within the fusion complex. Two different classes of structures of the fusion complex are proposed. Spruce et al. (1989) suggest the formation of a proteinaceous canal (made of HA trimers) connecting two membranes akin to a gap-junction channel. The alternative stalk-pore hypothesis postulates a step-by-step membrane reorganization involving nonbilayer lipid structures (Markin et al., 1984; Monck and Fernandez, 1992; Chernomordik et al., 1995; Kuzmin et al., 2001; Kozlovsky and Kozlov, 2002; Markin and Albanesi, 2002). According to either of these hypotheses, HA-induced fusion should be generally “tight,” i.e., protected from any leakage of viral contents into the extracellular space.
Leaks can appear as minor side effects of protein-lipid interaction or be a consequence of instability of fusion aggregates at later stages of fusion. Yet some theoretical schemes do consider leakage as an essential part of the fusion pathway, starting with general concerns on potential transient leakage during the formation of the fusion complex, when HA interacts with two membranes and perturbs them (Bonnafous and Stegmann, 2000). Most recently, a series of Monte Carlo simulations of diblock polymers in a polymer solvent have shown a new pathway for membrane fusion that would map to leakage. These simulations revealed formation of transient pores in fusing membranes in the vicinity of the initial contact site (the stalk) (Mueller et al., 2002). Moreover, according to this model, fusion pore development requires these transient pores at early stages, and thus a temporal increase of membrane permeability is predicted to be a generic feature of membrane fusion. Similar results were obtained using a different simulation algorithm by Noguchi and Takasu (2001, 2002).
To study experimentally the relationship between leakage and evolution of a single fusion pore, we applied time-resolved electrophysiological techniques allowing single pore detection during HA-mediated fusion. Three different experimental systems involving cells expressing HA were used. In each system, we performed correlated measurements of the conductance of the fusion pore and the conductances of the fusing membranes. The tightness of a number of single fusion events was determined as electrical conductivity of the barrier between the inner space of the fusing compartment and external medium. The data obtained consistently indicated that leakage during fusion pore formation is common.
MATERIALS AND METHODS
Cells
NIH 3T3 HAb2 cells (expressing A/Japan/305/57 HA on their plasma membranes) and cultured liver cells PLC/PRF/5 were grown as described earlier (Frolov et al., 1995). Human red blood cells (RBC) were freshly isolated from whole blood. NIH 3T3 HAb2 cells were fused with RBC, PLC/PRF/5 cells, or planar bilayer lipid membranes (BLM). In all systems, a target membrane was first allowed to attach to an HAb2 cell, and then fusion was triggered by acidification of the extracellular medium (Chernomordik et al., 1998).
Detection of fusion-related changes of membrane permeability
Fig. 1 outlines the general idea of the experiments and shows equivalent electrical circuits of the experimental systems used. DC-conductance (Gdc) is experimentally measured between points in and out under voltage-clamp conditions. Before fusion, the circuit consists of the membrane resistance of one of the fusion partners (Rm1 or Rm2) and the access resistance of the pipette (Ra1 or Ra2) (black elements). After fusion, the equivalent circuit combines membrane resistances of both fusion partners and of the fusion pore resistance (Rp) (red and black elements). Access resistance (Ra) is considerably smaller than membrane resistance; therefore before fusion, Gdc corresponds to the membrane conductance Gm of one of the two fusion partners (Gm = 1/Rm). Fig. 1 A relates to the HAb2/RBC and HAb2/BLM systems, and Fig. 1 B, to the HAb2/PLC system. Depending on the experimental system employed, estimates of fusion-related changes of Gm1 and Gm2 can be made based on the time-course of Gdc and fusion pore conductance. Increase in Gm1 or Gm2 is referred to as leakage. The details of the determination of membrane leakage for each experimental system are given in the appropriate sections.
FIGURE 1.
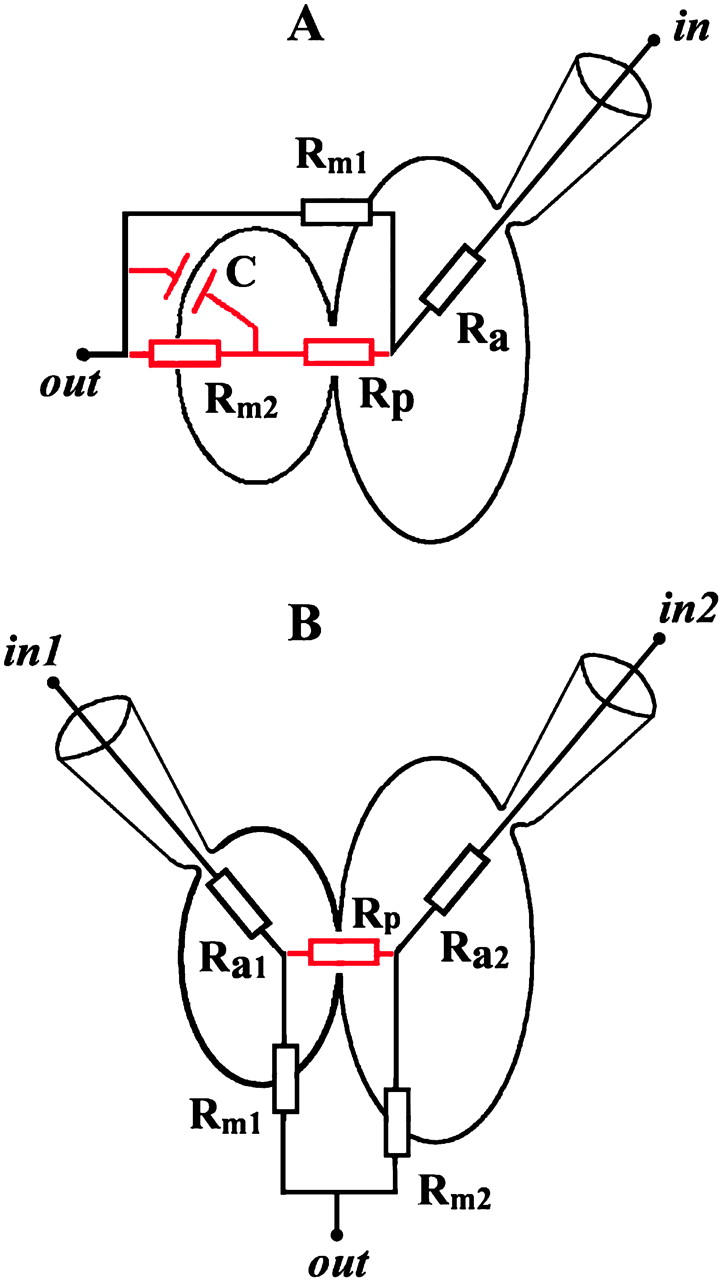
Equivalent electrical circuits of the experimental systems used. (A) HAb2/RBC and HAb2/BLM systems. (B) HAb2/PLC system. Gdc is measured between points in and out under voltage-clamp conditions. In A, in designates the interior of HAb2 cell for the HAb2/RBC system or trans compartment of the BLM chamber (Melikyan et al., 1995) for the HAb2/BLM system. In B, in1 and in2 designate the interiors of HAb2 and PLC cells. In A and B, out is extracellular medium. Before fusion, circuit consists of membrane resistance (Rm1 or Rm2) and access resistance (Ra1 or Ra2) (black elements). After fusion, the equivalent circuit combines membrane resistances of both fusion partners and of the fusion pore resistance (Rp) (red and black elements).
Measurements of leakage in the HAb2/RBC system
The HAb2/RBC pair was selected and whole-cell configuration on the HAb2 cell was established as described previously (Frolov et al., 2000; Chernomordik et al., 1998). Fusion was triggered by lowering the pH of the bathing solution to ∼4.9. Subsequent changes of electrical admittance and DC-conductance (Gdc) between the interior of the HAb2 cell and the external media (between points in and out in the equivalent circuit, Fig. 1 A) were recorded. Briefly, three 30-mV peak-to-peak sinewaves (250, 500, and 750 Hz) were applied to a patched cell, together with a constant holding voltage of 30 mV. Sinewaves were applied for 4 ms, and the circuit parameters were recalculated during the next 12 ms, giving a time resolution of 16 ms, with ∼50 pS (AC) and ∼20 pS (DC) background noise level in the whole-cell mode. The admittance changes and DC-conductance were recalculated on-line using in-house software (“Browse,” available upon request) based on the Neher-Marty algorithm (Neher and Marty, 1982). Fusion pore conductance and membrane leakage were recalculated off-line using the procedures detailed below.
Since in this system Gm1,m2 ≪ Ga (Ga = 1/Ra, Fig. 1) and Cm2 ≪ Cm1, upon electrical compensation of the initial admittance and subtraction of the initial membrane conductance of the HAb2 cell, changes of admittance and Gdc can be calculated according to Eq. 1, using the equivalent circuit shown in Fig. 1 A (Neher and Marty, 1982; Lindau, 1991). In this case indices “m1” and “m2” stand for “HAb2” and “RBC,” respectively, and C corresponds to the RBC membrane capacitance:
 |
(1) |
Here Gp is pore conductance (Gp = 1/Rp, Fig. 1), and ω is the angular frequency of an applied sinewave. Before the pore opening (Gp = 0), Gdc corresponds to the HAb2 membrane conductance. Upon completion of fusion, CRBC is determined from ΔIm. Equation 1 then transforms into Eq. 1a), from which GHAb2, GRBC, and Gp can be calculated:
 |
(1a) |
At the initial stages of fusion, the following conditions (Eq. 2), are applicable (Lindau, 1991),
 |
(2) |
which allow our simplifying Eq. 1 into Eq. 2a and Eq. 2b,
 |
(2a) |
 |
(2b) |
Simultaneously with the electrical recordings, redistribution of a fluorescent probe (PKH26, Sigma) from an RBC to HAb2 membrane was monitored, as described in Chernomordik et al. (1998). To minimize the effect of extracellular acidification on cell membrane conductance, small ions in the extracellular solution (sodium, potassium, and chloride) were replaced by relatively large organic ions n-methyl-glucamine and glutamate (Tse et al., 1993; Chernomordik et al., 1998).
Measurements of leakage in the HAb2/BLM system
This system was initially designed by Melikyan et al. (1995). We used their experimental protocol with slight modifications. Briefly, solvent-free horizontal BLM were made by the painting method from a solution of phospholipids in squalene. A diphytanoylphosphatidylcholine / diphosphatidylethanolamine (DPhPC/DPhPE 2:1) mixture and pure DPhPC were used. BLM contained 5 mol % of ganglioside GD1a, the receptor for the HA strain expressed on HAb2 cells. A suspension of HAb2 cells was added so that 1–2 cells adsorbed to the BLM. The temperature in all experiments was 37°C. Fusion was triggered by low-pH application and changes in the admittance and Gdc of BLM were measured by conventional technique (Melikyan et al., 1995). For admittance measurements three 30-mV peak-to-peak sinewaves (100, 200, and 500 Hz) were applied. Only those records in which final jump in ΔIm was comparable with mean capacitance of a single HAb2 plasma membrane were taken into account.
The equivalent electrical circuit of the HAb2/BLM system is shown in Fig. 1 A. In this case indices “m1” and “m2” stand for “BLM” and “HAb2,” respectively, and C corresponds to the HAb2 membrane capacitance. Gp and membrane conductances can be calculated using formulae analogous to Eq. 1a:
 |
(3) |
At the beginning of fusion, when Gp and GHAb2 are much smaller than ωCHAb2 (tens of nanoseconds), it follows from Eq. 3 that
 |
(4a) |
 |
(4b) |
To estimate leakage, Eqs. 3 or 4 were used, depending on the fusion pattern.
Measurements of leakage in the HAb2/PLC system
As we showed earlier (Frolov et al., 1995), PLC cells fuse with HAb2 cells at a rate similar to that of the RBC-HAb2 fusion. To monitor the fusion pore formation between PLC and HAb2 cells, the experimental protocol known as the “double whole-cell” recording procedure was used (Neyton and Trautmann, 1985). Equivalent circuit of the HAb2/PLC cell system is shown in Fig. 1 B. After whole-cell configuration was achieved for both cells of a pair, holding voltage, V1 and V2, was set at the same level on cell 1 and cell 2, respectively (typically, V1 = V2 = 0 mV). Test voltage pulses, ΔV1 and ΔV2, were alternatively applied to the cells, while the voltage on the nonstepped cell was kept at the constant holding value (see Fig. 5 A). Test pulses were applied at a frequency of ∼5 Hz, pulse amplitudes were 10–70 mV, and their duration was 50–70 ms. Current I2 recorded in cell 2 during the test pulse ΔV1 corresponded to the current (Ip) through the fusion pore, and current I1, simultaneously recorded in cell 1, represented the sum of the pore current and the current flowing through the membrane of cell 1 (Ip + Im1). Similarly, when the test pulse ΔV2 was applied to cell 2, the current through the pore was recorded on cell 1, and the current recorded on cell 2 was the sum of pore current and leakage, (Ip + Im2). Fusion pore and cell membrane (leakage) conductances were calculated using the formulae Gp = I2/ΔV1 = I1/Δ V2; Gm1,2 = (I1,2 − I2,1)/ΔV1,2. When Gm1,2 is much less than Ga, these formulae provide good accuracy for conductance estimates. Acquisition frame of 100 ms consisted of two parts: during the first 50 ms, Gp and Gm1 were measured; during the next 50 ms, Gp and Gm2 were measured; thus each point on the curve Gm1,m2,p(t) corresponds to one frame.
FIGURE 5.
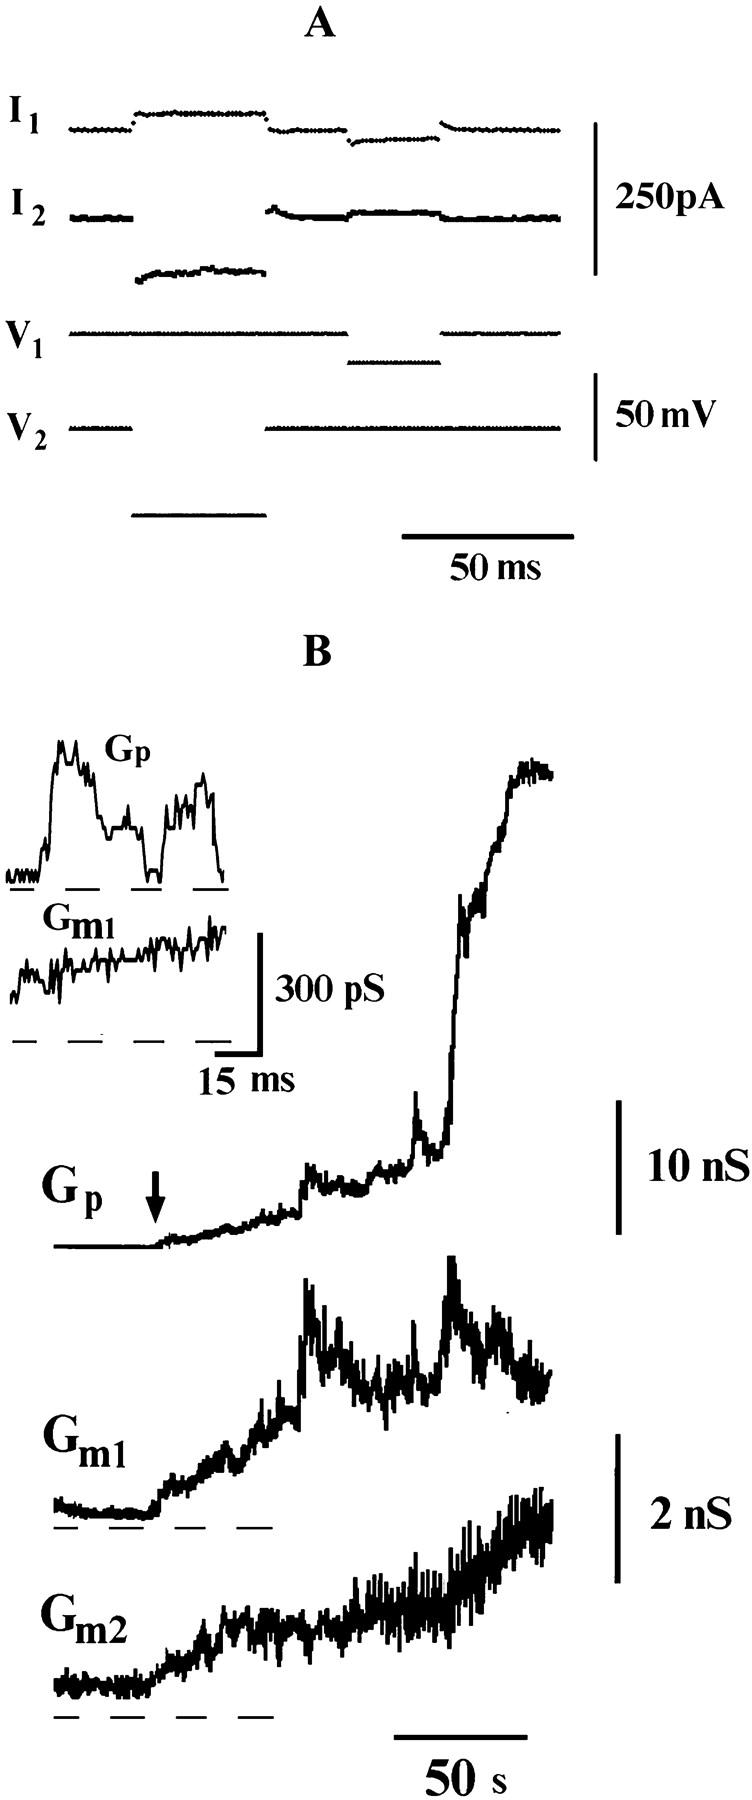
Fusion between HAb2 and PLC cells. (A) Traces illustrating the voltage-pulse protocol (see Materials and Methods). (B) Gm1 and Gm2 correspond to the DC conductance of fusing membranes, Gp to the intercellular conductance; the record begins 90 s after pH application. Insert shows the first opening of the fusion pore (the moment is marked by arrow).
RESULTS
Leakage during fusion of HAb2 cells with RBC
Depending on the temperature, HAb2/RBC fusion proceeds in either a fast or a slow mode (Chernomordik et al., 1998). Both modes were employed in this study. The first group of recordings was obtained at 33°C. At this temperature fusion was detected in 12 out of 14 trials (Table 1); fusion pores opened 23 ± 16s (mean ± SD, n = 12) after the low-pH application. In nine cases when fusion was complete (ΔIm reached plateau, corresponding to the RBC membrane capacitance) the fusion pore conductance reached 10 nS within 2–80 s after its initial opening.
TABLE 1.
Occurrence of leakage and flicker in different cell systems
| Model system | T, °C | Number of experiments | Number of experiments where fusion was detected (complete fusions* + noncomplete fusions) | Number of experiments with flicker† (among those with leakage) | Incidence of leakage: number of experiments with leakage/number of fusions | Number of leakages resealed |
|---|---|---|---|---|---|---|
| HAb2/RBC | 33 | 14 | 12 (9 + 3) | 4 (4) | 7/12 | 7 |
| HAb2/RBC | 22 | 17 | 12 (0 + 12) | 10 (10) | 10/12 | 6 |
| HAb2/BLM | 37 | 15 | 12 (12 + 0) | 12 (10) | 10/12 | 2‡ |
| HAb2/PLC | 22 | 27 | 11 (8 + 3) | 9 (8) | 8/11 | 7 |
| Total | 73 | 47 (29 + 18) | 35 (32) | 35/47 | 22 |
ΔIm reached plateau (HAb2/RBC and HAb2/BLM) or Gp reached 20 nS (HAb2/PLC).
Fusion pore closed completely at least once.
After the completion of fusion Gdc < 4 nS.
The second group of recordings was performed at 20°C. Fusion was observed in 12 out of 17 experiments (Table 1); pores of this group opened 162 ± 65 s (n = 12) after fusion triggering. These pores either failed to enlarge or enlarged slowly, attaining the conductance of 0.29–3 nS within 200 s after the opening (n = 12). ΔIm in these experiments did not reach plateau during the records performed for 300 s.
At 33°C, the initial opening of the fusion pore (typical recording, Fig. 2) coincided with the increase and fluctuations of Gdc (shown by arrow in Fig. 2 A). The initial pore conductance varied between 80 and 690 pS. In four out of 12 trials the initial pore opening was followed by flickering seen as synchronous fluctuations of admittance and Gdc (25–35 s in Fig. 2 A, expanded fragment, in Fig. 2 B). After fusion is complete (ΔIm reaches steady state), the conductance of the fusion pore and the cell membranes can be calculated using Eq. 1a. The conductance of the fusion pore fluctuated soon after its first opening (flickering; e.g., Fig. 2 D calculated on data of Fig. 2 A). Membrane conductance could be calculated accurately only when the pore was open for a sufficiently long time. In this example, during the pore flicker, GRBC is ∼0.8 nS, and GHAb2 is ∼0.4 nS. As the pore widened, GRBC first increased to ∼1 nS and then decreased to 0.3 nS (e.g., Fig. 2 C). As GRBC started decreasing, the lipid dye transfer became detectable (fluorescence curve, Fl; Fig. 2 C). GHAb2 remained stable at all stages of the pore evolution. Such behavior of GRBC and GHAb2 was observed in all four trials when fusion was complete (i.e., ΔIm reached plateau). When fusion was not complete (three trials), membrane conductances were estimated from the Gdc changes using Eq. 2b); in all three trials a transient increase in Gdc (equal to the sum of GRBC and GHAb2) was observed during pore widening (like Gdc in Fig. 2 A), showing that at least one of the fusing membranes became leaky temporarily.
FIGURE 2.

Fusion between HAb2 cells and RBC at 33°C. (A) Time-course of admittance changes (ΔIm and ΔRe) and Gdc; zero time corresponds to the pH lowering. The first opening of the fusion pore occurred at ∼26 s. (B) Expanded segment of A illustrating fusion pore flickering. (C) Calculated conductances of fusion pore (Gp, left y-axis) and fusing membranes (GHAb2 and GRBC, left y-axis) after the pore stopped flickering (38–72 s from records shown in A). The increase in the integrated fluorescence of the HAb2 membrane (Fl, arbitrary units, right y-axis) corresponds to the transfer of lipid fluorescent dye PKH26 from the RBC membrane to the HAb2 membrane. (D) Calculated conductances of fusion pore (Gp, left y-axis) and fusing membranes (GHAb2 and GRBC, left y-axis) during the pore flickering (corresponds to records shown in B). Membrane conductances were calculated only on those parts of the record where the fusion pore was open (Eq. 1a).
In the remaining five trails (out of 12) no changes of Gdc was detected. These cases were classified as nonleaky (Table 1), although the RBC membrane could have become leaky before the fusion pore opening. Interestingly, in none of the five trials, in which Gdc increase was not observed, did fusion pores flicker, suggesting a correlation between fusion-related leakage and pore flicker. This correlation was confirmed in experiments performed at 20°C.
At 20°C, fusion pore conductance grew much slower than at 33°C. The initial conductance of the pore at 20°C ranged from 70 to 620 pS (349 ± 230 pS, n = 12), which is comparable with initial pore conductance at 33°C. At 20°C fusion was not complete, therefore Eq. 2a and Eq. 2b were used to estimate membrane conductances from Gdc changes (in these experiments, conditions of Eqs. 2a and 2b were always satisfied). In 10 trials out of the 12 of this series, a transient increase of Gdc was observed after fusion pore opening. Inasmuch as Gdc is always equal to the conductivity of the fusing membranes (Eq. 2b), such increases correspond to the fusion-related leakage (e.g., Fig. 3 A). In 10 out of 10 trials, both leakage and pore flickering were observed, confirming the correlation between leakage and pore flickering.
FIGURE 3.
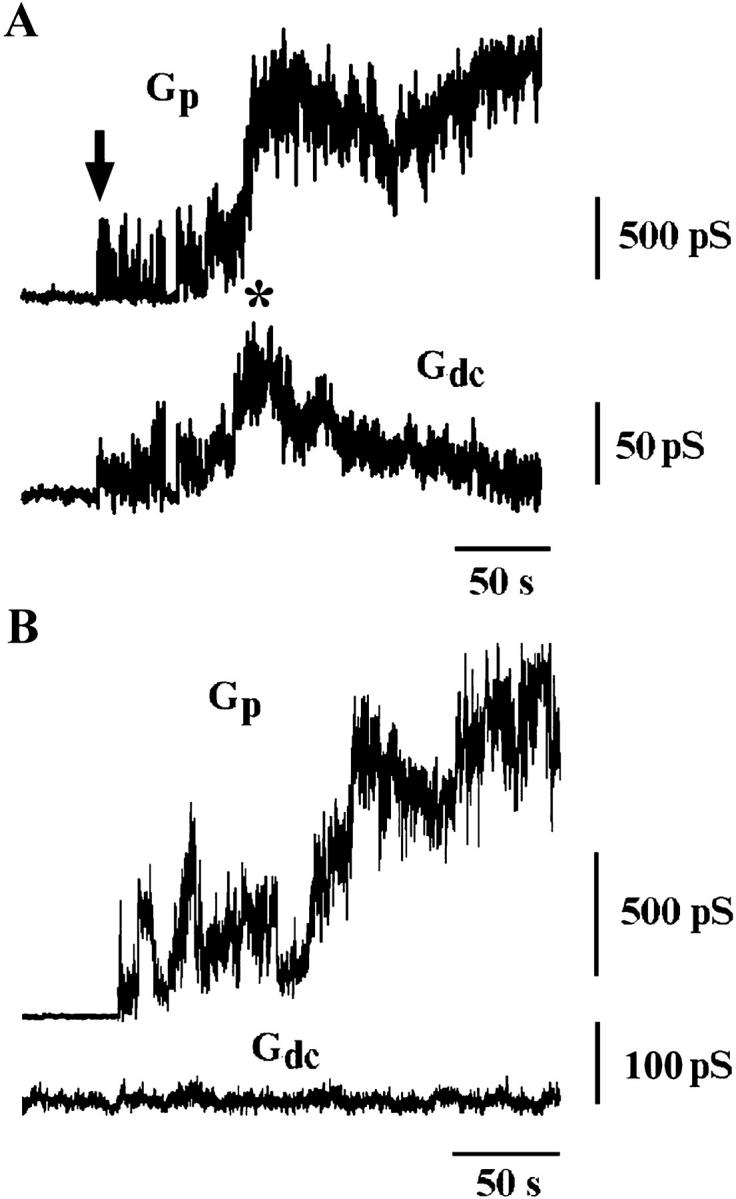
Fusion between HAb2 cells and RBC at 20°C. (A) Transient increase of Gdc during slow pore enlargement. Arrow points to the pore flickering, and asterisk indicates Gdc transient increase after the pore flickering. (B) Example of a nonleaky fusion between HAb2 and RBC.
In two out of 12 experiments performed at 20°C, no changes in Gdc were detected during fusion (e.g., Fig. 3 B). Gdc remained unchanged, although the fusion pore opened and expanded.
Altogether, in the HAb2/RBC system leakage was detected in 17 out of 24 trials in which fusion pores formed. Fourteen of 17 pores flickered and membrane leakage was observed in all of these 14 pairs (Table 1).
Although monitoring Gdc allowed determining membrane leakage in the HAb2/RBC system, the conductance of the target (RBC) membrane before the pore formation was not measured directly. To investigate the behavior of the target membrane, we used the HAb2/BLM system.
Leakage during fusion of HAb2 cells with BLM
The equivalent electrical circuit for the HAb2/BLM system is similar to that of the HAb2/RBC system (Fig. 1 A; see Material and Methods). But in the HAb2/BLM system the conductance of the target membrane (BLM) is measured before pore opening. In this system, fusion pores opened 51 ± 40 s (n = 12) after low-pH application (e.g., Fig. 4 A). After the first opening (arrow in Fig. 4 A) the fusion pore usually flickered (Table 1); the flicker is seen as fluctuations of ΔRe and Gdc near the background level (Fig. 4 A). At 140 ± 70 s (n = 12) after the fusion was triggered, the pore expanded irreversibly. At this moment (∼87 s in Fig. 4 A) BLM capacitance increased by a value, corresponding to the capacitance of a single HAb2 cell. Gdc increased also, reaching several nS after the completion of fusion (Fig. 4 A).
FIGURE 4.
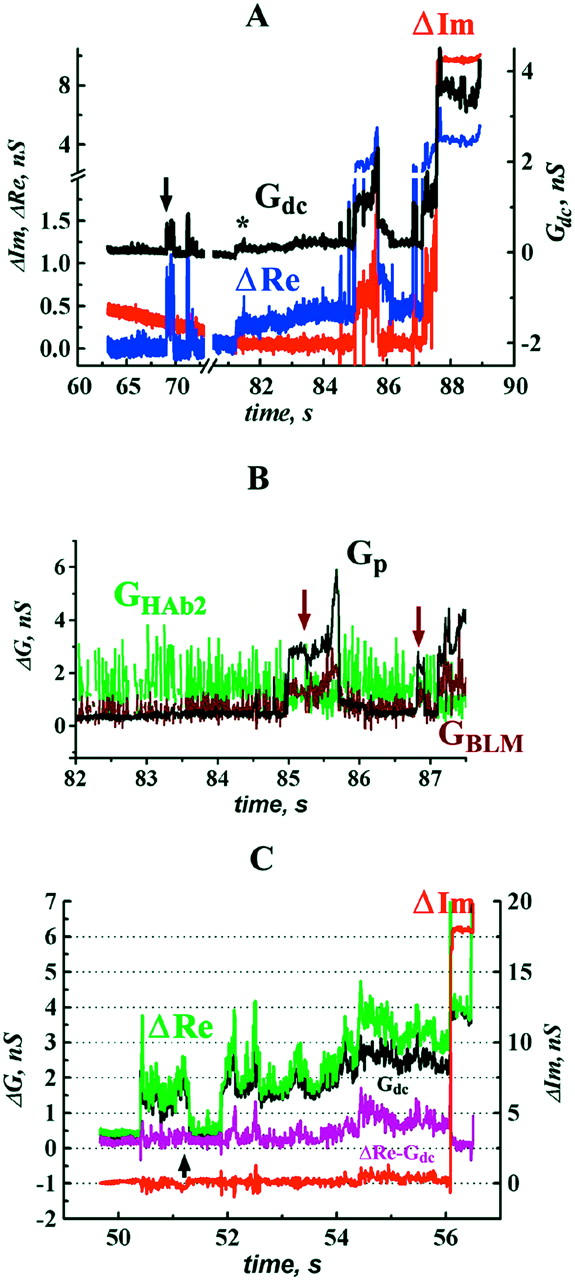
HA-induced changes in BLM conductance during HAb2/BLM fusion. (A) Time-course of admittance changes (ΔIm and ΔRe) and Gdc; zero time corresponds to the pH lowering. Arrow indicates the first opening of the fusion pore. Asterisk indicates change in Gdc without accompanying change in ΔIm. (B) Calculated conductances of fusion pore (Gp) and fusing membranes (GHAb2 and GBLM) after the pore stopped flickering (82–87.5 s from records shown in A). Arrows indicate transient changes in GBLM. (C) An example of a record in which change in Gdc was not accompanied by changes in ΔIm throughout the entire fusion process. Parameters for leakage estimates were sampled at the moment marked by arrow.
Fusion was always complete in this system. Hence, when the fusion pore was open, membrane conductances were calculated using Eq. 3. In four trials these calculations directly demonstrated transient increases of the GBLM by up to 3 nS (e.g., Fig. 4 B, arrows), whereas GHAb2 remained stable (Fig. 4 B), as it did in the HAb2/RBC system (Fig. 2 C).
Before fusion is complete, calculations of membrane conductance can be performed only when the ΔIm changes are substantially larger than the noise level. When Gdc increased without detectable changes of ΔIm (e.g., Fig. 4 A, asterisk), we assumed that GBLM remained stable (and equal to its value before the pore opening), and that all changes of Gdc and ΔRe were due to the addition of the HAb2 membrane to BLM. Then we calculated Gp using Eq. 4a and GHAb2 using Eq. 4b. For the fusion shown in Fig. 4 C (arrow), GHAb2 estimated by this procedure was ∼10 nS. This value is notably bigger than GHAb2 ∼ Gdc = 3.7 nS after the completion of fusion (Fig. 4 C, asterisk). It is also much bigger than mean conductance of HAb2 cell membrane (ranged from 0.2 to 3.9 nS, n = 62) measured in the HAb2/RBC and HAb2/PLC systems. This implies that either GHAb2 increased transiently at the moment marked by the arrow in Fig. 4 C, or our assumption of GBLM stability was not correct and GBLM increased after the pore opening. Either way, there was a fusion-related increase in membrane conductance. In total, in the HAb2/BLM system, leakage was detected in 10 out of 12 trials (Table 1), and in four cases when membrane conductances could be calculated, it was GBLM but not GHAb2 that increased during fusion.
In the HAb2/RBC and HAb2/BLM systems the conductance of only one of the two fusing membranes could be measured before the fusion pore opening. To study the behavior of both fusing membranes and localization of the leakage during cell-cell fusion, we applied the double whole-cell technique (Neyton and Trautmann, 1985).
Leakage during HAb2/PLC fusion
The experimental system involving HAb2 and PLC cells allowed us to measure the conductance of each of the two fusing membranes simultaneously (see Figs. 1 B and 5 A). In this system, the opening of the fusion pore was accompanied by an increase in the membrane conductance of at least one fusion partner in nine out of 11 trials, and only two fusion events appeared nonleaky (Table 1). The initial conductance of the fusion pore ranged from 150 to 600 pS (240 ± 90 pS, n = 11); fusion pores opened 180 ± 110 s (n = 11) after the low-pH application. A fusion-related increase in both Gm1 and Gm2 was recorded in five experiments and in four trials the conductance of only one membrane increased above the background noise level when the pore opened. Fig. 5 B illustrates the case when conductances of both fusion partners increased together with pore opening (arrow). Membrane leakage accompanied flickering of the fusion pore conductance (Fig. 5 B, insert). With pore widening, both membrane conductances continued, increasing to values of several nS (Fig. 5 B). Resealing of membranes in the HAb2/PLC system was very slow (not shown in Fig. 5 B), but 700–1250 s after the pore opening the membranes resealed completely in eight of nine cases in which the leakage was detected. Earlier observations showed that the aqueous dye did not leak from the fused HAb2/PLC cell pairs (Frolov et al., 1995), confirming that membrane leakage in this system did not persist. Thus, HA-induced fusion of HAb2 and PLC cells is consistently accompanied by transient increase of cell membrane permeability.
DISCUSSION
In this work, we show that changes in the permeability of fusing membranes are often detected during the formation and widening of the fusion pore induced by influenza hemagglutinin. The ionic conductivity of the fusing membranes and the HA-fusion pore were measured simultaneously using common electrophysiological approaches (Cohen and Melikyan, 1998) in three systems involving HA-bearing HAb2 cells and different fusion targets: RBC, BLM, or PLC. The magnitude of the changes in membrane permeability was consistent with the transient formation of new aqueous pathways for ion flux across the previously intact fusing membranes (leakage) in each of the systems.
Combining all experimental systems, we observed that only 10–30% of HA-mediated fusion events proceeded without any detectable leakage (Table 1; in total, 12 out of 47 fusion events were nonleaky). Lack of leakage during HA-induced fusion agrees with the observations of Spruce et al. (1991) and Tse et al. (1993). Leak-free membrane fusion is the dogma in cell physiology. Indeed, even transient leakage from small secretory vesicles may lead to complete depletion of its contents. Providing that content molecules freely diffuse through a canonical 1-nm pore in a vesicle membrane, characteristic depletion time τ for a spherical vesicle of r = 30 nm can be estimated as τ ∼ (h × r3)/(D × d2) ∼100 μs; here, h is membrane thickness (4 nm), D is diffusion coefficient (10−5 cm2/c), and d is pore diameter (1 nm). For virus-induced fusion, however, the situation might be different. The successful delivery of high molecular weight viral genomic material can occur even when fusing membranes are moderately leaky. The propensity of viral fusogenic proteins (e.g., of influenza, Semiliki-Forest, or Sendai virus) to induce leakage of content of fusing compartments, erythrocyte hemolysis in particular, has been repeatedly reported (Impraim et al., 1980; Micklem et al., 1984; Wharton et al., 1986; Niles et al., 1990; Samsonov et al., 2002). Is this leakage involved in actual rearrangements of membranes during fusion?
In this work, we consistently detected leakage during HA-mediated fusion. In 70–90% of fusion events in all experimental systems employed, conductance of at least one membrane increased upon fusion pore formation (Table 1; in total, leakage was detected in 35 out of 47 fusions). Moreover, we documented the following connections between the development of leakage and the fusion pore evolution (see also Blumenthal and Morris, 1999). First, in our systems the membrane conductance increased transiently only at early stages of fusion; as the fusion pore enlarged, the membranes resealed (Figs. 2 C and 3 A). Second, the leakage was mostly observed in slowly developing pores: quickly forming pores were not accompanied by leakage, whereas flickering pores went along with leakage (Table 1).
Fisher's exact test demonstrates that the correlation between the resealing and the pore enlargement is statistically significant. Calculations based on contingency table (Table 2) give sufficiently low value of p; i.e., p = 1.95 × 10⁻⁴ for all systems and p = 9.98 × 10⁻⁸, if data on HAb2/BLM fusion are not included. The same test proves the correlation between pore flickering and membrane leakage (Table 3, p = 2.83 × 10⁻⁵). This correlation indicates that the leakage is directly involved during fusion pore formation rather than happening coincidentally.
TABLE 2.
Contingency table for pore expansion and membrane resealing
Gp > 3nS.
Data on HAb2/BLM fusion are included in parentheses.
TABLE 3.
Contingency table for membrane leakage and fusion pore flickering
| Leakage | No leakage | |
|---|---|---|
| Flicker | 32 | 3 |
| No flicker | 3 | 9 |
In the HAb2/RBC system, resealing took seconds at 33°C. Such slow resealing would have resulted in complete loss of the low-molecular weight contents of a small vesicle (like a secretory granule). However, a 1-nm pore should not allow any significant loss of the viral genetic material. We previously showed that high molecular weight dextrans exchange very slowly through small (∼1 nS) fusion pores (Zimmerberg et al., 1994).
Complete resealing was observed in the HAb2/RBC and HAb2/PLC systems. In the HAb2/BLM system, although membrane conductance transients were detected (Fig. 4 B, arrows), the fusing membranes resealed rarely (Table 1). In this system, the residual leakage in the cell membrane can be caused by a high lateral tension of the BLM. In the HAb2/PLC system, the resealing of the fusing membranes was slower than in the HAb2/RBC system. Sustained leakage can account for massive content release reported earlier (Shangguan et al., 1996).
Our experiments indicate that in the HAb2/RBC and HAb2/BLM systems, leakage develops in the target membrane (i.e., RBC or BLM). In both systems, whenever GHAb2 could be calculated (using Eqs. 1a or 3), it remained unchanged during fusion. In those cases, when the direct measurements of GHAb2 were not possible, the data still suggested that GHAb2 stayed nonleaky during fusion. After low-pH application the conductance of a single HAb2 cell did not change (total 75 min of the records, data not shown). Moreover, GHAb2 remained unchanged before fusion pore opening in all experiments in the HAb2/RBC system. Fusion-related leakage in target membrane corroborate the model suggested by Bonnafous and Stegmann (2000). However, in the HAb2/PLC system we recorded leakage in the membranes of both fusing partners after the fusion pore opening, suggesting that one must avoid making the localization of HA-induced leakage model-dependent.
During HA-induced fusion, cell membrane permeability may increase due to the lowering of pH necessary to trigger fusion (Spruce et al., 1989). This kind of leakage can be reduced by using a proper extracellular media (Tse et al., 1993), and this maneuver was applied in our experiments. However, the effect of low pH cannot account for the close correlation of leakage development with the pore evolution (Tables 2 and 3). Another possible cause of leakage is an interaction of different HA fragments with membrane (Tsurudome et al., 1992; Colotto and Epand, 1997; Han and Tamm, 2000). Wild-type HA has been found to perturb the target membrane during fusion (Shangguan et al., 1996; Bonnafous and Stegmann, 2000). Analogous observations were reported for fusion induced by different fusion and synthetic peptides (Colotto and Epand, 1997; Sakai et al., 2002). HA mutagenesis also demonstrated that the fusion phenotype could induce more leakage than mutants capable of initiating only lipid exchange (Sakai et al., 2002) or than fusion-incompetent mutants (Colotto and Epand, 1997; Leikina et al., 2001; Epand et al., 2001). However, as HA forms multiple contact sites but only a few fusion pores between two membranes (Frolov et al., 2000), we would not expect a correlation between fusion pore formation and these HA contact-induced membrane perturbations.
Is membrane fusion inherently leaky, or is leakage specific for HA-mediated fusion? Repetitive current transients detected during the flicker of the exocytotic fusion pore (Zimmerberg et al., 1987; Spruce et al., 1990) may be related to leakage. Leakage was not detected for nonflickering pores formed by different fusion proteins (Spruce et al., 1991; Plonsky and Zimmerberg, 1996). Since the detection of leakage depends upon the duration of leakage being longer than the shortest observation window, we suggest that both flicker and leakage correspond to membrane rearrangements leading to fusion pore development. A quick transition to the lipidic pore allowing free lipid exchange proceeds without detectable leakage. When the pore development is hindered, the fusion complex would be held in a transient stage characterized by the observation of continuous fluctuations of the permeability of both the fusion pore and the target membrane.
A plausible model of the fusion process including transient leakage is presented by Mueller et al. (see this issue). According to this model, transient pores (or “holes”) should form in the fusing membranes, and this process is essential for the onset of fusion pore formation. Consistent with our observations, the leakage closely relates to the fusion pore evolution, and the fusing membranes reseal as the fusion pore develops. Interestingly, the model also predicts that the fusion should appear nonleaky if it proceeds fast. The model shows that membrane tension is one of the main factors determining the fusion pore evolution (see also Chizmadzhev et al., 1995; Kozlovsky et al., 2002). Effects of HA on the membrane tension may explain different patterns of the HA-induced fusion.
Acknowledgments
We thank K. Katsov, M. Mueller, P. Kuzmin, and M. Schick for valuable discussions.
This work was partially supported by the Russian Foundation for Basic Research (grants 02-04-48287 and H -1392-2003-4).
A.V. Sasonov's present address is UIC Department of Physiology and Biophysics (M/C 901), Chicago, IL 60612.
References
- Blumenthal, R., D. P. Sarkar, S. Durell, D. E. Howard, and S. J. Morris. 1996. Dilation of the influenza hemagglutinin fusion pore revealed by the kinetics of individual cell-cell fusion events. J. Cell Biol. 135:63–71. [DOI] [PMC free article] [PubMed] [Google Scholar]
- Blumenthal, R., and S. J. Morris. 1999. The influenza haemagglutinin-induced fusion cascade: effects of target membrane permeability changes. Mol. Membr. Biol. 16:43–47. [DOI] [PubMed] [Google Scholar]
- Bonnafous, P., and T. Stegmann. 2000. Membrane perturbation and fusion pore formation in influenza hemagglutinin-mediated membrane fusion: a new model for fusion. J. Biol. Chem. 275:6160–6166. [DOI] [PubMed] [Google Scholar]
- Chandler, D. E., and J. E. Heuser. 1980. Arrest of membrane fusion events in mast cells by quick-freezing. J. Cell Biol. 86:666–674. [DOI] [PMC free article] [PubMed] [Google Scholar]
- Chernomordik, L., M. M. Kozlov, and J. Zimmerberg. 1995. Lipids in biological membrane fusion. J. Membr. Biol. 146:1–14. [DOI] [PubMed] [Google Scholar]
- Chernomordik, L. V., E. Leikina, M. M. Kozlov, V. A. Frolov, and J. Zimmerberg. 1999. Structural intermediates in influenza haemagglutinin-mediated fusion. Mol. Membr. Biol. 16:33–42. [DOI] [PubMed] [Google Scholar]
- Chernomordik, L. V., V. A. Frolov, E. Leikina, P. Bronk, and J. Zimmerberg. 1998. The pathway of membrane fusion catalyzed by influenza hemagglutinin: restriction of lipids, hemifusion, and lipidic fusion pore formation. J. Cell Biol. 140:1369–1382. [DOI] [PMC free article] [PubMed] [Google Scholar]
- Chizmadzhev, Y. A., F. S. Cohen, A. Shcherbakov, and J. Zimmerberg. 1995. Membrane mechanics can account for fusion pore dilation in stages. Biophys. J. 69:489–500. [DOI] [PMC free article] [PubMed] [Google Scholar]
- Cohen, F. S., and G. B. Melikyan. 1998. Methodologies in the study of cell-cell fusion. Methods. 16:215–226. [DOI] [PubMed] [Google Scholar]
- Colotto, A., and R. M. Epand. 1997. Structural study of the relationship between the rate of membrane fusion and the ability of the fusion peptide of influenza virus to perturb bilayers. Biochemistry. 36:7644–7651. [DOI] [PubMed] [Google Scholar]
- Curran, M. J., F. S. Cohen, D. E. Chandler, P. J. Munson, and J. Zimmerberg. 1993. Exocytotic fusion pores exhibit semi-stable states. J. Membr. Biol. 133:61–75. [DOI] [PubMed] [Google Scholar]
- Danieli, T., S. L. Pelletier, Y. I. Henis, and J. M. White. 1996. Membrane fusion mediated by the influenza virus hemagglutinin requires the concerted action of at least three hemagglutinin trimers. J. Cell Biol. 133:559–569. [DOI] [PMC free article] [PubMed] [Google Scholar]
- Epand, R. M., R. F. Epand, I. Martin, and J. M. Ruysschaert. 2001. Membrane interactions of mutated forms of the influenza fusion peptide. Biochemistry. 40:8800–8807. [DOI] [PubMed] [Google Scholar]
- Frolov, V. A., A. B. Bytchenko, A. Y. Dunina-Barkovskaya, Y. A. Chizmadzhev, and J. Zimmerberg. 1995. Fusion partners for NIH 3T3 HAb2 fibroblasts expressing hemagglutinin. Membr. Cell Biol. 9:289–298. [Google Scholar]
- Frolov, V. A., M.-S. Cho, P. Bronk, T. S. Reese, and J. Zimmerberg. 2000. Multiple local contact sites are induced by GPI-linked influenza hemagglutinin during hemifusion and flickering pore formation. Traffic. 1:622–630. [DOI] [PubMed] [Google Scholar]
- Han, X., and L. K. Tamm. 2000. A host-guest system to study structure-function relationships of membrane fusion peptides. Proc. Natl. Acad. Sci. USA. 97:13097–13102. [DOI] [PMC free article] [PubMed] [Google Scholar]
- Impraim, C. C., K. A. Foster, K. J. Micklem, and C. A. Pasternak. 1980. Nature of virally mediated changes in membrane permeability to small molecules. Biochem. J. 186:847–860. [DOI] [PMC free article] [PubMed] [Google Scholar]
- Jiricek, R., G. Schwarz, and T. Stegmann. 1997. Pores formed by influenza hemagglutinin. Biochim. Biophys. Acta. 1330:17–28. [DOI] [PubMed] [Google Scholar]
- Kozlovsky, Y., and M. M. Kozlov. 2002. Stalk model of membrane fusion: solution of energy crisis. Biophys. J. 82:882–895. [DOI] [PMC free article] [PubMed] [Google Scholar]
- Kozlovsky, Y., L. V. Chernomordik, and M. M. Kozlov. 2002. Lipid intermediates in membrane fusion: formation, structure, and decay of hemifusion diaphragm. Biophys. J. 83:2634–2651. [DOI] [PMC free article] [PubMed] [Google Scholar]
- Kuzmin, P. I., J. Zimmerberg, Y. A. Chizmadzhev, and F. S. Cohen. 2001. A quantitative model for membrane fusion based on low-energy intermediates. Proc. Natl. Acad. Sci. USA. 98:7235–7240. [DOI] [PMC free article] [PubMed] [Google Scholar]
- Leikina, E., D. L. LeDuc, J. C. Macosko, R. Epand, R. Epand, Y. K. Shin, and L. V. Chernomordik. 2001. The 1–127 HA2 construct of influenza virus hemagglutinin induces cell-cell hemifusion. Biochemistry. 40:8378–8386. [DOI] [PubMed] [Google Scholar]
- Lindau, M. 1991. Time-resolved capacitance measurements: monitoring exocytosis in single cells. Q. Rev. Biophys. 24:75–101. [DOI] [PubMed] [Google Scholar]
- Lindau, M., and W. Almers. 1995. Structure and function of fusion pores in exocytosis and ectoplasmic membrane fusion. Curr. Opin. Cell Biol. 7:509–517. [DOI] [PubMed] [Google Scholar]
- Markin, V. S., M. M. Kozlov, and V. L. Borovjagin. 1984. On the theory of membrane fusion: the stalk mechanism. Gen. Physiol. Biophys. 3:361–377. [PubMed] [Google Scholar]
- Markin, V. S., and J. P. Albanesi. 2002. Membrane fusion: stalk model revisited. Biophys. J. 82:693–705. [DOI] [PMC free article] [PubMed] [Google Scholar]
- Melikyan, G. B., W. D. Niles, V. A. Ratinov, M. Karhanek, J. Zimmerberg, and F. S. Cohen. 1995. Comparison of transient and successful fusion pores connecting influenza hemagglutinin expressing cells to planar membranes. J. Gen. Physiol. 106:803–819. [DOI] [PMC free article] [PubMed] [Google Scholar]
- Micklem, K. J., A. Nyaruwe, G. M. Alder, and C. A. Pasternak. 1984. The effect of Ca2+ on virus-cell fusion and permeability changes. Cell Calcium. 5:537–550. [DOI] [PubMed] [Google Scholar]
- Monck, J. R., and J. M. Fernandez. 1992. The exocytotic fusion pore. J. Cell Biol. 119:1395–1404. [DOI] [PMC free article] [PubMed] [Google Scholar]
- Mueller, M., K. Katsov, and M. Schick. 2002. New mechanism of membrane fusion. J. Chem. Phys. 116:2342. [Google Scholar]
- Neher, E., and A. Marty. 1982. Discrete changes of cell membrane capacitance observed under conditions of enhanced secretion in bovine adrenal chromaffin cells. Proc. Natl. Acad. Sci. USA. 79:6712–6716. [DOI] [PMC free article] [PubMed] [Google Scholar]
- Neyton, J., and A. Trautmann. 1985. Single-channel currents of an intercellular junction. Nature. 317:331–335. [DOI] [PubMed] [Google Scholar]
- Niles, W. D., M. E. Peeples, and F. S. Cohen. 1990. Kinetics of virus-induced hemolysis measured for single erythrocytes. Virology. 174:593–598. [DOI] [PubMed] [Google Scholar]
- Noguchi, H., and M. Takasu. 2001. Fusion pathways of vesicles: a Brownian dynamics simulation. J. Chem. Phys. 115:9547–9551. [Google Scholar]
- Noguchi, H., and M. Takasu. 2002. Adhesion of nanoparticles to vesicles: a Brownian dynamics simulation. Biophys. J. 83:299–308. [DOI] [PMC free article] [PubMed] [Google Scholar]
- Palade, G. E. 1975. Intracellular aspects of the process of protein synthesis. Science. 189:347–358. [DOI] [PubMed] [Google Scholar]
- Plonsky, I., and J. Zimmerberg. 1996. The initial fusion pore induced by baculovirus GP64 is large and forms quickly. J. Cell Biol. 135:1831–1839. [DOI] [PMC free article] [PubMed] [Google Scholar]
- Sakai, T., R. Ohuchi, and M. Ohuchi. 2002. Fatty acids on the A/USSR/77 influenza virus hemagglutinin facilitate the transition from hemifusion to fusion pore formation. J. Virol. 76:4603–4611. [DOI] [PMC free article] [PubMed] [Google Scholar]
- Samsonov, A. V., P. K. Chatterjee, V. I. Razinkov, C. H. Eng, M. Kielian, and F. S. Cohen. 2002. Effects of membrane potential and sphingolipid structures on fusion of Semliki-Forest virus. J. Virol. 76:12691–12702. [DOI] [PMC free article] [PubMed] [Google Scholar]
- Shangguan, T., D. Alford, and J. Bentz. 1996. Influenza virus-liposome mixing is leaky and largely insensitive to the material properties of the target membrane. Biochemistry. 35:4956–4965. [DOI] [PubMed] [Google Scholar]
- Spruce, A. E., A. Iwata, J. M. White, and W. Almers. 1989. Patch clamp studies of single cell-fusion events mediated by a viral fusion protein. Nature. 342:555–558. [DOI] [PubMed] [Google Scholar]
- Spruce, A. E., L. J. Breckenridge, A. K. Lee, and W. Almers. 1990. Properties of the fusion pore that forms during exocytosis of a mast cell secretory vesicle. Neuron. 4:643–654. [DOI] [PubMed] [Google Scholar]
- Spruce, A. E., A. Iwata, and W. Almers. 1991. The first milliseconds of the pore formed by a fusogenic viral envelope protein during membrane fusion. Proc. Natl. Acad. Sci. USA. 88:3623–3627. [DOI] [PMC free article] [PubMed] [Google Scholar]
- Takahashi, N., T. Kishimoto, T. Nemoto, T. Kadowaki, and H. Kasai. 2002. Fusion pore dynamics and insulin granule exocytosis in the pancreatic islet. Science. 297:1349–1352. [DOI] [PubMed] [Google Scholar]
- Tse, F. W., A. Iwata, and W. Almers. 1993. Membrane flux through the pore formed by a fusogenic viral envelope protein during cell fusion. J. Cell Biol. 121:543–552. [DOI] [PMC free article] [PubMed] [Google Scholar]
- Tsurudome, M., R. Gluck, R. Graf, R. Falchetto, U. Schaller, and J. Brunner. 1992. Lipid interactions of the hemagglutinin HA2 NH2-terminal segment during influenza virus-induced membrane fusion. J. Biol. Chem. 267:20225–20232. [PubMed] [Google Scholar]
- Wharton, S. A., J. J. Skehel, and D. C. Wiley. 1986. Studies of influenza haemagglutinin-mediated membrane fusion. Virology. 149:27–35. [DOI] [PubMed] [Google Scholar]
- White, J. 1996. Membrane fusion: the influenza paradigm. CSH Sympos. 60:581–588. [DOI] [PubMed] [Google Scholar]
- Zimmerberg, J., M. Curran, F. S. Cohen, and M. Brodwick. 1987. Simultaneous electrical and optical measurements show that membrane fusion precedes secretory granule swelling during exocytosis of beige mouse mast cells. Proc. Natl. Acad. Sci. USA. 84:1585–1589. [DOI] [PMC free article] [PubMed] [Google Scholar]
- Zimmerberg, J., R. Blumenthal, M. Curran, D. Sarkar, and S. Morris. 1994. Restricted movement of lipid and aqueous dyes through pores formed by influenza hemagglutinin during cell fusion. J. Cell Biol. 127:1885–1894. [DOI] [PMC free article] [PubMed] [Google Scholar]