Abstract
A new method for simulating the folding process of a protein is reported. The method is based on the essential dynamics sampling technique. In essential dynamics sampling, a usual molecular dynamics simulation is performed, but only those steps, not increasing the distance from a target structure, are accepted. The distance is calculated in a configurational subspace defined by a set of generalized coordinates obtained by an essential dynamics analysis of an equilibrated trajectory. The method was applied to the folding process of horse heart cytochrome c, a protein with ∼3000° of freedom. Starting from structures, with a root-mean-square deviation of ∼20 Å from the crystal structure, the correct folding was obtained, by utilizing only 106 generalized degrees of freedom, chosen among those accounting for the backbone carbon atoms motions, hence not containing any information on the side chains. The folding pathways found are in agreement with experimental data on the same molecule.
INTRODUCTION
The characterization of the protein folding process represents one of the major challenges in molecular biology. Large theoretical and experimental research efforts have been devoted to this end (Onuchic et al., 1997; Dill and Chan, 1997; Dobson and Karplus, 1999; Alm and Baker, 1999). Computer simulations have been largely used, coupled to theoretical approaches, to address this question and molecular dynamics (MD) simulations is one of the most used computational methods. The major problem with MD simulations is due to the conformational sampling efficiency; in fact even in the 1-μs simulation of a 36-residue protein (Duan and Kollman, 1998), one of the longest simulations so far afforded, the sampled space explored represents a small fraction of the available conformational space. For this reason different techniques have been proposed to overcome this limit. Three kinds of MD techniques can be identified: the common approach is to unfold starting from the native state under denaturing conditions, mainly high temperature (Mayor et al., 2000; Alonso and Daggett, 2000; Pan and Daggett, 2001). However, the unfolding process is not necessarily the reverse of the folding process and therefore the issue of whether unfolding simulations are representative for the folding process is still open (Finkelstein, 1997). Another way of addressing this problem is the so-called biased-sampling free-energy method (Boczko and Brooks III, 1995; Sheinermann and Brooks III, 1998; Shea and Brooks III, 2001), in which high temperature unfolding simulations are followed by the calculation of the free energy of a folding process at 300 K, along the previously determined path. Also this elegant, but time-consuming, method is based on the hypothesis that the unfolding process at high temperature and the folding process at 300 K follow the same path. The third method is the targeted molecular dynamics, in which an additional time-dependent harmonic restraint, applied on each atom, continuously decreases the all-atom root-mean-square deviation from the native state (Ferrara et al., 2000). Targeted molecular dynamics has been previously used to calculate reaction paths between two conformations of a molecule (Schlitter et al., 1993; Diaz et al., 1997; Ma and Karplus, 1997).
In this article we present a different computational approach to the folding problem, based on the essential dynamics sampling (EDS) (Amadei et al., 1996; de Groot et al., 1996). In the essential dynamics (ED) (Amadei et al., 1993), or principal component (García, 1992), analysis a new Cartesian reference system is obtained; each new axis (eigenvector), obtained by the diagonalization of the covariance matrix of positional fluctuations, corresponds to a collective motion of the system and after sorting the eigenvectors, according to the displacement involved in each one (eigenvalues), the first ones correspond to the large concerted motions of the system and the last ones represent the collective quasiconstraint (usually referred to as near-constraint) vibrations. The EDS technique was introduced to increase (or decrease) the distance from a reference structure. To this end, the distance is calculated in the new reference system (obtained by the previously described ED analysis of an equilibrated trajectory) using only a subset of the generalized degrees of freedom of the system, i.e., a subset of the eigenvectors. As reported in the Methods section, with EDS a usual MD simulation is performed in each step; the new position is accepted if the step does not decrease (or does not increase) the distance from the reference structure in the chosen subspace. Otherwise the current structure is projected onto the closest configuration, with the same distance of the previous one in the chosen subspace. Although proposed in 1996, this technique was never used to follow the folding process of a protein. It has to be pointed out that with this biased MD simulation no deterministic force is added to the system and the correct folding can be obtained by using a small fraction of the degrees of freedom of the protein to bias the simulation. In the present case these degrees of freedom were chosen among those accounting for backbone carbon atoms motions, hence not containing any information on the side chains.
Here we present the results obtained in the EDS folding simulation of cytochrome c (cyt c). Cyt c is a globular protein of 104 amino acids, whose folding dynamics has been subjected to extensive experimental investigations (Akiyama et al., 2000, 2002, Segel et al., 1999; Ohgushi and Wada; 1983; Xu et al., 1998; Shastry et al., 1998; Hagen and Eaton, 2000). In particular, fluorescent data (Shastry et al., 1998; Pollack et al., 1999) from Trp-59 suggested an early collapse of the main chain structure within 100 μs; time-resolved circular dichroism (Akiyama et al., 2000) and small-angle x-ray scattering, SAXS (Akiyama et al., 2002) suggested the presence of two folding intermediates having ∼0.5-ms and ∼7-ms lifetimes. The SAXS measurements also suggested, in agreement with theoretical investigations on different proteins (Brooks III, 2002; Guo et al., 1997; Alonso and Daggett, 2000), that after an initial decrease of the radius of gyration, the main-chain collapse of the structure and the secondary structure formation are mostly concerted. Interestingly, recent fluorescence energy transfer studies on the iso-cytochrome c folding (Lyubovitski et al., 2002), providing the distribution of distances between donor- and acceptor-labeled residues, suggested that only a small fraction of the collapsed structures correctly folds. In fact, most of those structures adopt frustrated topologies separated by large energy barriers from the folding funnel.
METHODS
Molecular dynamics simulations
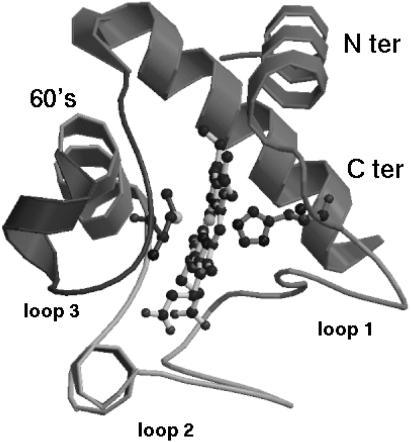
The starting structure for the simulation at 300 K was taken from the 1.94 Å resolution refined crystal structure of the protein cyt c (PDB entry is 1hrc) (Bushnell et al., 1990) (Fig. 1). The simulated system was set up as described elsewhere (Roccatano et al., 2003). All MD simulations were performed using the GROMACS software package and the GROMOS87 force field (van Gunsteren and Berendsen, 1987) was used with modification as suggested by van Buuren et al. (1993); explicit hydrogen atoms in aromatic rings were simulated (van Gunsteren et al., 1996). The protein was solvated with water in a periodic rectangular box of dimensions 67.90 × 63.27 × 72.26 Å. The SHAKE algorithm (Ryckaert and Bellemans, 1975) was used to constrain all bond lengths, the simple point charge (Berendsen et al., 1981) water model was used and the temperature was kept constant with the isokinetic temperature coupling (Brown and Clarke, 1984). A nonbond pairlist list cutoff of 9.0 Å was used and the pairlist was updated every four timesteps. The long-range electrostatic interactions were treated with the particle-mesh Ewald method (Darden et al., 1993) using a 56 × 53 × 60 grid combined with a fourth-order B-spline interpolation to compute the potential and forces in between gridpoints. A timestep of 2 fs was used for numerical integration.
FIGURE 1.
Crystal structure of cytochrome c.
Essential dynamics analysis
A molecular dynamics simulation at 300 K was performed for 2660 ps. From the equilibrated portion of the trajectory (beyond 160 ps) the covariance matrix, of order 312, of the positional fluctuations of the Cα carbon atoms was built up and diagonalized. The procedure yielded new axes (eigenvectors), representing the directions of the concerted motions. The corresponding eigenvalues gave the mean-square positional fluctuation for each direction (Amadei et al., 1993).
ED sampling
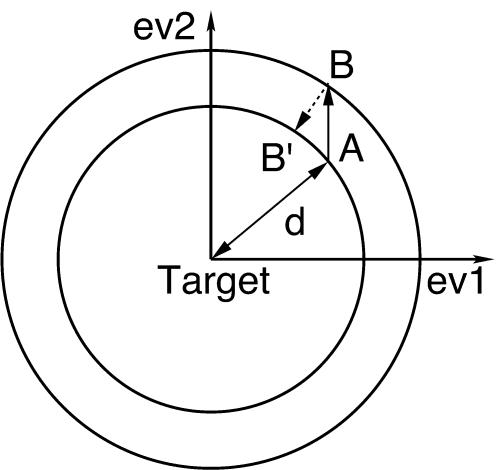
The ED sampling (EDS) technique (Amadei et al., 1996; de Groot et al., 1996) is based on a previous essential dynamics analysis and it is used to increase (expansion procedure) or decrease (contraction procedure) the distance from a reference structure. For each step a regular MD simulation is performed and the distance between the current structure and the reference structure is calculated. The step is accepted if the distance between the current structure and the reference does not decrease (expansion procedure) or does not increase (contraction procedure), otherwise the coordinates and velocities are projected radially onto the hypersphere (in the chosen subspace) centered in the reference, with radius given by the distance form the reference in the previous step (Fig. 2). It has to be pointed out that no additional deterministic forces are added and that, in the present case, the eigenvectors were obtained by the diagonalization of the matrix of the positional fluctuations of the backbone carbon atoms (104 carbons, i.e., 312 eigenvectors), so that they do not contain any information on the other atoms, in particular on the side chains.
FIGURE 2.
Essential dynamics sampling; example for the contraction procedure in a bidimensional case. (A) structure at step i; (B) structure at step i + 1; (B′) new structure at step i + 1. The labels ev1 and ev2 represent eigenvectors 1 and 2, respectively.
Unfolding/refolding simulations
To produce the starting unfolded structures the EDS technique at 300 K was used in the expansion mode (Amadei et al., 1996; de Groot et al., 1996), utilizing all 306 native eigenvectors (the last six eigenvectors represent the overall rototranslation and have zero eigenvalues). Ten unfolding simulations were performed, starting at different times of the 2660-ps simulation of the native structure, utilized in the ED analysis. Preliminary EDS folding simulations were performed with different procedures: a first simulation used all the 306 native backbone carbon atom eigenvectors to calculate the distance from the target and apply the bias (EDS procedure). Starting from the same unfolded structure three additional simulations were performed by using the EDS procedure with three lower dimensional subspaces: eigenvectors 1–100, 101–200, and 201–306, respectively. Finally, nine additional simulations, starting from the nine previously determined unfolded structures, were performed using the last subspace (eigenvectors 201–306) for the EDS procedure.
Contacts
According to the GROMACS definition, a contact between residues i and j > (i + 3) was considered present if the smallest distance between any two atoms, belonging to the two residues, was <5.5 Å. The fraction of native contacts, ρ, is calculated with respect to the crystal structure.
RESULTS AND DISCUSSION
Starting from the crystal structure, a 2660-ps simulation at 300 K, in explicit solvent, was performed. From the equilibrated portion of the trajectory (beyond 160 ps) the covariance matrix of the positional fluctuation of the Cα carbon atoms was built and diagonalized. The main structural properties of the equilibrated portion of the trajectory are reported in Table 1.
TABLE 1.
Structural properties in the crystal (row 1), in the MD simulation of the native structure (row 2) and at the end of the refolding trajectories (rows 3–6)
| RMSDCα* (Å) | RMSDsc* (Å) | Rg (Å) | ρ* | %helix* | θ* (%) | |
|---|---|---|---|---|---|---|
| Crystal | – | – | 12.64 | 1.00 | 41 | 100 |
| Native | 1.44(0.22) | 2.53(0.20) | 12.70(0.20) | 0.84(0.01) | 42(4) | 94(3) |
| ALL† | 0.40(0.02) | 2.44(0.04) | 12.76(0.02) | 0.83(0.01) | 40(1) | 94(2) |
| SET1† | 2.43(0.02) | 5.74(0.05) | 12.98(0.02) | 0.50(0.01) | 10(3) | 28(6) |
| SET2† | 5.32(0.10) | 7.13(0.08) | 13.61(0.05) | 0.54(0.01) | 17(2) | 35(7) |
| SET3† | 2.33(0.07) | 3.82(0.07) | 13.11(0.05) | 0.73(0.01) | 43(2) | 98(2) |
The RMSD values, RMSDCα and RMSDsc, the native contacts content, ρ, and the native helix content, θ, are calculated with respect to the crystal structure. %helix represents the total helix content.
All the values are averaged over the last 100 ps of each trajectory; standard deviations are in parentheses.
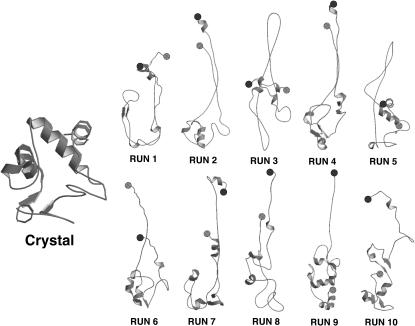
Starting from the structure at 2500 ps of the 300-K simulation, an unfolding simulation was performed by an EDS expansion procedure at T = 300 K using all the 306 native eigenvectors and the crystal structure as reference. The final structure (RUN 1 in Fig. 3) was characterized by radius of gyration (Rg) of 18.94 Å and (with respect to the crystal structure) by root-mean-square deviation (RMSD) of the Cα carbon atoms of 19.13 Å , fraction of native contacts of 0.23, and native helix content (θ) of 28%.
FIGURE 3.
Ribbon diagrams of the crystal structure and of the starting unfolded structures of the refolding trajectories. The N- and C-terminal residues are represented by a black and a gray circle, respectively.
The refolding process was simulated by the EDS contracting procedure, using all the 306 native eigenvectors (ALL) to bias the system toward the target. The Cα RMSD, with respect to the target, reached very rapidly, i.e., within 250 ps, a value close to 1.0 Å and the average structure over the last 100 ps was close to the target one (Table 1).
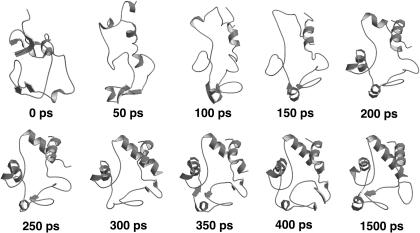
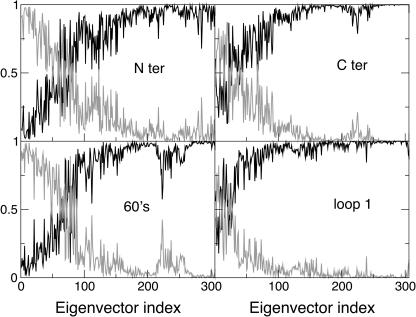
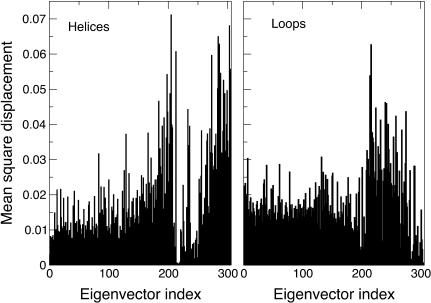
To characterize the different contribution of the native eigenvectors to the refolding process, they were divided into three sets: eigenvectors 1–100, 101–200, and 201–306. Using these three sets for the EDS procedure, three new refolding simulations (SET1, SET2, and SET3) were performed. As reported in Table 1, only the last set gave an average final structure close to the target one. In Fig. 4 the ribbon diagrams of sequential snapshots along the refolding trajectory using SET3 are represented. This result suggests that the most rigid quasiconstraint eigenvectors, representing in the folded protein the smallest collective vibrations, contain the proper mechanical information for the folding process. It is also worth noting that a correct folding was obtained using in the EDS procedure only 106 eigenvectors for a protein of ∼3000° of freedom. These eigenvectors seem to control and constrain the internal motion of the secondary structure or loop elements, as shown in Fig. 5, where we report the fractional decomposition of the overall Cα displacement due to each single eigenvector into internal and rototranslational (with respect to the Cα centroids) ones. The results, for the terminal helices, 60′s helix, and loop 1, make evidence that the last set of eigenvectors mostly represents internal collective vibrations, i.e., within the secondary structure or loop element considered. In addition it is evident from the fractional mean square displacement per atom (obtained by the eigenvectors components) in the native structure simulation, calculated for the helices and the loops, along each eigenvector (Fig. 6), that eigenvectors in the range of 210–275 are mainly involved in the loops motion, whereas eigenvectors in the ranges of 200–210 and 275–306 are mainly involved in the helices motion. The mean-square displacement per atom of a helix or a loop was calculated averaging the sum of the square components of each eigenvector of the atoms belonging to secondary structure or loop element, respectively.
FIGURE 4.
Ribbon diagrams of sequential snapshots along the refolding trajectory using SET3.
FIGURE 5.
Fractional Cα internal (black) and rototranslational, with respect to the Cα centroids (gray), displacements for the Nter helix (top left), Cter helix (top right), 60′s helix (bottom left), and loop 1 (bottom right), versus the eigenvector index.
FIGURE 6.
Fractional mean-square displacement per atom (obtained by the eigenvector components) along each eigenvector, calculated for the helices Nter, Cter, and 60′s (left), and for the loops 1, 2, and 3 (right).
Taken together, these results show that, although the correct folding can be obtained using all the 306-Cα carbon eigenvectors, a folded structure of comparable quality can be obtained using only the last 106 eigenvectors. In what follows we will perform different independent folding simulations using this last set of eigenvectors. This because we want to use the least biased procedure in our folding simulations and find out the main mechanical information necessary for the folding process.
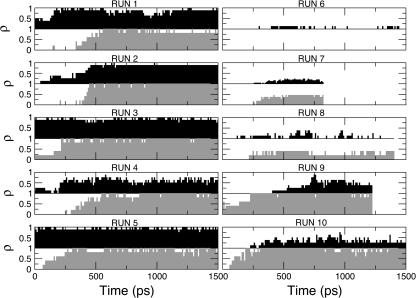
To have a better statistics we performed nine additional independent unfolding simulations starting at different times of the native simulation, thus obtaining different final structures (Fig. 3 and Table 2). The EDS refolding simulations (RUNS 2–10) were performed for 1.0–1.5 ns, with the same procedure adopted for SET 3: 300 K and utilizing only eigenvectors 201–306 in the EDS procedure. The results, reported in Table 3 (RUN 1 of Table 3 coincides with SET3 of Table 1), show that simulations from 1 to 5 converged well to the target structure with values comparable with the native structure simulation (Table 1). Simulations 6–8 did not show RMSD, native contacts, or helix content in agreement with the target. Simulations 9 and 10 are doubtful because, although they show values comparable with the native structure, the terminal helices do not show a proper folding. In fact, the RMSD (with respect to the crystal of the terminal helices), averaged over the last 100 ps, is much larger than in RUNS 1–5, being ≈4.5 Å in respect to ≈2.0 Å. In addition, as discussed later, they show a small value of native contacts content between the terminal helices. Interestingly, recent fluorescence energy transfer studies on the iso-cytochrome c folding (Lyubovitski et al., 2002), measured the distribution of distances between donor- and acceptor-labeled residues and suggested that only a fraction of the collapsed structures correctly fold. It has to be pointed out (Fig. 3) that the starting structures of simulations 6–10 did not have any contact between the terminal helices, as shown by the N- and C-terminal residues represented by a black and a gray circle, respectively. Hence the contact between the terminal helices seems to be a prerequisite for a proper folding, in agreement with the hypothesized role of these contacts in the cyt-c folding process (Colon et al., 1996; Marmorino et al., 1998; Xu et al., 1998). Fig. 7 (RUN 1–5) shows that the correct folding is obtained when the native contacts between the terminal helices precede those between helices 60′s and C-ter. The process is reversed in RUN 9 and RUN 10, where the contacts between the terminal helices reached ∼50% of the native structure value.
TABLE 2.
Structural properties of the starting unfolded structures of the refolding trajectories
| RMSDCα* (Å) | RMSDsc* (Å) | Rg (Å) | ρ* | %helix* | θ* (%) | |
|---|---|---|---|---|---|---|
| RUN 1 | 19.13 | 20.06 | 18.94 | 0.23 | 14 | 28 |
| RUN 2 | 21.26 | 21.80 | 24.47 | 0.50 | 22 | 49 |
| RUN 3 | 21.45 | 21.20 | 21.50 | 0.43 | 19 | 44 |
| RUN 4 | 20.69 | 21.47 | 22.92 | 0.43 | 11 | 37 |
| RUN 5 | 16.93 | 17.33 | 19.24 | 0.48 | 19 | 56 |
| RUN 6 | 25.66 | 26.77 | 27.59 | 0.38 | 18 | 53 |
| RUN 7 | 26.97 | 27.82 | 29.24 | 0.34 | 27 | 63 |
| RUN 8 | 20.42 | 20.44 | 21.66 | 0.33 | 15 | 42 |
| RUN 9 | 22.32 | 22.28 | 21.39 | 0.43 | 31 | 67 |
| RUN 10 | 21.08 | 21.58 | 21.94 | 0.42 | 15 | 46 |
The RMSD values, the native contacts content, ρ, and the native helix content, θ, are calculated with respect to the crystal structure. %helix represents the total helix content.
TABLE 3.
Final structural properties of the refolding trajectories
| RUNS* | RMSDCα† (Å) | RMSDsc† (Å) | Rg (Å) | ρ† | %helix† | θ† (%) |
|---|---|---|---|---|---|---|
| RUN 1‡ | 2.33(0.07) | 3.82(0.07) | 13.11(0.05) | 0.73(0.01) | 43(2) | 98(2) |
| RUN 2 | 1.36(0.04) | 2.75(0.05) | 12.76(0.04) | 0.82(0.01) | 39(3) | 86(4) |
| RUN 3 | 1.97(0.06) | 3.18(0.06) | 13.11(0.05) | 0.77(0.01) | 41(2) | 96(3) |
| RUN 4 | 2.12(0.10) | 3.22(0.07) | 12.96(0.04) | 0.77(0.01) | 40(1) | 93(3) |
| RUN 5 | 1.84(0.07) | 2.94(0.08) | 12.93(0.04) | 0.78(0.01) | 38(2) | 89(5) |
| RUN 6 | 4.35(0.06) | 5.57(0.06) | 13.52(0.06) | 0.61(0.01) | 35(2) | 80(5) |
| RUN 7 | 3.48(0.07) | 4.50(0.09) | 13.41(0.05) | 0.62(0.01) | 33(2) | 83(4) |
| RUN 8 | 2.86(0.08) | 4.25(0.06) | 13.23(0.06) | 0.65(0.01) | 36(2) | 83(4) |
| RUN 9 | 2.26(0.06) | 3.64(0.07) | 13.40(0.04) | 0.75(0.01) | 42(1) | 98(2) |
| RUN 10 | 1.87(0.06) | 3.27(0.08) | 13.03(0.05) | 0.77(0.01) | 42(1) | 96(3) |
All the values are averaged over the last 100 ps of each trajectory; standard deviations are in parentheses.
The RMSD values, RMSDCα and RMSDsc, the native contacts content, ρ, and the native helix content, θ, are calculated with respect to the crystal structure. %helix represents the total helix content.
RUN 1 coincides with SET3 of Table 1.
FIGURE 7.
Evolution in time (RUN 1–10) of the fraction of native contacts between terminal helices (black) and between helices Cter and 60′s (gray).
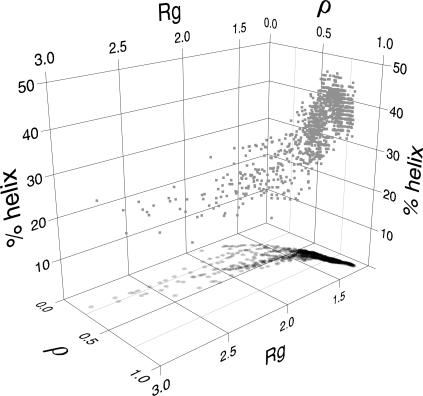
The correlation among the native contacts content, the radius of gyration and the helix content in the EDS folding trajectories (Fig. 8) for RUNS 1–10 shows that the folding process can be divided into two steps: the first one is characterized by the decrease of the radius of gyration, with no significant increase of the native contacts content and amount of secondary structure; in the last part of the simulation the radius of gyration is almost constant, whereas the native contacts and the secondary structure content increase in an almost concerted way. This sequence is actually in agreement with the one proposed by SAXS and CD measurements (Akiyama et al., 2000, 2002) and MD data on different proteins (Brooks III, 2002; Guo et al., 1997; Alonso and Daggett, 2000). The SAXS and CD measurements also suggested that the folding process of cyt c is characterized by two intermediates, as evidenced by the analysis of the time dependence of the radius of gyration that was fitted by a double exponential characterized by time constants of ∼0.5 ms and ∼15 ms. In the present case the double-exponential behavior was less evident (data not shown); however, the double-exponential fitting gave an excellent correlation coefficient, r = 0.998, and time constants of 120 ps and 4420 ps. The difference of the time constant magnitude has to be ascribed to the EDS method that speeds up considerably the sampling toward the folded condition; however, the ratios between the experimental time constants (∼30) and our time constants (∼36) are comparable.
FIGURE 8.
Gray squares represent the correlation among the native contacts content (ρ), the radius of gyration (Rg), and the total helix content (%helix). Black circles represent the projection onto the Rg-ρ plane.
CONCLUSIONS
In the present article a new method to simulate the folding process of a protein to its native state is reported. The method is based on the essential dynamics sampling procedure and provides a biased MD simulation, which restrains 106° over the ∼3000° of freedom of the protein. These restrained degrees of freedom are obtained by the essential dynamics analysis of the positional fluctuations of the backbone carbon atoms and do not contain any information on the other backbone and side chain atoms. It has to be pointed out that in the EDS procedure no deterministic force is added to the Hamiltonian and hence the system is not systematically forced toward the target. The restraints were applied only to the last eigenvectors, representing the most rigid quasiconstraint motions, whereas all the other degrees of freedom were completely free to sample the configurational space, according to the usual equations of motion. The results also showed that the restrained eigenvectors are mostly involved in the internal collective motions, within helices or loops, whereas the essential eigenvectors (the first 10–20) provide mainly rototranslational motions of helices or loops. Such results clearly show that the last eigenvectors define the main mechanical constraints necessary in a folded protein, whereas the essential eigenvectors really represent the large internal motion which can occur without unfolding the protein.
The folding of cytochrome c was simulated as a test. The results evidenced that five assays (out of 10) were successful, three assays were not, and two were doubtful. It has to be pointed out that also fluorescence energy transfer studies on the iso-cytochrome c folding (Lyubovitski et al., 2002) suggested that only a fraction of the collapsed structures correctly fold. Finally, our results showed that in the EDS simulations the folding process of cyt c is characterized by an initial decrease of the radius of gyration, with no significant increase of the native contacts and of secondary structure content; in the last part of the simulation the radius of gyration is almost constant, whereas the native contacts percentage and the secondary structure content increase in an almost concerted way. This folding path is in agreement with the experimental suggestions (Akiyama et al., 2000, 2002) on cyt c and with MD data on different proteins (Brooks III, 2002; Guo et al., 1997; Alonso and Daggett, 2000).
Acknowledgments
A. Di Nola acknowledges the “Centro di Eccellenza BEMM” of the University of Roma “La Sapienza.”
This work was supported by the European Community Training and Mobility of Researchers Program “Protein (Mis)-Folding”, by the Italian Ministero dell'Istruzione, Università e Ricerca (National Project Structural Biology and Dynamics of Redox Proteins), and by the Italian National Research Council, Agenzia 2000.
References
- Akiyama, S., S. Takahashi, K. Ishimori, and I. Morishima. 2000. Stepwise formation of α-helices during cytochrome c folding. Nat. Struct. Biol. 7:514–520. [DOI] [PubMed] [Google Scholar]
- Akiyama, S., S. Takahashi, T. Kimura, K. Oishimori, I. Morishima, Y. Nishikawa, and T. Fujisawa. 2002. Conformational landscape of cytochrome c folding studied by microsecond-resolved small-angle x-ray scattering. Proc. Natl. Acad. Sci. USA. 99:1329–1334. [DOI] [PMC free article] [PubMed] [Google Scholar]
- Alm, E., and D. Baker. 1999. Matching theory and experiment in protein folding. Curr. Opin. Struct. Biol. 9:189–196. [DOI] [PubMed] [Google Scholar]
- Alonso, D., and V. Daggett. 2000. Staphylococcal protein-a: unfolding pathways, unfolded states, and differences between the b and e domains. Proc. Natl. Acad. Sci. USA. 97:133–138. [DOI] [PMC free article] [PubMed] [Google Scholar]
- Amadei, A., A. B. M. Linssen, and H. J. C. Berendsen. 1993. Essential dynamics of proteins. Prot. Struct. Funct. Genet. 17:412–425. [DOI] [PubMed] [Google Scholar]
- Amadei, A., A. B. M. Linssen, B. L. de Groot, D. M. van Aalten, and H. J. C. Berendsen. 1996. An efficient method for sampling the essential subspace of proteins. J. Biomol. Struct. Dyn. 13:615–625. [DOI] [PubMed] [Google Scholar]
- Berendsen, H. J. C., J. P. M. Postma, W. F. van Gunsteren, and J. Hermans. 1981. Interaction models for water in relation to protein hydration. In Intermolecular Forces. B. Pullman, editor. D. Reidel Publishing Company, Dordrecht, The Netherlands. 331–342.
- Boczko, E., and C. L. Brooks, III. 1995. First-principle calculation of the folding free energy of a three-helix bundle protein. Science. 269:393–396. [DOI] [PubMed] [Google Scholar]
- Brooks III, C. L. 2002. Viewing protein folding from many perspectives. Proc. Natl. Acad. Sci. USA. 99:1099–1100. [DOI] [PMC free article] [PubMed] [Google Scholar]
- Brown, D., and J. H. R. Clarke. 1984. A comparison of constant energy, constant temperature, and constant pressure ensembles in molecular dynamics simulations of atomic liquids. Mol. Phys. 51:1243–1252. [Google Scholar]
- Bushnell, G. W., G. V. Louie, and G. D. Brayer. 1990. High-resolution three-dimensional structure of horse heart cytochrome c. J. Mol. Biol. 214:585–595. [DOI] [PubMed] [Google Scholar]
- Colon, W., G. A. Elove, L. P. Wakem, F. Sherman, and H. Roder. 1996. Side chain packing of the N- and C-terminal helices plays a critical role in the kinetics of cytochrome c folding. Biochemistry. 35:5538–5549. [DOI] [PubMed] [Google Scholar]
- Darden, T., D. York, and L. Pedersen. 1993. Particle mesh Ewald: an N-log(N) method for Ewald sums in large systems. J. Chem. Phys. 98:10089–10092. [Google Scholar]
- de Groot, B. L., A. Amadei, D. M. F. van Aalten, and H. Berendsen. 1996. Towards an exhaustive sampling of the configurational space of the two forms of peptide hormone guanylin. J. Biomed. Str. Dyn. 13:741–751. [DOI] [PubMed] [Google Scholar]
- Diaz, J., B. Wroblowski, J. Schlitter, and Y. Engelborghs. 1997. Calculation of pathways for the conformational transition between the gtp- and gdp-bound states of the ha-ras-p21 protein: calculations with explicit solvent simulations and comparison with calculations in vacuum. Proteins. 28:434–451. [PubMed] [Google Scholar]
- Dill, K., and H. Chan. 1997. From Levinthal to pathways to funnels. Nat. Struct. Biol. 4:10–19. [DOI] [PubMed] [Google Scholar]
- Dobson, C., and M. Karplus. 1999. The fundamental of protein folding: bringing together theory and experiment. Curr. Opin. Struct. Biol. 9:92–101. [DOI] [PubMed] [Google Scholar]
- Duan, Y., and P. Kollman. 1998. Pathways to a protein folding intermediate observed in a 1-μs simulation in aqueous solution. Science. 282:740–744. [DOI] [PubMed] [Google Scholar]
- Ferrara, P., J. Apostolakis, and A. Caflisch. 2000. Computer simulations of protein folding by targeted molecular dynamics. Proteins. 39:252–260. [DOI] [PubMed] [Google Scholar]
- Finkelstein, A. V. 1997. Can protein unfolding simulate protein folding? Prot. Eng. 10:843–845. [DOI] [PubMed] [Google Scholar]
- García, A. 1992. Large-amplitude nonlinear motions in proteins. Phys. Rev. Lett. 66:2696–2699. [DOI] [PubMed] [Google Scholar]
- Guo, Z., C. L. Brooks III, and E. Boczko. 1997. Exploring the folding free energy surface of a three-helix bundle protein. Proc. Natl. Acad. Sci. USA. 94:10161–10166. [DOI] [PMC free article] [PubMed] [Google Scholar]
- Hagen, S., and W. Eaton. 2000. Two-state expansion and collapse of a polypeptide. J. Mol. Biol. 301:1019–1027. [DOI] [PubMed] [Google Scholar]
- Lyubovitski, J., H. Gray, and J. Winkler. 2002. Mapping the cytochrome c folding landscape. J. Am. Chem. Soc. 124:5481–5485. [DOI] [PubMed] [Google Scholar]
- Ma, J., and M. Karplus. 1997. Molecular switch in signal transduction: reaction paths of the conformational changes in ras p21. Proc. Natl. Acad. Sci. USA. 94:11905–11910. [DOI] [PMC free article] [PubMed] [Google Scholar]
- Marmorino, J. L., M. Lehti, and G. J. Pielak. 1998. Native tertiary structure in an A-state. J. Mol. Biol. 275:379–388. [DOI] [PubMed] [Google Scholar]
- Mayor, U., C. M. Johnson, V. Daggett, and A. R. Fersht. 2000. Protein folding and unfolding in microseconds to nanoseconds by experiment and simulation. Proc. Natl. Acad. Sci. USA. 97:13518–13522. [DOI] [PMC free article] [PubMed] [Google Scholar]
- Ohgushi, M., and A. Wada. 1983. “Molten-globule state”: a compact form of globular proteins with mobile side-chains. FEBS Lett. 164:21–24. [DOI] [PubMed] [Google Scholar]
- Onuchic, J., Z. Luthey-Schulten, and P. Wolynes. 1997. Theory of protein folding: the energy landscape perspective. Annu. Rev. Phys. Chem. 48:545–600. [DOI] [PubMed] [Google Scholar]
- Pan, Y., and V. Daggett. 2001. Direct comparison of experimental and calculated folding free energies for hydrophobic deletion mutants of chymotrypsin inhibitor 2: free energy perturbation calculations using transition and denaturated states from molecular dynamics of unfolding. Biochemistry. 40:2723–2731. [DOI] [PubMed] [Google Scholar]
- Pollack, L., M. W. Tate, N. C. Darnton, J. B. Knight, S. M. Gruner, W. A. Eaton, and R. H. Austin. 1999. Compactness of the denatured state of a fast-folding protein measured by submillisecond small-angle x-ray scattering. Proc. Natl. Acad. Sci. USA. 96:10115–10117. [DOI] [PMC free article] [PubMed] [Google Scholar]
- Roccatano, D., I. Daidone, M.-A. Ceruso, C. Bossa, and A. D. Nola. 2003. Selective excitation of native fluctuations during thermal unfolding simulations: horse heart cytochrome c as a case study. Biophys. J. 84:1876–1883. [DOI] [PMC free article] [PubMed] [Google Scholar]
- Ryckaert, J., and A. Bellemans. 1975. Molecular dynamics of liquidn-butane near its boiling point. Chem. Phys. Lett. 30:123–125. [Google Scholar]
- Schlitter, J., M. Engels, P. Kruger, E. Jacoby, and A. Wollmer. 1993. Targeted molecular dynamics simulation of conformational changes: application to the t↔r transition in insulin. Mol. Sim. 10:291–309. [Google Scholar]
- Segel, D., D. Eliezer, V. Uversky, A. Fink, K. Hodgson, and S. Doniach. 1999. Protein denaturation: a small-angle x-ray scattering study of the ensemble of unfolded states of cytochrome c. Biochemistry. 38:15352–15359. [DOI] [PubMed] [Google Scholar]
- Shastry, M., S. Luck, and H. Roder. 1998. A continuous-flow capillary mixing method to monitor reactions on the microsecond timescale. Biophys. J. 74:2714–2721. [DOI] [PMC free article] [PubMed] [Google Scholar]
- Shea, J.-E., and C. L. Brooks, III. 2001. From folding theories to folding proteins: a review and assessment of simulation studies of protein folding and unfolding. Annu. Rev. Phys. Chem. 52:499–535. [DOI] [PubMed] [Google Scholar]
- Sheinermann, F., and C. Brooks, III. 1998. Calculation on folding of segment vb1 of streptococcal protein-G. J. Mol. Biol. 278:439–456. [DOI] [PubMed] [Google Scholar]
- van Buuren, A. R., S. J. Marrink, and H. J. C. Berendsen. 1993. A molecular dynamics study of decane/water interface. J. Phys. Chem. 97:9206–9212. [Google Scholar]
- van Gunsteren, W. F., and H. J. C. Berendsen. 1987. GROMOS Manual. BIOMOS, Biomolecular Software, Laboratory of Physical Chemistry, University of Groningen, The Netherlands.
- van Gunsteren, W. F., S. Billeter, A. Eising, P. Hunenberger, P. Kruger, A. E. Mark, W. Scott, and I. Tironi. 1996. Biomolecular Simulations: The GROMOS96 Manual and User Guide. BIOMOS b.v., Zurich, Groningen.
- Xu, Y., L. Mayne, and S. Englander. 1998. Evidence for an unfolding and refolding pathway in cytochrome c. Nat. Struct. Biol. 5:774–778. [DOI] [PubMed] [Google Scholar]


