

Abstract
An accurate statistical energy function that is suitable for the prediction of protein structures of all classes should be independent of the structural database used for energy extraction. Here, two high-resolution, low-sequence-identity structural databases of 333 α-proteins and 271 β-proteins were built for examining the database dependence of three all-atom statistical energy functions. They are RAPDF (residue-specific all-atom conditional probability discriminatory function), atomic KBP (atomic knowledge-based potential), and DFIRE (statistical potential based on distance-scaled finite ideal-gas reference state). These energy functions differ in the reference states used for energy derivation. The energy functions extracted from the different structural databases are used to select native structures from multiple decoys of 64 α-proteins and 28 β-proteins. The performance in native structure selections indicates that the DFIRE-based energy function is mostly independent of the structural database whereas RAPDF and KBP have a significant dependence. The construction of two additional structural databases of α/β and α + β-proteins further confirmed the weak dependence of DFIRE on the structural databases of various structural classes. The possible source for the difference between the three all-atom statistical energy functions is that the physical reference state of ideal gas used in the DFIRE-based energy function is least dependent on the structural database.
INTRODUCTION
One simple method for estimating the interaction between the proteins and within a single protein is the knowledge-based approach in which known protein structures are used to generate the statistical potentials (or energy functions; Tanaka and Scheraga, 1976). Knowledge-based statistical potentials have been applied to fold recognition and assessment (Bryant and Lawrence, 1993; Casari and Sippl, 1992; Hendlich et al., 1990; Jones et al., 1992; Lu and Skolnick, 2001; Melo et al., 2002; Miyazawa and Jernigan, 1999; Samudrala and Moult, 1998; Sippl, 1990; Zhou and Zhou, 2004), structure predictions (Lee et al., 1999; Pillardy et al., 2001; Simons et al., 1997; Skolnick et al., 1997; Sun, 1993; Tobi and Elber, 2000; Vendruscolo et al., 2000), and validations (Luthy et al., 1992; MacArthur et al., 1994; Melo and Feytmans, 1998; Rojnuckarin and Subramaniam, 1999; Sippl, 1993), docking and binding (Altuvia et al., 1995; Liu et al., 2004; Pellegrini and Doniach, 1993; Wallqvist et al., 1995; Zhang et al., 1997), and mutation-induced changes in stability (Gilis and Rooman, 1996, 1997; Zhang et al., 1997; Zhou and Zhou, 2002).
One natural consequence of this commonly used statistical approach is that the outcome (the energy function) is strongly dependent on input (the structural database). For example, the structural database of single-chain proteins and the interface database of dimeric proteins produce quantitatively different pair potentials for folding and binding studies (Lu et al., 2003; Moont et al., 1999). This is caused by significantly different compositions of amino acid residues at the surface, core, and interface of proteins (Glaser et al., 2001; Lu et al., 2003; Ofran and Rost, 2003). In another example, the residue-level, distance-dependent, Sippl potential extracted from all-α protein structures is quantitatively different from that extracted from all-β protein structures (Furuichi and Koehl, 1998). This suggests that different structural patterns (topology) also change the outcome of the statistical energy function. The distance-independent statistical energy parameters, however, appear to be less sensitive to different subsets of protein structure database except that there is large difference between the parameters from the crystallographic structures and that from the NMR structures (Godzik et al., 1995).
The database dependence of statistical energy functions, however, is unphysical. This is because the same physical interaction (water-mediated interaction between amino-acid residues) is responsible for protein folding and binding and for the formation of β-strands and α-helices. The unphysical, database dependence of a statistical potential is difficult to avoid because it is equivalent to requiring the output to be independent of (or insensitive to) different input information.
Recently, a residue-specific all-atom, distance-dependent potential of mean-force was extracted from the structures of single-chain proteins by using a physical state of uniformly distributed points in finite spheres (distance-scaled, finite, ideal-gas reference, i.e., DFIRE, state) as the zero-interaction reference state (Zhou and Zhou, 2002). Remarkably, the physical reference state yields a potential of mean-force that no longer possesses some unphysical characteristics associated with other statistical potentials. It was shown that the accuracy of DFIRE-based potential is insensitive to the partitioning of hydrophobic and hydrophilic residues within a protein (Zhou and Zhou, 2002). More importantly, the new structure-derived potential can quantitatively reproduce the likelihood of a residue to be buried (i.e., the composition difference of amino-acid residues between core and surface; Zhou and Zhou, 2003). The potential also yields a stability scale of amino acid residues in quantitative agreement with that independently extracted from mutation experimental data (Zhou and Zhou, 2003). Moreover, the monomer potential (derived from single-chain proteins) is found to be equally successful in discriminating against docking decoys, distinguishing true dimeric interface from crystal interfaces, and predicting binding free energy of protein-protein and protein-peptide complexes (Liu et al., 2004). The independence of the performance for the systems with various amino-acid compositions suggests that the DFIRE-based potential possesses some physical characteristics not observed in some other knowledge-based potentials.
The above results raise an interesting question: does the DFIRE-based potential depend on the structural database used for statistics? Although the performance of the DFIRE potential on structure selections has been shown to be insensitive to the size of the database (number of protein structures; Zhou and Zhou, 2002) and the database of either single-chain or dimeric proteins (Liu et al., 2004), it is not clear whether or not the structural database of all-α proteins will yield a DFIRE potential that is different from that generated from the database of all-β proteins. Answering this question is important for the application of the DFIRE-based statistical energy function to structure prediction of proteins with different structural topology.
In this article, we built structural databases of all-α, all-β, α + β, and α/β proteins based on SCOP classification. The database dependence of three all-atom knowledge-based potentials (i.e., RAPDF, Samudrala and Moult, 1998; atomic KBP, Lu and Skolnick, 2001; and DFIRE, Zhou and Zhou, 2002) are compared. Results show that unlike RAPDF and KBP, the DFIRE energy function is mostly independent of the database used for training. The origin for the difference in database dependence between DFIRE and RAPDF/KBP is discussed.
METHODS
Composition-averaged observed state as the reference state
The derivation of a distance-dependent, pairwise, statistical potential  starts from a common inverse-Boltzmann equation given by
 |
(1) |
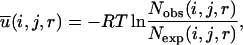
where R is the gas constant, T is the temperature, Nobs(i, j, r) is the observed number of atomic pairs (i, j) within a distance shell r − Δr/2 to r + Δr/2 in a database of folded structures, and Nexp(i, j, r) is the expected number of atomic pairs (i, j) in the same distance shell if there were no interactions between atoms (the reference state). Clearly, the method used to calculate Nexp(i, j, r) is what makes one potential differ from another because the method to calculate Nobs(i, j, r) is the same (except the difference in database and bin procedures).
Samudrala and Moult (1998) used a conditional probability function
 |
(2) |
where  ,
,  and
and 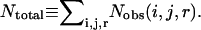 Lu and Skolnick (2001) employed a quasichemical approximation of
 |
(3) |
where χk is the mole fraction of atom type k. The common approximation made by the above two potentials is that 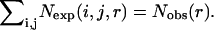 This approximation has its origin in the uniform density reference state used by Sippl (1990) to derive the residue-based, distance-dependent potential. In this approximation, the total number of pairs in any given distance shell for a reference state is the same as that for folded proteins. That is, a composition-averaged observed state is used as the reference state. This composition-averaged state is the most commonly used reference state for a distance-dependent pair potential. Other reference states for distance-dependent potentials were also proposed (Jernigan and Bahar, 1996; Mitchell et al., 1999; Moult, 1997; Vijayakumar and Zhou, 2000).
Distance-scale finite ideal-gas reference (DFIRE) state
The DFIRE state (Zhou and Zhou, 2002) was derived directly from a formally exact equation for potential of mean force in statistical mechanics which is given by Friedman (1985) as
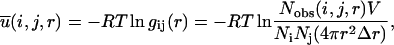 |
(4) |
where gij(r) is the pair distribution function, V is the volume of the system, and Ni and Nj are the number of atoms i and j, respectively. The final equation for the DFIRE-based energy function is then obtained after two approximations are made. In the first approximation, we assume that the number of pairs for an ideal gas system increases in rα for an finite system, rather than r2 for an infinite system. In the second approximation, we assume that all interactions become zero after a cutoff distance rcut, i. e.,  for r > rcut.
The final equation for the DFIRE potential of mean force  between atom types i and j that are distance r apart is given by Zhou and Zhou (2002) as
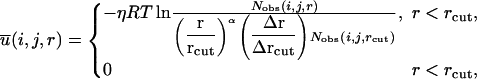 |
(5) |
where η (= 0.0157) is a scaling constant, R is the gas constant, T = 300 K, α = 1.61, rcut = 14.5 Å, and Δr(Δrcut) is the bin width at r(rcut). (Δr = 2 Å, for r < 2 Å; Δr = 0.5 Å for 2 Å < r < 8 Å; Δr = 1 Å for 8 Å < r < 15 Å.) The prefactor η was determined so that the regression slope between the predicted and experimentally measured changes of stability due to mutation (895 data points) is equal to 1.0. The exponent α for the distance dependence was determined by optimizing the fit between rα and the distance dependence of the pair distribution function for uniformly distributed points in finite spheres (finite ideal-gas reference state; Zhou and Zhou, 2002). Residue-specific atomic types were used (167 atomic types; Lu and Skolnick, 2001; Samudrala and Moult, 1998).
Structural training databases
To test the dependence of three statistical potentials (RAPDF, atomic KBP, and DFIRE) on training databases, we built training databases of all-α and all-β proteins based on the SCOP classification (1.63 release; Conte et al., 2002; Murzin et al., 1995). Specifically, we began with the <40% identity set built by the authors of SCOP (http://astral.stanford.edu/), then removed the structures obtained by the NMR methods, the structures whose resolution >2.5 Å, the structures from composite domains (Furuichi and Koehl, 1998; Zhang and Kim, 2000), and the structures not from all-α or all-β structure classes (defined by authors of SCOP). Then, we extracted the experimentally determined secondary structural states (α, β, and others) of residues in these structures from DSSP database (Kabsch and Sander, 1983) using a simple mapping scheme similar to Zhang and Kim (2000). We removed the structures in α (β) class that have >10% content of β (α). Finally, we removed the structures with >30% identity to decoys (calculated with FASTA package; Pearson, 1990; Pearson and Lipman, 1988). The final α-protein and β-protein databases have 333 and 271 single-domain proteins, respectively.
In addition, we built training databases of α/β and α+β proteins. The procedure used to build them is exactly the same as described above except that the α/β and α+β classes (according to SCOP definition) of <40% identity SCOP set are used instead. We required that both α/β and α+β proteins have >10% content of α and β. There are 515 α/β and 399 α+β single-domain proteins that are <30% identity to decoys. (A list of proteins is given in http://theory.med.buffalo.edu.) The DFIRE energy functions based on 333 α-proteins, 271 β-proteins, 515 α/β, and 399 α+β proteins are labeled as DFIRE-α, DFIRE-β, DFIRE-α/β, and DFIRE-α+β, respectively. The original structural database (Zhou and Zhou, 2002) for calculating Nobs(i, j, r) was a structural database of 1011 non-homologous (<30% homology) proteins with resolution <2 Å, which was collected by Hobohm et al. (1992) (http://chaos.fccc.edu/research/labs/dunbrack/culledpdb.html). The DFIRE energy function extracted from this database will be labeled as DFIRE-all.
In addition to generating several DFIRE energy functions by using the new structural databases, RAPDF and atomic KBP potentials are also regenerated for comparison. The bin procedures for RAPDF and KBP are as follows. For RAPDF (Samudrala and Moult, 1998), the first bin covers 0–3.0 Å and the distance between 3.0 Å and 20 Å is binned every 1 Å. The total number of bins is 18. All 18 bins with a cutoff distance of 20 Å are used for scoring. For atomic KBP (Lu and Skolnick, 2001), the distance between 1.5 Å and 14.5 Å is binned every 1 Å and the last bin is from 14.5 Å to infinite. The total number of bins is 14. The first- and second-sequence neighbors are excluded whereas backbone atoms are included in counting contacts. When used in scoring, only the bins covering 3.5–6.5 Å are used. In all cases, contacts between atoms within a single residue are excluded from the counts and scoring. In case of zero pairs, both potentials are set to be 2η kcal/mol. No attempts were made to optimize these parameters and/or procedures presented by the original articles for possibly better performance. There are RAPDF-α, RAPDF-β, KBP-α, and KBP-β, depending on the structural database used.
Multiple decoy sets for α- and β-proteins
The database dependence of the energy functions was tested by the performance on structural discrimination. We established the decoy sets for all-α and all-β proteins from the 4state_reduced set (Park and Levitt, 1996), lmds set (through conformational enumeration of loop region, Keasar and Levitt, 2003), fisa set (Simons et al., 1997), fisa_casp3 set (Simons et al., 1997), Rosetta (through Rosetta method; Simons et al., 1997), lattice_ssfit (through conformational enumeration on whole protein, Samudrala et al., 1999), hg_structural (through comparative modeling), LKF (through minimizing the number of violations of van der Waals constraints, Loose et al., 2004), and CASP4 decoy sets (generated by numerous protein structure prediction teams using a variety of methods, Feig and Brooks, 2002). There are 64 and 28 decoy sets for α (with β-content <10%) and β (with α-content <10%) proteins, respectively. All these 92 proteins have <30% identity to the proteins in the training databases of all-α, all-β, α+β, and α/β proteins. The complete list of these proteins is shown in Table 1.
TABLE 1.
The standard 92 multiple decoy sets
| Source | Decoy number | Target (PDB ID) |
|---|---|---|
| 4state* | 630–687 | 1r69, 2cro, 3icb |
| lattice_ssfit† | 2000 | 1beo, 1nkl, 4icb |
| lmds‡ | 343–500 | 1b0n-B, 1fc2, 1shf-A,‡‡ 2cro |
| fisa§ | 500–1200 | 1hdd-C, 2cro, 4icb |
| fisa_casp3¶ | 500–1200 | 1bg8-A, 1bl0, 1jwe |
| CASP4∥ | 42–112 | t0096(1e2x), t0098(1fc3), t0100(1qjv),‡‡ t0106(1ijx), t0107(1i8u),‡‡ t0108(1j83),‡‡ t0123(1exs),‡‡ t0125(1gak) |
| Rosetta¶ | 1000 | 1aa2, 1ail, 1bdo,‡‡ 1cc5, 1eca, 1csp,‡‡ 1gvp,‡‡ 1tit,‡‡ 1hlb, 1lfb, 1lis, 1wiu,‡‡ 1mbd, 1ark,‡‡ 1mzm, 1pal, 1r69, 1tul,‡‡ 1utg, 1vls, 1who,‡‡ 2erl, 2ncm,‡‡ 2gdm, 4fgf,‡‡ 5icb, 1ksr,‡‡ 1sro,‡‡ 5pti |
| hg_structural** | 30 | 1ash, 1bab-b, 1col-A, 1cpc-A, 1ecd, 1flp, 2lhb, 4sdh-A, 1gdm, 1hbg, 1hlb, 1hlm, 1ith-A, 1mba, 1myt |
| LKF†† | 200 | 1a7v, 1ab0,‡‡ 1abo,‡‡ 1ae3,‡‡ 1ag6,‡‡ 1an2, 1anu,‡‡ 1avs, 1bbh,1b2p,‡‡ 1b7v, 1b8r, 1bai,‡‡ 1baj, 1bbb, 1beo, 1bfs,‡‡ 1bg8, 1bhd, 1bja, 1bk2,‡‡ 1bm9, 1bre,‡‡ 1bzd‡‡ |
R. Samudrala, E. S. Huang, and M. Levitt, unpublished results.
These PDB codes are β-type proteins; all the others are α-type proteins.
Structure selections from decoys
For a given three-dimensional structure of a protein, the total potential of mean force, G, is
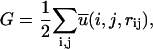 |
(6) |
where the summation is over all pairs of atoms. In structure selections from decoy sets, the total potential G is calculated for each structure including native state and decoys. The native state is correctly identified if its structure has the lowest value of G. Z-score is defined as  where 〈 〉 denotes the average over all decoy structures of a given native protein and Gnative is the total residue-residue potential of the native structure. Z-score is a measure of the bias toward the native structure.
RESULTS AND DISCUSSION
We focus first on the energy functions extracted from the databases of the all-α structures and all-β structures. Because the structural difference between all-α and all-β structures is the largest among all structural classes, the database dependence is likely the largest between the energy functions extracted from these two databases. It is known that α-proteins involve mostly local contacts (contacts between the residues with short sequence separations) whereas β-proteins involve mostly nonlocal contacts.
Fig. 1 compares the performance of energy functions obtained from the databases of the all-α structures and all-β structures on structural discrimination of all-α proteins and all-β proteins. The performance is characterized by the success rate in ranking native structures within a given number of energy-ranked structures (top-ranked structures, Nt). For all three methods (RAPDF, KBP, and DFIRE), there is some degree of database dependence because an α-protein-trained energy function gives a higher success rate in structure selections of α-proteins than a β-protein-trained energy function. Similarly, a β-protein-trained energy function gives a higher success rate in structure selections of β-proteins than an α-protein-trained energy function. However, DFIRE has a substantially smaller dependence than either RAPDF or KBP. For example, for the top 10 ranking (Nt = 10), the difference between the success rates of selecting α-proteins given by an energy function trained by the two structural databases is 6% for RAPDF and 14% for KBP, but only 2% for DFIRE. For the structure selection of β-proteins, the corresponding difference is 17% for RAPDF, 18% for KBP, and 0% for DFIRE. Fig. 1 shows that at every number of top-ranked structures, DFIRE consistently gives the smallest difference between the two success rates among RAPDF, KBP, and DFIRE.
FIGURE 1.

Success rates in ranking native states within a given number of top-ranked structures given by α-protein-trained energy functions versus those by β-protein-trained energy functions for α-protein decoys (left) and β-protein decoys (right). The results for RAPDF, KBP, and DFIRE are shown at top, middle, and bottom panels, respectively.
The difference between the energy functions trained by different structural databases can also be visualized by comparing the total energies of the native structures of 64 α-proteins and 28 β-proteins given by the energy functions. Fig. 2 compares the energy given by the α-protein-trained potentials with that given by the β-protein-trained potentials. The root mean-squared deviations between the two energy values for the 64 α-proteins are 0.296 for RAPDF, 1.07 for KBP, and 0.132 for DFIRE, respectively. (The relative difference is used, i.e., the energy difference is divided by the average energy predicted by two energy functions.) The corresponding root mean-squared deviation values for the 28 β-proteins are 0.342 for RAPDF, 0.694 for KBP, and 0.068 for DFIRE, respectively. Thus, the DFIRE gives the smallest database dependence in native energy. In fact, both RAPDF and KBP show a systematic deviation. An α-protein-trained energy function always gives a lower energy to α-proteins than a β-protein-trained energy function does. Similarly, a β-protein-trained energy function always gives a lower energy to β-proteins than an α-protein-trained energy function does. The lower the energy, the stronger the systematic deviation. In contrast, the correlation slope between the energy given by the α-protein-trained DFIRE potential and that given by the β-protein-trained DFIRE potential is very close to 1 for either α-proteins or β-proteins.
FIGURE 2.

Energies of native states given by α-protein-trained energy functions versus those by β-protein-trained energy functions for α-proteins (○) and β-proteins (•). The results for RAPDF, KBP, and DFIRE are shown at top, middle, and bottom panels, respectively.
To further illustrate the database dependence, the Z-scores given by energy functions trained by different databases are shown in Fig. 3. It is clear that DFIRE has the smallest database dependence on Z-scores. For α-protein decoys, the root mean-square deviation values of Z-scores between two database-trained energy functions are 1.95 for RAPDF, 1.07 for KBP, and 0.387 for DFIRE, respectively. The corresponding values for β-protein decoys are 0.767 for RAPDF, 0.457 for KBP, and 0.257 for DFIRE, respectively.
FIGURE 3.

Z-scores given by α-protein-trained energy functions versus those by β-protein-trained energy functions for α-protein (left) and β-protein (right) decoy sets. The results for RAPDF, KBP, and DFIRE are shown at top, middle, and bottom panels, respectively.
For α-proteins, there is one significant outlier for DFIRE at high Z-score value where the Z-score given by DFIRE-β is lower than that given by DFIRE-α. This is contributed by 1beo in the lattice_ssfit decoy set. We found that the energy differences given by DFIRE-α and DFIRE-β are in fact quite small for both decoys and native states (<10%). The large difference in Z-score resulted from an artificially narrow range of DFIRE energies of decoys relative to the energy difference between native state and decoys.
Thus, the ranks of native state energies (or success rates), the energies of native states, and Z-scores predicted by the energy functions extracted from all-α and all-β structures all indicate that DFIRE has a significantly smaller database dependence than either RAPDF or KBP. In addition to the databases of all-α and all-β structures, we also built the database of α+β and α/β structures. Because α+β and α/β structures contain the structural features of both α-helices and β-strands, one expects that the results based on the energy functions extracted from mixed α- and β-structural elements are closer to the results extracted from the structures of all proteins. Indeed, as Fig. 4 shows, the success rates predicted by the DFIRE potential extracted from the original database (1011 proteins, DFIRE-all; Zhou and Zhou, 2002) are closer to those by the potential extracted from α+β and α/β structures than those by the potentials from α- and β-databases. For example, at the top-10 ranking, the differences between the average success rates over rankings 1–10 are 2.4% between DFIRE-all and DFIRE-α, 2.4% between DFIRE-all and DFIRE-β, 1.1% between DFIRE-all and DFIRE-α+β, and 0.2% between DFIRE-all and DFIRE-α/β. The difference between the success rate given by DFIRE-all and that by DFIRE-α/β is the smallest. This is somewhat expected because the α/β structural class contains mixed elements of α-helices and β-strands whereas α+β structures do not mix these two structural elements. The database for all proteins should be more similar to a random mixture of α- and β-structural elements. The database independence of DFIRE potential further confirms the previous finding that the performance of DFIRE potential in structure selection is insensitive to the number of proteins used in the database (200 or more) and whether or not the target proteins are contained in training structural databases (Zhou and Zhou, 2002). It should be emphasized that the DFIRE potential is not only mostly database independent but also has higher success rates than RAPDF and KBP in either α-protein decoys or β-protein decoys.
FIGURE 4.

As in Fig. 1 but for the comparison of success rates given by the energy functions trained by α-proteins, β-proteins, α/β proteins, α+β proteins, and all proteins. The test sets are the decoy sets for 92 proteins.
Fig. 5 provides two examples of the pair potentials given by RAPDF, KBP, and DFIRE methods using three different structural databases. One is the potential between Cβ atoms of Leu and Asp and the other is between backbone N atom of Val and O atom of Trp. It is difficult, however, to judge the difference between the potentials extracted from different structural databases from the individual pair potential.
FIGURE 5.

The distance-dependent pair potential trained with the databases of α-proteins (dotted lines), β-proteins (dashed lines), and all proteins (solid lines). The left panel is between Cβ-atoms of Leu and ASP and the right panel is between backbone atom N of Val and O of Trp. The results for RAPDF, atomic KBP, and DFIRE are shown in top, middle, and bottom panels, respectively.
To further understand the source for the difference between the three methods, one can compare the reduced reference states 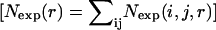 given by the methods. For both RAPDF and KBP,
 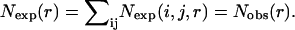 For DFIRE,
  . Thus, the database dependence of the reduced reference state in the DFIRE only comes from Nobs(r) at r = rcut, whereas it is Nobs(r) at all distance for RAPDF and KBP. Fig. 6 plots the ratio of Nexp(r) obtained from the α-protein database or the β-protein database to that from the 1011-protein database. Even though all reference states have the database dependence, the database dependencies of RAPDF and KBP are significantly larger than that of DFIRE. It should be noted that the database dependence of Nobs(rcut) is normal because the number of pairs at a certain distance is strongly dependent on the number of proteins. This dependence is apparently canceled by the database dependence of Nobs(i, j, r) in DFIRE. We emphasize that the distance dependence of the reduced reference state [Nexp(r)] is the same for RAPDF and KBP, but, the dependence of Nexp(i, j, r) on atomic types for RAPDF and KBP is different (see Eqs. 2 and 3).
FIGURE 6.

The ratio of the distance-dependent number of expected pair obtained from the α-protein database or the β-protein database to that from the all-protein database. RAPDF/KBP (solid and dashed lines) and DFIRE (dotted and dash-dotted lines).
CONCLUDING REMARKS
The examination of the database dependence of statistical energy functions is important for an accurate prediction of protein structures. An accurate energy function should be capable of folding proteins with α, β, or any other structural topologies. This requires the statistical energy function to be independent of the structural database used for energy extraction. Here, the database dependences of RAPDF, atomic KBP, and DFIRE are examined based on their performance on structure selections. It is shown that the DFIRE potential is the least dependent on the structural database used for energy derivation, compared to RAPDF and atomic KBP. The significant database dependence of all-atom KBP/RAPDF statistical potentials confirms the previous finding for the database dependence of the residue-level Sippl potential with smaller databases of different structural classes (Furuichi and Koehl, 1998). The origin of significant database dependence for RAPDF and atomic KBP is likely due to significant database dependence of their reference states. This highlights the importance of choosing an appropriate reference state for deriving statistical energy function. The mostly independent DFIRE energy function on the structural database, together with the independence of its performance for the systems with various amino-acid compositions (surface vs. core, monomer vs. dimeric interface; Zhou and Zhou, 2002, 2003; Liu et al., 2004), indicates that a physical reference state produces not only a physically but also a quantitatively more accurate statistical energy function.
Acknowledgments
We thank Professor Charles L. Brooks and Professor Michael Feig for the CASP4 decoy sets.
This work is supported by the National Institutes of Health (R01 GM 966049 and R01 GM 068530); a grant from the Howard Hughes Medical Institute to the State University of New York, Buffalo; and by the Center for Computational Research and the Keck Center for Computational Biology at the State University of New York, Buffalo.
References
- Altuvia, Y., O. Schueler, and H. Margalit. 1995. Ranking potential binding peptides to MHC molecules by a computational threading approach. J. Mol. Biol. 249:244–250. [DOI] [PubMed] [Google Scholar]
- Bryant, S. H., and C. E. Lawrence. 1993. An empirical energy function for threading protein sequence through the folding motif. Proteins. 16:92–112. [DOI] [PubMed] [Google Scholar]
- Casari, G., and M. J. Sippl. 1992. Structure-derived hydrophobic potential. Hydrophobic potential derived from x-ray structures of globular proteins is able to identify native folds. J. Mol. Biol. 224:725–732. [DOI] [PubMed] [Google Scholar]
- Conte, L. L., S. E. Brenner, T. J. P. Hubbard, C. Chothia, and A. Murzin. 2002. SCOP database in 2002: refinements accommodate structural genomics. Nucl. Acid Res. 30:264–267. [DOI] [PMC free article] [PubMed] [Google Scholar]
- Feig, M., and C. L. Brooks III. 2002. Evaluating CASP4 predictions with physical energy functions. Proteins. 49:232–245. [DOI] [PubMed] [Google Scholar]
- Friedman, H. L. 1985. A Course in Statistical Mechanics. Prentice-Hall, Englewood Cliffs, New Jersey.
- Furuichi, E., and P. Koehl. 1998. Influence of protein structure databases on the predictive power of statistical pair potentials. Proteins. 31:139–149. [DOI] [PubMed] [Google Scholar]
- Gilis, D., and M. Rooman. 1996. Stability changes upon mutation of solvent-accessible residues in proteins evaluated by database-derived potentials. J. Mol. Biol. 257:1112–1126. [DOI] [PubMed] [Google Scholar]
- Gilis, D., and M. Rooman. 1997. Predicting protein stability changes upon mutation using database-derived potentials: solvent accessibility determines the importance of local versus non-local interactions along the sequence. J. Mol. Biol. 272:276–290. [DOI] [PubMed] [Google Scholar]
- Glaser, F., D. Sternberg, I. Vasker, and N. Ben-Tal. 2001. Residue frequencies and pairing preferences at protein-protein interfaces. Proteins. 43:89–102. [PubMed] [Google Scholar]
- Godzik, A., A. Kolinski, and J. Skolnick. 1995. Are proteins ideal mixtures of amino acids? Analysis of energy parameter sets. Protein Sci. 4:2107–2117. [DOI] [PMC free article] [PubMed] [Google Scholar]
- Hendlich, M., P. Lackner, S. Weitckus, H. Floeckner, R. Froschauer, K. Gottsbacher, G. Casari, and M. J. Sippl. 1990. Identification of native protein folds amongst a large number of incorrect models. The calculation of low energy conformations from potentials of mean force. J. Mol. Biol. 216:167–180. [DOI] [PubMed] [Google Scholar]
- Hobohm, U., M. Scharf, R. Schneider, and C. Sander. 1992. Selection of representative protein data sets. Protein Sci. 1:409–417. [DOI] [PMC free article] [PubMed] [Google Scholar]
- Jernigan, R. L., and I. Bahar. 1996. Structure-derived potentials and protein simulations. Curr. Opin. Struct. Biol. 6:195–209. [DOI] [PubMed] [Google Scholar]
- Jones, D. T., W. R. Taylor, and J. M. Thornton. 1992. A new approach to protein fold recognition. Nature. 358:86–89. [DOI] [PubMed] [Google Scholar]
- Kabsch, W., and C. Sander. 1983. Dictionary of protein secondary structure: pattern recognition of hydrogen-bonded and geometrical features. Biopolymers. 22:2577–2637. [DOI] [PubMed] [Google Scholar]
- Keasar, C., and M. Levitt. 2003. A novel approach to decoy set generation: designing a physical energy function having local minima with native structure characteristics. J. Mol. Biol. 329:159–174. [DOI] [PMC free article] [PubMed] [Google Scholar]
- Lee, J., A. Liwo, and H. A. Scheraga. 1999. Energy-based de novo protein folding by conformational space annealing and an off-lattice united-residue force field: application to the 10–55 fragment of staphylococcal protein A and to apo calbindin D9K. Proc. Natl. Acad. Sci. USA. 96:2025–2030. [DOI] [PMC free article] [PubMed] [Google Scholar]
- Liu, S., C. Zhang, H. Zhou, and Y. Zhou. 2004. A physical reference state unifies the structure-derived potential of mean force for protein folding and binding. Proteins. In press. [DOI] [PubMed]
- Loose, C., J. Klepeis, and C. Floudas. 2004. A new pairwise folding potential based on improved decoy generation and side chain packing. Proteins. 54:303–314. [DOI] [PubMed] [Google Scholar]
- Lu, H., L. Lu, and J. Skolnick. 2003. Development of unified statistical potentials describing protein-protein interactions. Biophys. J. 84:1895–1901. [DOI] [PMC free article] [PubMed] [Google Scholar]
- Lu, H., and J. Skolnick. 2001. A distance-dependent atomic knowledge-based potential for improved protein structure selection. Proteins. 44:223–232. [DOI] [PubMed] [Google Scholar]
- Luthy, R., J. U. Bowie, and D. Eisenberg. 1992. Assessment of protein models with three-dimensional profiles. Nature. 356:83–85. [DOI] [PubMed] [Google Scholar]
- MacArthur, M. W., R. A. Laskowski, and J. M. Thornton. 1994. Knowledge-based validation of protein structure coordinates derived by x-ray crystallography and NMR spectroscopy. Curr. Opin. Struct. Biol. 4:731–737. [Google Scholar]
- Melo, F., and E. Feytmans. 1998. Assessing protein structures with a non-local atomic interaction energy. J. Mol. Biol. 277:1141–1152. [DOI] [PubMed] [Google Scholar]
- Melo, F., R. Sanchez, and A. Sali. 2002. Statistical potentials for fold assessment. Protein Sci. 430:430–448. [DOI] [PMC free article] [PubMed] [Google Scholar]
- Mitchell, J. B. O., R. A. Laskowski, A. Alex, and J. M. Thornton. 1999. BLEEP—potential of mean force describing protein-ligand interactions. I. Generating potential. J. Comp. Chem. 20:1165–1176. [Google Scholar]
- Miyazawa, S., and R. L. Jernigan. 1999. An empirical energy potential with a reference state for protein fold and sequence recognition. Proteins. 36:357–369. [PubMed] [Google Scholar]
- Moont, G., H. Gabb, and M. Sternberg. 1999. Use of pair potentials across protein interfaces in screening predicted docked complexes. Proteins. 35:364–373. [PubMed] [Google Scholar]
- Moult, J. 1997. Comparison of database potentials and molecular mechanics force fields. Curr. Opin. Struct. Biol. 7:194–199. [DOI] [PubMed] [Google Scholar]
- Murzin, A. G., S. E. Brenner, T. Hubbard, and C. Chothia. 1995. SCOP: a structural classification of proteins database for the investigation of sequences and structures. J. Mol. Biol. 247:536–540. [DOI] [PubMed] [Google Scholar]
- Ofran, Y., and B. Rost. 2003. Analyzing six types of protein-protein complexes. J. Mol. Biol. 325:377–387. [DOI] [PubMed] [Google Scholar]
- Park, B., and M. Levitt. 1996. Energy functions that discriminate x-ray and near-native folds from well-constructed decoys. J. Mol. Biol. 258:367–392. [DOI] [PubMed] [Google Scholar]
- Pearson, W. R. 1990. Rapid and sensitive sequence comparison with FASTP and FASTA. Methods Enzymol. 183:63–98. [DOI] [PubMed] [Google Scholar]
- Pearson, W. R., and D. J. Lipman. 1988. Improved tools for biological sequence comparison. Proc. Natl. Acad. Sci. USA. 85:2444–2448. [DOI] [PMC free article] [PubMed] [Google Scholar]
- Pellegrini, M., and S. Doniach. 1993. Computer simulation of antibody binding specificity. Proteins. 15:436–444. [DOI] [PubMed] [Google Scholar]
- Pillardy, J., C. Czaplewski, A. Liwo, J. Lee, D. R. Ripoll, R. Kamierkiewicz, S. Oldziej, W. J. Wedemeyer, K. D. Gibson, Y. A. Arnautova, J. Saunders, Y.-J. Ye, and H. A. Scheraga. 2001. Recent improvements in prediction of protein structure by global optimization of a potential energy function. Proc. Natl. Acad. Sci. USA. 98:2329–2333. [DOI] [PMC free article] [PubMed] [Google Scholar]
- Rojnuckarin, A., and S. Subramaniam. 1999. Knowledge-based interaction potentials for proteins. Proteins. 36:54–67. [DOI] [PubMed] [Google Scholar]
- Samudrala, R., and J. Moult. 1998. An all-atom distance-dependent conditional probability discriminatory function for protein structure prediction. J. Mol. Biol. 275:895–916. [DOI] [PubMed] [Google Scholar]
- Samudrala, R., Y. Xia, M. Levitt, and E. Huang. 1999. A combined approach for ab initio construction of low resolution protein tertiary structures from sequence. Pac. Symp. Biocomput. 4:505–506. [DOI] [PubMed] [Google Scholar]
- Simons, K. T., R. Bonneau, I. Ruczinski, and D. Baker. 1999. Ab initio protein structure prediction of CASP III targets using ROSETTA. Proteins. 37:171–176. [DOI] [PubMed] [Google Scholar]
- Simons, K. T., C. Kooperberg, E. Huang, and D. Baker. 1997. Assembly of protein tertiary structures from fragments with similar local sequences using simulated annealing and Bayesian scoring functions. J. Mol. Biol. 268:209–225. [DOI] [PubMed] [Google Scholar]
- Sippl, M. J. 1990. Calculation of conformational ensembles from potentials of mean force. An approach to the knowledge-based prediction of local structures in globular proteins. J. Mol. Biol. 213:859–883. [DOI] [PubMed] [Google Scholar]
- Sippl, M. J. 1993. Recognition of errors in three-dimensional structures of proteins. Proteins. 17:355–362. [DOI] [PubMed] [Google Scholar]
- Skolnick, J., A. Kolinski, and A. R. Ortiz. 1997. MONSSTER: a method for folding globular proteins with a small number of distance restraints. J. Mol. Biol. 265:217–241. [DOI] [PubMed] [Google Scholar]
- Sun, S. 1993. Reduced representation model of protein structure prediction: statistical potential and genetic algorithms. Protein Sci. 2:762–785. [DOI] [PMC free article] [PubMed] [Google Scholar]
- Tanaka, S., and H. A. Scheraga. 1976. Medium- and long-range interaction parameters between amino acids for predicting three-dimensional structures of proteins. Macromolecules. 9:945–950. [DOI] [PubMed] [Google Scholar]
- Tobi, D., and R. Elber. 2000. Distance-dependent, pair potential for protein folding: results from linear optimization. Proteins. 41:40–46. [PubMed] [Google Scholar]
- Vendruscolo, M., L. A. Mirny, E. I. Shakhnovich, and E. Domany. 2000. Comparison of two optimization methods to derive energy parameters for protein folding: perception and Z-score. Proteins. 41:192–201. [PubMed] [Google Scholar]
- Vijayakumar, M., and H.-X. Zhou. 2000. Prediction of residue-residue pair frequencies in proteins. J. Phys. Chem. B. 104:9755–9764. [Google Scholar]
- Wallqvist, A., R. L. Jernigan, and D. G. Covell. 1995. A preference-based free energy parameterization of enzyme-inhibitor binding. Applications to HIV-1-protease inhibitor design. Protein Sci. 4:1881–1903. [DOI] [PMC free article] [PubMed] [Google Scholar]
- Xia, Y., E. S. Huang, M. Levitt, and R. Samudrala. 2000. Ab initio construction of protein tertiary structures using a hierarchical approach. J. Molec. Biol. 300:171–185. [DOI] [PubMed] [Google Scholar]
- Zhang, C., and S. Kim. 2000. Environment-dependent residue contact energies for proteins. Proc. Natl. Acad. Sci. USA. 97:2550–2555. [DOI] [PMC free article] [PubMed] [Google Scholar]
- Zhang, C., G. Vasmatzis, J. Cornette, and C. DeLisi. 1997. Determination of atomic desolvation energies from the structures of crystallized proteins. J. Mol. Biol. 267:707–726. [DOI] [PubMed] [Google Scholar]
- Zhou, H., and Y. Zhou. 2002. Distance-scaled, finite ideal-gas reference state improves structure-derived potentials of mean force for structure selection and stability prediction. Protein Sci. 11:2714–2726. [DOI] [PMC free article] [PubMed] [Google Scholar]
- Zhou, H., and Y. Zhou. 2003. Quantifying the effect of burial of amino acid residues on protein stability. Proteins. 54:15–22. [DOI] [PubMed] [Google Scholar]
- Zhou, H., and Y. Zhou. 2004. Single-body knowledge-based energy score combined with sequence-profile and secondary structure information for fold recognition. Proteins. 55:1005–1013. [DOI] [PubMed] [Google Scholar]