

Abstract
F1-ATPase is a rotary molecular motor in which the central γ-subunit rotates inside a cylinder made of α3β3-subunits. The rotation is driven by ATP hydrolysis in three catalytic sites on the β-subunits. How many of the three catalytic sites are filled with a nucleotide during the course of rotation is an important yet unsettled question. Here we inquire whether F1 rotates at extremely low ATP concentrations where the site occupancy is expected to be low. We observed under an optical microscope rotation of individual F1 molecules that carried a bead duplex on the γ-subunit. Time-averaged rotation rate was proportional to the ATP concentration down to 200 pM, giving an apparent rate constant for ATP binding of 2 × 10⁷ M−1s−1. A similar rate constant characterized bulk ATP hydrolysis in solution, which obeyed a simple Michaelis-Menten scheme between 6 mM and 60 nM ATP. F1 produced the same torque of ∼40 pN·nm at 2 mM, 60 nM, and 2 nM ATP. These results point to one rotary mechanism governing the entire range of nanomolar to millimolar ATP, although a switchover between two mechanisms cannot be dismissed. Below 1 nM ATP, we observed less regular rotations, indicative of the appearance of another reaction scheme.
INTRODUCTION
F1-ATPase is a rotary molecular motor made of a single protein molecule (composed of several subunits). Its unidirectional rotation, driven by ATP hydrolysis, has been demonstrated under an optical microscope (Noji et al., 1997). In vivo, the F1 motor is connected to a membrane-embedded Fo (“ef-ou” for oligomycin sensitivity conferring factor; see Kagawa and Racker, 1966) complex to constitute the ATP synthase, which synthesizes ATP from ADP and inorganic phosphate to support cellular activities (for reviews, see, e.g., Boyer, 1997; Yoshida et al., 2001; Weber and Senior, 2003). When protons flow through the Fo portion of ATP synthase, the F1 motor is forced to rotate in its reverse direction; the chemical reaction in the catalytic sites of F1 is also reversed, resulting in the synthesis of ATP. This scenario of rotational synthesis was suggested two decades ago (Boyer and Kohlbrenner, 1981; Oosawa and Hayashi, 1986), and now one sees experimentally that proton flow indeed leads to reverse rotation of F1 (Diez et al., 2004) and that reverse rotation of isolated F1 by a human artifact leads to ATP synthesis (Itoh et al., 2004). The ATP synthase is a reversible molecular machine in which the two reactions, proton translocation (in the direction from Fo to F1) and ATP hydrolysis, couple with each other in an opposing fashion and can be balanced (Turina et al., 2003). Molecular mechanisms of the coupling between proton flow and rotation, and between rotation and ATP synthesis/hydrolysis, are yet to be worked out in detail.
The ATP-driven rotation in isolated F1, without Fo, has been characterized relatively well (Kinosita et al., 2000a,b, 2004). Much of the work has been done on the minimal subcomplex of F1 consisting of seven subunits, α3β3γ, in which γ, the rotor, is surrounded by a stator cylinder made of three α and three β subunits arranged alternately (Abrahams et al., 1994). In this article, we call this subcomplex as F1. The central γ rotates counterclockwise when viewed from the Fo side (Noji et al., 1997), in 120° steps each driven by hydrolysis of one ATP molecule (Yasuda et al., 1998). The rotary torque is almost independent of the rotary angle (Kinosita et al., 2000a), and the mechanical work done in a 120° step amounts to ∼90 pN·nm (Yasuda et al., 1998), comparable to the free energy obtained by hydrolyzing one ATP molecule and thus suggesting a near 100% efficiency (but see Kinosita et al., 2004). The 120° step is resolved into 80–90° and 40–30° substeps (Yasuda et al., 2001; Shimabukuro et al., 2003; Nishizaka et al., 2004), separated by at least two chemical reactions each taking ∼1 ms (Yasuda et al., 2001). The 80–90° substep is driven by ATP binding, and the 40–30° substep likely by the release of a hydrolysis product (Yasuda et al., 2001). ATP is hydrolyzed in one of the two 1-ms reactions between substeps (Shimabukuro et al., 2003).
The hydrolysis (and synthesis) of ATP occurs in three catalytic sites, each hosted primarily by a β-subunit (Abrahams et al., 1994). A major unanswered question is how the stepwise rotation is coupled to distinct chemical reactions in the three sites. Even the site occupancy, the number of catalytic sites filled with a nucleotide during rotation, is yet in dispute. We suggested a bi-site mechanism in which the occupancy alternates between one and two, on the basis of Michaelis-Menten dependence of the rotation rate on the ATP concentration, [ATP], down to 20 nM (Yasuda et al., 2001). This view has been seriously questioned by Senior and colleagues, who introduced a tryptophan residue in the catalytic sites of Escherichia coli F1 to probe the site occupancy (Weber et al., 1993): when the concentration of a substrate (ATP or ITP) was lowered, hydrolysis activity decreased disproportionately faster than the nucleotide concentration, and the activity was proportional to the fraction of F1 with three sites filled (Weber and Senior, 2001), indicating that tri-site filling is a must for hydrolysis activity. With F1 of thermophilic origin that we use, tryptophan mutation has suggested a similar conclusion (Ren and Allison, 2000; Ono et al., 2003). A crystal structure in which three sites are filled with a nucleotide (Menz et al., 2001) supports the tri-site view. When binding of a fluorescent ATP analog was imaged under a microscope, the nucleotide remained bound for at least 240° of rotation (Nishizaka et al., 2004), indicating an occupancy number of two or more for the ATP analog. A complication, however, exists in that F1-ATPase tends to be inhibited by binding MgADP tightly (Jault et al., 1996; Matsui et al., 1997; Hirono-Hara et al., 2001) and the fraction of inhibited enzyme, often a majority, is difficult to assess. Bulk experiments could report properties of the inhibited form(s). Boyer (2002) maintains that bi-site activation is fundamental and retention of ADP could explain the apparent tri-site filling.
Here we have investigated the rotational properties of F1 at low [ATP]s, down to 200 pM. Unlike solution studies with an unknown fraction of inhibited enzyme, imaging of individual rotations focuses only on active molecules. Our expectation was that the time-averaged rotation rate would decrease disproportionately faster than the reduction in [ATP], as reported for hydrolysis by Weber and Senior (2001). Actually, the rotation rate was found to be proportional to [ATP] down to 200 pM. If this rotation occurred in a tri-site mode, the enzyme must have kept two nucleotides extremely tightly, with a dissociation constant of ∼1 nM or less.
MATERIALS AND METHODS
Unless stated otherwise, operations described below were done at room temperature (23–25°C), and solutions were at pH 7.0. When MgATP was present in a medium, [Mg2+] was always 2 mM in excess over [ATP].
Preparation of F1
A mutant (α-C193S, β-His10 at amino terminus, γ-S107C, γ-I210C) α3β3γ subcomplex derived from a thermophilic Bacillus PS3 was purified as described (Adachi et al., 2003) with some modifications. Supernatant of cell lysate was heat-treated at 65°C for 10–15 min followed by centrifugation. The supernatant was applied to a Ni-NTA Superflow column (Qiagen, Hilden, Germany) equilibrated with 40 mM imidazole and 100 mM KCl, with the addition of 50 mM potassium phosphate to aid removal of the endogenously bound nucleotides (Noji et al., 2001). The column was washed with five column volumes of the same solution with imidazole at 100 mM, and the enzyme was eluted by raising the imidazole concentration to 500 mM. Ammonium sulfate was added to the final concentration of 10% saturation, and the solution was applied to a butyl-Toyopearl column (Tosoh, Tokyo) equilibrated with 2 mM EDTA, 50 mM Tris-HCl, 100 mM potassium phosphate, and 10% saturated ammonium sulfate. Bound nucleotides were removed by washing the column with 40 volumes of the same solution, and the enzyme was eluted with 2 mM EDTA, 50 mM Tris-HCl (pH 8.0), and ammonium sulfate at successive concentrations of 5, 3, 2, 1, and 0% saturation. The enzyme in the major fraction, normally at 2%, was stored at 4°C as precipitate in 70% saturated ammonium sulfate containing 1 mM dithiothreitol (DTT). Before use, the precipitate was dissolved in 100 mM potassium phosphate, 2 mM EDTA, and 1 mM DTT, and was incubated overnight at 4°C. To remove DTT and possible denatured enzyme, the sample was passed through a size exclusion column (Superdex 200 HR 10/30; Amersham Biosciences, Piscataway, NJ) equilibrated with 100 mM potassium phosphate and 2 mM EDTA. The concentration of F1 was determined from the absorbance at 280 nm of 0.45 per mg/ml (Matsui et al., 1997), assuming the molecular weight of 356,000.
The nucleotides that remained on F1 were assessed as follows: 100 μl of F1 at a few μM was mixed with 5 μl of 24% (w/w) perchloric acid. After incubation for 5 min at room temperature, 5 μl of 1 M K2CO3 was added to neutralize the suspension. After 5-min incubation on ice and centrifugation, 50 μl of the supernatant was applied to a reverse phase column (TSK-GEL ODS-80Ts, Tosoh) equilibrated with 100 mM potassium phosphate (pH 6.8). Nucleotides (ATP or ADP) were undetectable, indicating that <0.05 mol nucleotide was bound per mol of F1.
F1 was biotinylated at two cysteines (γ-S107C, γ-I210C) by incubation with fourfold molar excess of 6-{N′-[2-(N-maleimido)ethyl]-N-piperazinylamido}hexyl D-biotinamide (Dojindo, Kumamoto, Japan) for 1 h at room temperature. Unbound biotin was removed with Superdex 200 HR 10/30 equilibrated with 100 mM sodium phosphate and 2 mM EDTA. Biotinylated F1 was frozen with liquid nitrogen and stored at −80°C.
Hydrolysis activity
The ATP hydrolysis activity of F1 was measured before biotinylation. Because phosphate exerts subtle but complicated effects on the hydrolysis kinetics (R. Shimo-Kon, unpublished) and free phosphate was absent in rotation assays, phosphate in the F1 sample was removed on the size exclusion column above equilibrated with 100 mM KCl and 10 mM 3-(N-morpholino)propanesulfonic acid (MOPS)-KOH at pH 7.0.
ATP hydrolysis by F1 was followed by coupling the reaction with the oxidation of NADH through an ATP-regenerating system and monitoring the disappearance of NADH from the absorbance at 340 nm (Matsui et al., 1997). The assay mixture contained 0.15 mM NADH, 2.5 mM phosphoenolpyruvate, 0.5 mg/ml pyruvate kinase (rabbit muscle, Roche Diagnostics, Mannheim, Germany; glycerol solution) supplemented with 3.3 mg/ml of the same enzyme (rabbit muscle, Sigma-Aldrich, St Louis, MO; powder with an activity lower than that of the Roche enzyme) to ensure rapid regeneration, and 0.05 mg/ml lactate dehydrogenase (hog muscle, Roche) in buffer A (10 mM MOPS-KOH, 50 mM KCl, 2 mM MgCl2). After adding a desired amount of MgATP to 1.6 ml of the assay solution in a thermostatted (25°C) spectrophotometer (U-3300, Hitachi, Tokyo), reaction was initiated by rapid addition with a cuvette mixer of phosphate-free F1 (01.5–1.5 μM) to a final concentration of 1.5–15 nM. The rate of ATP hydrolysis was estimated between 2 and 5 s after the mixing.
Ni2+-nitrilotriacetic acid (Ni-NTA) surface
Coverslips to serve as the bottom of an observation chamber were functionalized with Ni-NTA essentially as described (Itoh et al., 2004). Glass coverslips (Micro Cover Glass, No.1, 24 × 32 mm2, Matsunami, Osaka) were immersed in 20N KOH for ∼13 h, washed with water, immersed in 0.02% (v/v) acetic acid containing 2% (v/v) 3-mercaptopropyltrimethoxysilane (TSL8380, Toshiba GE Silicone, Tokyo) at 90°C for 1 h, washed with water, and baked at 120°C for 10 min. After cooling to room temperature, the SH groups of the silane on the glass surface were reduced with 100 mM DTT for 10 min, washed with water, reacted with 20 mg/ml N-[5-(3′-maleimidopropylamido)-1-carboxypentyl]iminodiacetic acid (Dojindo) in 10 mM MOPS-KOH for 30 min, washed with water, reacted with 10 mM NiCl2 for 10 min, and washed with water. Ni-NTA coated coverslips were stored in air at room temperature until use.
Rotation assay
A flow chamber was constructed of two coverslips, a Ni-NTA coated bottom (24 × 32 mm2) and an uncoated top (18 × 18 mm2; Matsunami), which were separated by ∼50-μm spacers. For rotation assays at 600 nM ATP or below, biotinylated F1 (1–333 nM) was preincubated for 1 h in a test tube with 2 or 6 μM MgATP in buffer A containing an ATP-regenerating system consisting of 0.2 mg/ml creatine kinase (rabbit muscle, Roche) and 200 mM creatine phosphate (Roche). The preincubated F1 was diluted with buffer B (buffer A plus 1 mM creatine phosphate and creatine kinase at 2 μg/ml for 200–600 pM ATP and 20 μg/ml for 2 nM ATP or above) to adjust [F1] to 0.1 nM and [ATP] to a desired final level between 0.2–600 nM. This solution was infused into the flow chamber. After 10 min, unbound F1 was washed out with five chamber volumes of buffer C (buffer B containing the same desired level of MgATP). For [ATP] above 600 nM, the preincubation was omitted, and the washing was with buffer A except that buffer C was infused at the end. Streptavidin-coated beads (nominal diameter 0.287, 0.49, or 0.95 μm, Seradyn, Indianapolis, IN, or Bangs, Fishers, IN), washed with buffer A to remove preservatives and suspended at ∼0.1% (w/w) in solution C containing 5 mg/ml BSA (“ultrapure”, Nacalai Tesque, Kyoto), were infused into the F1-containing chamber. After 30 min, unbound beads were washed out with 10 chamber volumes of buffer C. Finally, the flow chamber was sealed with silicone grease to avoid evaporation.
Bead rotation was observed at 23 ± 0.2°C on an inverted phase-contrast microscope (IX70, Olympus, Tokyo) using a 100× objective (numerical aperture 1.35, Ph3, Olympus). Images were captured with a charge-coupled-device camera (CCD-300-RC, Dage-MTI, Michigan, IN) and recorded on an 8-mm video tape at 30 frames s−1 (EVO-9720, Sony, Tokyo). Centroids of bead images were calculated as described (Yasuda et al., 2001).
To ensure that the low ATP concentrations that we adopted were correct, we estimated the contaminant ATP level in buffer B by luciferin-luciferase assay (DeLuca and McElroy, 1978; Itoh et al., 2004) using a luminometer (BSL-100, Hamamatsu Photonics, Hamamatsu, Japan). Free ATP in buffer B was <20 pM in experiments at 200 or 600 pM ATP and <500 pM at 2 nM ATP or above (creatine kinase was different). To achieve these low levels, creatine kinase and creatine phosphate, the major sources of contamination, had to be selected lot by lot.
RESULTS
Preincubation with ATP increases the number of rotating molecules
In our experience, the probability of finding a rotating F1 molecule on a glass surface is noticeably low at [ATP] below ∼1 μM for an unknown reason. Once a rotating F1 is found, however, it continues to rotate for many turns at an average speed that is proportional to [ATP] at least down to 20 nM (Yasuda et al., 1998, 2001). In this study where we wanted to work at even lower ATP concentrations, the low probability of rotation seriously hampered experiment. In our attempts to circumvent this problem, we found that preincubation with ATP increases the rotation probability significantly.
The effect was assessed quantitatively in a preliminary experiment made under slightly different buffer conditions. We incubated 300 nM biotinylated F1 with or without 6 μM MgATP for 1 h in the presence of the ATP-regenerating system as described in Methods. After dilution to 1 nM F1 and 20 nM MgATP (MgATP was added to the control at this point), the solution was infused into an observation chamber. Paramagnetic beads (diameter 0.7 μm, Seradyn) in a buffer at pH 7.6 were infused, and the chamber was washed with buffer A containing 20 nM MgATP, 2.5 mM creatine phosphate, and 0.2 mg/ml creatine kinase. We searched for rotating beads in ten fields of view per chamber, taking ∼2 min for each field (3 × 103 μm2). A bead that made three or more revolutions in the 2 min was judged active. For the sample preincubated with 6 μM ATP, we found in five chambers 1728 beads, of which 4% (68 beads) rotated. In the control preincubated without ATP, rotating beads were only 0.2% (five out of 2358 beads). Preincubation had to be long: after 1-min preincubation, we found only one rotating bead out of 458 (0.2%). The effect of preincubation lasted at least for 2 h: we did not notice a clear tendency toward inactivation in the sample preincubated with ATP. The speed of rotating beads was not affected by the ATP preincubation. In the results that we report below, all rotation assays at [ATP] of 600 nM or below were made after ATP preincubation, as described in Methods.
Average rotation rate is proportional to [ATP] down to 200 pM
We imaged rotation of F1 that was attached to a Ni-NTA treated glass surface (Itoh et al., 2004) through 10 histidines introduced at the N-terminus of the three β-subunits (Noji et al., 1997). To visualize rotation, we attached a streptavidin-coated polystyrene bead(s) to the central γ-subunit that had been biotinylated at two cysteines. We searched for a rotating F1 that happened to bind a bead duplex, which shows clearer rotation than a single bead, and recorded the rotation for up to 2 h. The centroid of the image of the bead duplex was calculated as described (Yasuda et al., 2001), from which the time course of rotation was constructed as in Fig. 1.
FIGURE 1.
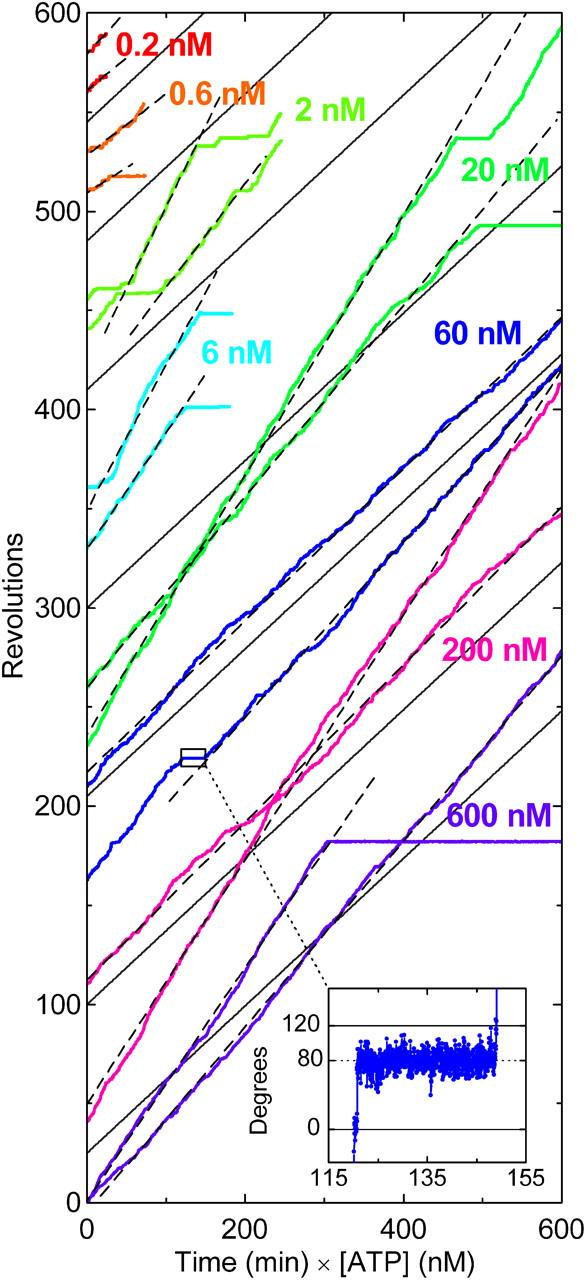
Time courses of F1 rotation at different [ATP]s. Rotation records of the fastest two bead duplexes (0.287 μm) at each [ATP] are selected and shown. Dashed lines indicate the slope estimated on an uninterrupted portion (>50 consecutive revolutions for [ATP] ≥ 2 nM, and >7 revolutions at 200 and 600 pM ATP); rotation rates plotted in Fig. 2 are estimated in this way. Solid gray lines have the slope of 0.37 revolutions min−1 nM−1, corresponding to the apparent rate constant for ATP binding,  of 1.9 × 10⁷ M−1s−1 estimated from data including more bead duplexes (red line in Fig. 2). Note that the horizontal axis is time times [ATP]. Inset shows a magnified portion of the blue curve (60 nM ATP), indicating that the long pause occurred ∼80° ahead of an ATP-waiting angle.
A major concern in this study was to ensure that the low concentrations of ATP we worked with were set reliably. We used beads rather than actin filaments that were used in earlier studies for visualization of rotation (Noji et al., 1997; Yasuda et al., 1998), because actin filaments might release ATP, or ADP that would be converted to ATP by the ATP-regenerating system. We selected the ATP preincubation conditions such that, after dilution, the ATP level would match that in the final rotation assay; the preincubation might have been more effective if we had increased [ATP] during incubation to a higher level. Also, we measured the amount of contaminant ATP, mostly from the ATP-regenerating system, in the final assay medium. The actual [ATP] may have been higher by at most 25% at nominal 2 nM, and at most 10% in all other cases (see Methods).
Fig. 1 compiles rotation time courses of 0.287-μm bead duplexes at 0.2–600 nM ATP. The horizontal axis is time times [ATP], and thus the figure shows that the rotation rate is basically proportional to [ATP] more than three decades of magnitude down to 200 pM. This implies that ATP binding was rate limiting in this concentration range. Indeed, the rotation was resolved into 120° steps, the dwells between steps representing the ATP-waiting state, except at the highest [ATP] where stepping was not always clear and in the subnanomolar range where the rotation tended to be irregular (see below).
In Fig. 1, data for two bead duplexes that showed the fastest rotation at each [ATP] are selected and shown. We focus on fast bead duplexes, because slower motion can be easily explained by surface obstructions or surface denaturation, whereas fast rotation that sustained for >50 revolutions (>7 revolutions at 600 and 200 pM ATP) is unlikely to represent a statistical exception. Slow beads often showed short pauses at a particular angle(s), suggesting surface obstruction. Fast beads also fell into a long pause occasionally, but the pause angle was usually ∼80° ahead of an ATP-waiting position (Fig. 1, inset), indicating that the pause was due to the MgADP inhibition (Hirono-Hara et al., 2001). When a fast bead duplex recovered from the inhibited state, it normally resumed fast rotation (Fig. 1). In general, fast bead duplexes always rotate fast, whereas sluggish ones almost never show fast rotations except for up to a few fast revolutions that happen rarely.
In Fig. 2, we summarize time-averaged rotation rates of all bead duplexes that made >20 continual revolutions (mostly >100; >7 revolutions at 600 and 200 pM ATP) without a clearly irregular interruption. The trend that the rate is proportional to [ATP] is reconfirmed, although the rotation rates averaged over several bead duplexes are slightly lower than the rates in Fig. 1. The rotation rate for the 0.49-μm bead duplexes saturates above 1 μM ATP, because hydrodynamic friction against the larger beads sets the upper limit for the rotation rate (Yasuda et al., 1998) at ∼3 revolutions s−1. In the linear range, the slope is 6–7 revolutions μM−1s−1 for both bead duplexes, indicating an apparent rate constant of ATP binding,  of 2 × 10⁷ M−1s−1. This value is in good accord with the previous estimates using an actin filament (1.5 × 10⁷ M−1s−1; Yasuda et al., 1998) or a 40-nm colloidal gold (2.6 × 10⁷ M−1s−1; Yasuda et al., 2001). With the colloidal gold for which hydrodynamic friction is negligible, the rotation rate obeys Michaelis-Menten kinetics with the Michaelis constant, Km, of ∼15 μM and maximal rate, vmax, of 129 revolutions s−1 (Yasuda et al., 2001; cyan squares in Fig. 2). This simple Michaelis-Menten kinetics has now been shown to cover a broad range of [ATP] from 200 pM to 6 mM. In particular, the linear portion in Fig. 2 indicates that the ATP that directly drives rotation is bound with the same rate constant,
  of 2 × 10⁷ M−1s−1 from 200 pM to at least ∼10 μM (rates at 600 and 200 pM ATP tended to be somewhat lower). There is no clear sign of switching between different rotary mechanisms, except possibly in the subnanomolar range as discussed below.
FIGURE 2.

[ATP] dependence of the time-averaged rotation rate v and ATP hydrolysis rate V. Red circles, rotation rates of 0.287-μm bead duplexes with their average shown in red squares; red line, a linear fit showing v/[ATP] = (6.2 ± 1.0)×106 revolutions M−1s−1, corresponding to the apparent rate constant for ATP binding,  of 1.9 × 10⁷ M−1s−1. Green circles and green squares, for 0.49-μm bead duplexes; green curve, a Michaelis-Menten fit with v = vmax[ATP]/([ATP]+Km), where vmax = 2.6 ± 0.4 revolutions s−1 and Km = 0.37 ± 0.13 μM, giving
  Red and green circles represent a time-averaged rotation rate over >50 consecutive revolutions (>20 at 2 nM, and >7 at 600 and 200 pM ATP). Error bars, where indicated, show SD that exceeds the size of the symbol. Cyan squares, the average rotation rate for a 40-nm colloidal gold (Yasuda et al., 2001); vmax = 129 ± 27 revolutions s−1 and Km = 15 ± 6 μM, giving
  Blue squares, one third of the average hydrolysis rate for two or three measurements (one at 6 mM ATP), error bars showing SD that exceeds the size of the symbol; blue line, a fit with V = Vmax[ATP]/([ATP]+Km) where Vmax = 223 ± 68 s−1 (without division by three) and Km = 16 ± 8 μM, giving
  Values here are mean ± SE.
Hydrolysis activity is parallel to rotary speed
In Fig. 2, blue squares show the initial rate of ATP hydrolysis measured in a cuvette. The rate was measured between 2–5 s after the addition of nucleotide-free F1, to minimize the effect of MgADP inhibition. For comparison with the rotation rate, one third of the hydrolysis rate is plotted in Fig. 2. As seen, the two rates are close to each other, indicating that three ATP molecules would be hydrolyzed per turn. In fact, the hydrolysis rate is slightly lower, apparently suggesting that one ATP molecule could sometimes drive two 120° steps. Our interpretation is that the hydrolysis rate measured in the bulk sample is the average including inhibited or inactive portion, whereas the rotation rate is estimated on a single molecule over a period of active rotation. Assuming that the inhibition was not too serious in the initial 2–5 s of the reaction, we anticipate that three, or slightly more than three, ATP molecules are hydrolyzed per turn. Precise correspondence between hydrolysis and rotation cannot be established unless one could somehow measure ATP hydrolysis in a single, rotating F1 molecule.
The hydrolysis rate in Fig. 2 can be fitted, to within experimental uncertainty, with a simple Michaelis-Menten curve (blue line). This result is different from the previous one where at least two sets of Michaelis constants were needed to fit the hydrolysis kinetics (Yasuda et al., 2001). The simpler kinetics here, with a somewhat lower rate at saturating [ATP], was obtained when phosphate was removed before hydrolysis measurement (R. Shimo-Kon, unpublished). The reason is unknown, but a similar result was obtained in the presence of a detergent lauryldimethylamine oxide (Yasuda et al., 2001), which is a suppressor of MgADP inhibition (Jault et al., 1996; Matsui et al., 1997), or with a mutant lacking noncatalytic nucleotide binding sites (Ono et al., 2003). Hydrolysis of GTP, less prone to the inhibition, also follows Michaelis-Menten kinetics (Noji et al., 2001). Except for the complication likely associated with the MgADP inhibition, hydrolysis kinetics also fails to suggest [ATP]-dependent switching between two different hydrolysis mechanisms.
Torque is independent of [ATP]
When a large probe such as a bead is attached to the γ-subunit, F1 has to rotate against viscous friction imposed on the probe. The torque N that F1 produces can be estimated directly from the rotary speed ω (in radians s−1):
 |
(1) |
where ξ is the frictional drag coefficient given, for the case of a spherical bead, by
 |
(2) |
where a is the bead radius, x the radius of rotation, i.e., the distance between the bead center and rotation axis, and η the viscosity of the medium (∼0.93 × 10⁻³ N s m−2 at 23°C). In the case of a bead duplex with radii of rotation x1 and x2, ξ is given by
 |
(3) |
Near a (glass) surface, viscous drag is higher than in the bulk (Hunt et al., 1994; Svoboda and Block, 1994), and thus Eqs. 2 and 3 would lead to an underestimate of the torque (Pänke et al., 2001). We do not correct for this surface effect, because the correction factor depends critically on the bead height, which we cannot estimate reliably. The torque values we report are thus likely underestimated.
With this principle, we inquired if the torque that F1 produces varies with [ATP]. We used 0.95-μm bead duplexes for this purpose, to better resolve stepping kinetics at the regular video rate of 30 frames s−1. First we recorded stepping rotation at 2 nM ATP, and then infused 60 nM ATP and observed the same bead duplex, and finally infused 2 mM ATP to record continuous rotation of the same bead duplex. In Fig. 3, we overlay 15 consecutive stepping records for each [ATP], all from the same bead duplex. The averages are shown in thick cyan lines, from the slope (straight red lines) of which we estimated the torque, using Eqs. 1 and 3, to be 46, 40, and 40 pN·nm at 2 mM, 60 nM, and 2 nM ATP, respectively. Another data set gave 37, 35, 37 pN·nm for the three ATP concentrations, a third gave 46 pN·nm at 2 mM ATP and 41 pN·nm at 2 nM ATP, and a fourth gave 43 pN·nm at 2 nM ATP. Because regularly stepping bead duplexes at 2 nM ATP were scarce and the infusions afterwards were not always successful, these are the only data we have obtained so far. Although the statistics may not be sufficient, we consider, taking previous results (Yasuda et al., 1998; Kinosita et al., 2000a) also into account, that the torque is ∼40 pN·nm from 2 mM to 2 nM ATP, again pointing to one rotary mechanism over mM-nM ATP.
FIGURE 3.
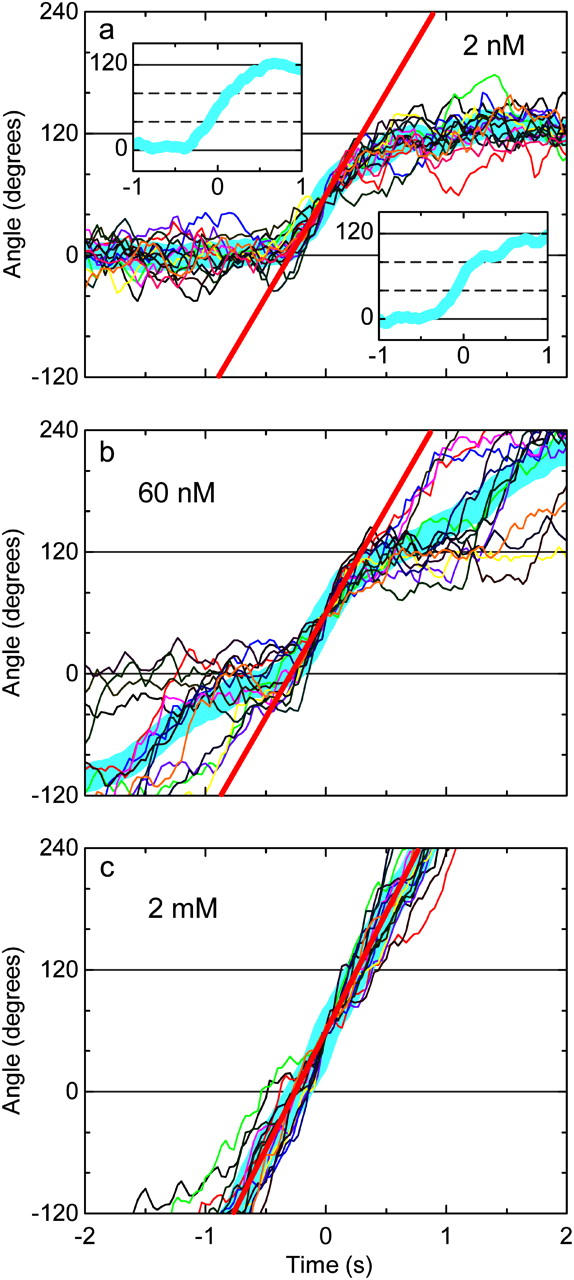
Magnified stepping records of a 0.95-μm bead duplex at 2 nM (a), 60 nM (b), and 2 mM (c) ATP. The same bead duplex was observed first at 2 nM ATP, then 60 nM, and finally at 2 mM. From each rotation record, contiguous 15 steps have been chosen and their central parts are overlaid in different colors, thick cyan line being the average. The angles in the vertical axes refer to three ATP-waiting angles identified at low [ATP]; individual step records have been shifted vertically by a multiple of 120° to obtain the overlap. Time zero for each step record was assigned by eye to the data point closest to 60°. Straight red lines indicate the slope of the average step record judged by eye: 0.56, 0.57, 0.65 revolutions s−1 at 2 nM, 60 nM, and 2 mM ATP, respectively, corresponding to the torque of 40, 40, and 46 pN·nm. Insets in a: upper left, the average over six steps that do not show a conspicuous pause at ∼80°; lower right, the average over the rest of nine steps.
The thick cyan line at 2 nM ATP in Fig. 3 is noticeably curved at the end of the 120° step, and the same trend is also seen at 60 nM ATP. This is due to the tendency of the bead duplex to pause for ∼1 s or less at the substep angle of ∼80°. In Fig. 3 a, the inset at lower right is the average of nine steps with a relatively clear pause, showing a flat portion at ∼80°. The inset at upper left is the average of the rest of six steps, showing continuous rise across 80°. The thick cyan line in Fig. 3 b is less curved, presumably because the ∼80° pause is terminated when the next ATP binds and drives the bead duplex toward 240°. The ∼80° pause is almost absent in Fig. 3 c (2 mM ATP). The pause duration varied among different bead duplexes, and some duplexes displayed frequent, short pauses even at 2 mM ATP. In general, larger beads, such as the 0.95-μm bead duplex in Fig. 3, often show clear pauses, whereas ∼80° pauses are much less conspicuous with smaller beads. This load dependence, together with the large variation among beads with the same size, suggest that these ∼80° pauses are not an intrinsic property of the F1 motor. Our interpretation is that a reaction(s) at the substep angle of ∼80°, possibly one of the two 1-ms reactions, is sensitive to mechanical hindrance: hydrodynamic or surface friction against rotation obstructs that reaction, implying that the reaction is coupled to a small degree of γ-rotation. We failed to notice these short pauses in experiments with a long actin filament (Yasuda et al., 1998; Kinosita et al., 2000a), presumably because actin filaments are flexible. Short pauses that we have reported for relatively short actin filaments (Hirono-Hara et al., 2001) may represent the ∼80° pauses described here, although the pause angle relative to an ATP-waiting angle was not established in the previous study.
Irregular rotations at subnanomolar ATP
At 600 pM ATP, we noticed that bead duplexes sometimes dwelled around the substep angle, ∼80° ahead of an ATP-waiting angle for minutes (Fig. 4 a). This was more frequent at 200 pM ATP (Fig. 4 b). Finding a bead duplex that rotates in one direction was extremely difficult at these ATP concentrations, and we have so far obtained only a few runs that involve >7 revolutions at each [ATP]. Below we describe apparent characteristics of these runs, which may not be typical, without quantitative statistics. These irregular rotations at extremely low ATP concentrations are not physiologically relevant, but may nevertheless provide some clues about the rotary mechanism at higher [ATP].
FIGURE 4.
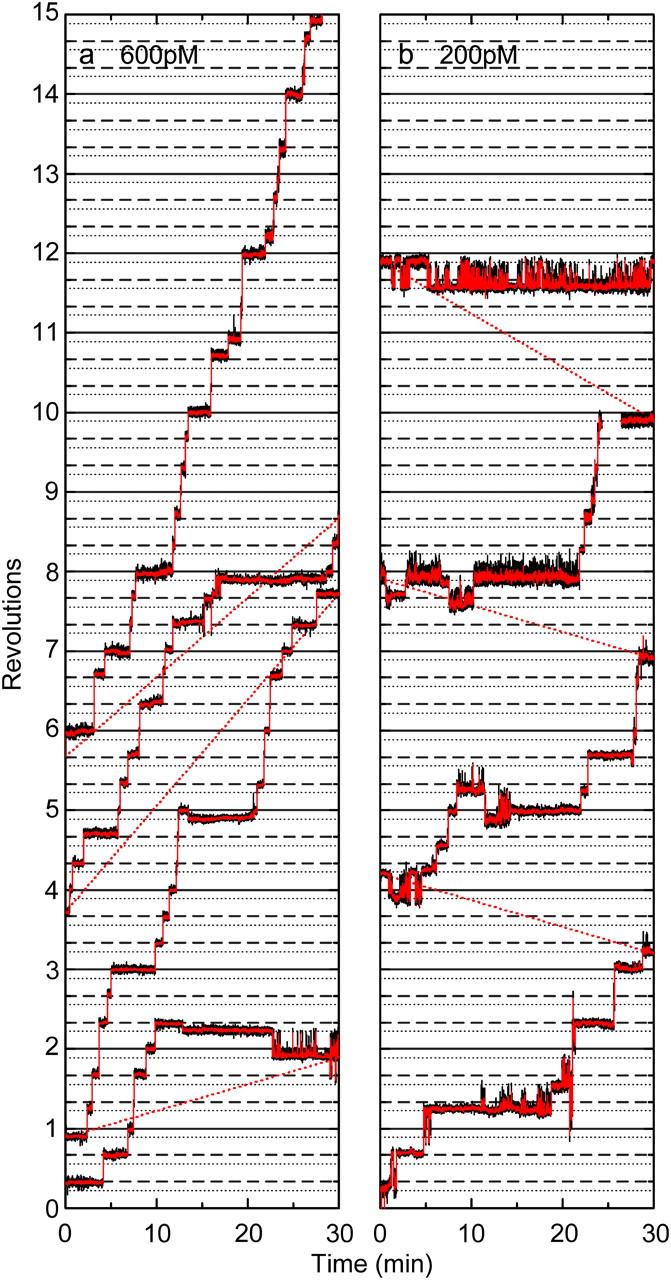
Time courses of F1 rotation at 600 pM (a) and 200 pM (b) ATP. Black curves, raw data showing the rotary angle of a 0.287-μm bead duplex; red curves, 15-point (0.5-s) running average. To save space, a continuous record is split into contiguous 30-min segments and plotted on one graph; red dotted lines indicate connection. Solid and dashed horizontal lines are drawn at intervals of 120°, and dotted lines are drawn 40° below a solid or dashed line. The image went out of focus at the break in record b.
An ∼80° dwell was reached through a (sub)step of various origin: a forward 80° substep from 0°, backward 40° substep from 120°, forward 120° step from −40°, or backward 120° step from 200° (Fig. 4); the latter two modes represent a 120° jump between neighboring substep angles. In contrast, entry into a MgADP-inhibited state at ∼80° in high ATP media (200 nM ATP and above) is almost always through a forward 80° substep from 0° (Hirono-Hara et al., 2001); the inset of Fig. 1 also shows this behavior, but some of the long pauses at 2–20 nM ATP in Fig. 1 are through a 40° backward substep from 120°. Escape from an ∼80° dwell to a regular ATP-waiting angle was often, though not always, by a 160° forward jump to 240° that was complete in a fraction of a second; these 160° jumps might be a combination of 40° and 120° steps, but a clear dwell (>0.1 s) in the course of a 160° jump was undetectable in most cases.
During an ∼80° dwell at pM ATP, the bead duplex often fluctuated extensively. Large-amplitude fluctuations tended to occur in the forward direction, as seen in Fig. 4. This could imply that, in the yet unknown chemical state of the ∼80° intermediate, the potential energy for γ-rotation is less steep, or poses lower barriers, against forward rotation than against backward rotation, and that the forward slope/barrier in the potential is smaller in the ∼80° intermediate than in the ATP-waiting state. Or, large-amplitude forward fluctuations, occasionally reaching 120° ahead (at ∼200°) and staying there for a fraction of a second, might have resulted from transient ATP binding: although an effective ATP binding that eventually leads to a regular 120° step from an ATP-waiting angle is seldom at pM ATP (∼0.2 min−1 at 200 pM), diffusion-limited encounter of ATP with F1 could be ∼102 times as frequent.
These behaviors at pM ATP are clearly different from the mostly regular 120° stepping at nM ATP and above. If tri-site is the norm at nM ATP and above, the irregular rotations may be attributed to a bi-site mode. Or, rotation at nM ATP (and possibly above) might be by a bi-site mode and picomolar rotation by a uni-site mode. Other more complicated schemes are also possible, and what we can conclude here is that a clearly different rotation regime(s) emerges at hundreds of picomolar ATP. In this regard, we also noticed that, at 200 pM ATP, some bead duplexes rotated in both directions, mainly in steps of 120° that could accumulate in net rotation of several revolutions in either direction. This may represent Brownian hopping among the three equivalent orientations in a nucleotide-free F1, although other possibilities such as a denatured F1 cannot be dismissed.
DISCUSSION
ATP preincubation
The reason why preincubation with ATP increases the number of rotating F1 at low [ATP] is not clear. One possibility is that active rotation requires filling of at least two of the three catalytic sites with a nucleotide (tri-site operation) and that the probability of filling two is extremely low at nM ATP or below. Once two or more sites are filled by preincubation, the enzyme starts to rotate, and the active enzyme somehow maintains two nucleotides in the catalytic sites. In this scenario, if the enzyme happens to lose one catalytic nucleotide while waiting for ATP, the enzyme cannot resume rotation at low [ATP]. Because the number of rotating F1 did not decrease appreciably at least for 2 h after preincubation, this scenario is rather unlikely.
In a mutant thermophilic F1 that incorporates a reporter tryptophan near each catalytic site, binding of the first ATP to nucleotide-depleted F1 has been shown to occur with a bimolecular rate constant of 1.7 × 10⁷ M−1s−1 (Masaike et al., 2002), a value close to the rate constant for ATP binding that directly drives rotation,  of ∼2 × 10⁷ M−1s−1. If binding of the second ATP occurs at a similar or lower rate, the binding takes a few seconds or more at 20 nM ATP where the preincubation effect was significant. The mutant study has also shown that F1 that binds only one catalytic nucleotide tends to fall into an MgADP-inhibited state with a time constant of 15 s. Thus, a significant portion would be inhibited before a second catalytic site is filled. Preincubation at high [ATP] will bypass this inhibition process. We are, however, not sure if this alone can explain the preincubation effect. After dilution into an extremely low [ATP], there will be an occasion, however scarce it may be, where only one catalytic nucleotide remains bound to F1, and then the F1 would be inhibited. In fact, the preincubation effect lasted at least for 2 h.
Binding of ATP to the three noncatalytic sites during preincubation may explain the sustained effect. Filling the noncatalytic sites takes minutes (for mitochondrial F1) at 50 μM ATP (Jault and Allison, 1993), suggesting that release would also be extremely slow. Nucleotides bound to the noncatalytic sites greatly reduces the propensity of F1 to fall into the MgADP-inhibited state, at least for the kind(s) of inhibition that takes place at μM ATP and above (Jault et al., 1996; Matsui et al., 1997; Hirono-Hara et al., 2001). Preincubation with ATP will lead to filling of the noncatalytic sites, and will also help avoid the one-nucleotide inhibition above. The slow manifestation of the preincubation effect, 1 min being ineffective, is consistent with the slow filling of noncatalytic sites.
If the preincubation effect is due to filling of noncatalytic sites, the irregular rotation at subnanomolar ATP might result from the release of a noncatalytic nucleotide(s). This, however, is rather unlikely because the release must take many minutes whereas the irregular rotation was noticeable from the beginning of observation (Fig. 4).
Rotary mechanism
In principle, the events of ATP binding by F1 can be classified into two categories: productive binding that leads to and that drives a forward 120° step, and futile binding where the ATP is released back into the medium without net rotation. The latter may include rotary spikes where forward rotation initiated by ATP binding is reversed when the ATP is released prematurely. Futile events may also include the case where ATP is hydrolyzed and then released without net rotation. Such futile ATP hydrolysis, or decoupling between hydrolysis and rotation, is likely rare, in view of the relatively good agreement between the rotation and hydrolysis rates (Fig. 2).
What this study clearly shows, together with previous studies (Yasuda et al., 1998, 2001; Adachi et al., 2000; Noji et al., 2001), is that the rate constant for the productive ATP binding,  remains the same at ∼2 × 10⁷ M−1s−1 over the broad range of ∼1 nM to ∼100 μM ATP, and probably up to at least 6 mM (Yasuda et al., 2001). Below ∼1 nM, a new rotation regime involving long dwells at ∼80° position begins to appear, but, at least down to 200 pM, the overall rotation rate is commensurate with the rate constant for productive ATP binding above of ∼2 × 10⁷ M−1s−1 (Figs. 1, 2, and 4). Models of F1 rotation must take this [ATP] independence of the binding rate constant, and the [ATP] independence of the rotary torque (Fig. 3), into account.
A simple answer is that one rotary mechanism operates in the whole range of [ATP] except for pM and below. Is it a tri-site mechanism, as stated in introduction? A tryptophan residue introduced in the catalytic site reports that the catalytic site occupancy is >2 at several μM and above for E. coli F1 (Weber and Senior, 2001) and also for the thermophilic F1 that we used in this study (Ren and Allison, 2000; Ono et al., 2003). Although these studies do not suggest tri-site activity at 1 μM ATP and below where the occupancy is apparently <2, the occupancy in our F1 that lacks the tryptophan mutation may remain high down to 1 nM ATP. Or, the relation between the fluorescence signal and site occupancy may be nonlinear and the actual occupancy in the tryptophan mutants may also be above two down to nM ATP (Ono et al., 2003). A fluorescent ATP analog, Cy3-ATP, remains bound on F1 for ≥240° of rotation at 0.3–2 μM ATP, supporting a tri-site mechanism below 1 μM ATP. A stronger support comes from direct observation of the number of bound Cy3-ATP, in the sample in which the same F1 mutant as used in this study rotates in the presence of Cy3-ATP at ∼100 nM without unlabeled ATP (K. Adachi, unpublished): the number of bound Cy3 basically remains two during regular 120° stepping, but irregular stepping involving ∼80° dwells appears when bound Cy3 drops to one. The irregular stepping is reminiscent of one we observed here at 200 and 600 pM ATP (Fig. 4). If the affinity of Cy3-ADP for F1 is 102–103 times lower than that of unlabeled ADP, rotation at ∼1 nM and above of authentic ATP is likely driven by a tri-site mechanism. Here we define a tri-site mechanism as one in which the catalytic site occupancy in the ATP-waiting state is two, without specifying further details. It is conceivable that the occupancy remains two all the time (ATP binding and ADP release being simultaneous), and then the term “tri-site” may not be appropriate.
The tri-site view, even with the modest definition above, may yet be disputable. Milgrom et al. (1998) have observed full hydrolysis activity of mitochondrial F1 when the molar ratio of added ATP to F1 exceeded one. This result indicates that only one nucleotide is bound in the ATP-waiting state, at least at low [ATP] (bi-site mechanism). We are obtaining similar, though not identical, results with a mutant of thermophilic F1 (R. Shimo-Kon, unpublished). Note that the [ATP] independence of the rate constant for productive ATP binding,  is compatible with the possibility of bi-site filling at low [ATP] and tri-site filling at high [ATP] if the rate constants are similar in the two regimes. The estimation of site occupancy with the tryptophan mutant has so far been made in the absence of an ATP-regenerating system, where F1 rapidly falls into an MgADP-inhibited state(s). If F1 remained active in these experiments where [F1] was rather high (in the order of 100 nM), ATP in the medium must have been quickly (in the order of 10 s except at ≥mM ATP) converted into ADP. The tryptophan signal is stationary over minutes in most cases, suggesting that the signal comes primarily from inactive enzyme. Results with Cy3-ATP must also be interpreted with caution, because of the presence of the Cy3 moiety, which impedes the hydrolysis reaction (Nishizaka et al., 2004). More experiments are needed to firmly establish the catalytic site occupancy in active, rotating F1. And, of course, site occupancy is only one part of the jigsaw puzzle. We hope that the results we report here turn out to be a solid piece of the puzzle of how F1-ATPase rotates.
Acknowledgments
We thank Y. Onoue, M. D. Hossain, and K. Shiroguchi for discussion, M. Shio for the microscope techniques, and M. Fukatsu for encouragement and lab management.
This work was supported in part by grants-in-aid from the Ministry of Education, Culture, Sports, Science and Technology of Japan.
References
- Abrahams, J. P., A. G. W. Leslie, R. Lutter, and J. E. Walker. 1994. Structure at 2.8 Å resolution of F1-ATPase from bovine heart mitochondria. Nature. 370:621–628. [DOI] [PubMed] [Google Scholar]
- Adachi, K., R. Yasuda, H. Noji, H. Itoh, Y. Harada, M. Yoshida, and K. Kinosita Jr. 2000. Stepping rotation of F1-ATPase visualized through angle-resolved single-fluorophore imaging. Proc. Natl. Acad. Sci. USA. 97:7243–7247. [DOI] [PMC free article] [PubMed] [Google Scholar]
- Adachi, K., H. Noji, and K. Kinosita Jr. 2003. Single-molecule imaging of rotation of F1-ATPase. Methods Enzymol. 361B:211–227. [DOI] [PubMed] [Google Scholar]
- Boyer, P. D. 1997. The ATP synthase—a splendid molecular machine. Annu. Rev. Biochem. 66:717–749. [DOI] [PubMed] [Google Scholar]
- Boyer, P. D. 2002. Catalytic site occupancy during ATP synthase catalysis. FEBS Lett. 512:29–32. [DOI] [PubMed] [Google Scholar]
- Boyer, P. D., and W. E. Kohlbrenner. 1981. The present status of the binding-change mechanism and its relation to ATP formation by chloroplasts. In Energy Coupling in Photosynthesis. B. R. Selman, and S. Selman-Reimer, editors. Elsevier, Amsterdam. 231–240.
- DeLuca, M., and W. D. McElroy. 1978. Purification and properties of firefly luciferase. Methods Enzymol. 57:3–15. [Google Scholar]
- Diez, M., B. Zimmermann, M. Börsch, M. König, E. Schweinberger, S. Steigmiller, R. Reuter, S. Felekyan, V. Kudryavtsev, C. A. M. Seidel, and P. Gräber. 2004. Proton-powered subunit rotation in single membrane-bound FoF1-ATP synthase. Nat. Struct. Mol. Biol. 11:135–141. [DOI] [PubMed] [Google Scholar]
- Hirono-Hara, Y., H. Noji, M. Nishiura, E. Muneyuki, K. Y. Hara, R. Yasuda, K. Kinosita Jr., and M. Yoshida. 2001. Pause and rotation of F1-ATPase during catalysis. Proc. Natl. Acad. Sci. USA. 98:13649–13654. [DOI] [PMC free article] [PubMed] [Google Scholar]
- Hunt, A. J., F. Gittes, and J. Howard. 1994. The force exerted by a single kinesin molecule against a viscous load. Biophys. J. 67:766–781. [DOI] [PMC free article] [PubMed] [Google Scholar]
- Itoh, H., A. Takahashi, K. Adachi, H. Noji, R. Yasuda, M. Yoshida, and K. Kinosita Jr. 2004. Mechanically driven ATP synthesis by F1-ATPase. Nature. 427:465–468. [DOI] [PubMed] [Google Scholar]
- Jault, J.-M., and W. S. Allison. 1993. Slow binding of ATP to noncatalytic nucleotide binding sites which accelerates catalysis is responsible for apparent negative cooperativity exhibited by the bovine mitochondrial Fl-ATPase. J. Biol. Chem. 268:1558–1566. [PubMed] [Google Scholar]
- Jault, J.-M., C. Dou, N. B. Grodsky, T. Matsui, M. Yoshida, and W. S. Allison. 1996. The α3β3γ subcomplex of the F1-ATPase from the thermophilic Bacillus PS3 with the βT165S substitution does not entrap inhibitory MgADP in a catalytic site during turnover. J. Biol. Chem. 271:28818–28824. [DOI] [PubMed] [Google Scholar]
- Kagawa, Y., and E. Racker. 1966. Partial resolution of the enzymes catalyzing oxidative phosphorylation. IX. Reconstruction of oligomycin-sensitive adenosine triphosphatase. J. Biol. Chem. 241:2467–2474. [PubMed] [Google Scholar]
- Kinosita, K., Jr., K. Adachi, and H. Itoh. 2004. Rotation of F1-ATPase: how an ATP-driven molecular machine may work. Annu. Rev. Biophys. Biomol. Struct. 33:245–268. [DOI] [PubMed] [Google Scholar]
- Kinosita, K., Jr., R. Yasuda, and H. Noji. 2000a. F1-ATPase: a highly efficient rotary ATP machine. Essays Biochem. 35:3–18. [DOI] [PubMed] [Google Scholar]
- Kinosita, K., Jr., R. Yasuda, H. Noji, and K. Adachi. 2000b. A rotary molecular motor that can work at near 100% efficiency. Philos. Trans. R. Soc. Lond. B. Biol. Sci. 355:473–489. [DOI] [PMC free article] [PubMed] [Google Scholar]
- Masaike, T., E. Muneyuki, H. Noji, K. Kinosita Jr., and M. Yoshida. 2002. F1-ATPase changes its conformations upon phosphate release. J. Biol. Chem. 277:21643–21649. [DOI] [PubMed] [Google Scholar]
- Matsui, T., E. Muneyuki, M. Honda, W. S. Allison, C. Dou, and M. Yoshida. 1997. Catalytic activity of the α3β3γ complex of F1-ATPase without noncatalytic nucleotide binding site. J. Biol. Chem. 272:8215–8221. [DOI] [PubMed] [Google Scholar]
- Menz, R. I., J. E. Walker, and A. G. W. Leslie. 2001. Structure of bovine mitochondrial F1-ATPase with nucleotide bound to all three catalytic sites: implications for the mechanism of rotary catalysis. Cell. 106:331–341. [DOI] [PubMed] [Google Scholar]
- Milgrom, Y. M., M. B. Murataliev, and P. D. Boyer. 1998. Bi-site activation occurs with the native and nucleotide-depleted mitochondrial F1-ATPase. Biochem. J. 330:1037–1043. [DOI] [PMC free article] [PubMed] [Google Scholar]
- Nishizaka, T., K. Oiwa, H. Noji, S. Kimura, E. Muneyuki, M. Yoshida, and K. Kinosita Jr. 2004. Chemomechanical coupling in F1-ATPase revealed by simultaneous observation of nucleotide kinetics and rotation. Nat. Struct. Mol. Biol. 11:142–148. [DOI] [PubMed] [Google Scholar]
- Noji, H., R. Yasuda, M. Yoshida, and K. Kinosita Jr. 1997. Direct observation of the rotation of F1-ATPase. Nature. 386:299–302. [DOI] [PubMed] [Google Scholar]
- Noji, H., D. Bald, R. Yasuda, H. Itoh, M. Yoshida, and K. Kinosita Jr. 2001. Purine but not pyrimidine nucleotides support rotation of F1-ATPase. J. Biol. Chem. 276:25480–25486. [DOI] [PubMed] [Google Scholar]
- Ono, S., K. Y. Hara, J. Hirao, T. Matsui, H. Noji, M. Yoshida, and E. Muneyuki. 2003. Origin of apparent negative cooperativity of F1-ATPase. Biochim. Biophys. Acta. 1607:35–44. [DOI] [PubMed] [Google Scholar]
- Oosawa, F., and S. Hayashi. 1986. The loose coupling mechanism in molecular machines of living cells. Adv. Biophys. 22:151–183. [DOI] [PubMed] [Google Scholar]
- Pänke, O., D. A. Cherepanov, K. Gumbiowski, S. Engelbrecht, and W. Junge. 2001. Viscoelastic dynamics of actin filaments coupled to rotary F-ATPase: angular torque profile of the enzyme. Biophys. J. 81:1220–1233. [DOI] [PMC free article] [PubMed] [Google Scholar]
- Ren, H., and W. S. Allison. 2000. Substitution of βGlu201 in the α3β3γ subcomplex of the F1-ATPase from the thermophilic Bacillus PS3 increases the affinity of catalytic sites for nucleotides. J. Biol. Chem. 275:10057–10063. [DOI] [PubMed] [Google Scholar]
- Shimabukuro, K., R. Yasuda, E. Muneyuki, K. Y. Hara, K. Kinosita Jr., and M. Yoshida. 2003. Catalysis and rotation of F1 motor: cleavage of ATP at the catalytic site occurs in 1 ms before 40° substep rotation. Proc. Natl. Acad. Sci. USA. 100:14731–14736. [DOI] [PMC free article] [PubMed] [Google Scholar]
- Svoboda, K., and S. M. Block. 1994. Biological applications of optical forces. Annu. Rev. Biophys. Biomol. Struct. 23:247–285. [DOI] [PubMed] [Google Scholar]
- Turina, P., D. Samoray, and P. Gräber. 2003. H+/ATP ratio of proton transport-coupled ATP synthesis and hydrolysis catalysed by CFoF1-liposomes. EMBO J. 22:418–426. [DOI] [PMC free article] [PubMed] [Google Scholar]
- Weber, J., S. Wilke-Mounts, R. S.-F. Lee, E. Grell, and A. E. Senior. 1993. Specific placement of tryptophan in the catalytic sites of Escherichia coli F1-ATPase provides a direct probe of nucleotide binding: Maximal ATP hydrolysis occurs with three sites occupied. J. Biol. Chem. 268:20126–20133. [PubMed] [Google Scholar]
- Weber, J., and A. E. Senior. 2001. Bi-site catalysis in F1-ATPase: does it exist? J. Biol. Chem. 276:35422–35428. [DOI] [PubMed] [Google Scholar]
- Weber, J., and A. E. Senior. 2003. ATP synthesis driven by proton transport in F1Fo-ATP synthase. FEBS Lett. 545:61–70. [DOI] [PubMed] [Google Scholar]
- Yasuda, R., H. Noji, K. Kinosita Jr., and M. Yoshida. 1998. F1-ATPase is a highly efficient molecular motor that rotates with discrete 120° steps. Cell. 93:1117–1124. [DOI] [PubMed] [Google Scholar]
- Yasuda, R., H. Noji, M. Yoshida, K. Kinosita Jr., and H. Itoh. 2001. Resolution of distinct rotational substeps by submillisecond kinetic analysis of F1-ATPase. Nature. 410:898–904. [DOI] [PubMed] [Google Scholar]
- Yoshida, M., E. Muneyuki, and T. Hisabori. 2001. ATP synthase — a marvellous rotary engine of the cell. Nat. Rev. Mol. Cell Biol. 2:669–677. [DOI] [PubMed] [Google Scholar]