Abstract
Molecular simulations and an energy landscape analysis are used to examine the stretching of a model protein. A mapping of the energy landscape shows that stretching the protein causes energy minima and energy barriers to flatten out and disappear, and new energy minima to be created. The implications of these landscape distortions depend on the timescale regime under which the protein is stretched. When the timescale for thermally activated processes is longer than the timescale of stretching, the disappearances of energy barriers provide the mechanism for protein unfolding. When the timescale for thermally activated processes is shorter than the timescale of stretching, the landscape distortions influence the stretching process by changing the number and types of energy minima in which the system can exist.
INTRODUCTION
Many biological functions, including muscle contraction and cell adhesion, are controlled by the mechanical response of proteins. For this reason, the mechanical properties of proteins have recently been widely studied. For example, experiments have examined the stretching of single molecules of the muscle protein titin using atomic force microscopy (Rief et al., 1997) and optical tweezer techniques (Kellermayer et al., 1997; Tskhovrebova et al., 1997). The mechanical response of titin is interesting and highly nonlinear, in that the force required to stretch the molecule undergoes cycles of gradual increases followed by sudden decreases. This sawtooth behavior has been attributed to the sequential mechanical unfolding of modular units of the protein.
Theoretical investigations have also addressed the mechanical response of proteins. Molecular dynamics simulations based on detailed atomic descriptions have addressed the mechanical unfolding of protein segments (Lu et al., 1998; Lu and Schulten, 2000; Krammer et al., 1999; Paci and Karplus, 1999, 2000; Bryant et al., 2000; Gao et al., 2002; Fowler et al., 2002; Li and Makarov, 2003; Rathore et al., 2004). More coarse-grained approaches have also been carried out, based on lattice (Socci et al., 1999; Klimov and Thirumalai, 1999, 2001) and off-lattice models (Klimov and Thirumalai, 2000; Li et al., 2001).
The present investigation differs from these previous theoretical investigations, in that an inherent structure analysis, rather than solely molecular dynamics simulation, is used to elucidate the nonlinear mechanical response of proteins. The inherent structure formalism developed by Stillinger and Weber considers the dynamics in complex systems to be composed of vibrations within individual energy minima (inherent structures), and structural transitions between energy minima (Stillinger and Weber, 1984; Debenedetti and Stillinger, 2001). Most interesting properties of complex systems are related specifically to the structural transitions between energy minima, but the nature of these structural transitions is often obscured by vibrational motion. The inherent structure formalism is used to strip away the effects of vibrational motion, to provide a clearer picture of the structural transitions in the system.
COMPUTATIONAL METHODS
Protein model
Simulations are carried out on the coarse-grained β-barrel protein model introduced by Thirumalai and co-workers (Honeycutt and Thirumalai, 1992; Guo et al., 1992). The model protein is a strand of Nr = 46 residues, where each residue is one of three types: hydrophobic (B), hydrophilic (L), or neutral (N). The protein sequence is B9N3(LB)4N3B9N3(LB)5L.
The residues interact with a potential of the form
 |
(1) |
where ri is the distance between residues i and i+1; θi is the angle defined by residues i, i+1, and i+2; φi is the torsion angle defined by residues i, i+1, i+2, and i+3; and rij is the distance between residues i and j. The bond-stretching term is
 |
(2) |
where kb = 400 ɛ/σ2 and ro = σ. The angle-bending term is
 |
(3) |
where ka = 20 ɛ/rad2 and θo = 105 (π/180) rad. The torsion term is
 |
(4) |
where (Ai, Bi) = (1.2, 1.2) if fewer than two of the four residues involved in the torsion are N-residues, and (Ai, Bi) = (0, 0.2) if two or more of the four residues involved in the torsion are N-residues. The nonbonded term is
 |
(5) |
where (Cij, Dij) = (1, 1) if both i and j are B-residues, (Cij, Dij) = (2/3, −1) if i and j are either both L-residues or one L- and one B-residue, and (Cij, Dij) = (1, 0) if either i or j is an N-residue. The masses of the residues, mi, are equivalent, and equal to m.
Simulation methods
The simulations begin by finding the structure corresponding to the global energy minimum for the system. This global minimum is found by annealing the system using a series of molecular dynamics simulations. We confirm that the structure is, in fact, the global minimum by comparing with literature results of more extensive global minimization studies on this model.
Two types of simulations are carried out to address the stretching of the protein. First, simulations are carried out to map out the distortions of the energy landscape as the protein is stretched. Second, steered molecular dynamics simulations are carried out to determine the relevance of the distortions of the energy landscape at finite temperature and stretching velocity.
Mapping the energy landscape
To map out the changes in the energy landscape as the protein is stretched, we first stretch the protein in the case where the system always resides at an energy minimum; this manner of stretching corresponds physically to stretching the protein in the limits of zero temperature and zero stretching velocity. Simulations in these limits are carried out by elongating the protein in very small increments, with an energy minimization after each elongation increment. The protein is elongated by moving the last residue a distance Δr further away from the first residue, along the vector that connects the first and last residues. The energy is then minimized with respect to the positions of residues 2 through (N–1), whereas the positions of residues 1 and N are fixed; a variable-metric minimization algorithm is used to carry out the energy minimization (Press et al., 1992). The forces on the first and last residues, which are equal in magnitude and opposite in direction, are obtained from the derivatives of the energy with respect to the atom positions.
The curvature of the energy landscape is characterized by a normal mode analysis. To obtain the normal modes, the 3Nr × 3Nr matrix of mass-weighted second derivatives with respect to particle positions is calculated, where the matrix elements are of the form
 |
(6) |
where i and j index the atoms, and k and l index the dimensions. This matrix is then diagonalized to give the normal mode eigenvalues. Since the energy minima we investigate are obtained with the positions of the first and last residues fixed (see previous paragraph), the relevant normal modes correspond to these positions being fixed. Normal modes for the case of the first and last residues being fixed are obtained by setting the masses of the first and last residues to infinity during the normal mode calculation.
Barriers between selected energy minima of the energy landscape are found with a saddlepoint search procedure. To find a saddle point, the square of the gradient of the energy is minimized with respect to residue positions (the derivatives with respect to the positions of the first and last residues are excluded from this gradient term, because we are interested in structures where the positions of the first and last residues are fixed). This minimization is carried out with a variable-metric algorithm (Press et al., 1992), keeping the positions of the first and last residues fixed. These saddlepoint searches start from an initial guess that is midway between the two energy minima of interest. We verify that a saddle point is found when the square of the gradient is effectively zero, and there is a single negative normal mode eigenvalue.
Steered molecular dynamics simulations
Steered molecular dynamics (MD) simulations are used to simulate protein stretching at finite temperature T and stretching velocity vs. To steer the protein to stretch at constant stretching velocity vs, the velocities of the first and last residues are set to −vs/2 and +vs/2 along the vector that connects these residues, and the masses of the first and last residues are set to infinity (so that the acceleration of these residues will always be zero, causing their velocities to be constant). The MD simulations are then carried out in an otherwise normal manner. Inherent structures (energy minima) that the system visits during the steered MD trajectory are found by carrying out energy minimizations with the end residues fixed, which begin from instantaneous configurations during the trajectory; note that these energy minimizations do not affect the MD trajectory.
RESULTS
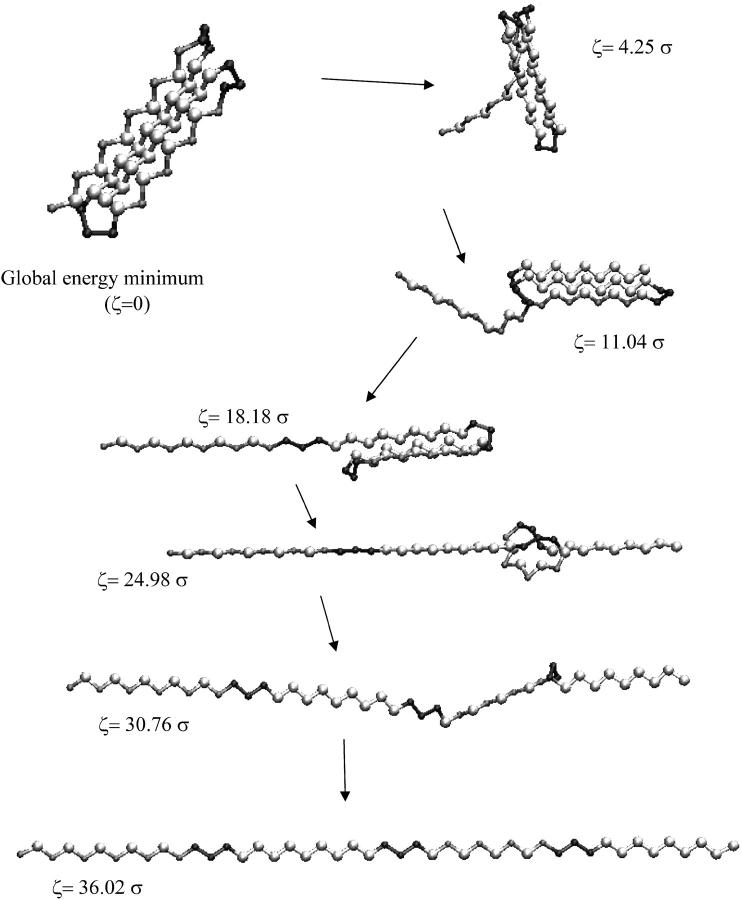
The protein structure corresponding to the global energy minimum, obtained by annealing with MD simulations, is shown in Fig. 1. The energy of this structure is −49.2365 ɛ, which concurs with the results of previous global minimization studies for this protein model (Lee and Berne, 2000; Kim et al., 2003).
FIGURE 1.
Structures of the protein, as the protein is elongated by the amount ζ.
Mapping the energy landscape
The protein is stretched from the global minimum structure in the case that the system always resides at an energy minimum. The elongation of the protein is described by ζ = (r1N – r1N,0), where r1N is the distance from the first to last residue and r1N,0 is the value of this distance in the native (unstretched) structure. The protein is stretched to an elongation ζ = 60 σ, by carrying out energy minimizations after each increment of elongation of Δζ = 0.002 σ; thus a total of 30,000 energy minimizations were carried out to obtain these results. Snapshots of the protein at various stages of elongation are shown in Fig. 1.
The force as a function of elongation is shown in Fig. 2. This force-elongation curve displays interesting features that are not evident in finite temperature/finite shear rate results (e.g., see the results of molecular dynamics simulations for this type of model in Klimov and Thirumalai, 2000, and Li et al., 2001). For very small elongations (ζ < 0.03 σ), there is a quasi-elastic regime in which the force increases nearly linearly with elongation. Beyond this quasi-elastic regime, the force-elongation curve is nonmonotonic, and the slope changes sign many times as the protein is stretched. Most significantly, Fig. 2 shows that the force-elongation curve undergoes discontinuous changes at some elongations.
FIGURE 2.
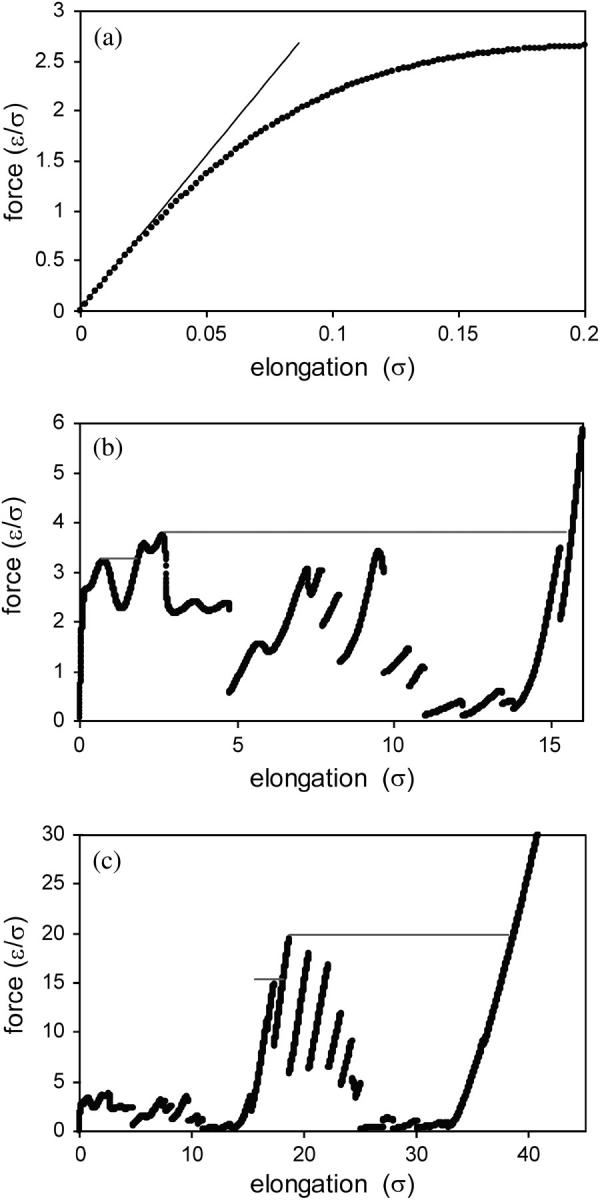
Force as a function of elongation. The three plots show different ranges of elongation. The diagonal line in plot a is a guide to the quasi-elastic behavior, and the horizontal lines in plots b and c indicate structural transitions that the protein would undergo if the force, rather than elongation, is constrained and incremented.
Some results for the force as the elongation of the protein is reversed—i.e., as the first and last residues are moved closer together—are shown in Fig. 3 a. The changes in the protein upon stretching are usually reversible, but are irreversible at the points where the force changes discontinuously with elongation (at ζ = 4.782 σ in Fig. 3 a). Stretching the protein to ζ > 4.782 σ, and then reversing the stretching to ζ < 4.782 σ, leaves the protein in an energy minimum that is distinct from the minimum it was in initially. In the analysis below, the initial energy minimum at ζ < 4.782 σ will be referred to as minimum A, and the final energy minimum will be referred to as minimum B.
FIGURE 3.
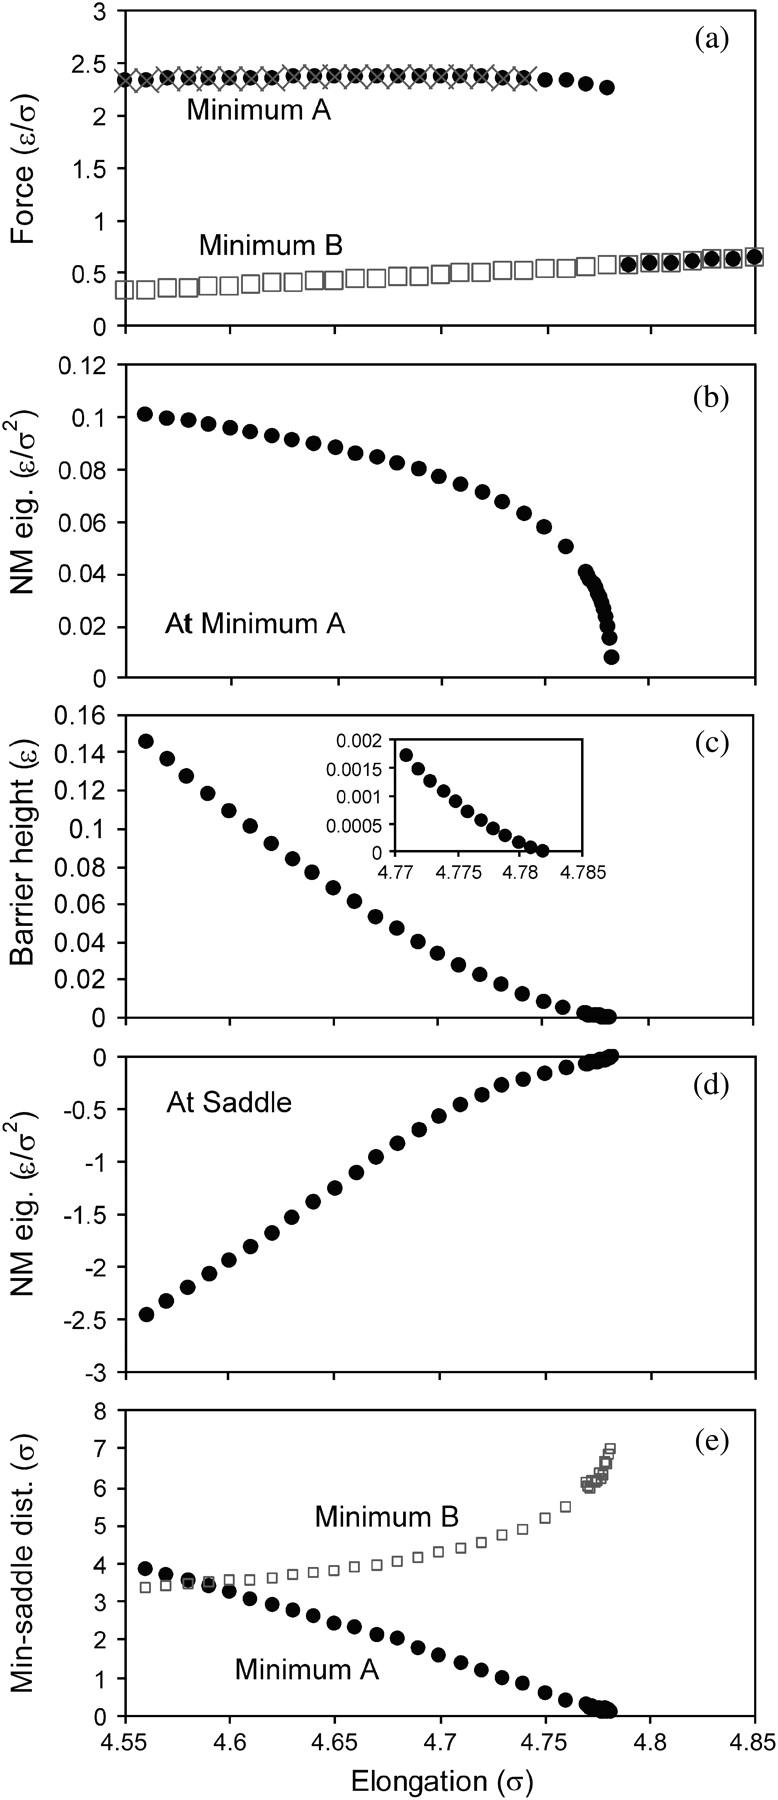
Properties of the protein as a function of elongation, in the elongation range near a discontinuous change in force. (a) Force, upon increasing elongation (circles), decreasing elongation beginning from ζ = 4.75 σ (crosses), and decreasing elongation beginning from ζ = 4.85 σ (squares). The initial (upper) branch corresponds to the system residing in energy-minimum A, and the lower branch corresponds to the system residing in energy-minimum B. (b) Lowest nonzero normal mode eigenvalue evaluated at energy-minimum A, upon increasing elongation. (c) Height of the barrier between minimum A and minimum B, upon increasing elongation (the barrier height is determined as the energy of the saddle point between these minima minus the energy at minimum A). (d) Lone negative eigenvalue evaluated at the saddle point between minimum A and minimum B, upon increasing elongation. (e) Distance between the saddle point and minima A and B, upon increasing elongation.
The discontinuous and irreversible change in the force-elongation curve is elucidated by mapping out the energy landscape as the protein is stretched. The most relevant features of the energy landscape in this regard are energy-minimum A, and the saddle point between energy-minimum A and energy-minimum B. The following changes to these features of the energy landscape occur as ζ → 4.782 σ:
The curvature of energy-minimum A (in one dimension) decreases to zero, as indicated by the lowest non-zero normal mode eigenvalue decreasing to zero (Fig. 3 b).
The height of the barrier that separates energy-minimum A and energy-minimum B decreases to zero (Fig. 3 c), where the barrier height is obtained as the difference between the energy at the saddle point and the energy at energy-minimum A.
The curvature at the saddle point in the direction along the reaction coordinate goes to zero, as indicated by the lone negative normal mode eigenvalue increasing to zero (Fig. 3 d).
The distance between the saddle point and energy-minimum A decreases to zero (Fig. 3 e).
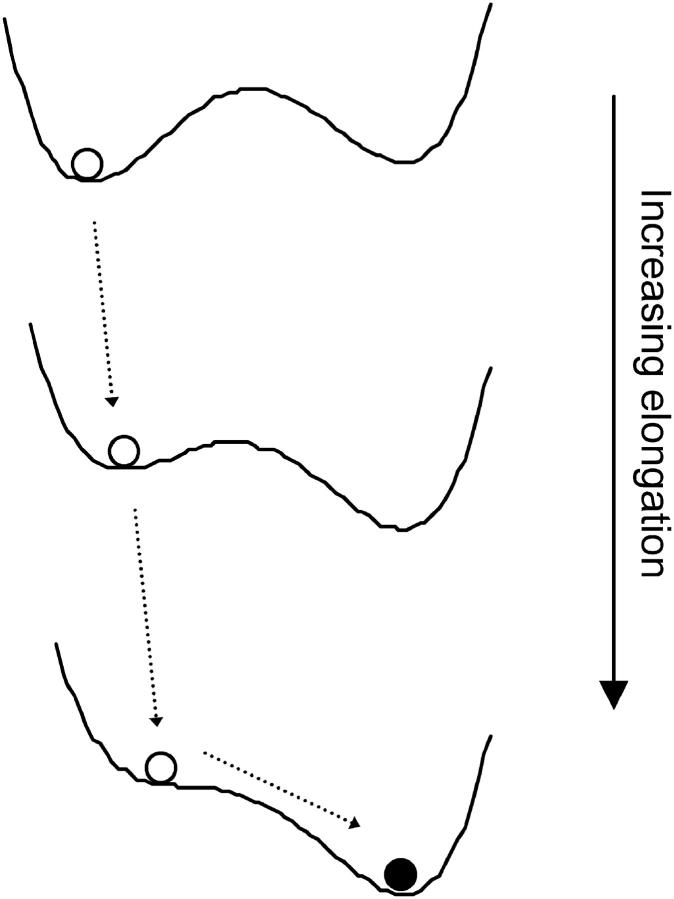
This set of results demonstrates that stretching the protein causes energy-minimum A to flatten out and disappear, as shown schematically in Fig. 4.
FIGURE 4.
Schematic representation of the energy landscape distortions upon elongation of the protein.
These disappearances of energy minima occur 25 times as the protein is stretched to an elongation of ζ = 60 σ (see Fig. 2). Each of these events corresponds to an irreversible structural transition, and represents a discrete step in the mechanical unfolding of the protein. The last of these disappearances of energy minima, which occurs at ζ = 36.01 σ, represents the transition to the fully unfolded (all-trans) state of the protein. Several of these structural transition events, including the structural transition event associated with the energy landscape mapping results in Fig. 3, are shown in Fig. 5.
FIGURE 5.
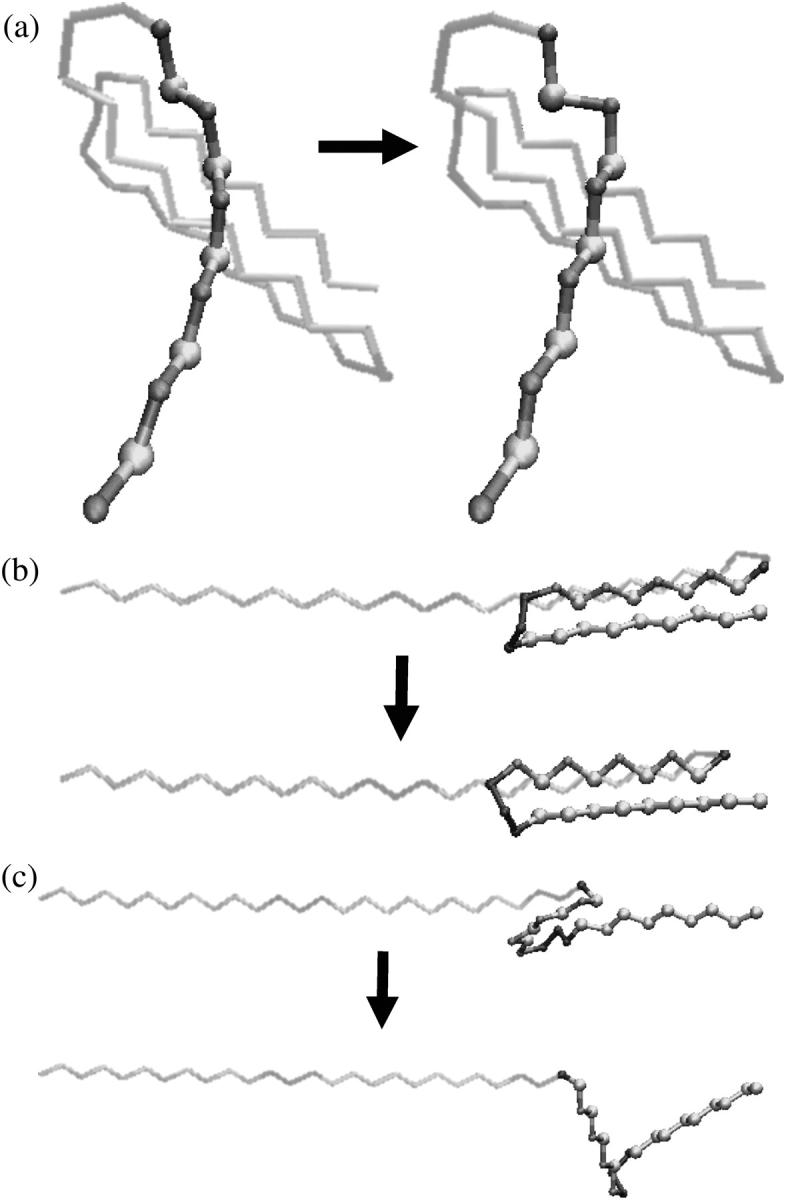
Discontinuous structural transitions at particular elongations due to disappearances of energy minima. (a) ζ = 4.782 σ (this structural change is associated with the results in Fig. 3). (b) ζ = 18.705 σ (this structural change occurs at the maximum force that the partially folded protein can sustain, see Fig. 2). (c) ζ = 25.069 σ.
These results also imply that new energy minima can be created by changing the elongation. This effect can be understood by considering, in reverse, the results in Fig. 3 and the schematic in Fig. 4: although one energy minimum exists at ζ > 4.782 σ, a second energy minimum appears as the elongation is reduced below ζ = 4.782 σ. In this example an energy minimum is created upon decreasing elongation, but we show below that energy minima are also created upon increasing elongation.
Steered molecular dynamics simulations
MD simulations and an inherent structure analysis are used to assess the significance of these energy landscape distortions at finite temperature and stretching velocity. In regard to the relevant temperatures, we note that Nymeyer et al. (1998) have shown for this protein model that a collapsed state becomes favored for T < 0.72 ɛ/k, and the native state becomes favored at a temperature somewhere below 0.4 ɛ/k (which could not be determined precisely due to glassylike dynamics at low temperature).
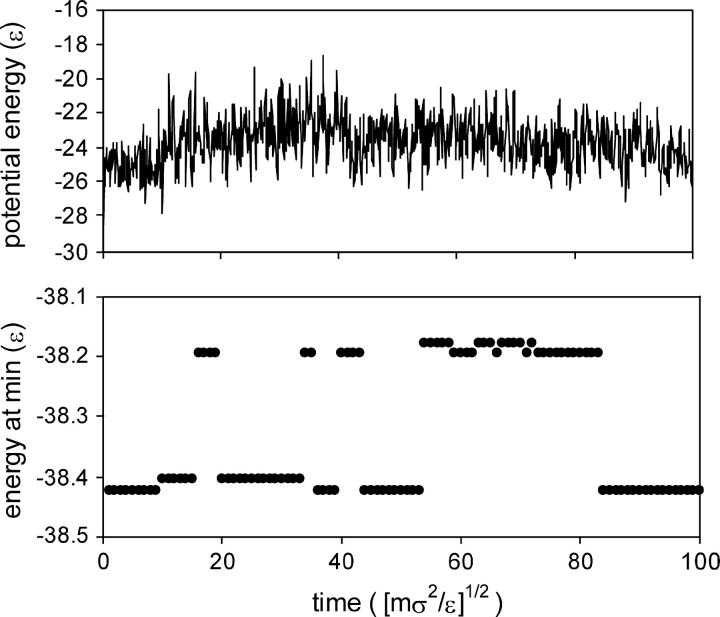
The inherent structure approach characterizes the state of the system by the energy minima that the system visits (Stillinger and Weber, 1984). The usefulness of this approach is demonstrated by the results in Fig. 6, for the protein at fixed elongation. Although the results for the instantaneous potential energy do not show any interesting features, the inherent structure analysis shows that the system undergoes a number of transitions between energy minima during the simulation.
FIGURE 6.
Results of a molecular dynamics simulation at T = 0.2 ɛ/k and a fixed elongation of ζ = 5.93 σ. (Top) Instantaneous potential energy as a function of time. (Bottom) Energy of the energy minima that the instantaneous configurations visit, as a function of time.
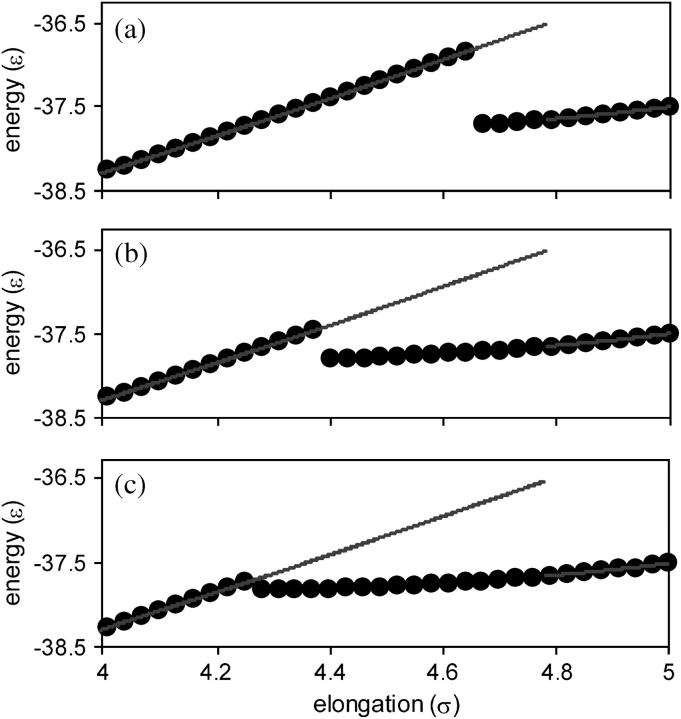
Fig. 7 shows inherent structure results from steered MD simulations at a low temperature (T = 0.1 ɛ/k) and three stretching velocities. Note that the energy of an energy minimum changes as the protein is stretched, in contrast to the fixed elongation case shown in Fig. 6. The system moves from energy-minimum A to energy-minimum B as the protein is stretched (these energy minima are the same as those addressed in Fig. 3). Decreasing vs causes the system to exit energy-minimum A earlier, and at the lowest vs examined the system exits energy-minimum A nearly as soon as energy-minimum B becomes lower in energy.
FIGURE 7.
Inherent structure results from steered MD simulations at T = 0.1 ɛ/k, and (a) vs = 0.01(ɛ/m)1/2, (b) vs = 0.001(ɛ/m)1/2, and (c) vs = 0.0001(ɛ/m)1/2. The circles represent the energy of the energy minima that the instantaneous configurations visit. The lines represent the results obtained in the limits of zero temperature and zero stretching velocity, using the energy landscape mapping procedure.
Inherent structure results from steered MD simulations at higher temperatures are shown in Fig. 8. At T = 0.2 ɛ/k, the system undergoes transitions between energy minima that allow the system to anneal to lower energy minima at ζ > ∼2.5 σ. A landscape mapping analysis, also shown in Fig. 8, indicates that these lower energy minima were created upon elongation and did not exist at zero elongation. At T = 0.4 ɛ/k, the system hops between energy minima frequently; the energy minima visited tend to increase in energy until ζ ∼ 4 σ, but this energy increase ceases after ζ ∼ 4 σ due to the disappearance of energy minima that were stable at low elongation. These T = 0.2 ɛ/k and T = 0.4 ɛ/k results show that energy landscape distortions play an important role in mechanical unfolding even at higher temperatures, by changing the number and types of energy minima in which the system can exist.
FIGURE 8.
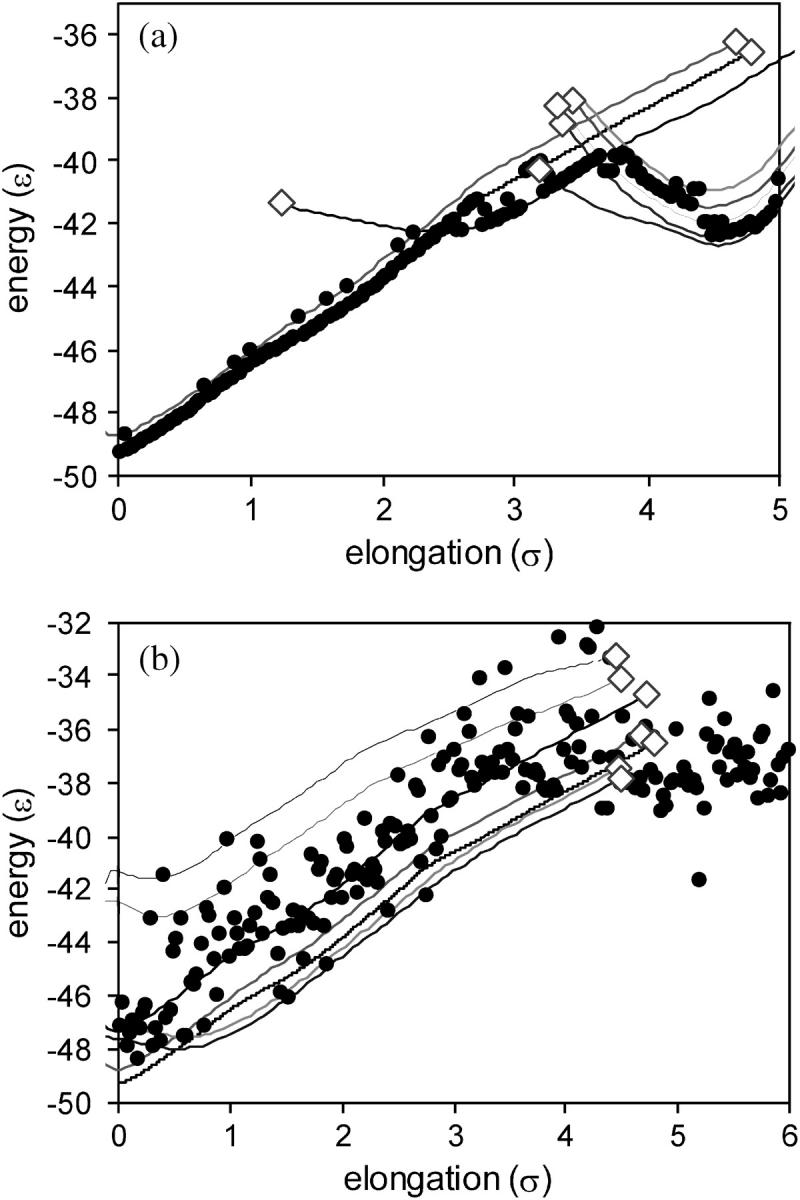
Inherent structure results from steered MD simulations at vs = 0.0001(ɛ/m)1/2 and (a) T = 0.2 ɛ/k and (b) T = 0.4 ɛ/k. The solid circles represent the energy of the energy minima that the instantaneous configurations visit. The lines represent the changes in the energy minima with elongation, using the energy landscape mapping procedure, and the open diamonds represent the points at which energy minima disappear due to changes in elongation.
DISCUSSION
The present results show that stretching a protein distorts the energy landscape, causing energy minima to flatten out and disappear and new energy minima to be created. These landscape distortions affect the dynamics of the protein as it is being stretched, and thus the mechanical response of the protein. However, the manner in which these landscape distortions affect the dynamics depends on the relative magnitudes of three timescales: The timescale τthermal for thermally activated transitions between energy minima, the timescale τstrain over which the protein is stretched, and the timescale τintra for dynamics within an energy minimum. The timescale τintra is on the order of the timescales for vibrational motion, and so physically relevant timescale regimes will involve τintra being much smaller than both τthermal and τstrain.
The energy landscape distortions completely determine protein stretching in the timescale regime τintra≪ τstrain ≪ τthermal. In this timescale regime, the system relaxes to a local energy minimum much faster than the landscape is altered, and thermally activated transitions do not occur significantly on the timescale of the stretching. Thermodynamic equilibration is precluded, and although the system always resides at a local energy minimum, these states in general differ from the minimum free energy state of the system at the particular elongation.
For the other physically relevant timescale regime τintra≪ τthermal ≪ τstrain, the distortions of the energy landscape do not completely determine the mechanical response, but the landscape distortions are important nonetheless. In this timescale regime, which has been addressed phenomenologically in previous studies of protein stretching (Evans and Ritchie, 1999; Best et al., 2002), the system can equilibrate thermodynamically as the protein is stretched. An energy landscape description of the protein dynamics in this timescale regime requires the complete set (or at least an ensemble) of energy minima and barriers to be considered, while including the distortions of these minima and barriers upon stretching.
These timescale ideas are demonstrated by the results in Fig. 7. In this set of simulations, τstrain varies over two orders of magnitude whereas τthermal remains constant (because the temperature is constant). Stretching the protein at vs = 0.01 (ɛ/m)1/2 corresponds to the timescale regime τintra≪ τstrain ≪ τthermal, and as shown in Fig. 7, the system remains in energy-minimum A, almost to the point at which this minimum disappears. In contrast, stretching the protein at vs = 0.0001(ɛ/m)1/2 corresponds to the timescale regime τintra≪ τthermal ≪ τstrain, and as shown in Fig. 7 the system exits energy-minimum A nearly as soon as energy-minimum B becomes lower in energy. Simulations with vs > 0.01 (ɛ/m)1/2 were not carried out because these stretching velocities would cause τstrain to become comparable with τintra.
The results presented here were obtained for the case of the protein being stretched at an imposed velocity. Alternatively, a force that drives the first and last residues apart could be imposed in the simulations, and then incremented in small steps. In the imposed force case, the protein would undergo a structural transition when the force reaches a local force maximum, such that the protein would elongate until it reaches an elongation at which the force-elongation curve has a positive slope with the same value of the force. The structural transitions that would occur under applied force are shown as horizontal lines in Fig. 2. Thus, in the imposed-force case, discontinuous changes in elongation occur rather than the discontinuous changes in force that occur in the imposed-velocity case. These structural transitions also correspond to disappearances of local minima on a landscape; however, in the imposed-force case the relevant landscape is an enthalpy-like landscape, defined as the energy of the protein plus the work due to elongating the protein against the applied force.
The structural changes that follow the disappearance of energy minima are irreversible (see Fig. 3 a). This irreversibility is fully deterministic, and can be understood in terms of the schematic in Fig. 4: although the initial energy minimum disappears as the protein is elongated, the final energy minimum does not generally disappear as the elongation is reversed. This deterministic irreversibility differs from the stochastic irreversibility associated with the second law of thermodynamics. These irreversible structural changes can, of course, be reversed by annealing.
Analogous distortions of energy landscapes occur in liquids and glasses under applied strain or stress. For example, we have shown that strain-induced disappearances of energy minima lead to reduced viscosity and enhanced diffusion in flowing liquids (Malandro and Lacks, 1998; Lacks, 2001), amorphous-amorphous phase transitions in glasses (Lacks, 1998, 2000), and fracture propagation in glasses (Gagnon et al., 2001).
CONCLUSIONS
Molecular simulations and an energy landscape analysis show that stretching a protein causes energy minima and barriers to flatten out and disappear, and new energy minima to be created. If the system resides in a particular local energy minimum when that local minimum disappears, the system is forced to undergo a structural transition to a different local minimum. In the limits of low temperature and low stretching velocity, the disappearance of energy barriers (and thus energy minima) provide the only mechanism for structural rearrangement, and the mechanical unfolding of a protein occurs through a series of discrete steps associated with the disappearances of energy minima.
At finite temperatures and stretching velocities, the landscape distortions also influence the stretching process, but in a way that depends on the timescale regime under which the protein is stretched. This timescale regime is determined by the ratio of the timescale for thermally activated processes relative to the timescale of the protein stretching. When this ratio is high, the role of thermally activated processes is diminished and the disappearances of energy barriers provide the mechanism for protein unfolding. When this ratio is low, thermally activated processes occur frequently, but the landscape distortions still influence the stretching process by changing the number and types of energy minima in which the system can exist.
The energy landscape has become widely used for analyzing protein folding (e.g., Onuchic et al., 1997). The present investigation describes how an energy landscape analysis can be extended to address the behavior of proteins as they are stretched. Although these results were obtained for a model protein, the general ideas are expected to apply to real proteins as well.
Acknowledgments
Funding for this project was provided by the National Science Foundation (grant No. DMR-0402867).
References
- Best, R. B., S. B. Fowler, J. L. Toca-Herrera, and J. Clarke. 2002. A simple method for probing the mechanical unfolding pathway of proteins in detail. Proc. Natl. Acad. Sci. USA. 99:12143–12148. [DOI] [PMC free article] [PubMed] [Google Scholar]
- Bryant, Z., V. S. Pande, and D. S. Rokhsar. 2000. Mechanical unfolding of a β-hairpin using molecular dynamics. Biophys. J. 78:584–589. [DOI] [PMC free article] [PubMed] [Google Scholar]
- Debenedetti, P. G., and F. H. Stillinger. 2001. Supercooled liquids and the glass transition. Nature. 10:259–267. [DOI] [PubMed] [Google Scholar]
- Evans, E., and K. Ritchie. 1999. Strength of a weak bond connecting flexible polymer chains. Biophys. J. 76:2439–2447. [DOI] [PMC free article] [PubMed] [Google Scholar]
- Fowler, S. B., R. B. Best, J. L. Toca Herrera, T. J. Rutherford, A. Steward, E. Paci, M. Karplus, and J. Clarke. 2002. Mechanical unfolding of a titin Ig domain: structure of unfolding intermediate revealed by combining AFM, molecular dynamics simulations, NMR and protein engineering. J. Mol. Biol. 322:841–849. [DOI] [PubMed] [Google Scholar]
- Gagnon, G., J. Patton, and D. J. Lacks. 2001. Energy landscape view of fracture and avalanches in disordered materials. Phys. Rev. E. 64:051508. [DOI] [PubMed] [Google Scholar]
- Gao, M., M. Wilmanns, and K. Schulten. 2002. Steered molecular dynamics studies of titin II domain unfolding. Biophys. J. 83:3435–3445. [DOI] [PMC free article] [PubMed] [Google Scholar]
- Guo, Z., D. Thirumalai, and J. D. Honeycutt. 1992. Folding kinetics of proteins: a model study. J. Chem. Phys. 97:525–535. [Google Scholar]
- Honeycutt, J. D., and D. Thirumalai. 1992. The nature of folded states of globular-proteins. Biopolymers. 32:695–709. [DOI] [PubMed] [Google Scholar]
- Kellermayer, M. S. Z., S. B. Smith, H. L. Granzier, and C. Bustamante. 1997. Folding-unfolding transitions in single titin molecules characterized with laser tweezers. Science. 276:1112–1116. [DOI] [PubMed] [Google Scholar]
- Kim, S.-Y., S. J. Lee, and J. Lee. 2003. Conformational space annealing and an off-lattice frustrated model protein. J. Chem. Phys. 119:10274–10279. [Google Scholar]
- Klimov, D. K., and D. Thirumalai. 1999. Stretching single-domain proteins: phase diagram and kinetics of force-induced unfolding. Proc. Natl. Acad. Sci. USA. 96:6166–6170. [DOI] [PMC free article] [PubMed] [Google Scholar]
- Klimov, D. K., and D. Thirumalai. 2001. Lattice model studies of force-induced unfolding of proteins. J. Phys. Chem. B. 105:6648–6654. [Google Scholar]
- Klimov, D. K., and D. Thirumalai. 2000. Native topology determines force-induced unfolding pathways in globular proteins. Proc. Natl. Acad. Sci. USA. 97:7254–7259. [DOI] [PMC free article] [PubMed] [Google Scholar]
- Krammer, A., H. Lu, B. Isralewitz, K. Schulten, and V. Vogel. 1999. Forced unfolding of the fibronectin type III module reveals a tensile molecular recognition switch. Proc. Natl. Acad. Sci. USA. 96:1351–1356. [DOI] [PMC free article] [PubMed] [Google Scholar]
- Lacks, D. J. 1998. Localized mechanical instabilities and structural transformations in silica glass under high pressure. Phys. Rev. Lett. 80:5385–5388. [Google Scholar]
- Lacks, D. J. 2000. First-order amorphous-amorphous transformation in silica. Phys. Rev. Lett. 84:4629–4632. [DOI] [PubMed] [Google Scholar]
- Lacks, D. J. 2001. Energy landscapes and the non-Newtonian viscosity of liquids and glasses. Phys. Rev. Lett. 87:225502. [DOI] [PubMed] [Google Scholar]
- Lee, Y.-H., and B. J. Berne. 2000. Global optimization: quantum thermal annealing with path integral Monte Carlo. J. Phys. Chem. A. 104:86–95. [Google Scholar]
- Li, F.-Y., J.-M. Yuan, and C.-Y. Mou. 2001. Mechanical unfolding and refolding of proteins: an off-lattice model study. Phys. Rev. E. 63:021905. [DOI] [PubMed] [Google Scholar]
- Li, P.-C., and D. E. Makarov. 2003. Theoretical studies of the mechanical unfolding of the muscle protein titin: bridging the timescale gap between simulation and experiment. J. Chem. Phys. 119:9260–9268. [Google Scholar]
- Lu, H., B. Isralewitz, A. Krammer, V. Vogel, and K. Schulten. 1998. Unfolding of titin immunoglobulin domains by steered molecular dynamics simulation. Biophys. J. 75:662–671. [DOI] [PMC free article] [PubMed] [Google Scholar]
- Lu, H., and K. Schulten. 2000. The key event in force-induced unfolding of titin's immunoglobulin domains. Biophys. J. 79:51–65. [DOI] [PMC free article] [PubMed] [Google Scholar]
- Malandro, D. L., and D. J. Lacks. 1998. Molecular-level mechanical instabilities and enhanced self-diffusion in flowing liquids. Phys. Rev. Lett. 81:5576–5579. [Google Scholar]
- Nymeyer, H., A. E. Garcia, and J. N. Onuchic. 2002. Folding funnels and frustration in off-lattice minimalist protein landscapes. Proc. Natl. Acad. Sci. USA. 95:5921–5928. [DOI] [PMC free article] [PubMed] [Google Scholar]
- Onuchic, J. L., Z. Luthey-Schulten, and P. G. Wolynes. 1997. Theory of protein folding: the energy landscape perspective. Annu. Rev. Phys. Chem. 48:545–600. [DOI] [PubMed] [Google Scholar]
- Paci, E., and M. Karplus. 1999. Forced unfolding of fibronectin type 3 modules: an analysis by biased molecular dynamics simulations. J. Mol. Biol. 288:441–459. [DOI] [PubMed] [Google Scholar]
- Paci, E., and M. Karplus. 2000. Unfolding proteins by external forces and temperature: the importance of topology and energetics. Proc. Natl. Acad. Sci. USA. 97:6521–6526. [DOI] [PMC free article] [PubMed] [Google Scholar]
- Press, W. H., S. A. Teukolsky, W. T. Vetterling, and B. P. Flannery. 1992. Numerical Recipes in FORTRAN, 2nd Ed. Cambridge University Press, New York.
- Rathore, H., Q. Yan, and J. J. de Pablo. 2004. Molecular simulation of the reversible mechanical unfolding of proteins. J. Chem. Phys. 120:5781–5788. [DOI] [PubMed] [Google Scholar]
- Rief, M., M. Gautel, F. Oesterhelt, J. M. Fernandez, and H. E. Gaub. 1997. Reversible unfolding of individual titin immunoglobulin domains by AFM. Science. 276:1109–1112. [DOI] [PubMed] [Google Scholar]
- Socci, N., J. N. Onuchic, and P. G. Wolynes. 1999. Stretching lattice models of protein folding. Proc. Natl. Acad. Sci. USA. 96:2031–2035. [DOI] [PMC free article] [PubMed] [Google Scholar]
- Stillinger, F. H., and T. A. Weber. 1984. Packing structures and transitions in liquids and solids. Science. 225:983–989. [DOI] [PubMed] [Google Scholar]
- Tskhovrebova, L., J. Trinick, J. A. Sleep, and R. M. Simmons. 1997. Elasticity and unfolding of single molecules of the giant muscle protein titin. Nature. 387:308–312. [DOI] [PubMed] [Google Scholar]


