Abstract
The dissociation of protein ions formed by ESI ranging in size from 12 to 29 kDa using sustained off-resonance irradiation collisional activation was investigated as a function of charge state in a 9.4-T Fourier transform mass spectrometer. Addition of m-nitrobenzyl alcohol to denaturing solutions of proteins was used to form very high charge states of protein ions for these experiments. For all proteins in this study, activation of the highest charge state results in a single dominant backbone cleavage, often with less abundant cleavages at the neighboring 3–5 residues. This surprising phenomenon may be useful for the “top-down” identification of proteins by producing sequence tags with optimum sensitivity. There is a slight preference for cleavage adjacent to acidic residues and proline. Solution-phase secondary structure does not appear to play a significant role. The very limited dissociation channels observed for the supercharged ions may be due, in part, to the locations of the charges on the protein.
Electrospray ionization1 mass spectrometry (ESI-MS) is a fast, sensitive, and highly accurate method for measuring the masses of large molecules. With ESI coupled to Fourier transform mass spectrometry (FTMS), mass measurements accurate to within 1 Da have been made for proteins as large as 105 Da.2 With the unsurpassed resolving power of FTMS (~107 for ubiquitin),3 isotopic resolution of protein ions with masses >105 Da can be obtained. This makes possible the unambiguous determination of both the mass and the charge of an ion, a feature particularly advantageous in tandem mass spectrometry (MS/MS) experiments, in which the charge states of fragment ions must be determined in order to obtain their masses. FTMS has extensive capabilities for MS/MS.4 For example, Smith and co-workers5 performed up to four stages of MS/MS (MS4) on cations of cytochrome c (12.4 kDa) variants using FTMS. On the basis of the observed differences in fragmentation patterns, the authors were able to differentiate between variants of the protein that differed by as few as 3 out of 104 amino acid residues. Many activation methods have been used with FTMS, including collisionally activated dissociation (CAD),6–11 ultraviolet photodissociation,12,13 surface-induced dissociation (SID),14,15 infrared multi-photon dissociation (using a CO2 laser16,17 or a blackbody field18,19 as the source of infrared photons), and electron capture dissociation (ECD).20,21
Both on-6–10 and off-resonance10,11 implementations of CAD have been used in FTMS. In on-resonance CAD, the kinetic energy of the precursor ion is increased by applying a signal with a frequency equal to the ion’s cyclotron frequency. A collision gas, for example, nitrogen, is introduced into the ion cell, and the internal energy of the excited ions is increased by multiple ion-neutral collisions. The fragmentation efficiency of an on-resonance CAD experiment can be increased substantially, for example, from <30 to 80%,10 by using multiple steps of ion acceleration and deceleration.7–10 In sustained off-resonance irradiation (SORI)-CAD,11 the precursor ions are excited with a signal that is ~75 to 4000 Hz off-resonance with the ion cyclotron frequency. As the excitation signal is applied, the precursor ions undergo multiple cycles of acceleration and deceleration as the ion cyclotron frequency and the applied frequency go in and out of phase. In comparing the various on- and off-resonance methods for CAD of large multiply charged ions, McLafferty and co-workers concluded that SORI-CAD is the preferred method because of its high selectivity, fragmentation efficiency, and ease of implementation.10
To identify and characterize proteins in a complex mixture, a sample is often digested with proteolytic enzymes prior to separation and mass analysis.22 Performing MS/MS on intact protein ions is a promising method for bypassing the proteolysis step, thus potentially reducing the amount of sample and time required for analysis.23 For completely characterizing a protein’s primary structure, an activation method that cleaves all interresidue bonds with similar selectivity is desired. ECD is an activation method that appears to be particularly nonselective.20,21 Unlike ECD, slow heating methods, such as SORI-CAD or IRMPD, selectively cleave the most labile bonds. These are promising methods for rapidly identifying proteins by generating sequence tags (partial sequences of 2–3 adjacent residues).24–27 For example, Mørtz et al. identified proteins with molecular weights between 8 and 43 kDa using only one or two sequence tags generated by MS/MS of the intact protein ions.27
The fragmentation pathways of protein ions depend on several factors, including precursor ion charge state,19,28–34 primary structure,35–40 and activation method.6–21 Dissociation of different charge states of the same peptide or protein can give rise to drastically different fragmentation products. For example, dissociation of ubiquitin 5+ results in exclusively sequential loss of small molecules (NH3 and/or H2O), whereas dissociation of ubiquitin 11+ results in predominantly backbone cleavage to produce a limited number of b and y complementary ion pairs. The difference in dissociation behavior for these two charge states is due to structural differences between the two charge states.28
McLuckey and co-workers have performed CAD on various charge states of several proteins, including insulin (1+ to 5+),29 ubiquitin (1+ to 12+),30 hemoglobin β-chain (2+ to 17+),31 cytochrome c (<5+ to 15+),32 and myoglobin (2+ to 21+),33 using a quadrupole ion trap mass spectrometer. Although the ion trap does not provide isotopic resolution of large multiply charged ions, the authors remove the charge ambiguity of the fragment ions by converting them to singly charged ions prior to mass analysis using ion/ion reactions.41 Ion/ion reactions were also used to prepare very low charge states of protein ions for CAD by removing charges from the protein ions formed by ESI. As was observed previously,19,28 low charge states were observed to dissociate predominantly by losses of NH3 and H2O, whereas higher charge states were found to dissociate by more structurally informative backbone cleavages. As noted previously by others,35–40 the amide bonds N-terminal to proline residues35–37 and C-terminal to aspartic acid and glutamic acid residues38–40 were frequently observed as preferred backbone cleavage sites, but the relative contributions of the various possible cleavage sites were found to depend strongly on precursor ion charge state. In all work reported thus far, the number of charges on the precursor ions is limited to that which the authors are able to form from typical denaturing solutions, for example, 90% methanol/9% water/1% acetic acid. The denaturation of proteins in solution due to the addition of acid at low levels (0.5–5%) causes higher charge states to be formed in ESI.42
Recently, we reported a simple method for increasing the abundances of high charge states of protein ions formed by ESI by adding small amounts of solvents, such as m-nitrobenzyl alcohol (m-NBA), to denaturing solutions of proteins. With this method, it is possible to form charge states higher than that obtained by electrospraying from a typical denaturing solution.43–46 Here, we examine the fragmentation of highly charged protein cations activated by SORI-CAD in FTMS. We show that precursor ions with very high charge give rise to a degree of highly selective fragmentation, that is, one dominant fragmentation channel, which is not observed for the intermediate charge states. We also investigate the correlation of the preferred cleavage sites with primary and secondary structure as well as charge sites.
EXPERIMENTAL SECTION
Experiments were performed on a Fourier transform mass spectrometer equipped with a 9.4-T superconducting magnet and an external ESI source. This instrument is described elsewhere.47 Solutions were infused through a 150-μm-i.d. fused-silica capillary at a flow rate of 1.0 μL/min using a syringe pump (Harvard Apparatus, South Natick, MA). The electrospray voltage was 4.4 kV. The ions and droplets were generated by pneumatically assisted electrospray and were sampled from atmospheric pressure through a glass capillary. A countercurrent flow of heated nitrogen (120 °C) was used to promote evaporation of the electrospray droplets. Ions were accumulated in an external hexapole ion trap and gated into the cell. Ions were dynamically trapped in the cell using pulses of nitrogen (peak pressure ~1–5 × 10⁻⁶ Torr). The ion of interest was isolated using correlated sweeps. To perform SORI-CAD on the isolated ion, a single-frequency excitation waveform with an applied peak-to-peak potential of 3–16 V and a frequency 1000 Hz below the ion’s cyclotron frequency was applied for 1.0 s. Nitrogen was used as the collision gas and was introduced via a pulsed valve (open for 50–200 ms) to a peak pressure of ~1–5 × 10⁻⁶ Torr. The pressure in the cell returned to ~1–5 × 10⁻⁹ Torr prior to detection. Cell pressures were monitored using an uncalibrated ion gauge located above one of the turbomolecular pumps.
Methanol (99.99%) was obtained from EM Science (Gibbstown, NJ). Glacial acetic acid (99.9%) was obtained from Fisher Scientific (Fair Lawn, NJ). Diethylamine (DEA; 98%) and m-nitrobenzyl alcohol (m-NBA; 98%) were obtained from Aldrich Chemical Co. (Milwaukee, WI). Equine cytochrome c (>95%; 12 kDa; 104 residues), equine myoglobin (>90%; 17 kDa; 153 residues), and bovine carbonic anhydrase (93%; 29 kDa; 259 residues) were obtained from Sigma (St. Louis, MO). Stock solutions (10−4 M) of each protein were made in water. The stock solution of carbonic anhydrase was treated with barium acetate (10−3 M) to precipitate sulfate and phosphate impurities. The presence of sulfate and phosphate causes undesirable adduction and consequent reduction in the analyte signal-to-noise ratio.48 Cytochrome c and myoglobin were used without further purification. The standard electrospray solution was 47% water/50% methanol/3% acetic acid, with a protein concentration of 10−5 M. To promote the formation of higher charge states of proteins, m-NBA was added to the electrospray solutions at a level of 0.5%.44,45 To promote the formation of lower charge states of proteins, DEA was added at a level of 0.05–0.1%.43 All solution compositions are reported on a volume/volume basis. Data on the solution structures of proteins are from ref 49. Protein database searches based on molecular weight, organism species, and partial amino acid sequences were performed using the TagIdent tool on the ExPASy Molecular Biology Server (http://us.expasy.org). All searches were of the Swiss-Prot database, Release 41.10 of May 30, 2003, which has 127 477 entries.
RESULTS AND DISCUSSION
Supercharging.
Adding m-NBA at a level of 0.5% to 47% water/ 50% methanol/3% acetic acid solutions of cytochrome c (Figure 1a,b), myoglobin (Figure 1c,d), and carbonic anhydrase (Figure 1e,f) increases the maximum charge state from 18+ to 22+, from 23+ to 25+, and from 37+ to 39+, respectively. Adding m-NBA at levels greater than 0.5% results in a less consistent analyte signal. This magnitude of charge enhancement is less than that reported previously using a quadrupole mass spectrometer.44 For example, addition of m-NBA to solutions of cytochrome c (10−5 M) increases the maximum charge state from 21+ to 24+ and the charge state of highest abundance from 16+ to 22+ on the quadrupole instrument.44 One possible reason for the lower extent of charge enhancement obtained with FTMS is the greater time ions spend in the relatively high-pressure hexapole trap.50 Ions that spend a longer time in high pressure regions undergo more collisions with neutral species, and thus, the higher charge state ions, which are more reactive, may preferentially lose charges through proton-transfer reactions.51
Figure 1.
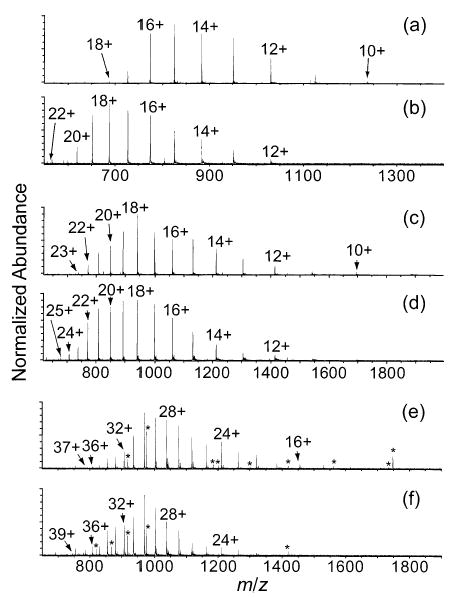
ESI mass spectra of cytochrome c (a,b), myoglobin (c,d), and carbonic anhydrase (e,f) from 47% water/50% methanol/3% acetic acid solutions with (b,d,f) and without (a,c,e) 0.5% m-nitrobenzyl alcohol. Peaks denoted by asterisks are charge states of an impurity of mass 15 599 Da, except for those at m/z 1186 and 1748, which are charge states of impurities of mass 8298 and 15 724 Da, respectively.
Cytochrome c.
Charge states of cytochrome c between 12+ and 21+ were fragmented by SORI-CAD (Figures 2 and 3). Typical spectra are shown in Figure 2 and the backbone fragmentation propensities for all charge states are shown in Figure 3. The major fragmentation channel for all charge states is loss of a singly charged heme group. Nearly half of the fragment ion signal corresponding to backbone cleavage of the 12+ is due to the formation of the two complementary ion pairs, b75/y29 and b25/y79, which are observed at 100 and 78% relative abundance, respectively (Figure 3a). This result is very similar to data reported by McLuckey and co-workers, who dissociated charge states of cytochrome c as high as 15+ in an ion trap mass spectrometer.32 These two most abundant cleavages remain dominant as the precursor ion charge state is increased to 16+, but other channels increase in relative abundance. For example, b21/y83, b50/y54, b65/y39, and b69/y35 increase in relative abundance from 20 to 32%, from 38 to 50%, from <0.5 to 41%, and from 21 to 57%, respectively (Figure 3a–c). As the precursor charge is increased from 16+ to 18+, b25/y79 and b50/y54 decrease dramatically from 89 to 8% and from 49 to 8%, respectively (Figure 3c,d). As the precursor charge is further increased to 20+ and 21+ (Figure 3e,f), b75/y29 decreases from 100 to 12%, and b65/y39 increases from 45 to 100%. Unlike with the lower charge states, the cleavage histograms of 20+ and 21+ are dominated by only one backbone cleavage, b65/y39, with a cluster of 3–5 adjacent backbone cleavages observed at lower abundance (<40%).
Figure 2.
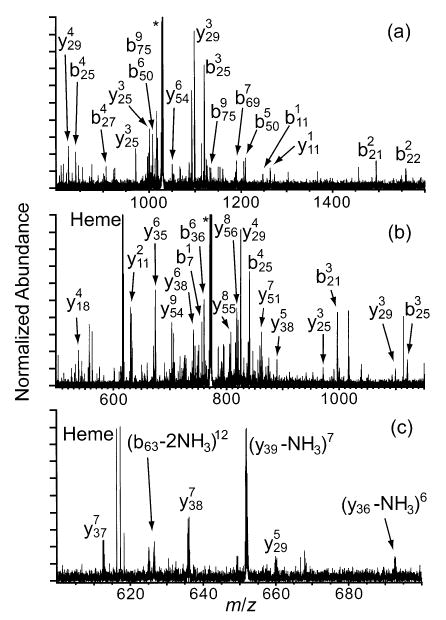
Representative MS/MS spectra of the (a) 12+, (b) 16+, and (c) 21+ charge states of cytochrome c. Residual precursor ion is indicated by the asterisk (*).
Figure 3.
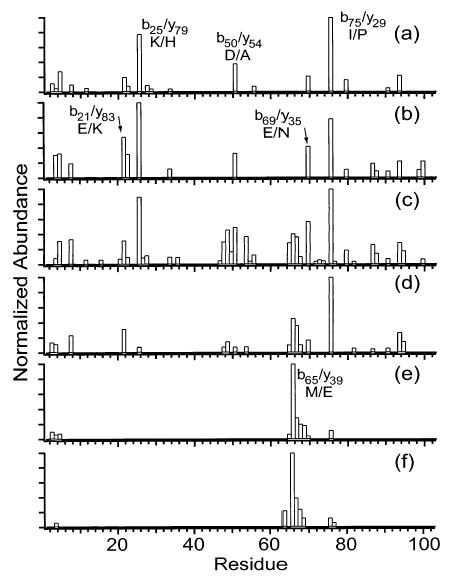
Summed y- and b-ion plots resulting from fragmentation of the (a) 12+, (b) 14+, (c) 16+, (d) 18+, (e) 20+, and (f) 21+ charge states of cytochrome c.
The single main backbone fragmentation channel observed for the highest charge states translates into optimum sensitivity for MS/MS experiments. The clustering of low abundance cleavages adjacent to the main fragmentation channel provides sequence tags that can be useful for analyte identification.24–27 For the 21+ of cytochrome c, cleavage at four adjacent residues (65–68) gives a partial sequence of three residues, EYL/I (leucine and isoleucine have the same mass). Positive identification of the protein from the Swiss-Prot database was obtained from a search based on the correct partial sequence EYL, the species of organism (Equus caballus), and a molecular weight with a mass error range ±25% (no proteins with the incorrect sequence EYI were obtained with these search criteria). Positive identification was also obtained without specifying the organism, using only the partial sequence and a molecular weight accurate to within 1.5 Da.
Interestingly, 16+ exhibits more backbone cleavages (39 out of 104 residues) than any other charge state (Figure 3c). The charge state with the next highest number of cleavages, 18+, has only roughly half as many cleavages as 16+, and only eight cleavages are observed for 21+ (Figure 3d,f). One reason that partially accounts for the different numbers of fragment ions observed for the different charge states is differences in precursor ion abundance, which translates into differences in fragment ion abundance. To eliminate differences due to precursor ion abundance, the fragment ion abundances of all charge states were normalized for precursor ion abundance (using a minimum detectable signal-to-noise ratio of 2). In the resulting ion plots (Figure 4), 12+ has the most backbone cleavages (18), followed by 16+ (14), followed by 21+ (7) and the others. Thus, the far superior sequence coverage observed for 16+ is due only in part to the high precursor ion abundance. More fragmentation channels are competitive in the intermediate charge state ions than in either the low or high charge states.
Figure 4.
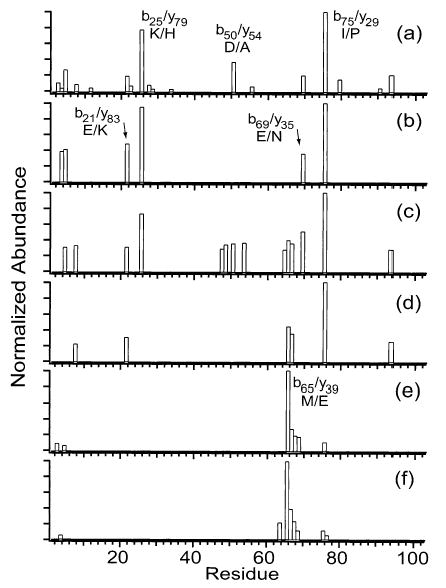
Summed y- and b-ion plots resulting from fragmentation of the (a) 12+, (b) 14+, (c) 16+, (d) 18+, (e) 20+, and (f) 21+ charge states of cytochrome c where the fragment ion abundances are normalized to the precursor ion of lowest abundance (21+).
Effects of Collision Energy.
The effects of varying the excitation amplitude on the dissociation of the 18+ charge state of cytochrome c were examined. As the maximum ion kinetic energy is increased from 14 to 34 eV, the residual precursor ion abundance decreases by 93%, while the total abundance of fragment ions resulting from backbone cleavages increases by a factor of 2.2 (Figure 5). As can be seen in Figure 6a, the order of relative abundance of the various backbone cleavages decreases in the order b75/y29 ≫ b65/y39 > b47/y57 > b21/y83 > all other cleavages. This order remains the same as the maximum kinetic energy is increased from 14 to 34 eV, although the total number of observed backbone cleavages increases from 12 to 20 as other cleavages appear at low (<30% relative) abundance (Figure 6c). The loss of water is also apparent in the residual precursor ion peak clusters in Figure 5 (insets), with the number of molecules lost increasing from up to 2 to up to 4 as the maximum collision energy is increased from 14 to 34 eV. It appears that a high excitation amplitude is desired for optimum fragment ion signal, although the dissipation of precursor ion signal over less structurally informative channels, for example, secondary backbone cleavage and loss of a charged heme group, appears to cause diminishing improvements in fragment ion abundance as the collision energy is increased to higher levels (data not shown).
Figure 5.
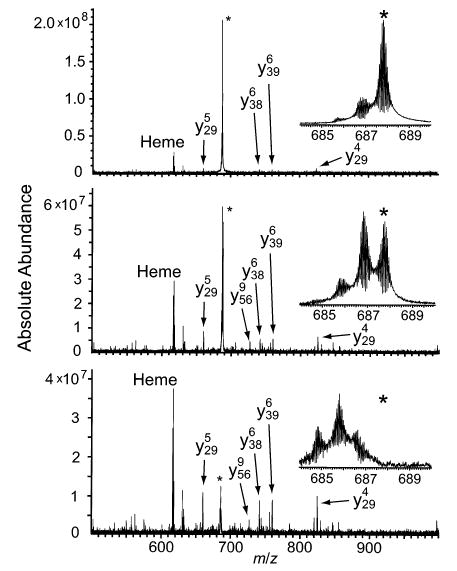
MS/MS spectra resulting from fragmentation of 18+ ions of cytochrome c at maximum ion kinetic energies of (a) 14, (b) 22, and (c) 34 eV. Residual precursor ion is indicated by the asterisk (*).
Figure 6.
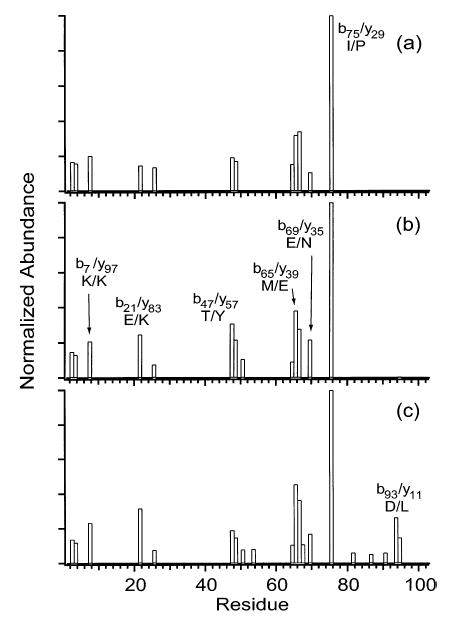
Summed y- and b-ion plots resulting from fragmentation of 18+ ions of cytochrome c at maximum ion kinetic energies of (a) 14, (b) 22, and (c) 34 eV.
Myoglobin.
Charge states of myoglobin between 14+ and 24+ were dissociated (Figures 7 and 8). The number of observed backbone cleavages decreases from 41 to 9 as the precursor charge is increased from 14+ to 24+ (Figure 8). Normalizing the fragment ion abundances for precursor ion abundance does not change the order of the number of cleavages observed for the various charge states (data not shown), indicating that the differences among the observed numbers of cleavages for the various charge states are not due to differences in precursor ion abundance. For 14+ (Figure 8a), b122/y31 is the most intense cleavage at 100% relative abundance, and other cleavages are observed at between 30 and 60% relative abundance. For the 16+, a dramatic change in the dominant cleavage is observed. The b122/y31 decreases in relative abundance from 100% for 14+ to 19% for 16+, and the b2/y151 increases from 15 to 100% (Figure 8a,b). The CAD spectrum of the 20+ is similar to that for the 16+ and 18+ (Figure 8b–d). Other cleavages besides b2/y151 are observed at far lower (≤25%) relative abundance, similar to results reported by McLuckey and co-workers, who fragmented myoglobin charge states up to 21+.33 As the charge is further increased from 20+ to 24+ (Figure 8d–f), the dominant cleavage shifts from b2/y151 to b128/y25, with the former decreasing in relative abundance from 100 to 47% and the latter increasing from <0.5 to 100%.
Figure 7.
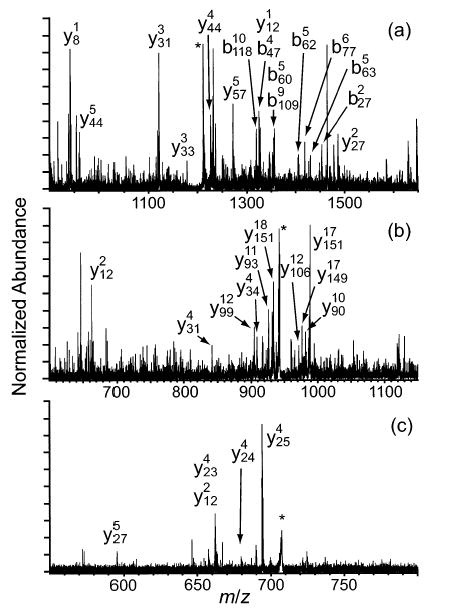
Representative MS/MS spectra resulting from fragmentation of the (a) 14+, (b) 18+, and (c) 24+ charge states of myoglobin. Residual precursor ion is indicated by the asterisk (*).
Figure 8.
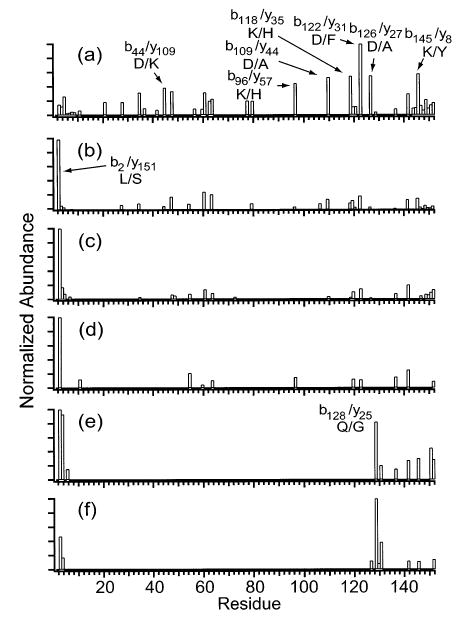
Summed y- and b-ion plots resulting from fragmentation of the (a) 14+, (b) 16+, (c) 18+, (d) 20+, (e) 22+, and (f) 24+ charge states of myoglobin.
Activation of the 24+ of myoglobin produces cleavage at three adjacent residues (128–130), giving a partial sequence of two residues, GA. Positive identification of the protein is obtained from a database search based on this partial sequence, the species of organism, and a molecular weight with a mass error range ±2%.
Carbonic Anhydrase.
Charge states of carbonic anhydrase between 16+ and 36+ were collisionally activated (Figures 9 and 10). The fragmentation of 16+ is dominated by b192/y67 and b198/y61, which are observed at 89 and 100% relative abundance, respectively (Figure 10a). As the precursor charge is increased to 24+ (Figure 10a–c), b192/y67 increases to 100% and b198/y61 decreases to 57%. Other cleavages appear, including b135/y124 and b183/y76, which increase from <0.5 to 39% and from <0.5 to 40%, respectively, as well as approximately eight cleavages near the N-terminus that increase from <0.5 to 2–24% relative abundance. As the precursor charge is increased from 24+ to 32+ (Figure 10c–e), b192/y67, b198/y61, and b135/y124 decrease from 100 to 86%, from 57 to 40%, and from 39 to 19%, respectively, while b183/y76 and b234/y25 increase from 40 to 100% and from 4 to 36%, respectively. These results agree well with the MS/MS spectra of the 24+, 29+, and 32+ charge states of carbonic anhydrase reported by McLafferty and co-workers.34 For the 36+ (Figure 10e,f), the b234/y25 becomes the base peak while all other cleavages decrease to levels ≤26%. As observed with the other proteins, a single backbone cleavage dominates the dissociation of the highest charge state.
Figure 9.
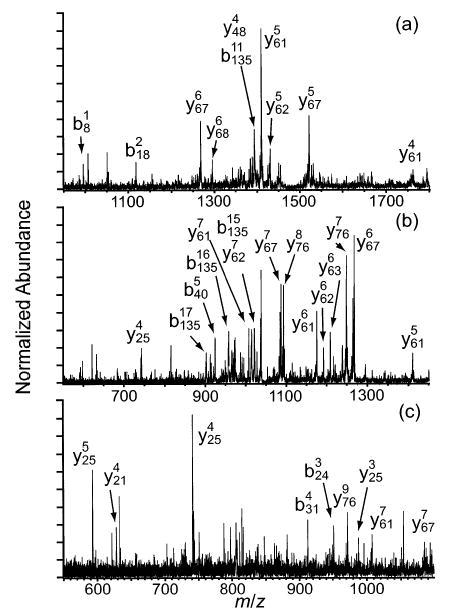
Representative MS/MS spectra resulting from fragmentation of the (a) 20+, (b) 28+, and (c) 36+ charge states of carbonic anhydrase.
Figure 10.
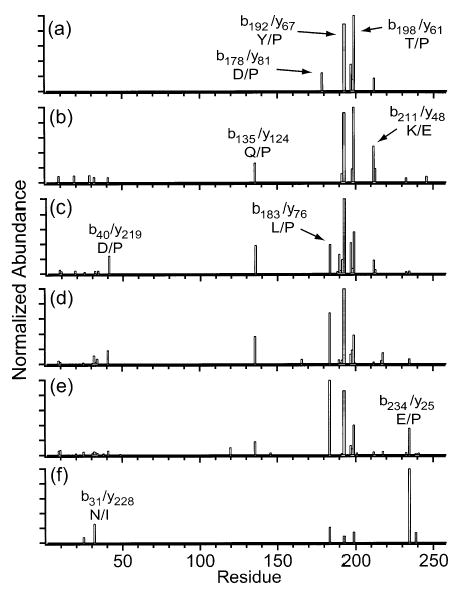
Summed y- and b-ion plots resulting from fragmentation of the (a) 16+, (b) 20+, (c) 24+, (d) 28+, (e) 32+, and (f) 36+ charge states of carbonic anhydrase.
Primary Structure Effects.
The propensities for backbone cleavages adjacent to acidic, basic, and proline residues observed for all charge states of all proteins studied in this work, along with the frequencies of cleavages at these sites if cleavages were located randomly along the protein backbones, are given in Table 1. Table 2 is similar to Table 1, except that only cleavages with observed frequencies ≥50% relative abundance are listed. Cleavages adjacent to acidic residues are slightly favored in cytochrome c and myoglobin, with the observed frequencies exceeding random frequencies by 50 and 41% (relative), respectively (Table 1). The preference for cleavage at acidic residues in these proteins is even more pronounced among only the most abundant cleavages (Table 2), with the observed frequencies greater than random by factors of 3.3 and 1.8, respectively. Unlike with cytochrome c and myoglobin, however, acidic residues are not the preferred sites of cleavage in carbonic anhydrase cations, because the observed cleavage frequency for these sites is ~25% less than random (Table 1), and none of the most abundant cleavages are at acidic residues (Table 2). Carbonic anhydrase has a higher proline content (7.3%) than cytochrome c (3.8%) or myoglobin (2.6%), and this may be one reason for the more frequent cleavages at proline residues observed for carbonic anhydrase. Cytochrome c and myoglobin have slightly higher contents of acidic residues (12 and 14%, respectively) than carbonic anhydrase (10%). The observed cleavage frequencies at proline residues are approximately random for cytochrome c and myoglobin. However, the observed cleavage frequency is more than twice the random frequency for carbonic anhydrase (Table 1). Among the most abundant cleavages of cytochrome c and carbonic anhydrase, the observed frequencies at proline exceed the random frequencies by factors of 2.1 and 7.1, respectively. However, none of the most abundant cleavages of myoglobin are at proline residues (Table 2). In all cases, cleavage frequencies at basic residues are equal to or less than random frequencies, except for cytochrome c, for which the observed frequency is slightly greater (15% relative) than random. Although there is a slight preference for cleavage adjacent to acidic residues and proline, the primary structure alone does not appear to be a dominant factor in the dissociation pathways of these ions.
Table 1.
Observed versus Random Frequencies of Backbone Cleavages Adjacent to Acidic (Asp and Glu), Basic (Arg, Lys, and His), and Proline Residues for All Charge States of the Proteins Dissociated by SORI-CAD in This Worka
| acidic % | basic % | proline % | ||
|---|---|---|---|---|
| cytochrome c | observed | 30 | 45 | 7 |
| random | 20 | 39 | 8 | |
| myoglobin | observed | 38 | 36 | 6 |
| random | 27 | 36 | 5 | |
| carbonic anhydrase | observed | 15 | 10 | 33 |
| random | 20 | 25 | 14 |
A total of 44, 47, and 39 backbone cleavages are observed for cytochrome c, myoglobin, and carbonic anhydrase, respectively.
Table 2.
Observed versus Random Frequencies of Cleavages≥50% Relative Abundance Adjacent to Acidic (Asp and Glu), Basic (Arg, Lys, and His), and Proline Residues for All Charge States of the Proteins Dissociated by SORI-CAD in This Worka
| acidic % | basic % | proline % | ||
|---|---|---|---|---|
| cytochrome c | observed | 67 | 33 | 17 |
| random | 20 | 39 | 8 | |
| myoglobin | observed | 50 | 25 | 0 |
| random | 27 | 36 | 5 | |
| carbonic anhydrase | observed | 0 | 0 | 100 |
| random | 20 | 25 | 14 |
A total of 6, 8, and 4 backbone cleavages are observed at ≥50% relative abundance for cytochrome c, myoglobin, and carbonic anhydrase, respectively.
Secondary Structure Effects.
It has been shown that elements of protein secondary structure, such as helices, and elements of tertiary structure can exist in the gas phase.52–54 In the absence of other factors, for example, unfavorable interactions between a charge and a helix dipole moment,55 structures, such as helices that are stabilized by intramolecular hydrogen bonding, should be even more stable in the absence of solvent.56 Native cytochrome c, myoglobin, and carbonic anhydrase have α-helical contents in aqueous solution of 41, 74, and 14%, respectively.49 From the solution structures49 of the proteins used in this study, the observed frequencies of cleavages ≥50% abundance adjacent to helix ends are compared with random cleavage frequencies in Table 3. The observed frequency for cytochrome c exceeds the random frequency by 28% (relative), and little or no preference for cleavage at helix ends is apparent for myoglobin or carbonic anhydrase (Table 3).
Table 3.
Observed versus Random Frequencies of Backbone Cleavages≥50% Relative Abundance within One Amino Acid Residue of the Beginning or End of An α-Helical Region for All Charge States of the Proteins Dissociated by SORI-CAD in This Worka
| protein | observed % | random % |
|---|---|---|
| cytochrome c | 50 | 39 |
| myoglobin | 43 | 39 |
| carbonic anhydrase | 17 | 22 |
The calculated random frequencies are based on the solution-phase protein secondary structure as described in ref 49.
This analysis is complicated by a lack of detailed information on the secondary structure in the gas phase. McLafferty and coworkers54 have used gas-phase H/D exchange coupled with SORI-CAD to probe the gas-phase conformations of cytochrome c cations (helical regions are protected from exchange). Although activation by SORI-CAD causes some degree of H/D scrambling, thus potentially destroying information, the H/D ratios of fragment ions that differ significantly from a statistical distribution can potentially provide information on sites of exchange. From the results of their experiments, the authors concluded that the helical regions of gas-phase cytochrome c cations include residues 21–25, 50–55, 69–73, and 87–93. For comparison, the regions that are helical in solution are residues 3–13, 50–54, 61–69, 71–74, and 88–101.49 It is interesting to note that there is a slightly increased fraction of cleavages near α-helices if the gas-phase data are used (67 vs 50%). However, this may simply be a consequence of a very limited data set.
Proximity of Backbone Cleavages to Charges.
Using a pseudorandom walk algorithm, Schnier et al.52,57 calculated the lowest energy charge configurations of various charge states of several proteins, including equine cytochrome c and bovine carbonic anhydrase. The simplifying approximation of point charges on a linear string is used to model the protein ions. Figure 11 compares the calculated propensity to charge sites in the protein with the observed backbone cleavage sites of cytochrome c ions. As the precursor charge state is increased from 16+ to 21+, the protonation frequencies of residues 22 and 26 increase from 25 and 62%, respectively, to 100%, and the nearby cleavages at residues 21 and 25 decrease in relative abundance from 32 and 78% to <1% (Figure 11b,c). In addition, as the protonation frequency of residue 76 increases from <1 to 80%, the cleavage at nearby residue 75 decreases by almost an order of magnitude (Figure 11b,c). Thus, these major backbone cleavages decrease in relative abundance as the residues in their immediate vicinity become charged. The single dominant backbone cleavage observed for 21+, at residue 65, is within the largest gap between charges in this highly charged ion (residues 60–71; Figure 11c). A similar trend is observed with carbonic anhydrase ions (Figure 12). The major backbone cleavages observed for 16+ are within a gap in charges between residues 173 and 200. As the precursor ion charge is increased from 16+ to 36+, this region becomes charged as residues 181, 186, 192, and 195 become protonated with frequencies of 37–100%. The backbone cleavages within this region simultaneously decrease in relative abundance from as high as 100% to 9–21% (Figure 12a–c). The dominant backbone cleavage observed for 36+, at residue 234, is in the largest gap between charges (residues 227–240) of this charge state (Figure 12c). This apparent preference against backbone cleavages at charge sites may possibly be due to the solvation of charges by the carbonyl oxygens of the backbone and polar side chains, resulting in local stabilization of the peptide backbone.
Figure 11.
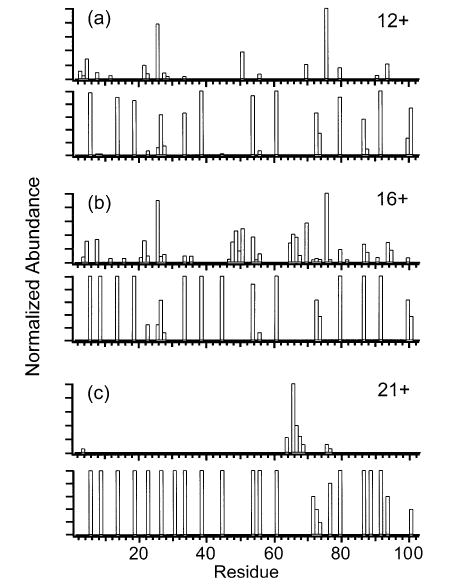
Comparison of the summed y- and b-ion plots with the frequencies of protonating individual residues of the (a) 12+, (b) 16+, and (c) 21+ charge states of cytochrome c. For each charge state, the summed y- and b-ion plot is shown above the corresponding protonation frequency plot. The frequencies of protonating residues are from ref 52.
Figure 12.
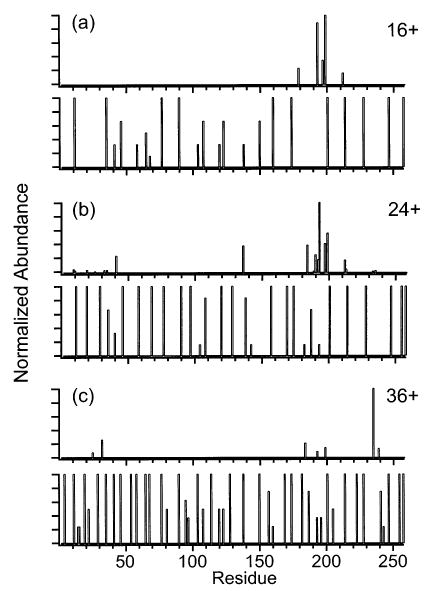
Summed y- and b-ion plots compared with the frequencies of protonating individual residues of the (a) 16+, (b) 24+, and (c) 36+ charge states of carbonic anhydrase. For each charge state, the summed y- and b-ion plot is shown above the corresponding protonation frequency plot. The frequencies of protonating residues are from ref 57.
CONCLUSIONS
The fragmentation of high charge states of proteins ranging in size from 104 to 259 amino acid residues was investigated. For supercharged ions formed using m-nitrobenzyl alcohol, the number of observed fragment ions is dramatically reduced compared to the intermediate charge states that have been investigated previously. For all these proteins investigated, dissociation of the highest charge state resulted in a single fragment ion with a relative abundance above 50%. A cluster of three to five neighboring cleavages at lower abundance was also frequently observed at the site of dominant backbone cleavage for high precursor charge states. This phenomenon may be useful for identifying proteins with optimum sensitivity, because the fragment ion signal is distributed to only a limited number of channels, and these channels can serve as sequence tags. There appears to be a slight preference for cleavage adjacent to acidic residues and proline, as has been reported previously. A very minor propensity to cleave at the ends of helical regions of cytochrome c ions was observed, but no preference for cleavage at helix ends was observed for myoglobin or carbonic anhydrase. The reason for the greatly simplified dissociation spectra of the very high charge states is not clear, although the location of charges on these proteins may be influencing the dissociation pathways. We are currently investigating other factors that may account for this surprising result.
Acknowledgments
The authors thank Mr. John Jurchen for useful discussions. Generous financial support for this research was provided by the National Institutes of Health (Grant no. R01-GM64712-01).
References
- 1.Fenn JB, Mann M, Meng CK, Wong SF, Whitehouse CM. Science. 1989;246:64–71. doi: 10.1126/science.2675315. [DOI] [PubMed] [Google Scholar]
- 2.Kelleher NL, Senko MW, Siegel MM, McLafferty FW. J Am Soc Mass Spectrom. 1997;8:380–383. [Google Scholar]
- 3.Shi SDH, Hendrickson CL, Marshall AG. Proc Natl Acad Sci USA. 1998;95:11532–11537. doi: 10.1073/pnas.95.20.11532. [DOI] [PMC free article] [PubMed] [Google Scholar]
- 4.Williams ER. Anal Chem. 1998;70:179A–185A. doi: 10.1021/ac981773x. [DOI] [PMC free article] [PubMed] [Google Scholar]
- 5.Wu Q, Van Orden S, Cheng X, Bakhtiar R, Smith RD. Anal Chem. 1995;67:2498–2509. doi: 10.1021/ac00110a027. [DOI] [PubMed] [Google Scholar]
- 6.Cody RB, Burnier RC, Freiser BS. Anal Chem. 1982;54:96–101. [Google Scholar]
- 7.Williams ER, McLafferty FW. J Am Soc Mass Spectrom. 1990;1:427–430. doi: 10.1016/1044-0305(90)85025-H. [DOI] [PubMed] [Google Scholar]
- 8.Boering KA, Rolfe J, Brauman JI. Rapid Commun Mass Spectrom. 1992;5:406–414. [Google Scholar]
- 9.Lee SA, Jiao CQ, Huang Y, Freiser BS. Rapid Commun Mass Spectrom. 1993;7:819–821. [Google Scholar]
- 10.Senko MW, Speir JP, McLafferty FW. Anal Chem. 1994;66:2801–2808. doi: 10.1021/ac00090a003. [DOI] [PubMed] [Google Scholar]
- 11.Gauthier JW, Trautman TR, Jacobson DB. Anal Chim Acta. 1991;246:211–225. [Google Scholar]
- 12.Hunt DF, Shabanowitz J, Yates JR. J Chem Soc, Chem Commun. 1987:548–550. [Google Scholar]
- 13.Williams ER, Furlong JJP, McLafferty FW. J Am Soc Mass Spectrom. 1990;1:288–294. doi: 10.1016/1044-0305(90)85003-5. [DOI] [PubMed] [Google Scholar]
- 14.Williams ER, Henry KD, McLafferty FW, Shabanowitz J, Hunt DF. J Am Soc Mass Spectrom. 1990;1:413–416. doi: 10.1016/1044-0305(90)85022-E. [DOI] [PubMed] [Google Scholar]
- 15.Ijames CF, Wilkins CL. Anal Chem. 1990;62:1295–1299. doi: 10.1021/ac00212a017. [DOI] [PubMed] [Google Scholar]
- 16.Woodin RL, Bomse DS, Beauchamp JL. J Am Chem Soc. 1978;100:3248–3250. [Google Scholar]
- 17.Little DP, Speir JP, Senko MW, O’Connor PB, McLafferty FW. Anal Chem. 1994;66:2809–2815. doi: 10.1021/ac00090a004. [DOI] [PubMed] [Google Scholar]
- 18.Thölmann D, Tonner DS, McMahon TB. J Phys Chem. 1994;98:2002–2004. [Google Scholar]
- 19.Price WD, Schnier PD, Williams ER. Anal Chem. 1996;68:859–866. doi: 10.1021/ac951038a. [DOI] [PubMed] [Google Scholar]
- 20.Zubarev RA, Kelleher NL, McLafferty FW. J Am Chem Soc. 1998;120:3265–3266. [Google Scholar]
- 21.Sze SK, Ge Y, Oh H, McLafferty FW. Proc Natl Acad Sci USA. 2002;99:1774–1779. doi: 10.1073/pnas.251691898. [DOI] [PMC free article] [PubMed] [Google Scholar]
- 22.Aebersold R, Goodlet DR. Chem Rev. 2001;101:269–296. doi: 10.1021/cr990076h. and references therein. [DOI] [PubMed] [Google Scholar]
- 23.Kelleher NL, Lin HY, Valaskovic GA, Aaserud DJ, Fridriksson EK, McLafferty FW. J Am Chem Soc. 1999;121:806–812. [Google Scholar]
- 24.Mann M, Wilm M. Anal Chem. 1994;66:4390–4399. doi: 10.1021/ac00096a002. [DOI] [PubMed] [Google Scholar]
- 25.Yates JR, McCormack AL, Eng J. Anal Chem. 1996;68:534–540. doi: 10.1021/ac962050l. [DOI] [PubMed] [Google Scholar]
- 26.Mann M, Højrup P, Roepstorff P. Biol Mass Spectrom. 1993;22:338–345. doi: 10.1002/bms.1200220605. [DOI] [PubMed] [Google Scholar]
- 27.Mørtz E, O’Connor PB, Roepstorff P, Kelleher NL, Wood TD, McLafferty FW, Mann M. Proc Natl Acad Sci USA. 1996;93:8264–8267. doi: 10.1073/pnas.93.16.8264. [DOI] [PMC free article] [PubMed] [Google Scholar]
- 28.Jockusch RA, Schnier PD, Price WD, Strittmatter EF, Demirev PA, Williams ER. Anal Chem. 1997;69:1119–1126. doi: 10.1021/ac960804q. [DOI] [PMC free article] [PubMed] [Google Scholar]
- 29.Wells JM, Stephenson JL, Jr, McLuckey SA. Int J Mass Spectrom. 2000;203:A1–A9. [Google Scholar]
- 30.Reid GE, Wu J, Chrisman PA, Wells JM, McLuckey SA. Anal Chem. 2001;73:3274–3281. doi: 10.1021/ac0101095. [DOI] [PubMed] [Google Scholar]
- 31.Schaaff TG, Cargile BJ, Stephenson JL, Jr, McLuckey SA. Rapid Commun Mass Spectrom. 2000;72:899–907. doi: 10.1021/ac991344e. [DOI] [PubMed] [Google Scholar]
- 32.Engel BJ, Pan P, Reid GE, Wells JM, McLuckey SA. Int J Mass Spectrom. 2002;219:171–187. [Google Scholar]
- 33.Newton KA, Chrisman PA, Reid GE, Wells JM, McLuckey SA. Int J Mass Spectrom. 2001;212:359–376. doi: 10.1002/rcm.512. [DOI] [PubMed] [Google Scholar]
- 34.O’Connor PB, Speir JP, Senko MW, Little DP, McLafferty FW. J Mass Spectrom. 1995;30:88–93. [Google Scholar]
- 35.Biemann K, Martin SA. Mass Spectrom Rev. 1987;6:1–75. [Google Scholar]
- 36.Hunt DF, Yates JR, III, Shabanowitz J, Winston S, Hauer CR. Proc Natl Acad Sci USA. 1986;83:6233–6237. doi: 10.1073/pnas.83.17.6233. [DOI] [PMC free article] [PubMed] [Google Scholar]
- 37.Loo JA, Edmonds CG, Smith RD. Anal Chem. 1993;65:425–438. doi: 10.1021/ac00052a020. [DOI] [PubMed] [Google Scholar]
- 38.Yu W, Vath JE, Huberty MC, Martin SA. Anal Chem. 1993;65:3015–3023. doi: 10.1021/ac00069a014. [DOI] [PubMed] [Google Scholar]
- 39.Bakhtiar R, Wu Q, Hofstadler SA, Smith RD. Biol Mass Spectrom. 1994;23:707–710. doi: 10.1002/bms.1200231110. [DOI] [PubMed] [Google Scholar]
- 40.Qin J, Chait BT. J Am Chem Soc. 1995;117:5411–5412. [Google Scholar]
- 41.Stephenson JL, McLuckey SA. J Am Chem Soc. 1996;118:7390–7397. [Google Scholar]
- 42.Chowdhury SK, Katta V, Chait BT. J Am Chem Soc. 1990;112:9012–9013. [Google Scholar]
- 43.Iavarone AT, Jurchen JC, Williams ER. J Am Soc Mass Spectrom. 2000;11:976–985. doi: 10.1016/S1044-0305(00)00169-0. [DOI] [PMC free article] [PubMed] [Google Scholar]
- 44.Iavarone AT, Jurchen JC, Williams ER. Anal Chem. 2001;73:1455–1460. doi: 10.1021/ac001251t. [DOI] [PMC free article] [PubMed] [Google Scholar]
- 45.Iavarone AT, Williams ER. Int J Mass Spectrom. 2002;219:63–72. [Google Scholar]
- 46.Iavarone AT, Williams ER. J Am Chem Soc. 2003;125:2319–2327. doi: 10.1021/ja021202t. [DOI] [PMC free article] [PubMed] [Google Scholar]
- 47.Jurchen JC, Williams ER. J Am Chem Soc. 2003;125:2817–2826. doi: 10.1021/ja0211508. [DOI] [PMC free article] [PubMed] [Google Scholar]
- 48.Chowdhury SK, Katta V, Beavis RC, Chait BT. J Am Soc Mass Spectrom. 1990;1:382–388. doi: 10.1016/1044-0305(90)85018-H. [DOI] [PubMed] [Google Scholar]
- 49.Laskowski, R.; Hutchinson, G.; Michie, A.; Wallace, A.; Jones, M.; Martin, A.; Luscombe, N.; Milburn, D.; Kasuya, A.; Thornton, J. PBDsum: Summaries and Structural Analyses of PDB Data Files. Retrieved November 11, 2002 from University College London, Department of Biochemistry and Molecular Biology, Biomolecular Structure and Modeling Group web site: http://www.biochem.ucl.ac.uk/bsm/pdbsum
- 50.Senko MW, Hendrickson CL, Emmett MR, Shi SDH, Marshall AG. J Am Soc Mass Spectrom. 1997;8:970–976. [Google Scholar]
- 51.Williams ER. J Mass Spectrom. 1996;31:831–842. doi: 10.1002/(SICI)1096-9888(199608)31:8<831::AID-JMS392>3.0.CO;2-7. [DOI] [PMC free article] [PubMed] [Google Scholar]
- 52.Schnier PD, Gross DS, Williams ER. J Am Chem Soc. 1995;117:6747–6757. [Google Scholar]
- 53.Shelimov KB, Clemmer DE, Hudgins RR, Jarrold MF. J Am Chem Soc. 1997;119:2240–2248. [Google Scholar]
- 54.McLafferty FW, Guan Z, Haupts U, Wood TD, Kelleher NL. J Am Chem Soc. 1998;120:4732–4740. [Google Scholar]
- 55.Hudgins RR, Jarrold MF. J Am Chem Soc. 1999;121:3494–3501. [Google Scholar]
- 56.Wolynes PG. Proc Natl Acad Sci USA. 1995;95:11532–11533. [Google Scholar]
- 57.Schnier PD, Gross DS, Williams ER. J Am Soc Mass Spectrom. 1995;6:1086–1097. doi: 10.1016/1044-0305(95)00532-3. [DOI] [PubMed] [Google Scholar]


