

Abstract
The mechanism of long-range coupling of allosteric sites in calcium-saturated calmodulin (CaM) has been explored by characterizing structural and dynamics effects of mutants of calmodulin in complex with a peptide corresponding to the smooth muscle myosin light chain kinase calmodulin-binding domain (smMLCKp). Four CaM mutants were examined: D95N and D58N, located in Ca2+-binding loops; and M124L and E84K, located in the target domain-binding site of CaM. Three of these mutants have altered allosteric coupling either between Ca2+-binding sites (D58N and D95N) or between the target- and Ca2+-binding sites (E84K). The structure and dynamics of the mutant calmodulins in complex with smMLCKp were characterized using solution NMR. Analysis of chemical shift perturbations was employed to detect largely structural perturbations. 15N and 2H relaxation was employed to detect perturbations of the dynamics of the backbone and methyl-bearing side chains of calmodulin. The least median squares method was found to be robust in the detection of perturbed sites. The main chain dynamics of calmodulin are found to be largely unresponsive to the mutations. Three mutants show significantly perturbed dynamics of methyl-bearing side-chains. Despite the pseudo-symmetric location of Ca2+-binding loop mutations D58N and D95N, the dynamic response of CaM is asymmetric, producing long-range perturbation in D58N and almost none in D95N. The mutations located at the target domain binding site have quite different effects. For M124L, a local perturbation of the methyl dynamics is observed while the E84K mutation produces a long-range propagation of dynamic perturbations along the target domain binding site.
Allosteric behavior has been found to exist in diverse classes of proteins, such as transport proteins (1), enzymes (2), chemo-mechanical energy transducers (3), receptors (4), chaperonins (5), and signaling proteins (6). Propagation of the allosteric signal is usually associated with the protein undergoing a largely structural response to the binding of ligand to a regulatory site. Nevertheless, it has long been admitted on theoretical grounds that changes in the distribution of thermal fluctuations about the mean structure could accompany a change in functional state of a protein and thereby provide a reservoir of residual entropy that could, in principle, contribute to allosteric phenomena (7–10). Indeed, if a protein is treated as an ensemble of conformational states (11, 12), binding of the allosteric effector could not only stabilize a certain conformation with high affinity for the active site ligand, but could also change the “shape” of the conformational distribution. The latter would be a purely entropic effect that, if significant, would contribute to the free energy of the bound state and manifest itself in a change of the dynamic behavior of the protein. However, although the possibility of allosteric regulation through entropic (dynamic) mechanisms exists, a definitive example of such an allosteric mechanism remains to be fully illuminated (13). The relatively recent experimental demonstration using NMR relaxation methods of the large and heterogeneously distributed residual entropy in proteins (14–16) raises once again the possibility that dynamic effects have been adopted by proteins to carry out allosteric phenomena (13). Indeed, it has been shown in several instances that significant changes in residual protein entropy (dynamics) can result from a change in protein functional state (17, 18).
Central to the concept of allostery has been a discussion of pathways of energetic coupling, perhaps most exemplified by the analysis of allosteric regulation in hemoglobin where a highly mechanical model remains a dominant theme (19). The participation of residual protein entropy in allosteric regulation raises the issue of whether pathways of dynamic disorder exist in proteins and whether they have been used to provide free energy transduction. This concept also raises the question of whether dynamically coupled sites need be structurally contiguous in the native structure in order to provide long-range energetic coupling or whether the effects can be generally manifested in the ensemble of states of the protein (12).
The basic parameters of coupled dynamics in proteins need to be exposed in order to begin to distinguish these two views of effective long-range energetic coupling. We have initiated such a study with the protein calmodulin. Here we use site-specific mutations as a means for perturbing the conformational ensemble of an allosteric protein and observed the dynamic consequences of these perturbations using solution NMR relaxation techniques. A complex between chicken calmodulin (CaM) and a 21-residue peptide based on the calmodulin-binding domain of the smooth muscle myosin light chain kinase (smMLCKp) was chosen as a model system. CaM is a small acidic protein of 148 amino acids, which binds four Ca2+ ions in a highly cooperative manner ensuring the “all-or-nothing” response to changes in the intracellular calcium levels (20). A unique feature of CaM is that, while being a monomeric protein, it shows two different types of allosteric behavior: (i) cooperativity between calcium binding sites and (ii) cooperativity between its target- and calcium-binding sites. In the absence of calcium ions, smMLCKp binding to CaM is negligible, while in the presence of calcium it forms a very tight complex having a dissociation constant of 1 nM (21). The allosteric coupling between calcium and peptide binding sites is reciprocal, with the Ca2+ binding affinity of CaM increasing 30–100-fold in the presence of smMLCKp (22). Here we examine the extent of variation of the fast dynamics of calmodulin in complex with the smMLCKp domain in response to point mutations that influence calcium- and target domain binding affinity.
Materials and Methods
Sample preparation
Mutants of the wild-type chicken CaM gene were constructed using a Stratagene QuickChange™ site-directed mutagenesis kit and suitable PCR primers. Purified expression plasmids were transformed into BL21(DE3) E.Coli cells. Mutant proteins were over-expressed and purified following the protocol for the wild-type CaM (23). Uniform 13C and 15N labeling of CaM was achieved by growing E. Coli cells on minimal media supplemented with 2 g/L of [13C-6]-D-glucose and 1 g/L of 15NH4Cl (Cambridge Isotopes). For side chain relaxation experiments, fractionally deuterated protein samples were produced using minimal media containing 60% D2O, 2 g/L of [13C-6]-D-glucose and 1 g/L of 15NH4Cl.
The smMLCKp peptide was over-expressed in BL21(DE3) E.Coli cells as a fusion protein with thioredoxin and purified as described previously (24). The only modification made to the published procedure was the removal of thrombin on a p-aminobenzamidine column (Sigma) instead of a Q-Sepharose column prior to the HPLC purification step. The purity of the peptide was assessed by electrospray mass-spectrometry and was typically >95 %.
Complexes between CaM mutants and smMLCKp were formed under dilute conditions by titrating smMLCKp into a 0.2 mM protein solution (25). The complex was lyophilized and resuspended in 92% H2O, 8% D2O to obtain the following final NMR buffer conditions: 100 mM KCl, 6 mM CaCl2, 10 mM imidazole-d4 (pH 6.5), and 0.02 % NaN3. The final excess of peptide was 10–15%, and the concentration of the complex ranged from 1.1 to 1.3 mM. The complex of E84K with smMLCKp was stable only for ~3–4 weeks, after which partial dissociation of the peptide was observed. Since free CaM and its complex with smMLCKp are in slow exchange and have distinct chemical shifts, dissociation of the complex can be monitored by direct inspection of the 15N and/or 13C HSQC spectra. All NMR relaxation experiments were carried out on the E84K-smMLCKp samples that were not older than 4 days, and no free E84K was detected upon the completion of the experiments.
NMR spectroscopy
All NMR experiments were carried at 35 °C on Varian Inova spectrometers operating at 1H Larmor frequencies of 750, 600, and 500 MHz. Site-specific assignment of backbone and side chain methyl resonances in the mutant CaM-smMLCKp complexes was accomplished using three-dimensional NMR experiments. Sequential assignments of the backbone 1H, 13Cα, 13Cβ, and 15N were obtained from gradient-enhanced CBCA(CO)NH and HNCACB spectra (26) with chemical shifts of wild-type CaM-smMLCKp used as guidelines. 13C and 1H resonances of the side chain methyl groups were assigned using C(CO)NH (27) and 3D-HCCH3-TOCSY (28) experiments. Methionine methyl resonances were assigned using a two-dimensional HMBC experiment (29). NMR data were processed with nmrPipe (30) and assigned with Sparky (31).
15N longitudinal (T1) and transverse (T2) relaxation time constants and the {1H}-15N Nuclear Overhauser Enhancement (NOE) were measured using pulse sequences employing two-dimensional HSQC experiments for spectral resolution (32). Twelve time points ranging from 0.021 to 1.2 s (T1) and 7.8 to 147 ms (T2) were collected, three of which were duplicate. Cross-peak intensities were used to quantify relaxation, and the uncertainties of these intensities were estimated either from duplicate measurements or the root-mean-square noise level of the spectrum base level. The relaxation parameters were measured at two field strengths, 500 and 600 MHz, for E84K and D95N complexes, and one field strength, 500 MHz and 600 MHz, for D58N and M124L complexes, respectively.
The dynamics of the side chain methyl groups in protein complexes was obtained by measuring longitudinal (IzCzDz) and transverse (IzCzDy) relaxation rates of the 2H nucleus in 13CH2D isotopomers as described by Kay and coworkers (33). Contributions from relaxation mechanisms other than quadrupolar interactions were eliminated by correcting these rates for the decay of the IzCz coherence. A total of twelve time points (three of which were duplicate), ranging from 3.7 to 100 ms (IzCzDz), 0.9 to 25 ms (IzCzDy), and 1 to 90 ms (IzCz) were collected. Each time point represented a two-dimensional 13C-1H chemical shift correlation experiment with 88 complex points in the indirect dimension. 2H relaxation experiments were carried out either at one (600 MHz, M124L and D58N) or two (500 and 600 MHz, E84K and D95N) magnetic field strengths.
Relaxation data analysis
Analysis of relaxation data was performed assuming an explicit analytical form of the spectral density function in the “model-free” analysis (34, 35). This treatment produced (i) correlation time for the overall rotational motion, τm, (ii) internal effective correlation times for the local motions, τe, and (iii) generalized order parameters, O2, related to the amplitudes of local motions. For methyl groups, order parameter O2 can be approximated as a product of two order parameters: , corresponding to the rotation of the methyl group around its symmetry axis, and , corresponding to the motion of the symmetry axis itself. can be calculated as O2 /0.111, assuming perfect tetrahedral geometry of the methyl carbon (35).
Two-parameter Lipari-Szabo fits were carried out using in-house. A spherically symmetric diffusion tensor was used in the calculations as described previously for the wild-type CaM-smMLCKp complex (18). A global fit of the backbone relaxation data produced the following values for rotational correlation times τm: 7.9 ns (D58N), 8.2 ns (D95N), 8.1ns (M124L), and 8.2 ns (E84K). For the calculation of side chain order parameters, we chose to use τm of 8.26 ns, the same value that was obtained for the wild-type CaM-smMLCKp. Using τm of 8.26 ns for the interpretation of the backbone relaxation data produced the same order parameters within the experimental error for all four mutants. A quadrupolar coupling constant of 167 kHz was used in the calculations (36). The uncertainties of fitted parameters were estimated using Monte-Carlo methods.
Results
A central goal is to establish how the dynamic properties of calmodulin change in response to mutations introduced at functionally important sites and whether these changes are correlated with changes in the allosteric behavior of the protein. The selection of mutants that can provide an insight into the mechanism of allosteric coupling between the calcium and target-binding sites was greatly facilitated by prior investigations of a variety of aspects of CaM function. The Ca2+-binding loops (37–43) and the target-binding site (22, 44–47) have been extensively examined using site-directed mutagenesis. Four mutants with well-characterized calcium- or target-binding properties were selected: D58N, D95N, E84K, and M124L. D58N and D95N belong to Ca2+-binding loops II and III of the N- and C-terminal domains, respectively. M124L and E84K are located in the peptide binding site. All four mutants were studied in complex with Ca2+ and a 21-residue peptide based on the calmodulin-binding domain of the smooth muscle light chain kinase (smMLCKp) (48, 49). The sub-nanosecond dynamics of the backbone and side chains of the mutant complexes were measured using 15N and 2H relaxation techniques. The obtained order parameters and internal effective correlation times were compared with the wild-type data, reported previously by this laboratory (18). For convenience, hereafter the wild-type protein will be referred to as CaM, while the calmodulin mutants will be designated by their one-letter mutation codes.
Identification of significant structural & dynamic perturbations: least median squares analysis
Detection of significant changes in NMR parameters is often not a straightforward exercise, especially for those parameters such as the chemical shift that are exquisitely sensitive to small structural and dynamic variations such that a rather noisy baseline response is present. Here we seek to identify the residues with perturbed structural (largely via the chemical shift) and/or dynamic (largely via the generalized order parameter) properties using the parameters of the wild-type complex as a reference. Such perturbed residues are referred to here as outliers.
The most commonly employed method for detection of perturbed residues using NMR-derived parameters is to undertake a linear regression analysis. A general problem with the conventional linear regression (LS) method, which is based on the minimization of the sum of the squared residuals, is its intolerance to outliers in describing the underlying distribution of error. To overcome this problem, the least median squares (LMS) method recently introduced by Rousseeuw (50) has been employed. Since the LMS method has not been previously used in this context, we will describe its basis and application in some detail here.
The LMS analysis belongs to the so-called robust regression methods, which allow one to eliminate the influence of outliers on the final values of regression coefficients and obtain a reliable error estimate. LMS works by numerically minimizing the median of the squared residuals, instead of the sum. We used an LMS algorithm implemented in the SYSTAT software package (Systat Software Inc.) and obtained regression coefficients and scale estimate σ, which is analogous to the standard deviation in the conventional linear regression. Defining a residual for a given experimental point as and the corresponding standardized residual as , the points with are identified here as outliers.
In some cases the experimental uncertainty associated with a given parameter is often heterogeneous, which makes the identification of outliers difficult. This is particularly true for the generalized order parameter. To incorporate experimental uncertainty into the outlier analysis, we multiplied the standardized residuals by the probability that :
| (1) |
Assuming that an experimental point can be represented by a Gaussian centered at , with a standard deviation equal to the experimental uncertainty σE, is calculated as the area under this Gaussian that falls to the right (left) of the value. This treatment is essentially analogous to applying a step function with the step coordinate of . This procedure filters out the borderline cases and identified true outliers in all four mutant CaM-smMLCKp complexes.
LMS was also used to identify chemical shift outliers and was based on the chemical shift displacement, calculated as , where γH(N) is the gyromagnetic ratio of the 1H (15N) nucleus, and ΔH(N) is the 1H (15N) chemical shift difference between the mutant and wild-type complexes in ppm. For a set of chemical shift displacements, the one-dimensional LMS analysis yields the following equation for the standardized residuals (50):
| (2) |
The coefficient 1.4826 in the denominator takes into account the relationship between the median and the standard deviation under the assumption that the data points are normally distributed. As before, the data points with are identified as outliers.
Chemical shift perturbation caused by mutations
Though the chemical shift is a composite parameter that can potentially reflect both the structural (static) and dynamic character of the protein, in stable complexes such as those studied here, the former contribution is generally dominant. In contrast, the generalized order parameter is formally a measure of motion on a very fast time scale. The chemical shift displacements Δ for different mutant CaM-smMLCKp complexes were analyzed to assess structural perturbations caused by the mutations. A common theme that emerges from this analysis is that the largest amide chemical shift perturbations occur in the vicinity of the mutation, and they are mostly confined to the domain (N- or C-terminal) where the mutation occurs. This is illustrated in Figure 1, which shows (A) standardized residuals and (B) cross-peak displacement Δ (in 1H ppm) for all assigned amide groups in the D95N-smMLCKp complex. The results of one-dimensional LS and LMS analyses, shown in yellow and red, respectively, are contrasted in Figure 1A. Since the N-terminal domain of the D95N-smMLCKp complex experiences little chemical shift perturbations, this creates a situation close to “exact-fit”, where at least half of the data points satisfy the exact equation used for the fit. As a result, the LMS scale estimator given by the denominator of Eq. 2 becomes very small giving rise to large values of the standardized residuals. Comparing the LS and LMS methods, one concludes that LMS emphasizes the outliers, whereas LS analysis masks them by incorporating all data points (including the outliers) into the calculation of the standard deviation. As a result, 15 outliers are identified by LMS, compared to only 4 identified by LS analysis. The amide groups identified as outliers in the LMS analysis are colored blue in Figure 1B. The largest changes in the chemical shifts are observed for loop III, especially for the amino acids that participate in Ca2+ coordination (N97, Y99, and E104), and helix F.
Figure 1.
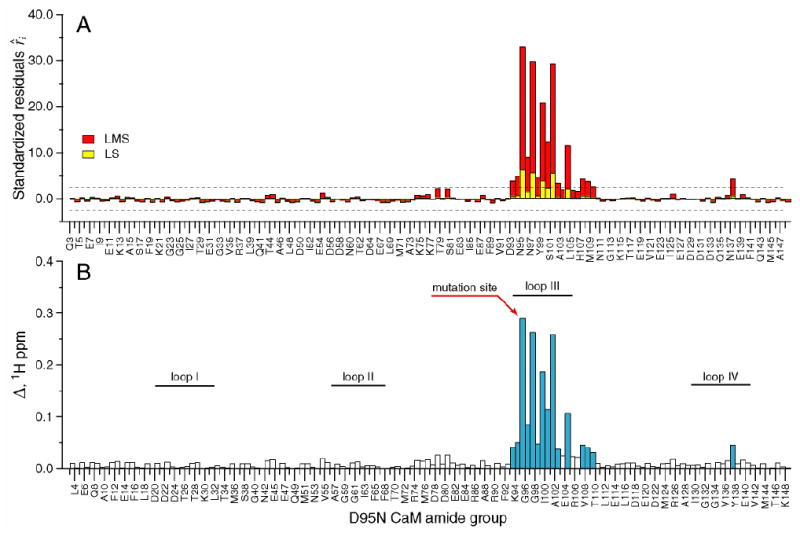
Chemical shift-based identification of structural perturbations in the CaM-smMLCKp complex introduced by the D95N mutation in calmodulin. (A) Standardized residuals calculated using one-dimensional LMS (red) and LS (yellow) analyses of 15N-1H cross-peak displacements Δ in the D95N-smMLCKp complex. Dotted lines represent the ± 2.5 interval of the standardized residuals. The amide groups that have absolute values of the residuals greater than 2.5 are considered to be chemical shift outliers. (B) 15N-1H cross-peak displacement Δ in the D95N-smMLCKp complex. The amide groups that are identified as outliers by the LMS analysis are colored blue. Positions of the calcium-binding loops are indicated by the solid bars. 15 and 4 outliers were identified by LMS and conventional LS analyses, respectively.
Similarly, in D58N-smMLCKp, the most perturbed regions are Ca-binding loop II and helix D. In addition, three residues of loop I, T26, I27, and T28, experience large changes in amide chemical shifts. These amino acids are spatially close to the mutation site, while being far from it in the primary sequence. In M124L-smMLCKp, the chemical shift differences are the largest in helices F and G, and residues D80 and D133.
E84K-smMLCKp is different from the other three mutants in that the changes in chemical shifts brought about by the mutation are not localized to a particular region in the C-terminal domain, but are distributed throughout the protein. Figure 2 shows a plot of (A) standardized residuals and (B) cross-peak displacement Δ (in 1H ppm) for all assigned amide groups in the E84K-smMLCKp complex. Large changes up to 0.8 1H ppm are observed for helices D and E and the loop region between them, while the rest of the residues are moderately but still appreciably perturbed. LMS identifies 22 outliers, including 6 long-range ones, while LS identifies only 7 local perturbations.
Figure 2.
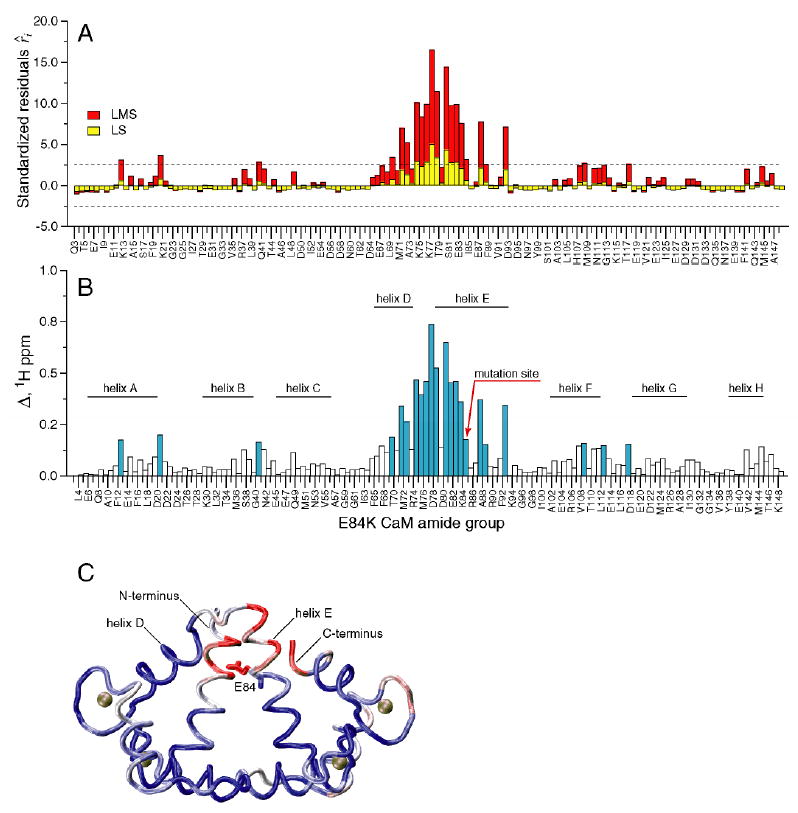
Chemical shift-based identification of structural perturbations in the CaM-smMLCKp complex introduced by the E84K mutation in calmodulin. (A) Standardized residuals calculated using one-dimensional LMS (red) and LS (yellow) analyses of 15N-1H cross-peak displacements Δ in the E84K-smMLCKp complex. Dotted lines represent the ± 2.5 interval of the standardized residuals. The amide groups that have absolute values of the residuals greater than 2.5 are considered to be chemical shift outliers. (B) 15N-1H cross-peak displacement Δ in the E84K-smMLCKp complex. The amide groups that are identified as outliers by the LMS analysis are colored blue. Positions of the CaM helices are indicated by the solid bars. 22 outliers are identified by LMS, compared to only 7 outliers identified by conventional LS. (C) Squared displacement of backbone atoms between the wild-type CaM-smMLCKp (PDB code 1cdl) and E84K-RS20 (PDB code 1vrk) structures mapped onto the structure of CaM-smMLCKp. The structure of the peptide is not shown. A blue-white-red color gradient is used to represent the range of squared atom displacements from 0 to 3 Å2. The average R.M.S.D. for backbone atoms of residues 5-146 of calmodulin is 0.94 Å. The results of superposition of the CaM-smMLCKp and E84K-RS20 structures are in general consistent with amide chemical shift data, where helix E and the loop between helices E and D can be identified as the most perturbed protein regions.
The crystal structure of the VU-1 E84K mutant of calmodulin in complex with an RS20 peptide has been determined (22). VU-1 CaM differs from chicken CaM in ten amino acid residues (51), and the RS20 peptide has an identical sequence to smMLCKp with only minor differences at the C and N-termini. Superposition of the E84K-RS20 crystal structure (PDB code 1vrk) onto the structure of chicken calmodulin in complex with smMLCKp (PDB code 1cdl (21)) using main-chain atoms of residues 5-146 of calmodulin gave a root-mean-square deviation (r.m.s.d.) of 0.94 Å. The three-dimensional structure of CaM-smMLCKp, color-coded according to the squared displacement of backbone atoms between CaM-smMLCKp and E84K-RS20 complexes, is shown in Figure 2C. The major deviations from the wild-type structure occur in helix E, the loop between helices E and D, and the N- and C-termini. Overall, this is consistent with the backbone chemical shift data, where the end of helix E and the E-D loop are the most perturbed regions in the protein.
Methyl groups of the calmodulin side chains responded to the mutations as well. Regions of 13C HSQC spectra correlating 13C and 1H chemical shifts of methyl groups are shown in Figure 3 for two mutant complexes, E84K and D58N. For comparison, CaM-smMLCKp spectrum is shown in black color in the same figure. The changes in the methyl group chemical shifts are quite significant for the E84K complex, especially for those methionine residues that line the peptide binding site and are known to make extensive contacts with the hydrophobic residues of smMLCKp (52). The D58N-smMLCKp complex represents an intermediate case, where the chemical shift perturbations are localized to Ca2+-binding loop I (T26γ, I27γ), loop II (I63γ), and helix C (I52γ, I52δ, V55γR, and V55γS). The D95N-smMLCKp methyl region was essentially indistinguishable from that of the wild-type complex. In M124L-smMLCKp, in addition to the mutated site, three methyl groups had significantly perturbed chemical shifts: L105δR, M109ɛ, and M144ɛ.
Figure 3.
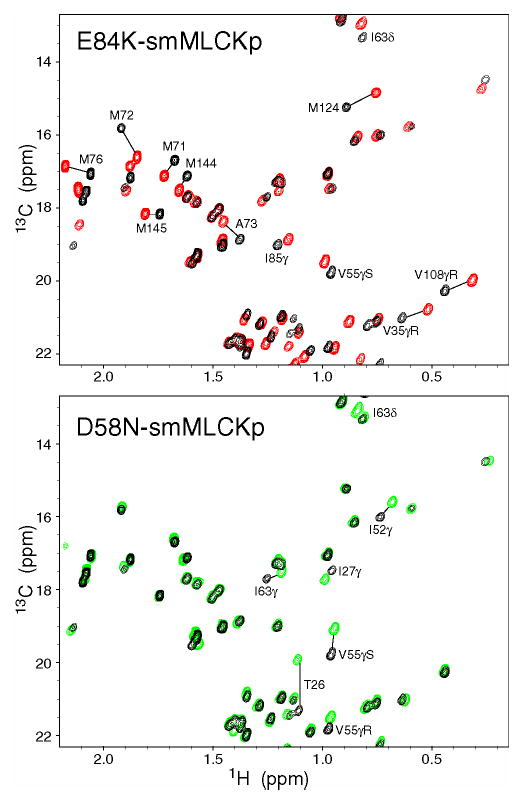
Chemical shift-based identification of structural perturbations in the CaM-smMLCKp complex introduced by various mutations in calmodulin. Shown are superpositions of the 13C-1H chemical shift correlation maps for the wild-type CaM-smMLCKp (black) and E84K-smMLCKp (red); wild-type CaM-smMLCKp (black) and D58N-smMLCKp (green). Many methyl groups throughout the E84K-smMLCKp complex, including all methionines, experience large chemical shift changes as a result of the mutation. D58N-smMLCKp is a more moderate case, where chemical shift perturbations are localized to Ca2+-binding loops I and II and helix C.
Backbone dynamics of mutant complexes
The dynamics of main chain N-H bond vectors of calmodulin in the wild-type and mutant CaM complexes were measured using three 15N-relaxation parameters, T1, T2, and NOE. Using the two-parameter Lipari-Szabo formalism and an isotropic diffusion tensor, we obtained order parameters and effective internal correlation times (τe) for all spectrally resolved protein sites. We then compared these values with the wild-type data reported previously (18).
In all four mutant complexes, the majority of amide groups do not experience significant changes in their dynamic properties compared to those of the wild-type complex. The average value of the order parameter differences between the wild-type and mutant complexes, , is zero, within the experimental error. Within a given pair of order parameter sets corresponding to the wild-type and mutant complexes, the standard deviation calculated using 4–5% truncated data sets is either comparable to or smaller than the error in . A 2D LMS analysis applied to 15N order parameters produced the following set of outliers: F68 in D95N; F65 in D58N; F92 and R74 in E84K-smMLCKp; and no outliers in M124L. Since the order parameters of wild-type and mutant complexes are very close, the scale estimator σ is rather small. As a result, the absolute differences associated with the outliers are minor and do not exceed 0.07 in absolute values.
The only exception is the amide group of R74 in the E84K-smMLCKp complex, for which the difference between the mutant and wild-type order parameters is 0.093. Inspection of the E84K-RS20 structure (PDB code 1vrk) revealed that, compared to the wild-type CaM-smMLCKp complex, the side chain of R74 is rotated towards the protein and its Nɛ-Hɛ group forms a hydrogen bond to the carbonyl of residue 70. Although the backbone hydrogen-bonding pattern is similar in both complexes, the presence of an extra hydrogen bond could in principle restrict the mobility of the R74 amide group in the mutant complex. The fact that we do not find any large perturbations of backbone dynamics in mutant complexes is not surprising, considering that very little differences were observed in the backbone dynamics of Ca2+-saturated and smMLCKp-bound calmodulin (18).
Side chain dynamics of mutant complexes
2H relaxation methods were used to study the dynamics of methyl-bearing side chains in the mutant calmodulin complexes. Generalized order parameters of the methyl group axis and internal effective correlation times for all spectrally resolved methyl sites were obtained. The differences between the mutant and wild-type order parameters are plotted against calmodulin methyl group in Figure 4.
Figure 4.
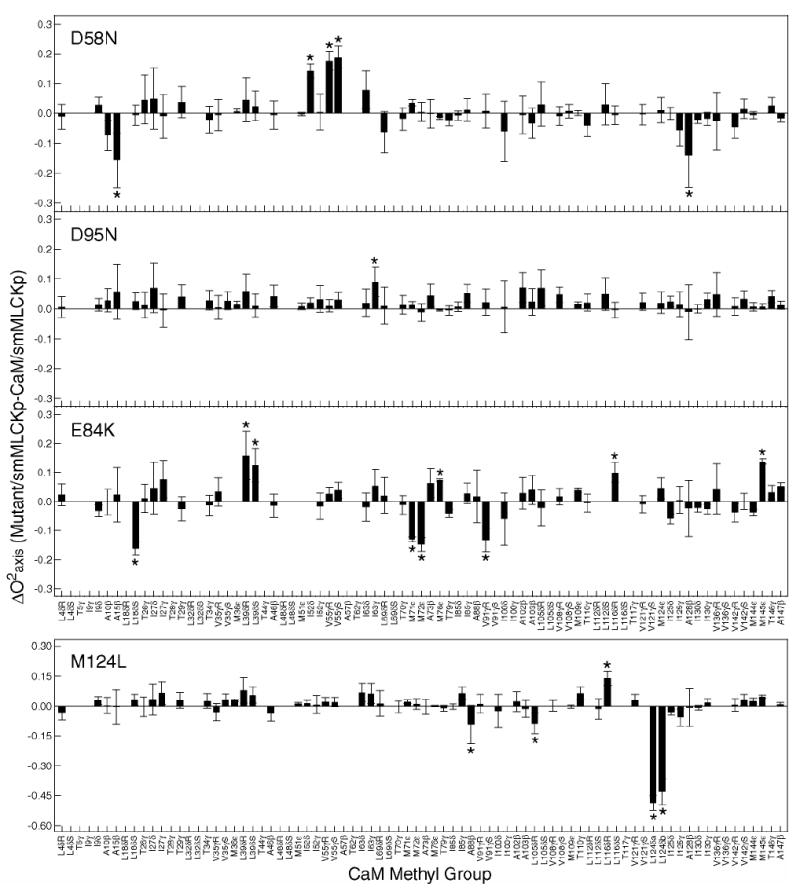
Identification of dynamical perturbations in the CaM-smMLCKp complex introduced by various mutations in calmodulin. Difference between methyl group symmetry axis order parameters of the mutant and wild-type smMLCKp complexes. The errors bars are calculated as a sum of individual absolute errors of the corresponding mutant and wild-type order parameters. Outliers identified by LMS analysis are labeled with asterisks. Three patterns of perturbation in the side chain methyl dynamics are observed: almost no perturbation in D95N-, mostly local in M124L-, and long-range in D58N- and E84K-smMLCKp complexes. Note that the vertical and horizontal scales in the M124L graph are different from those in the other three graphs.
Ca2+-binding loop mutants, D58N and D95N, despite being symmetric in the position of the mutation, show a completely different dynamic response. Within experimental error, the D95N mutation produces hardly any disturbance in the dynamics of the CaM methyl groups. In contrast, the D58N mutation induced significant changes in the dynamics of methyl-bearing side chains both in the vicinity of the mutation and in regions distant from the mutation site. In the target-binding site mutants, the M124L mutation induced a large increase in CaM side chain motion, which was mainly confined to the region of mutation. The E84K mutation resulted in large changes in the methyl group dynamics throughout the entire protein sequence.
The least median squares (LMS) analysis described in detail above was used toidentify methyl groups whose dynamics are significantly perturbed relative to that in the wild-type complex. Results of the LMS fit are shown in Figure 5 for the E84K-smMLCKp (A) and D95N-smMLCKp (B) complexes, giving examples of the most and least dynamically perturbed complexes. The generalized order parameters of the mutant complexes are treated as dependent variables, and the difference between the fit and the experimental value is termed a residual ri. The residuals are standardized by dividing them by the scale estimate σ and then multiplying by the probability for the absolute value to exceed 2.5σ. The standardized residuals are mapped onto the crystal structure of the CaM-smMLCKp complex in Figure 6. The scale estimate σ, which reflects variability within a set of residuals, is given for each mutant complex in the corresponding panel of the figure. It is interesting to note that the σ values vary among the mutant complexes, the extremes being E84K-smMLCKp with σ =0.039 and D95N-smMLCKp with σ =0.016. Since identification of outliers involves the standardization procedure, the same value of corresponds to different absolute values of the order parameter changes in different mutants. Hence to be qualified as an outlier in the E84K-smMLCKp complex, a methyl group has to experience a larger absolute change in its order parameter than in the D95N-smMLCKp complex.
Figure 5.
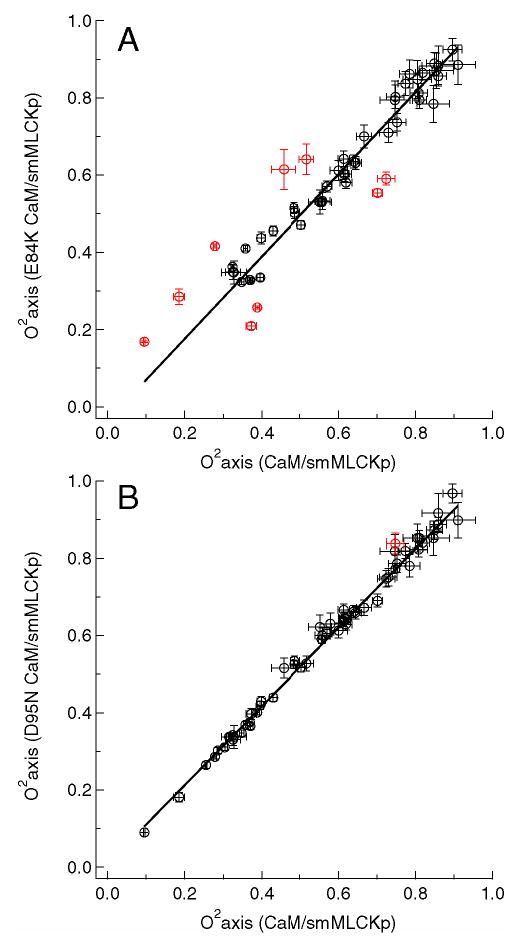
Methyl axis order parameters, , of the E84K-smMLCKp (A) and D95N-smMLCKp (B) complexes versus those of the wild-type CaM-smMLCKp complex. The least median squares (LMS) fit is shown with a solid line. Outliers identified by the LMS analysis are colored red. The value of the intercept was not forced to zero in the LMS analysis to account for possible systematic differences caused by the uncertainties in global correlation time. Since the average value of the is the same for all mutant and wild-type complexes within the experimental error, forcing the constant to zero produced an essentially identical set of outliers.
Figure 6.
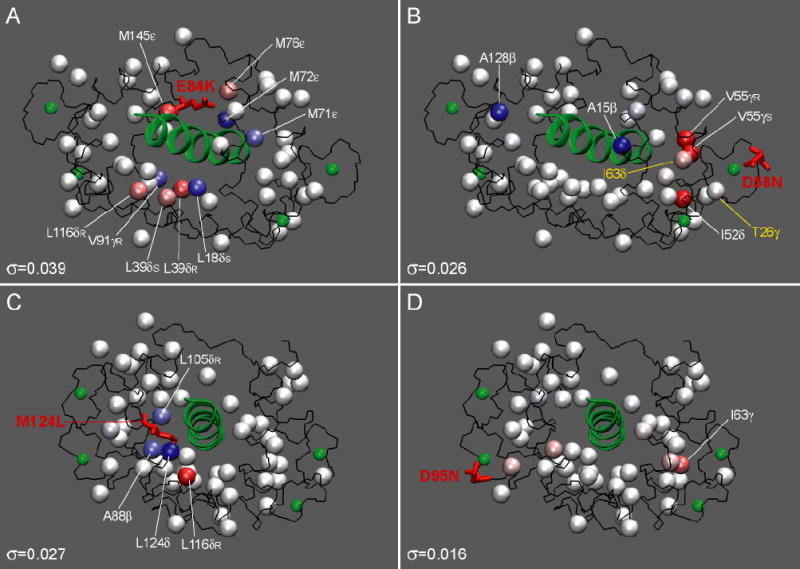
Standardized residuals mapped onto the three-dimensional structure of CaM-smMLCKp (PDB code 1cdl) using a blue-white-red color gradient to represent the range of from −5.0σ to +5.0σ. The values of scale estimate σ are given at the bottom of each panel. Mutated residues are shown in stick representation and are labeled. The peptide structure and calcium atoms are displayed in green. In C, the value of L124δ is mapped onto the Cɛ carbon of M124 using an average for the two methyl groups of L124. The individual values for the two L124 methyl groups are given in Table 1. In D58N-smMLCKp, two methyl groups with perturbed τe are shown in yellow.
The dynamically perturbed methyl groups have a value of and are labeled with asterisks in Figure 4. Table 1 lists the outliers, their values, and the distances to the mutation sites for each CaM mutant. From the data of Table 1, we conclude that there is (i) hardly anycorrelation between the extent of methyl dynamics perturbation, reflected in the values of , and the distance from the perturbed methyl group to the mutation site, and (ii) no specific direction, in which the order parameters change, i.e. both positive and negative values of and are observed.
Table 1.
Methyl-bearing amino acid residues of mutant calmodulin with perturbed amplitudes of fast motion
| E84K
|
D58N
|
M124L
|
D95N
|
||||||||
|---|---|---|---|---|---|---|---|---|---|---|---|
| CaM methyl | a | Db, Å | CaM methyl | D, Å | CaM methyl | D, Å | CaM methyl | D, Å | |||
| L18δS | −3.90 | 21.0c | A15β | −5.56 | 19.3d | A88β | −2.96 | 16.8d | I63γ | 3.58 | 31.1d |
| L39δR | 3.89 | 13.6 | I52δ | 5.67 | 11.9 | L105δR | −3.50 | 4.3 | |||
| L39δS | 2.60 | 15.5 | V55γR | 6.93 | 11.4 | L116δR | 4.66 | 4.2 | |||
| M71ɛ | −3.10 | 9.7 | V55γS | 7.36 | 9.9 | L124ae | −18.4 | N/A | |||
| M72ɛ | −4.05 | 11.5 | A128β | −4.57 | 36.9 | L124b | −16.3 | N/A | |||
| M76ɛ | 2.70 | 6.2 | Δ τe, ps | ||||||||
| V91γR | −3.69 | 13.2 | T26γ | 26.3 | 8.2 | ||||||
| L116δR | 2.96 | 26.3 | I63δ | −11.2 | 9.9 | ||||||
| M145ɛ | 4.06 | 12.2 | |||||||||
Standardized residuals calculated according to Eq. 1.
Distances from the methyl carbon of the perturbed residue and Cɛ of K84 in E84K, Cγ of D58 in D58N, Cɛ of M124 in M124L, and Cγ of D95N.
Distances measured in the E84K-RS20 crystal structure (PDB code 1vrk).
Distances measured in the CaM-smMLCKp crystal structure (PDB code 1cdl).
Methyl groups of L124 were not stereospecifically assigned in the mutant complex.
Comparison of the internal effective correlation times of mutant and wild-type smMLCKp showed that differences larger than 10 picoseconds (ps) are scarce and did not reveal any additional outliers, with one exception. In the D58N-smMLCKp complex, two methyl groups, T26γ and I63δ, show fairly large changes in their τe values, 26.3 and -11.2 ps. These groups are located in the vicinity of the mutation site and are labeled in yellow in Figure 6B. Predictably, in the M124L-smMLCKp complex, two δ methyl groups of L124, when compared to M124ɛ group, experience large τe changes of 34.6 and 39.1 ps.
Discussion
Changes in protein dynamics in response to covalent modification, mutation, or ligand binding can be monitored using measurements of the NMR relaxation parameters of the protein backbone and side chains (13, 53). The dynamic response of the protein backbone to ligand binding is nicely illustrated by the 15N relaxation studies of calbindin (54) and cytidylyl-transferase (55). The observed range of order parameters and hence motional amplitudes is usually much larger for protein side chains (13). Partial deuteration (33) and/or various 13C-labeling approaches (56–58) are normally employed to select a single relaxation pathway in methyl or methylene groups. Methyl relaxation studies have been employed to examine the dynamical consequences of the binding of peptide ligand by the SH2 domain of phospholipase C (59), calmodulin (18), Cdc42H signal transduction protein (17), and PDZ domain (60). In all cases, the dynamics of the side chains were perturbed by ligand binding and, in the case of the PDZ domain, a qualitative correlation between altered dynamics (60) and statistically coupled residues (61) was observed. Long-range perturbation of the side chain methyl dynamics by mutations was demonstrated recently for protein L (62) and eglin C (63). In eglin C, the perturbation pattern was interpreted as forming contiguous surfaces within the protein.
In this work, we constructed four diagnostic mutants of chicken CaM. Two of the mutations, D95N and D58N, were located in the Ca2+-binding loops of CaM, while the other two, E84K and M124L, belonged to the peptide-binding site. The backbone dynamics of these mutants in complexes with Ca2+ and smMLCKp was found to be virtually indistinguishable from that of the wild-type complex. In contrast, for three of these mutants the dynamic properties of methyl-bearing side chains were found to be very different compared to those of the wild-type complex. Both local and long-range perturbation of the methyl dynamics exists. This behavior does not correlate with chemical shift perturbations imposed by the mutations.
Three of the calmodulin mutants selected for this study, D58N, D95N, and E84K, have an altered allosteric behavior comparable to that of the wild-type protein. The Ca2+-binding and MLCK activation properties of the mutants are summarized in Table 2. We seek to understand whether or not side chain dynamics plays a role in the mechanism of propagation of the allosteric signal. In this section, the spatial pattern formed by the dynamically perturbed methyl groups compared with the biochemical information available for the calmodulin mutants.
Table 2.
Binding and activation properties of CaM mutants.
| I. Ca2+ binding properties of D58N and D95N CaM mutants | |||||
|---|---|---|---|---|---|
| Mutant | K1 × 106 (M−1)a | K2 × 106 (M−1)a | Ref. | ||
| D58N, N-terminal domainb | 1.55 ± 0.08 (3.16 ± 0.13)c | 11.5 ± 0.3 (3.98 ± 0.16) | (37) | ||
| D95N, C-terminal domainb | 1.41 ± 0.03 (2.82 ± 0.14) | 3.63 ± 0.11 (28.2 ± 1.4) | |||
| II. smMLCK activation and smMLCKp binding properties of M124L and E84K CaM mutants | |||||
| Mutant | Kact (nM)d | % maximum smMLCK activation | K′Ca2+ (μM)e | KD (nM)f | Ref. |
| 1.9 (0.8) | 81 ± 2 (100 ± 4) | (47) | |||
| M124Lg | – | – | |||
| 42.7 ± 16.3 (40.4 ± 13.7) | 67.5 ± 8.5 (100.0 ± 5.6) | (44) | |||
| E84K | 5.0 ± 0.4 (1.4 ± 0.7) | ~10 (100) | 0.69 ± 0.02 (0.17 ± 0.02) | 6.8 ± 5.2 (3.5 ± 1.9) | (22) |
| III. Ca2+ binding properties of E84K CaM mutant | |||||
| Mutant | K1′ (μM)h | K2′ (μM)h | K3′ (μM)h | K4′ (μM)h | Ref. |
| E84K | 16.6 ± 4.0 (15.0 ± 2.0) | 23.4 ± 4.3 (13.0 ± 0.9) | 111.3 ± 4.1 (82.4 ± 8.4) | 45.4 ± 4.5 (102.0 ± 9.2) | (22) |
| E84K + RS20 | 5.1 ± 1.9 (0.4 ± 0.1) | 3.2 ± 1.0 (2.5 ± 0.2) | 4.6 ± 1.3 (0.8 ± 0.02) | 5.8 ± 0.6 (1.1 ± 0.1) | |
K1 and K2 are the macroscopic binding constants for the first and second binding events in either N- or C-terminal domain of CaM;
N- and C-terminal domains were obtained using proteolytic fragmentation of CaM with trypsin;
wild-type CaM data are italicized and given in parenthesis;
Kact is the apparent CaM activation constant defined as the concentration of CaM required to achieve half-maximum activity of smMLCK;
K′Ca2+ is the apparent Ca2+-binding constant for the interaction of Ca2+ with CaM-smMLCK complex;
KD is the dissociation constant for the E84K-RS20 complex, where RS20 is a peptide virtually identical to smMLCKp;
Differences between the two sets of data reported for M124L are due to different assay conditions and smMLCK substrates;
K′n are macroscopic Ca2+ dissociation constants in the absence and presence of RS20 peptide.
Ca2+-binding site mutants: D58N and D95N
The Ca2+-binding mutants were chosen based on the work of Waltersson et al (37), who characterized calcium binding properties of intact mutant proteins and their N- and C-terminal domains. D58 and D95 are located in loops II and III of CaM and participate in Ca2+ coordination by donating one carboxylate oxygen. It was found that pseudo-symmetric mutations produced quite different responses. The D58N mutation increased both, the overall affinity of Ca2+ binding and the cooperativity between the Ca2+ binding sites of the N-terminal domain. The D95N mutant had an opposite effect on the calcium binding properties and the cooperativity of the Ca2+ binding sites of the C-terminal domain.
The analysis of chemical shift and relaxation data for the D58N- and D95N-smMLCKp complexes leads to the conclusion that there is not a symmetric structural or dynamic response to these mutations. The perturbation of the amide chemical shifts was more pronounced for the D58N-smMLCKp complex, and included residues of loops I and II, hinting that minor structural adjustments of the N-terminal Ca2+-binding loops could play a role in the observed changes in the intra-domain allosteric response. The same holds for the carbon and proton chemical shifts of methyl groups. While methyl chemical shifts of the D95N-smMLCKp complex were virtually indistinguishable from those of the wild-type complex, in D58N-smMLCKp, both methyl groups of V55 and I52 as well as T26γ, I63γ, and I27γ experienced appreciable chemical shift changes (see Figure 3B).
The outlier analysis of the D95N-smMLCKp side chain dynamics produced only one perturbed methyl group, I63γ, located 31 Å away from the mutation site in Ca2+-binding loop II. The value is only 0.09 for this methyl group (see Figure 4B); nevertheless, it is identified as an outlier due to the small value of scale estimate σ. D58N-smMLCKp showed both local and long-range perturbation of the methyl group dynamics. The following observations can be made about the perturbed methyl groups from Figure 6 and Table 1:
The perturbed methyl groups, with the exception of A15β and A128β, are located within 12 Å of the mutation site;
Four of the perturbed methyl groups are located within 5 Å of the target peptide side chain atoms: A15β, V55γR, V55γS, and A128β;
Five of the perturbed methyl groups either immediately precede or belong to the Ca2+-binding loops: T26γ (loop I), I63δ (loop II), V55γR, V55γS (loop III), and A128β (loop IV);
In general, the perturbed methyl groups are located in different structural elements of D58N-smMLCKp complex and do not appear to form any specific pattern.
Based on these data, we conclude that a Ca2+-binding mutant with larger structural changes brought about by the mutation (D58N) produced a more pronounced local and long-range response in its side chain dynamics. There is no clear quantitative correlation between the absolute changes in either or τe and the methyl group chemical shifts. However, all perturbed methyl groups in D58N-smMLCKp, with the exception of A15β and A128β, show appreciable peak displacements on the 13C-1H correlation map.
Target binding site mutants: M124L
The M124L mutant was chosen based on several mutagenesis studies aimed at understanding the role of nine methionine residues in target recognition and activation by calmodulin (44–47). In particular, the importance of M124 was highlighted by the study of the M124Q mutant, which was found to reduce the calmodulin activity towards three CaM-dependent kinases by 20–35% (46). In addition, its Kact values, i.e. CaM concentrations required for the half-maximum kinase activation greatly exceeded those for the wild-type CaM. Compared to M124Q, the M124L mutation represents a milder perturbation, which changes the shape and flexibility of the mutated side chain, but not so much its hydrophobicity. The activity of the M124L mutant towards intact myosin light chain kinase was found to be 68 % of the wild-type protein, while their Kact values were almost identical (44).
In our experiments, the M124L mutation produced a mostly local effect on both the structure and dynamics of the M124L-smMLCKp complex. Changes in the amide and methyl group chemical shifts were largely limited to the mutation site and helices F and G. Analysis of the M124L-smMLCKp side chain dynamics produced five outliers: two methyl groups of L124, L105δR, L116δR, and A88β (Table 1). As evident from Figure 4, the largest changes in , −0.487 and −0.431, are experienced by two methyl groups of L124. The same holds for the L124 τe values, which increased by 34.6 and 39.1 ps in the M124L-smMLCKp complex. Such large changes are not surprising as methyl dynamics parameters of two different residues types, leucine and methionine, are being compared. The three remaining perturbed methyl groups, L105δR, L116δR, and A88β, experienced much smaller changes in . A88β is located 16.8 Å away from the mutation site, whereas other methyl groups are located within 5 Å of the mutation site (Table 1). As far as contacts with the peptide are concerned, all methyl groups, except L116δR, are located within 5 Å of the smMLCKp side chains. There is no indication that the dynamics of the calcium binding sites is affected by this mutation.
The observation that, in the M124L-smMLCKp complex, the perturbation of side chain dynamics is mostly localized to the site of the mutation has led us to modify the criteria for mutant selection. We speculated that target-binding site mutants with an altered calcium activation profile of MLCK were most likely to experience long-range perturbations in the side chain dynamics of their target domain complexes.
Target binding site mutants: E84K
Biochemical characterization of allosteric behavior in the E84K mutant of VU-1 CaM in complex with RS20, a peptide derived from MLCK and virtually identical to smMLCKp, motivated us to study the dynamics of the E84K-smMLCKp complex. Since VU-1 CaM is isofunctional with vertebrate CaM (64), we believe that the findings of Mirzoeva et al (22) hold for the E84K-smMLCKp complex used in our study.
The E84K mutation considerably reduced calmodulin activity towards MLCK, increasing the Kact 3.6-fold (Table 2). Ca2+ binding studies in the presence of target peptide, RS20, produced a 4-fold increase in the apparent calcium binding constant (K′Ca2+) for the mutant protein. At the same time, in the absence of the target domain, the calcium-binding properties of E84K and wild-type CaM were indistinguishable, pointing to the fact that the change in the calcium-dependent enzyme activation was not due to the change of calcium binding activity of E84K. In the presence of saturating calcium, the peptide binding constants were the same for the mutant and wild-type protein within the experimental error. Taken together, these observations point to E84 as having a special role in the transduction of the allosteric response from the target- to calcium-binding site in complexes with the MLCK, which is consistent with the observation that the E84K mutation mostly affects the first and last calcium binding steps.
To gain an insight into the mechanism of allosteric coupling, Mirzoeva et al. (22) solved the crystal structure of the E84K-RS20 complex. As discussed in the Results section and shown in Figure 2C, the r.m.s.d. between the main chain atoms of calmodulin in mutant and wild-type complexes is rather small with the changes in structure mainly localized to helix E, and the N- and C-termini of CaM. This is consistent with the amide chemical shift data obtained here for the E84K-smMLCKp complex. In contrast, the methyl chemical shift region, part of which is shown in Figure 3, is rather uniformly perturbed throughout the CaM sequence. As pointed out by Mirzoeva et al. (22), in the wild-type CaM-smMLCKp, the side chain of E84 forms hydrogen bonds with R808 and R812 (corresponding to R12 and R16, R15 and R19 to PDB code 1vrk and our nomenclatures, respectively) of the MLCK-derived peptide. In the E84K-RS20 complex, the mutated side chain rotates away from the peptide (see Figure 7), losing its hydrogen bonds with arginines. Overall, there were no indications that the structure of calcium binding sites was affected by the E84K mutation.
Figure 7.
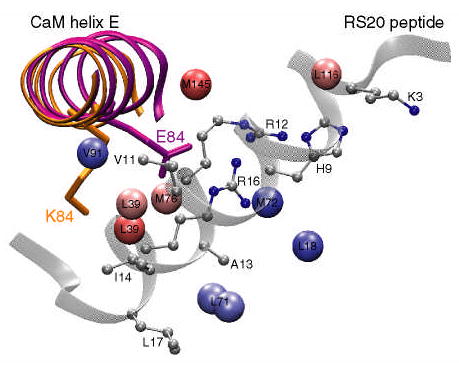
A cartoon of the E84K-RS20 structure (PDB code 1vrk) showing the relative position of calmodulin helix E and the RS20 peptide. The structures of helix E in the wild-type and E84K complexes are superimposed and shown in purple and orange, respectively. The mutated side chain is shown in stick representation and is labeled. In the E84K-RS20 complex, the side chain of K84 rotates away from the peptide. The values of standardized residuals are mapped onto methyl carbons using the same color gradient as in Figure 6. Since in VU-1 CaM position 71 is occupied by leucine, the standardized residual of M71ɛ is mapped onto the leucine δ methyl groups. The peptide side chains that are within 5 Å of the perturbed methyls are shown in ball-and-stick representation.
The outlier analysis of the dynamics revealed that among the four mutants, E84K-smMLCKp has the largest σ value and hence the largest variability in its data set. Nine methyl groups, four of which were methionine residues, M71ɛ, M72ɛ, M76ɛ, and M145ɛ, were identified as outliers (Table 1). A common theme among the perturbed methyl groups is that, with the exception of L18δS, they are in close proximity (within 5 Å) to the peptide side chains. All peptide side chains located within 5 Å of the perturbed methyl groups are shown in ball-and-stick representation in Figure 7. The largest number of methyl contacts is observed for the followingtwo peptide residues: V11, which is in close proximity to L39δR, L39δS, and V91γR; and R16, which is close proximity to M71ɛ (L71 in VU-1 CaM), M72ɛ, and M76ɛ. It is evident from Table 1, Figure 6A, and Figure 7 that perturbed methyl groups, while being essentially clustered around the peptide, are as far from the mutation site as 26 Å, making E84K the clearest case of long-range perturbation of the methyl group dynamics among the four mutants. Perhaps the only obvious connection with calcium binding is that the mutation is located in helix E, which precedes calcium binding loop III. In addition, perturbed methyl groups V91γR and L18δS immediately precede calcium-binding loops I and III.
Conclusions
From the analysis of side chain dynamics and chemical shift data, it appears that the E84K-smMLCKp and D95N-smMLCKp complexes represent two extreme cases, where fairly significant structural changes resulted in an appreciable perturbation of the side chain dynamics and vice versa. In the case of E84K-smMLCKp, structural and dynamic factors seem to work in concert to produce the observed allosteric response.
If one chooses to classify the pattern of observed side chain perturbations, there is one case, where the perturbation is negligible (D95N), two cases, where it is long-range (D58N and E84K), and one case, where it is mostly local (M124L). While interpreting the side chain perturbation patterns as pathways or networks of energetic connectivity appears tempting, the lack of dynamic information about aromatic side chains and methylene groups makes it difficult to make this kind of generalization. Our study of methyl dynamics in four diagnostic calmodulin mutants showed that dynamic response to mutations need not be symmetric and varies from local to long-range.
Footnotes
Supported by NIH research grant DK 39806. TI is the recipient of an NIH postdoctoral fellowship GM 071133
Submitted to Biochemistry for consideration as a Regular Paper
Abbreviations used: CaM, calcium-saturated calmodulin; LMS, least median squares; LS, least squares; NOE, {1H}-15N nuclear Overhauser effect; and , Lipari-Szabo squared generalized order parameters for the methyl group symmetry axis and amide N-H bond, respectively; r.m.s.d., root mean squared deviation; smMLCKp, peptide based on the calmodulin-binding domain of the smooth muscle myosin light chain kinase with sequence GSARRKWQKTGHAVRAIGRLS; T1, longitudinal relaxation time; T2, transverse relaxation time.
References
- 1.Perutz MF. Stereochemistry of cooperative effects in haemoglobin. Nature. 1970;228:726–39. doi: 10.1038/228726a0. [DOI] [PubMed] [Google Scholar]
- 2.Fersht, A. (1995) Enzyme structure and mechanism, W. H. Freeman and company, New York.
- 3.Goldsmith EJ. Allosteric enzymes as models for chemomechanical energy transducing assemblies. FASEB J. 1996;10:702–708. doi: 10.1096/fasebj.10.7.8635687. [DOI] [PubMed] [Google Scholar]
- 4.Changeux JP, Edelstein SJ. Allosteric receptors after 30 years. Neuron. 1998;21:959–980. doi: 10.1016/s0896-6273(00)80616-9. [DOI] [PubMed] [Google Scholar]
- 5.Ranson NA, White HE, Saibil HR. Chaperonins. Biochem J. 1998;333:233–242. doi: 10.1042/bj3330233. [DOI] [PMC free article] [PubMed] [Google Scholar]
- 6.Lim WA. The modular logic of signaling proteins: Building allosteric switches from simple binding domains. Curr Opin Struct Biol. 2002;12:61–68. doi: 10.1016/s0959-440x(02)00290-7. [DOI] [PubMed] [Google Scholar]
- 7.Steinberg IZ, Scheraga HA. Entropy changes accompanying association reactions of proteins. J Biol Chem. 1963;238:172–81. [PubMed] [Google Scholar]
- 8.Cooper A, Dryden DTF. Allostery without conformational change - a plausible model. Eur Biophys J Biophys Lett. 1984;11:103–109. doi: 10.1007/BF00276625. [DOI] [PubMed] [Google Scholar]
- 9.Karplus M, Ichiye T, Pettitt BM. Configurational entropy of native proteins. Biophys J. 1987;52:1083–5. doi: 10.1016/S0006-3495(87)83303-9. [DOI] [PMC free article] [PubMed] [Google Scholar]
- 10.Janin J. Quantifying biological specificity: The statistical mechanics of molecular recognition. Proteins. 1996;25:438–45. doi: 10.1002/prot.4. [DOI] [PubMed] [Google Scholar]
- 11.Freire E. Statistical thermodynamic linkage between conformational and binding equilibria. Adv Prot Chem. 1998;51:255–279. doi: 10.1016/s0065-3233(08)60654-3. [DOI] [PubMed] [Google Scholar]
- 12.Pan H, Lee JC, Hilser VJ. Binding sites in escherichia coli dihydrofolate reductase communicate by modulating the conformational ensemble. Proc Natl Acad Sci U S A. 2000;97:12020–12025. doi: 10.1073/pnas.220240297. [DOI] [PMC free article] [PubMed] [Google Scholar]
- 13.Wand AJ. Dynamic activation of protein function: A view emerging from nmr spectroscopy. Nat Struct Biol. 2001;8:926–931. doi: 10.1038/nsb1101-926. [DOI] [PubMed] [Google Scholar]
- 14.Akke M, Bruschweiler R, Palmer AG. NMR order parameters and free-energy - an analytical approach and its application to cooperative Ca2+ binding by calbindin-d(9k) J Am Chem Soc. 1993;115:9832–9833. [Google Scholar]
- 15.Yang DW, Kay LE. Contributions to conformational entropy arising from bond vector fluctuations measured from NMR-derived order parameters: Application to protein folding. J Mol Biol. 1996;263:369–382. doi: 10.1006/jmbi.1996.0581. [DOI] [PubMed] [Google Scholar]
- 16.Li Z, Raychaudhuri S, Wand AJ. Insights into the local residual entropy of proteins provided by NMR relaxation. Prot Sci. 1996;5:2647–50. doi: 10.1002/pro.5560051228. [DOI] [PMC free article] [PubMed] [Google Scholar]
- 17.Loh AP, Pawley N, Nicholson LK, Oswald RE. An increase in side chain entropy facilitates effector binding: NMR characterization of the side chain methyl group dynamics in cdc42hs. Biochemistry. 2001;40:4590–4600. doi: 10.1021/bi002418f. [DOI] [PubMed] [Google Scholar]
- 18.Lee AL, Kinnear SA, Wand AJ. Redistribution and loss of side chain entropy upon formation of a calmodulin-peptide complex. Nat Struct Biol. 2000;7:72–77. doi: 10.1038/71280. [DOI] [PubMed] [Google Scholar]
- 19.Perutz MF, Fermi G, Luisi B, Shaanan B, Liddington RC. Stereochemistry of cooperative mechanisms in hemoglobin. Cold Spring Harb Symp Quant Biol. 1987;52:555–65. doi: 10.1101/sqb.1987.052.01.063. [DOI] [PubMed] [Google Scholar]
- 20.Van Eldik, L. J., and Watterson, D. M. (1998) in Calmodulin and signal transduction (Van Eldik, L. J., and M., W. D., Eds.) pp 1–15, Academic Press.
- 21.Meador WE, Means AR, Quiocho FA. Target enzyme recognition by calmodulin - 2.4-angstrom structure of a calmodulin-peptide complex. Science. 1992;257:1251–1255. doi: 10.1126/science.1519061. [DOI] [PubMed] [Google Scholar]
- 22.Mirzoeva S, Weigand S, Lukas TJ, Shuvalova L, Anderson WF, Watterson DM. Analysis of the functional coupling between calmodulin's calcium binding and peptide recognition properties. Biochemistry. 1999;38:3936–3947. doi: 10.1021/bi9821263. [DOI] [PubMed] [Google Scholar]
- 23.Urbauer JL, Short JH, Dow LK, Wand AJ. Structural-analysis of a novel interaction by calmodulin - high-affinity binding of a peptide in the absence of calcium. Biochemistry. 1995;34:8099–8109. doi: 10.1021/bi00025a016. [DOI] [PubMed] [Google Scholar]
- 24.Kranz JK, Flynn PF, Fuentes EJ, Wand AJ. Dissection of the pathway of molecular recognition by calmodulin. Biochemistry. 2002;41:2599–2608. doi: 10.1021/bi011818f. [DOI] [PubMed] [Google Scholar]
- 25.Seeholzer SH, Wand AJ. Structural characterization of the interactions between calmodulin and skeletal muscle myosin light chain kinase: Effect of peptide (576–594)g binding on the Ca2+-binding domains. Biochemistry. 1989;28:4011–20. doi: 10.1021/bi00435a057. [DOI] [PubMed] [Google Scholar]
- 26.Muhandiram DR, Kay LE. Gradient-enhanced triple-resonance 3-dimensional NMR experiments with improved sensitivity. J Magn Reson Ser B. 1994;103:203–216. [Google Scholar]
- 27.Montelione GT, Lyons BA, Emerson SD, Tashiro M. An efficient triple resonance experiment using C-13 isotropic mixing for determining sequence-specific resonance assignments of isotopically-enriched proteins. J Am Chem Soc. 1992;114:10974–10975. [Google Scholar]
- 28.Uhrin D, Uhrinova S, Leadbeater C, Nairn J, Price NC, Barlow PN. 3D HCCH3-tocsy for resonance assignment of methyl-containing side chains in C-13-labeled proteins. J Magn Reson. 2000;142:288–293. doi: 10.1006/jmre.1999.1951. [DOI] [PubMed] [Google Scholar]
- 29.Bax A, Delaglio F, Grzesiek S, Vuister GW. Resonance assignment of methionine methyl-groups and chi(3) angular information from long-range proton-carbon and carbon- carbon J-correlation in a calmodulin peptide complex. J Biomol NMR. 1994;4:787–797. doi: 10.1007/BF00398409. [DOI] [PubMed] [Google Scholar]
- 30.Delaglio F, Grzesiek S, Vuister GW, Zhu G, Pfeifer J, Bax A. Nmrpipe - a multidimensional spectral processing system based on Unix pipes. J Biomol NMR. 1995;6:277–293. doi: 10.1007/BF00197809. [DOI] [PubMed] [Google Scholar]
- 31.Goddard, T. D., and Kneller, D. G., SPARKY 3, University of California, San Francisco.
- 32.Farrow NA, Muhandiram R, Singer AU, Pascal SM, Kay CM, Gish G, Shoelson SE, Pawson T, Formankay JD, Kay LE. Backbone dynamics of a free and a phosphopeptide-complexed src homology-2 domain studied by N-15 NMR relaxation. Biochemistry. 1994;33:5984–6003. doi: 10.1021/bi00185a040. [DOI] [PubMed] [Google Scholar]
- 33.Muhandiram DR, Yamazaki T, Sykes BD, Kay LE. Measurement of H-2 T-1 and T-1p relaxation-times in uniformly C-13-labeled and fractionally H-2-labeled proteins in solution. J Am Chem Soc. 1995;117:11536–11544. [Google Scholar]
- 34.Lipari G, Szabo A. Model-free approach to the interpretation of nuclear magnetic-resonance relaxation in macromolecules. 1 Theory and range of validity. J Am Chem Soc. 1982;104:4546–4559. [Google Scholar]
- 35.Lipari G, Szabo A. Model-free approach to the interpretation of nuclear magnetic-resonance relaxation in macromolecules. 2 Analysis of experimental results. J Am Chem Soc. 1982;104:4559–4570. [Google Scholar]
- 36.Mittermaier A, Kay LE. Measurement of methyl H-2 quadrupolar couplings in oriented proteins. How uniform is the quadrupolar coupling constant? J Am Chem Soc. 1999;121:10608–10613. [Google Scholar]
- 37.Waltersson Y, Linse S, Brodin P, Grundstrom T. Mutational effects on the cooperativity of Ca2+ binding in calmodulin. Biochemistry. 1993;32:7866–7871. doi: 10.1021/bi00082a005. [DOI] [PubMed] [Google Scholar]
- 38.Wu XC, Reid RE. Structure calcium affinity relationships of site III of calmodulin: Testing the acid pair hypothesis using calmodulin mutants. Biochemistry. 1997;36:8649–8656. doi: 10.1021/bi970278c. [DOI] [PubMed] [Google Scholar]
- 39.Wu XC, Reid RE. Conservative D133E mutation of calmodulin site IV drastically alters calcium binding and phosphodiesterase regulation. Biochemistry. 1997;36:3608–3616. doi: 10.1021/bi962149m. [DOI] [PubMed] [Google Scholar]
- 40.Haiech J, Kilhoffer MC, Lukas TJ, Craig TA, Roberts DM, Watterson DM. Restoration of the calcium-binding activity of mutant calmodulins toward normal by the presence of a calmodulin binding structure. J Biol Chem. 1991;266:3427–3431. [PubMed] [Google Scholar]
- 41.Maune JF, Klee CB, Beckingham K. Ca2+ binding and conformational change in 2 series of point mutations to the individual Ca2+-binding sites of calmodulin. J Biol Chem. 1992;267:5286–5295. [PubMed] [Google Scholar]
- 42.Gao ZH, Krebs J, Vanberkum MFA, Tang WJ, Maune JF, Means AR, Stull JT, Beckingham K. Activation of 4 enzymes by 2 series of calmodulin mutants with point mutations in individual ca(2+) binding-sites. J Biol Chem. 1993;268:20096–20104. [PubMed] [Google Scholar]
- 43.Black DJ, Tikunova SB, Johnson JD, Davis JP. Acid pairs increase the N-terminal Ca2+ affinity of cam by increasing the rate of Ca2+ association. Biochemistry. 2000;39:13831–13837. doi: 10.1021/bi001106+. [DOI] [PubMed] [Google Scholar]
- 44.Edwards RA, Walsh MP, Sutherland C, Vogel HJ. Activation of calcineurin and smooth muscle myosin light chain kinase by Met-to-Leu mutants of calmodulin. Biochem J. 1998;331:149–152. doi: 10.1042/bj3310149. [DOI] [PMC free article] [PubMed] [Google Scholar]
- 45.Zhang MJ, Li M, Wang JH, Vogel HJ. The effect of met-]leu mutations on calmodulins ability to activate cyclic-nucleotide phosphodiesterase. J Biol Chem. 1994;269:15546–15552. [PubMed] [Google Scholar]
- 46.Chin D, Means AR. Methionine to glutamine substitutions in the C-terminal domain of calmodulin impair the activation of three protein kinases. J Biol Chem. 1996;271:30465–30471. doi: 10.1074/jbc.271.48.30465. [DOI] [PubMed] [Google Scholar]
- 47.George SE, Su ZH, Fan DJ, Wang ST, Johnson JD. The fourth EF-hand of calmodulin and its helix-loop-helix components: Impact on calcium binding and enzyme activation. Biochemistry. 1996;35:8307–8313. doi: 10.1021/bi960495y. [DOI] [PubMed] [Google Scholar]
- 48.Lukas TJ, Burgess WH, Prendergast FG, Lau W, Watterson DM. Calmodulin binding domains: Characterization of a phosphorylation and calmodulin binding site from myosin light chain kinase. Biochemistry. 1986;25:1458–64. doi: 10.1021/bi00354a041. [DOI] [PubMed] [Google Scholar]
- 49.Kemp BE, Pearson RB, Guerriero V, Jr, Bagchi IC, Means AR. The calmodulin binding domain of chicken smooth muscle myosin light chain kinase contains a pseudosubstrate sequence. J Biol Chem. 1987;262:2542–8. [PubMed] [Google Scholar]
- 50.Rousseeuw, P. J., and Leroy, A. M. (2003) Robust regression and outlier detection, John Wiley & Sons, Hoboken, New Jersey.
- 51.Roberts DM, Crea R, Malecha M, Alvaradourbina G, Chiarello RH, Watterson DM. Chemical synthesis and expression of a calmodulin gene designed for site-specific mutagenesis. Biochemistry. 1985;24:5090–5098. doi: 10.1021/bi00340a020. [DOI] [PubMed] [Google Scholar]
- 52.Nelson, M. R., and Chazin, W. J. (1998) in Calmodulin and signal transduction (Van Eldik, L. J., and M., W. D., Eds.) pp 17–64, Academic Press.
- 53.Stone MJ. Nmr relaxation studies of the role of conformational entropy in protein stability and ligand binding. Acc Chem Res. 2001;34:379–388. doi: 10.1021/ar000079c. [DOI] [PubMed] [Google Scholar]
- 54.Maler L, Blankenship J, Rance M, Chazin WJ. Site-site communication in the ef-hand ca2+-binding protein calbindin d-9k. Nat Struct Biol. 2000;7:245–250. doi: 10.1038/73369. [DOI] [PubMed] [Google Scholar]
- 55.Stevens SY, Sanker S, Kent C, Zuiderweg ERP. Delineation of the allosteric mechanism of a cytidylyltransferase exhibiting negative cooperativity. Nat Struct Biol. 2001;8:947–952. doi: 10.1038/nsb1101-947. [DOI] [PubMed] [Google Scholar]
- 56.LeMaster DM, Kushlan DM. Dynamical mapping of E-coli thioredoxin via C-13 nmr relaxation analysis. J Am Chem Soc. 1996;118:9255–9264. [Google Scholar]
- 57.Wand AJ, Urbauer JL, McEvoy RP, Bieber RJ. Internal dynamics of human ubiquitin revealed by C-13- relaxation studies of randomly fractionally labeled protein. Biochemistry. 1996;35:6116–6125. doi: 10.1021/bi9530144. [DOI] [PubMed] [Google Scholar]
- 58.Lee AL, Urbauer JL, Wand AJ. Improved labeling strategy for 13C relaxation measurements of methyl groups in proteins. J Biomol NMR. 1997;9:437–40. doi: 10.1023/a:1018311013338. [DOI] [PubMed] [Google Scholar]
- 59.Kay LE, Muhandiram DR, Farrow NA, Aubin Y, FormanKay JD. Correlation between dynamics and high affinity binding in an Sh2 domain interaction. Biochemistry. 1996;35:361–368. doi: 10.1021/bi9522312. [DOI] [PubMed] [Google Scholar]
- 60.Fuentes EJ, Der CJ, Lee AL. Ligand-dependent dynamics and intramolecular signaling in a PDZ domain. J Mol Biol. 2004;335:1105–1115. doi: 10.1016/j.jmb.2003.11.010. [DOI] [PubMed] [Google Scholar]
- 61.Lockless SW, Ranganathan R. Evolutionarily conserved pathways of energetic connectivity in protein families. Science. 1999;286:295–299. doi: 10.1126/science.286.5438.295. [DOI] [PubMed] [Google Scholar]
- 62.Millet O, Mittermaier A, Baker D, Kay LE. The effects of mutations on motions of side-chains in protein L studied by H-2 nmr dynamics and scalar couplings. J Mol Biol. 2003;329:551–563. doi: 10.1016/s0022-2836(03)00471-6. [DOI] [PubMed] [Google Scholar]
- 63.Clarkson MW, Lee AL. Long-range dynamic effects of point mutations propagate through side chains in the serine protease inhibitor eglin c. Biochemistry. 2004;43:12448–12458. doi: 10.1021/bi0494424. [DOI] [PubMed] [Google Scholar]
- 64.Farrar YJK, Lukas TJ, Craig TA, Watterson DM, Carlson GM. Features of calmodulin that are important in the activation of the catalytic subunit of phosphorylase-kinase. J Biol Chem. 1993;268:4120–4125. [PubMed] [Google Scholar]