Abstract
Human immunodeficiency virus (HIV) entry into a host cell requires the fusion of virus and cellular membranes that is driven by interaction of the viral envelope glycoproteins gp120 and gp41 (gp120/gp41) with CD4 and a coreceptor, typically either CXCR4 or CCR5. The stoichiometry of gp120/gp41:CD4:CCR5 necessary to initiate membrane fusion is not known. To allow an examination of early events in gp120/gp41-driven membrane fusion, we developed a novel real-time cell-cell fusion assay. Using this assay to study fusion kinetics, we found that altering the cell surface density of gp120/gp41 affected the maximal extent of fusion without dramatically altering fusion kinetics. Collectively, these observations are consistent with the view that gp120/gp41-driven membrane fusion requires the formation of a threshold number of fusion-active intercellular gp120/gp41:CD4:CCR5 complexes. Furthermore, the probability of reaching this threshold is governed, in part, by the surface density of gp120/gp41.
Though much progress has been made toward understanding the mechanism whereby human immunodeficiency virus (HIV) gp120 and gp41 (gp120/gp41) binding to CD4 and appropriate coreceptors triggers virus entry, many questions remain. One question of central importance is, what stoichiometry of gp120/gp41 trimers, CD4 molecules, and coreceptor molecules (gp120/gp41:CD4:CoR complex) is needed to initiate membrane fusion? The efficiency of forming fusogenic gp120/gp41:CD4:CoR complexes, regardless of the precise stoichiometry that must be achieved, likely depends on many factors, such as the cell (or virion) surface densities of the relevant molecules (24), their quaternary structure (e.g., coreceptor dimerization) (30) or preexisting CD4-coreceptor interactions (15, 17, 37), and possibly the conformational state or microenvironment of the coreceptor (16).
Kabat and coworkers have proposed a mass-action model to explain their findings that a threshold density of CCR5 is needed to support HIV infection and that the threshold level of CCR5 varies according to CD4 expression (14, 24). An extension of the mass-action model of complex formation is that the virion-surface density (or cell-surface density) of gp120/gp41 is likely to be an important determinant of how efficiently fusion-competent gp120/gp41:CD4:CoR complexes form. Understanding of the fusion mechanism of influenza virus hemagglutinin (HA) protein has benefited greatly from studies in which fusogenic activity has been correlated with HA expression levels (5, 8). In principle, similar studies applied to HIV gp120/gp41-driven membrane fusion might reveal the minimum number of gp120/gp41 molecules necessary to promote membrane fusion. To date, this parameter has not been investigated systematically, in part because of a dearth of experimental systems in which to study early gp120/gp41 function. Here we describe the use of a new cell-cell fusion assay capable of monitoring gp120/gp41 function on a short time scale (minutes to hours) to address this issue.
MATERIALS AND METHODS
Cells.
SupT1 cells (29) were obtained from the AIDS Research and Reference Reagent Program. SupT1, SupT1/β-lactamase (BlaM), and SupT1/CCR5/BlaM cells were maintained in RPMI 1640 supplemented with 10% fetal bovine serum, 10 mM HEPES buffer in the absence or presence of 500 μg of G418 (for β-lactamase-expressing clones) (Life Technologies)/ml, and 0.45 μg of puromycin (Clontech)/ml (for CCR5-expressing clones). HeLa cells were obtained from American Type Culture Collection and were maintained in Dulbecco's modified Eagle medium (DMEM) supplemented with 10% fetal bovine serum (Life Technologies).
SupT1/CCR5/BlaM.
The CCR5 plasmid, pJBpuro-1 was a gift of B. Daugherty and J. DeMartino. pcDNA3-blaM plasmid was obtained from Aurora Biosciences Corp. SupTI clones constitutively expressing β-lactamase were constructed by electroporation of SupT1 cells with pcDNA3-blaM and selecting transformants for resistance to 800 μg of G418/ml. Clones were screened for expression of β-lactamase by labeling cells with 1 μM CCF2-AM per manufacturer's instructions (Aurora Biosciences Corp). CCR5-expressing derivatives of SupT1/BlaM cells were constructed by electroporation of cells with pJBpuro-1, selecting transformants for resistance to 0.45 μg of puromycin/ml and 800 μg of G418/ml. Clones were isolated by limiting dilution, and expression of CCR5 was assessed by quantitative fluorescence-activated cell sorter analysis.
Recombinant vaccinia viruses expressing HIV gp160.
Recombinant vaccinia viruses were constructed for expression of gp160 from HIV-1 strains HXB2 and Sf162 essentially as previously described (26). Full-length gp160 genes were amplified by PCR. Templates for HXB2 strain and the Sf162 were plasmids pF412 (25) and pCAGGS/Sf162 (3), respectively. The following synthetic oligonucleotides (Midland) were used to amplify full-length HIV gp160 genes: 5′-GGGCTCGAGAAGACAGTGGCAATGA-3′ (sense primer with appended XhoI site) and 5′-AAAAGCGGCCGCCACCCATCTTATAGCAAA-3′ (antisense primer with appended NotI site). The resulting PCR products were purified, digested with XhoI and NotI, and inserted into pSC11-MI vector digested with SalI and NotI (Tong-Ming Fu; Merck Research Labs). The resulting plasmids, pJL24 and pJL29, contained full-length gp160 genes from HxB2 and Sf162, respectively. Sequences of all inserts were verified using automated nucleotide sequence analysis. These plasmids were used to generate recombinant vaccinia viruses Venv-5 and Venv-10, respectively, using standard protocols for production of recombinant vaccinia virus (7).
Cell-cell fusion assay.
HeLa cells were infected in bulk for 2 h with Venv recombinant vaccinia virus at a multiplicity of infection of 2.5 in 0.1% bovine serum albumin (BSA) in Dulbecco's phosphate-buffered saline (DPBS), with gentle mixing every 15 min. At the end of the infection period, cells were washed with DPBS to remove excess virus and resuspended in cDMEM at a cell density of 2.5 × 10⁵ cells/ml. Cells were plated into 96-well clear-bottom black plates (Costar 3603) at a cell density of 2.5 × 10⁴ cells/well and incubated at 37°C for 18 to 20 h to allow gp160 expression. The media was removed from wells and cells were labeled with 5 μM CCF2-AM for 60 min at room temperature. After the labeling period, CCF2-AM solution was removed and cells were washed two times with DPBS. All controls, compounds, and cells were diluted in complete HBSS (Hanks' balanced salt solution with 2 mM glutamine and 20 mM HEPES buffer; Life Technologies) containing 2 mM probenecid (Sigma) and 1% dimethyl sulfoxide. Where indicated, inhibitors (DP-178 [Synpep], AOP-RANTES [Gryphon Scientific], stromal-cell-derived factor 1β (SDF-1β) [Peprotech]) were added to wells in a volume of 50 μl at 2× final concentration. SupT1/β-lac/CCR5 cells (105/well) were added in 50 μl so that the final volume was 100 μl/well. Plates were transferred to a 37oC, 5% CO2 environment to allow cell-cell fusion to occur. Fusion of cells and the shift from green to blue fluorescence were visualized by fluorescence microscopy. Fluorescence was quantified using a BMG FLUOstar fluorometer, reading from the bottom of the plate using a (mean ± standard deviation) 405-nm ± 20-nm excitation filter (Chroma Technologies) and emission filters of 460 ± 40 nm (blue channel; Chroma) and 538 nm (green channel; BMG). Where indicated, 50% inhibitory concentrations (IC50s) were determined using a four-parameter logistic fit to the equation
 |
where y is the blue/green ratio, m1 is the assay background, m2 is the highest signal in the assay, and m3 is the slope of curve. In some experiments, vaccinia virus-infected HeLa cells were cultured overnight in the presence of AraC (cytosine β-d-arabinofuranoside; Sigma) as follows. At the end of the infection period, 50-μl aliquots of HeLa/Venv cells at twice the normal density (5 × 10⁵/ml) were added to 50-μl aliquots of medium containing 2× concentrations of AraC in wells of Costar 3603 plates.
Microscopy and image processing.
The DP178 titration plate was imaged on an Olympus IX-70 inverted microscope with mercury excitation and CCF2 filter set no. 41031 from Chroma Technology (Brattleboro, N.H.). Digital micrographs were recorded using a SpotRT digital CCD camera (Diagnostic Instruments, Sterling Heights, Mich.) via a personal computer. TIFF files were loaded and analyzed in Image Pro Plus version 4.0 software (Media Cybernetics, Gaithersburg, Md.). Micrographs presented in this paper have been contrast enhanced. Images acquired in RGB (red, green, blue) color space were converted to HSI (hue, saturation, intensity) space by using the color extract command. The resulting grayscale “intensity” image was flattened and then segmented to determine where cells were located within the field of view. A binary mask was created from the segmented intensity image, and a watershed split was applied to separate adjacent cells. A point-wise minimum filter was applied between the “hue” image and the split mask to create a final image to which two distinct peaks appeared in the histogram of gray values, corresponding to blue and green pixels. Two-class segmentation was done to separate the two hue peaks, and the percentage of the area that was blue cells was determined in each image by dividing the total number of blue pixels by the total number of blue plus green pixels.
Immunofluorescence detection of gp120 was done using immunoglobulin G1b12 (IgG1b12) directly conjugated to phycoerythrin (custom conjugation done by Pharmingen). Cells (grown in eight-well glass chamber slides; Nalgene) were incubated with the antibody (1 μg/ml in DPBS-0.1% BSA) for 1 h at room temperature and then washed three times with DPBS-0.1% BSA. Micoroscopic images were captured using an Olympus DP-10 digital camera and a 10× fluorescence objective.
Western blotting.
Recombinant Sf162 gp120-FLAG was generated and purified as previously described (26) and quantified by comparing band intensities with known amounts of HXB2 gp120 (ABI) on Colloidal Blue-stained sodium dodecyl sulfate (SDS) gels (Novex) (data not shown). Cell lysates were prepared by lysing approximately 106 vaccinia virus-infected HeLa/gp160Sf162 cells grown in the presence of different concentrations of AraC in 100 μl of 2× SDS-polyacrylamide gel electrophoresis (PAGE) sample buffer (Novex). Proteins in each lysate (2 μl) were resolved by electrophoresis through a 4 to 20% acrylamide Tris-glycine gel (Novex) and transferred to nitrocellulose by electroblotting in 20% methanol-1× transfer buffer (Novex). Proteins were detected by incubating the blot sequentially with an anti-gp120 antibody (ABI 13-107-100), alkaline phosphatase-labeled goat anti-rat IgG (Kirkegaard & Perry), and BCIP (5-bromo-4-chloro-3-indolylphosphate)-nitroblue tetrazolium (NBT) phosphatase substrate (Kirkegaard & Perry). An image for analysis of band intensity was acquired using a densitometry system (Bio-Rad model GS-700 Imaging Densitometer), and data were acquired and analyzed using the Bio-Rad Molecular Analyst software package, version 1.4.1. Equal areas of Western blot images were integrated to determine an adjusted volume of signal for the standard curve (see Fig. 6B, inset). Unknowns were compared to the standard curve to determine the amount of gp120 contained in each lane.
FIG. 6.
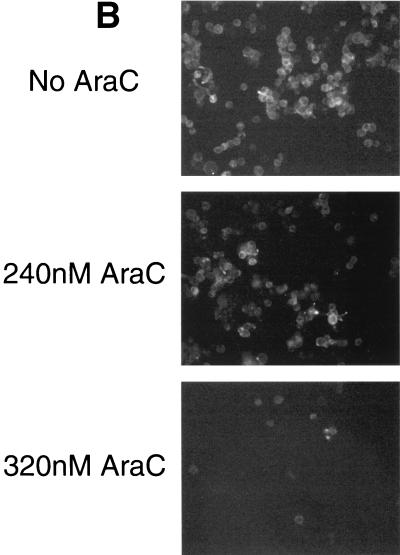
Cytosine arabinoside (AraC) treatment reduces cell surface expression of gp120. HeLa cells infected with HXB2 gp160-expressing vaccinia virus were cultured in the presence of various concentrations of cytosine arabinoside and analyzed for surface expression. (A) Western blot detection of biotinylated gp120. Cells infected with HXB2 gp160-expressing vaccinia virus in the presence of the indicated concentrations of AraC were treated with the membrane-impermeant biotinylation reagent sulfo-NHS-LC-biotin, lysed, and immunoprecipitated with NHS (right) or serum from HIV-infected subjects (HIVIG, left). Biotinylated proteins were resolved by SDS-PAGE, transferred to nitrocellulose, and detected with horseradish peroxidase-conjugated streptavidin. (B) Cells were prepared as described for panel A but were grown in glass chamber slides and were stained with a phycoerythrin-conjugated anti-gp120 monoclonal antibody.
Detection of cell surface gp120 was done using a biotinylation-immunoprecipitation procedure. Cells were washed twice with PBS, pH 8.0 (10 mM sodium phosphate [pH 8.0]-140 mM NaCl), and then surface biotinylated using the membrane-impermeant reagent sulfo-NHS-LC-biotin (Pierce; 1 mg/ml in PBS, pH 8.0) for 30 min at room temperature. Biotinylated cells were washed twice with PBS, pH 8.0, and then lysed in ice-cold NET/NP-40 (NET is 50 mM Tris-HCl [pH 8.0]-150 mM NaCl-5 mM EDTA; NET/NP-40 is NET containing 1% NP-40 [Roche]) containing a complete protease inhibitor tablet (Roche) for 1 h on ice. Nuclei and debris were cleared by centrifugation in a microcentrifuge for 15 min at 4°C. Lysates were precleared by sequential incubation with 5 μl of normal human serum (NHS; 1 h, ice) and protein A-Sepharose CL-4B (100 μl of a 10% suspension in NET/NP-40; 1 h, 4°C rocker) and removal of beads by centrifugation. Precleared lysates were then incubated with 5 μl of NHS or psoralen-inactivated serum from HIV-infected subjects (Scripps) for 1 h on ice and then were incubated with protein A-Sepharose beads as described above. Beads were washed three times with NET/NP-40. Bound proteins were eluted by boiling in SDS-PAGE sample buffer (Novex), resolved by electrophoresis through a 10% acrylamide Tris-glycine gel (Novex), and transferred to nitrocellulose by electroblotting in 20% methanol-1× transfer buffer (Novex). Biotinylated proteins were detected by incubating the blots sequentially with horseradish peroxidase-conjugated streptavidin (Pierce) and ECL reagent (Amersham) and exposing them to Hyperfilm (Amersham).
RESULTS
New assay to measure gp160-driven cell-cell fusion in real time.
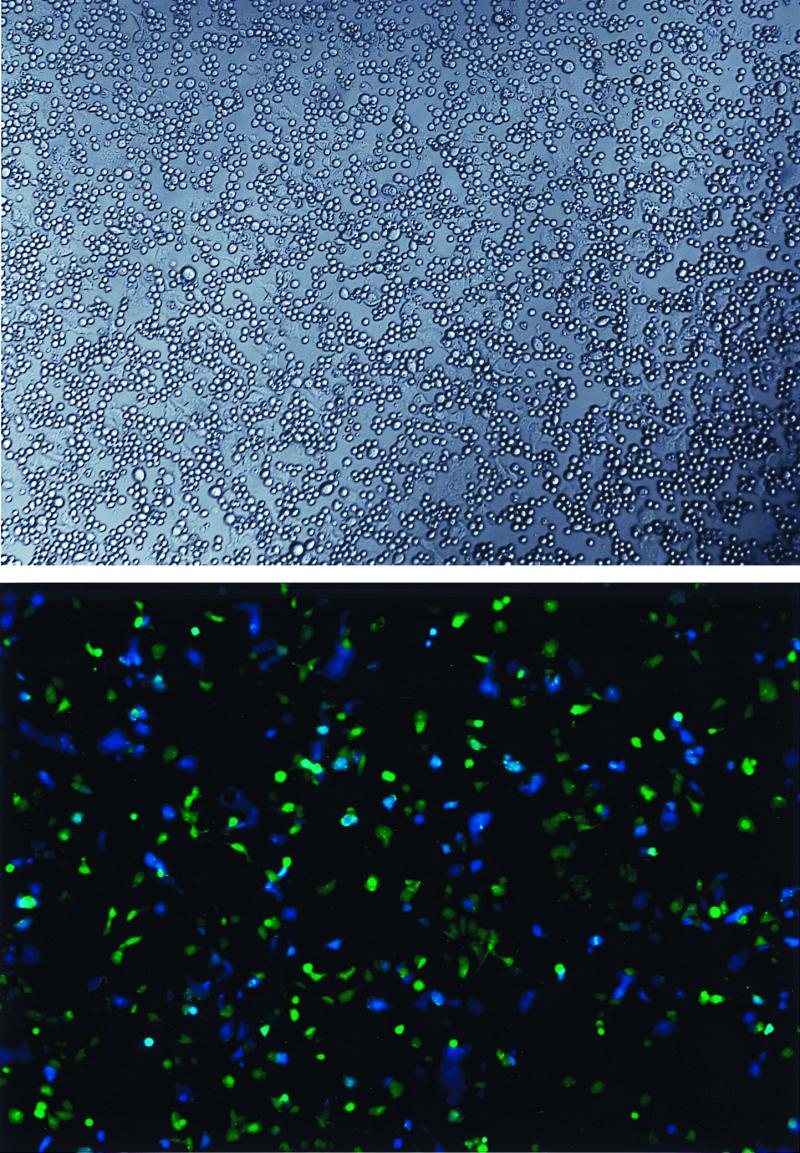
We set out to create a quantitative cell-cell fusion assay that (i) could be measured in real time (i.e., did not require induction of gene expression), (ii) could be done with a 96-well plate, (iii) did not require complicated image processing, and (iv) could be measured using a standard multiwell plate reader (e.g., luminometer, spectrophotometer, or fluorometer). Our solution to this problem was to measure changes in fluorescence generated after mixing two cell populations, one of which was loaded with a reporter fluorophore (Fig. 1, schematic diagram). The first population, derived from SupT1 cells, expresses CD4, one or two HIV coreceptors (CXCR4 ± CCR5), and constitutively high levels of the enzyme β-lactamase. The second population consists of HeLa cells expressing an HIV gp160 gene by virtue of infection with a recombinant vaccinia virus. The gp160-expressing HeLa cells are passively loaded with the brightly fluorescent β-lactamase substrate CCF2-AM (32, 38). When excited at 405 nm, intact CCF2 displays bright green fluorescence, whereas the β-lactamase cleavage product displays bright blue fluorescence. When the cells are mixed, a HeLa cell displays green fluorescence until it fuses with a β-lactamase expressing SupT1 cell. Upon fusion, the contents of the two cells mix, allowing cleavage of CCF2 by β-lactamase and yielding a HeLa-SupT1 heterokaryon displaying blue fluorescence (Fig. 2).
FIG. 1.
Schematic diagram of fluorometric cell-cell fusion assay. HeLa cells infected for ∼20 h with recombinant vaccinia virus encoding HIV-1 gp160 were passively loaded with the fluorescent β-lactamase substrate CCF2-AM and then were washed and incubated at 37°C with cells constitutively expressing β-lactamase, CD4, and one or more coreceptors. Cell-cell fusion placed enzyme and substrate in the same compartment, resulting in cleavage of the substrate and a change in fluorescence emission from green to blue.
FIG. 2.
Appearance of cells. CCF2-loaded HeLa cells expressing gp120/gp41 from the Sf162 strain of HIV were incubated with SupT1/BlaM cells for 30 min at 37°C. Top, image of a representative coculture using Hoffman optics; bottom, image of the same field with epifluorescence. Adherent cells are HeLa, and small round cells are SupT1. The color of fluorescence indicates whether a given HeLa cell had (blue) or had not (green) fused with a SupT1 cell.
Cell-cell fusion is specific.
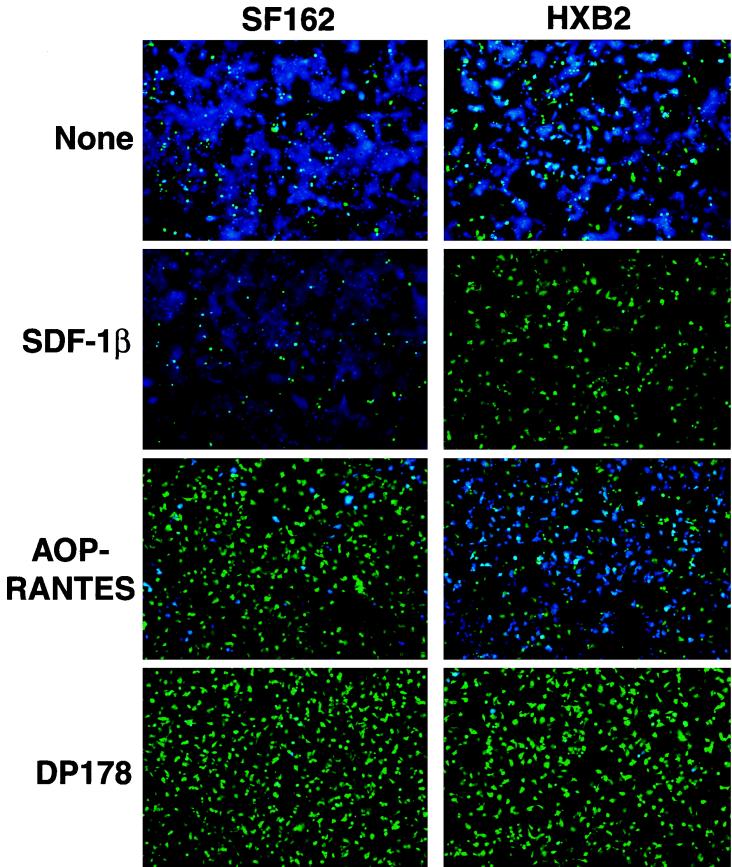
We examined the molecular requirements of cell-cell fusion in this assay by using specific inhibitors of HIV entry in conjunction with recombinant vaccinia viruses expressing gp160 genes from two different HIV strains (Fig. 3). HeLa cells expressing gp160 from either the HXB2 strain (uses CXCR4 coreceptor [11]) or the Sf162 strain (uses CCR5 coreceptor [28]) were mixed with SupT1/CCR5/BlaM target cells in the presence or absence of inhibitors, incubated at 37°C to allow fusion, and analyzed by fluorescence microscopy. Both gp160's directed the fusion of HeLa cells with target cells (presence of blue cells). Fusion directed by both gp160's was blocked (absence of blue cells) by the dominant-negative gp41 peptide DP-178 (also known as T20), indicating that fusion requires functional gp120/gp41. Coreceptor specificity was confirmed by the observation that SDF-1β blocked only fusion driven by HXB2 gp120/gp41, whereas AOP-RANTES blocked only fusion driven by Sf162 gp120/gp41. In cultures with HXB2 gp120/gp41 driven, inclusion of AOP-RANTES at a high concentration reproducibly reduced the size of syncytia (i.e., lateral fusion of HeLa cells with each other after initial fusion with SupT1 cells), but the compound did not block fusion of HeLa cells with SupT1 cells; the explanation for this observation is not known. These findings generally recapitulate the known specificities of the X4 and R5 envelope glycoproteins (1, 22, 27). Taken together, these results indicate that this assay requires both envelope and coreceptor and detects legitimate cell-cell fusion driven by gp120/gp41.
FIG. 3.
Cell-cell fusion is specific. CCF2-loaded HeLa cells expressing gp120/gp41 from HXB2 (X4) or Sf162 (R5) HIV strains were incubated with SupT1/CCR5/BlaM clone C6 in the absence or presence of inhibitors DP-178 (4 μM), SDF-1β (10 μM), or AOP-RANTES (10 μM). Epifluorescence images were recorded after 2 h of incubation at 37°C.
Qualitative kinetics of cell-cell fusion.
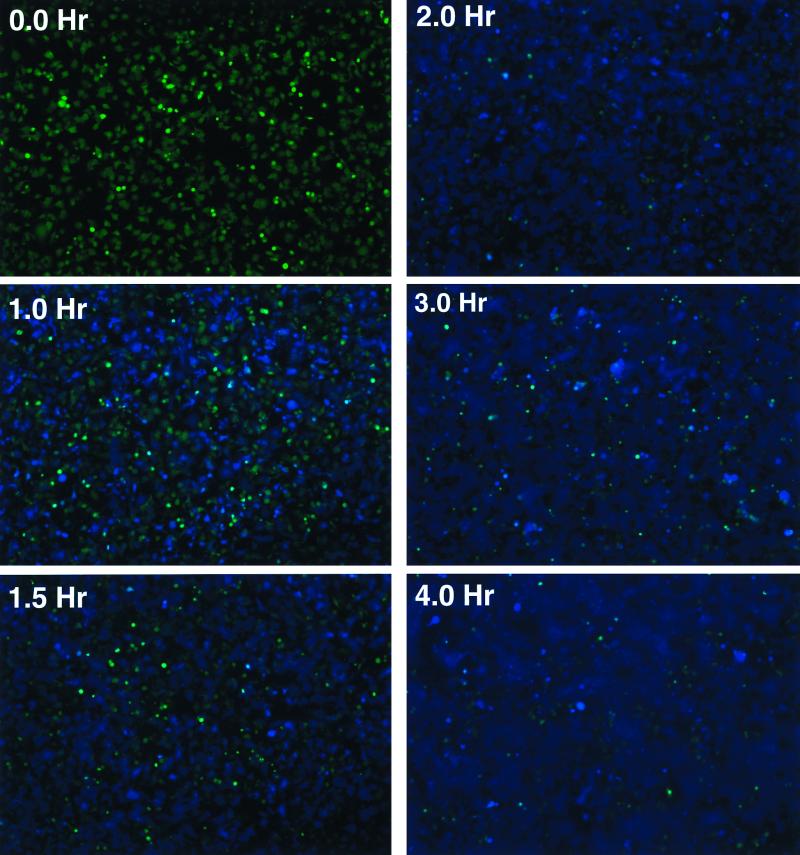
The images presented in Fig. 4 provide a qualitative view of the kinetics of cell-cell fusion in this system (see Fig. 7 and 8 for a quantitative treatment). In the experiment shown, fusion was initiated by adding SupT1/CCR5/BlaM target cells to CCF2-loaded HeLa cells expressing gp120/gp41 from the Sf162 strain and incubating at 37°C. At the time intervals specified in Fig. 4, the culture was removed from the incubator and photographed to assess the extent of cell-cell fusion. Individual blue cells were first observed after a lag time of ∼15 min (not shown). Thereafter, the number of individual blue cells increased, eventually giving rise to large blue syncytia as heterokaryons fused with neighboring HeLa cells. After 2 h, no additional blue cells were observed. Cell-cell fusion in this setting thus occurs rapidly, providing a method to assess gp120/gp41 function over a period of minutes to hours. Analysis of images of the same microscopic field collected every 2 min indicates that the lag time between membrane fusion and the appearance of blue color is approximately 6 min (data not shown), much shorter than the time required for all of the cells to reach maximal fusion.
FIG. 4.
Qualitative view of cell-cell fusion kinetics. CCF2-loaded HeLa cells expressing gp120/gp41 from the Sf162 HIV strain were incubated at 37°C with SupT1/CCR5/BlaM clone C6. Digital microscopic images of cells under epifluorescence were recorded at the times indicated.
FIG. 7.
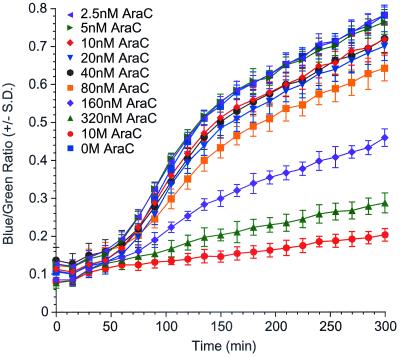
Expression level of HXB2 gp160 influences fusion extent but not kinetics. HeLa cells infected with SF162 gp160-expressing vaccinia virus were cultured in the presence of various concentrations of cytosine arabinoside and analyzed for kinetics of cell-cell fusion.
FIG. 8.
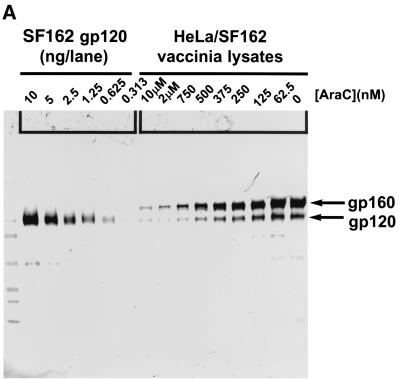
The expression level of Sf162 gp160 influences fusion extent but not kinetics. HeLa cells infected with SF162 gp160-expressing vaccinia virus were cultured in the presence of various concentrations of cytosine arabinoside and analyzed for protein expression and fusion kinetics. (A) Western blot detection of HIV gp120 and gp160. (B) Densitometric quantification of gp120 in cell lysates. The Western blot shown in part A was scanned and the band intensities were quantified as described in Materials and Methods. The inset shows a quadratic fit of the standard curve used to calculate protein weights of unknowns. (C) Kinetics of cell-cell fusion for SF162 gp120/gp41-expressing HeLa cell cultures over 6 h. Each AraC concentration was tested in eight replicate wells. The blue/green fluorescence ratio was determined independently for each well, and then the mean and standard error of replicate wells were determined for each point. (D) Correlation between gp120 expression (x axis, data from Fig. 6B) and the extent of fusion (y axis, blue/green ratio, data from Fig. 6C) at three time points.
Fluorometric quantification of cell-cell fusion.
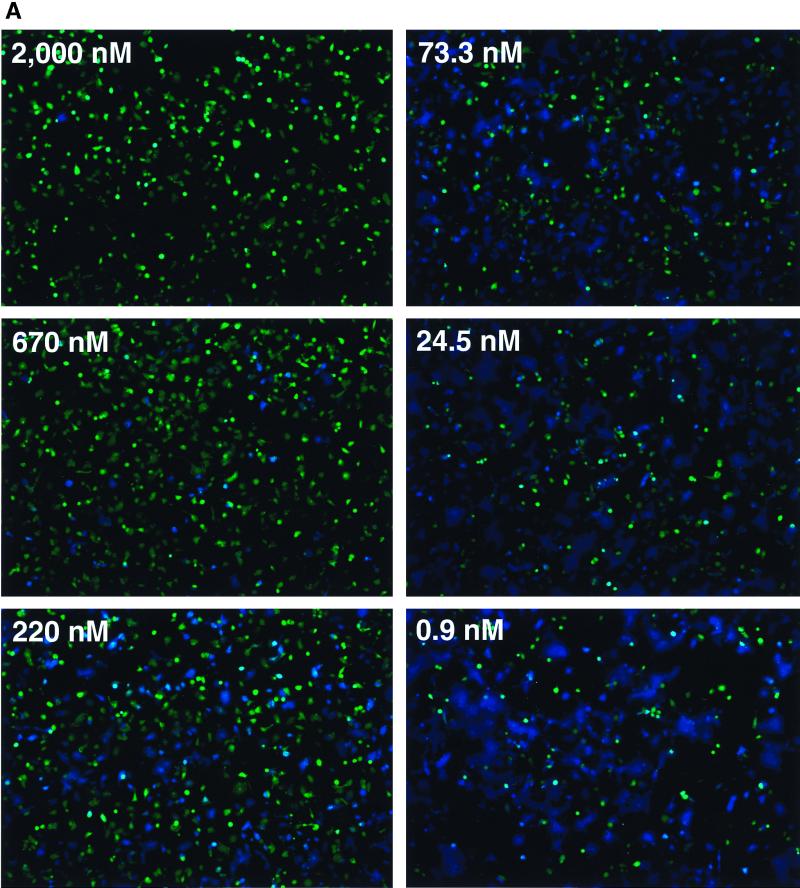
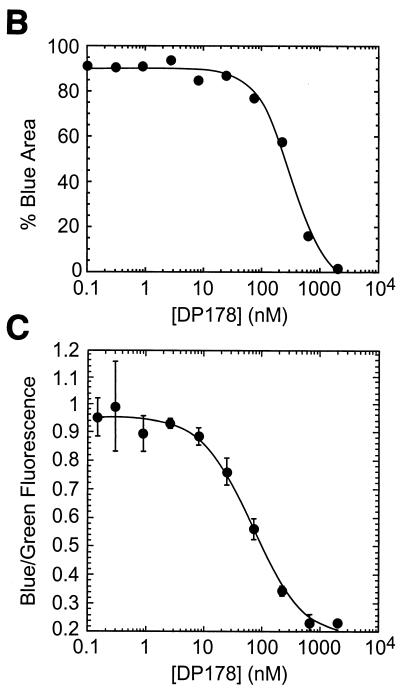
The results reported above show that this assay can be used to assess cell-cell fusion qualitatively. In this section, we show that fusion is readily quantifiable using a fluorometric plate reader with excitation and emissions filters designed to measure green and blue CCF2 fluorescence. To demonstrate this, we performed a fusion experiment in which an array of wells containing Sf162 strain gp120/gp41-expressing HeLa cells and SupT1/CCR5/BlaM cells included different concentrations of the specific entry inhibitor DP-178 (33). After incubating for 2 h at 37°C, the cultures were analyzed by fluorescence microscopy (Fig. 5A) and by fluorometry (Fig. 5C). Though panel A shows only six representative images, we captured images from each well and used digital image analysis to quantify fusion (Fig. 5B). Note that due to the formation of syncytia, simply counting the number of cells that turned blue was an unreliable measure and hence the area of blue in each field was utilized. While this method is more sensitive than a plate reader for detecting small numbers of blue cells, it appears to saturate more easily at higher areas of blue (near 95%). With these caveats, the IC50 of DP-178 for blocking cell-cell fusion, calculated using these data, was 316 nM.
FIG. 5.
The extent of fusion can be measured accurately using a microplate fluorometer. CCF2-loaded HeLa cells expressing gp120/gp41 from the Sf162 HIV strain were incubated at 37°C with SupT1/CCR5/BlaM clone C6 in the presence of various concentrations of peptide DP-178. Each inhibitor concentration was tested in quadruplicate. After 2 h of incubation, the extent of fusion was assessed by image analysis and by measurement of green and blue fluorescence in a microplate fluorometer. (A) Images of wells incubated in indicated concentrations of DP-178. Six representative images are shown; four images were collected for every concentration of DP-178 tested. (B) Results of digital image analysis. The extent of fusion for each condition was assessed by measuring the percent of maximal blue pixels in each image (see Materials and Methods). (C) Results of fluorometry. Here, the extent of fusion is given by the ratio of blue to green fluorescence, with each point plotted as the mean ± 1 standard deviation. The IC50s for both B and C were determined by nonlinear curve fitting using a four-parameter logistic equation as described in Materials and Methods.
Data obtained from a fluorometric plate reader for DP-178 inhibition were analyzed either as total blue fluorescence (data not shown) or as the ratio of blue to green fluorescence; the latter method has the advantage of factoring out well-to-well variations in cell number and CCF2 loading efficiency (38). Both computational methods yielded similar results, with calculated IC50s for DP-178 of 65 nM (blue/green fluorescence ratio; Fig. 5C) and 79 nM (blue fluorescence only, data not shown), a difference of less than 20%. These calculated IC50s are four- to fivefold lower than those measured by digital image analysis (Fig. 5B). Comparisons of the curves to each other and to the micrographs indicate that the fluorometer is less sensitive than image analysis for detecting small numbers of blue cells and more sensitive as the number of blue cells approaches saturation, so the two detection methods yield somewhat different results. Nevertheless, the fluorometric measurements in this assay largely reflect the extent of cell-cell fusion as visualized in the fluorescence microscope.
With this validation in place, we analyzed the activity of a number of inhibitors that block various steps in the HIV entry process (data not shown). All entry inhibitors we have tested blocked cell-cell fusion in this assay. However, the IC50s of inhibitors for blocking the cell-cell fusion assay were typically 5- to 10-fold higher than their IC50s for blocking virus infectivity assays. This discrepancy may reflect the highly multivalent nature of cell-cell interactions and the influence of gravity in forcing the two cell populations together.
Quantitative analysis of cell-cell fusion kinetics.
The assay just described can be used to quantitatively analyze the kinetics of cell-cell fusion simply by maintaining cells at 37°C in the fluorometer chamber and measuring blue and green fluorescence intensity at regular intervals over the course of several hours. In the following sections, we have used this analytical mode to explore the relationship between gp160 expression levels and cell-cell fusion kinetics.
gp120/gp41 cell surface density affects extent of cell-cell fusion but not kinetics.
To date, no information has been reported addressing the relationship of gp120/gp41 expression level with fusogenic potential. Using recombinant vaccinia viruses to express gp120/gp41 gave us an opportunity to examine this relationship because transcriptional activity of the hybrid early-late vaccinia virus promoter driving gp160 can be regulated using cytosine arabinoside (AraC) (6). The inclusion of AraC during the overnight infection of HeLa cells with recombinant vaccinia virus caused a dose-dependent decrease in gp120 surface expression, as shown by two methods. HeLa cells infected with recombinant vaccinia virus expressing HXB2 gp160 and grown in various concentrations of AraC were analyzed using a cell surface protein biotinylation-immunoprecipitation approach (Fig. 6A) and by immunofluorescence staining with an anti-gp120 antibody (Fig. 6B). Figure 6A shows that AraC treatment caused a dose-dependent decrease in the overall surface expression of a 120-kDa protein immunoreactive with HIV immunoglobulin, suggesting that gp120 surface expression in the population is lower. This observation is extended in Fig. 6B, which shows that treatment with AraC reduced the cell-surface staining by a phycoerythrin-conjugated monoclonal antibody recognizing gp120. Untreated cells showed heterogeneous staining that reflects a distribution of expression levels, as expected. Even those cells expressing lower levels are apparently capable of participating in cell-cell fusion, as most of the cells in untreated cultures turned blue in the fusion assay (e.g., Fig. 3, top). Cells treated with 240 nM AraC similarly showed heterogeneous staining. However, most of the cells still reacted with the monoclonal antibody, but with generally lower levels than in untreated cells. This pattern is consistent with a general reduction of the expression level among most cells in the population and rules out the possibility that AraC treatment caused some cells to stop expressing gp120 altogether while having no effect on other cells in the population. We have observed a similar staining pattern with this antibody on cells expressing Sf162 gp120/gp41 from strain Sf162 (data not shown).
The functional consequences of reducing cell-surface expression levels of HXB2 gp120/gp41 were examined by monitoring the kinetics of cell-cell fusion in each population by reading blue and green fluorescence at 15-min intervals (Fig. 7). Cells not treated with AraC showed a lag time of about 1 h prior to the onset of fusion, after which they displayed a steady increase in blue fluorescence until reaching a plateau at about 150 min. Cells treated with a maximal dose of 10 μM AraC showed a slow, monotonic increase in blue fluorescence over the 6-h observation period. This slow increase in blue fluorescence is not due to cell-cell fusion, as no blue HeLa cells were visible by fluorescence microscopy even late in the time course (data not shown). Rather, this background fluorescence likely results from the slow uptake of small amounts of residual CCF2-AM into SupT1/BlaM cells, as evidenced by the microscopic appearance of small round cells displaying dim blue fluorescence (data not shown).
Cells treated with intermediate levels of AraC displayed fusion profiles that were qualitatively similar to one another and to untreated cells in that the duration of the lag phase, the time to half-maximal fusion, and the time to maximal fusion varied only slightly. Rather, these curves were distinguished from each other by reaching different maximal fusion (plateau) levels. After reaching the plateau, each group showed a slow, time-dependent increase in blue fluorescence, the slope of which was similar to that observed for background (no fusion) wells. AraC did not affect cell-cell fusion in control experiments in which gp120/gp41 was expressed by transfection instead of infection with vaccinia virus recombinants (data not shown), indicating that the compound does not block cell-cell fusion per se.
We extended our analysis of the relationship between gp120/gp41 expression and cell-cell fusion kinetics to include gp120/gp41 from HIV strain Sf162 (Fig. 8). HeLa cells were infected overnight with recombinant vaccinia virus encoding Sf162 gp160 in the presence of various concentrations of AraC and then were analyzed for both gp120/gp41 protein expression and cell-cell fusion kinetics. In this experiment, we used a Western blotting method to obtain a semiquantitative measurement of total gp120 expression in the cell populations (Fig. 8A). Densitometric quantification of the amount of gp120 in each lysate revealed that the dose relationship was linear between AraC concentrations of 63 and 750 nM (Fig. 8B).
Figure 8C shows the kinetics of cell-cell fusion in the populations of gp120/gp41-expressing HeLa cells treated with various concentrations of AraC. In this experiment, we included in one set of cultures a maximally inhibitory dose of DP-178 to prevent fusion completely. Untreated cells displayed a lag time of ∼20 min before the onset of fusion (increase in blue/green ratio), after which fusion continued rapidly until reaching a plateau at about 90 min. By contrast, wells receiving 2.5 μM DP-178 displayed a low-level monotonic increase in blue/green fluorescence over time. As with the previous experiment, this increase in blue fluorescence was not due to cell-cell fusion because no blue HeLa cells were visible in these wells (data not shown).
The fusion profiles of HeLa cells treated with different AraC concentrations were distributed between those of untreated cells and those of DP-178-treated cells. The fusion profile of cells treated with 10 μM AraC was indistinguishable from that of cells treated with DP-178, indicating that these cells failed to fuse, while the profile of cells treated with 62.5 nM AraC overlapped that of untreated cells. As was observed in Fig. 7, fusion profiles of cells treated with intermediate doses of AraC differed only in the plateau level, or extent of fusion. The lag time prior to fusion, the time to half-maximal fusion, and the time to plateau did not differ significantly among these cultures.
These observations are consistent with the idea that the extent of fusion is proportional to the expression levels of gp120/gp41 on the HeLa cells. We tested this idea by plotting the extent of fusion (blue/green ratio at a given time in Fig. 8C) for each condition as a function of the gp120 expression level as determined in Fig. 8B. For this analysis, we selected data for cells treated with concentrations of AraC yielding gp120 values in the linear part of the dose-response curve (Fig. 8A and B) and analyzed data at three different time points: t = 45 min (steepest part of the curve), t = 60 min (nearing maximal fusion), and t = 90 min (plateau). Strikingly, we observed a strong correlation between fusion extent (blue/green fluorescence ratio) and gp120 expression at each time point (Fig. 8D). Thus, reducing gp160 expression levels reduced the overall extent of fusion without changing fusion kinetics.
DISCUSSION
A new tool to study HIV gp120/gp41-mediated membrane fusion.
The most physiologically relevant way to study HIV entry would be to monitor membrane fusion of single HIV virions and target cells. Since at present it is only possible to do this with time-consuming sophisticated microscopic analysis on small numbers of samples, many investigators have turned to cell-cell fusion assays as a way to study early events in HIV entry. Previously described quantitative cell-cell fusion assays to measure gp120/gp41 function typically require counting syncytia or measuring the abundance of a fusion-dependent reporter gene product (4, 21). Both of these readouts are quite distal from the actual event of membrane fusion and so are unsuitable for monitoring cell-cell fusion in real time. Other assays based on dye redistribution are capable of measuring fusion in real time but generally require counting or image analysis to enumerate fusion events (9, 12, 20, 23, 31); one exception is an assay based on resonance energy transfer between two different fluorescent lipids (19).
We describe here a new cell-cell fusion assay that provides a significant advantage over the other assays in that cell-cell fusion can be monitored in nearly real-time using a fluorometric plate reader, which allows very high throughput relative to methods requiring image analysis. We have used this assay to study HIV gp120/gp41-driven fusion as a function of gp120/gp41 expression levels.
Interpreting cell-cell fusion kinetic profiles.
We have demonstrated that in our cell-cell fusion assay the blue fluorescence signal (or blue/green fluorescence ratio) in a well is proportional to the number of cells fused in that well (Fig. 5). The kinetic profiles shown in Fig. 7 and 8C can therefore be understood to represent the number of cells fusing over time. A rising line indicates ongoing fusion, a flat line indicates no ongoing fusion. In all cases, we observed a sigmoidal curve consisting of a lag phase followed by a period of rapid cell-cell fusion and then a plateau. This pattern suggests that, within the time frame of the assay, we observe a single relatively synchronous round of cell-cell fusion. In our experience, the background-subtracted plateau level in these cultures, even those displaying a low plateau, does not change even after >4 h additional incubation (data not shown). Therefore, the magnitude of the plateau presumably reflects the final level of fusion achievable in a given condition.
gp120/gp41 expression levels dictate fusion efficiency but not fusion kinetics.
A widely accepted model for gp120/gp41-driven membrane fusion (2, 34) holds that at least three kinetically distinct events must transpire before the onset of fusion: (i) gp120 binding to CD4 triggers a conformational change in gp120, (ii) gp120 binding to coreceptor triggers gp41 function, and (iii) a complex conformational transition in gp41 somehow fuses two distinct lipid bilayers together. We expected that the rate of the first two steps would depend, in part, on the abundance of the participating components. Thus, we predicted that changes in surface density of gp120/gp41 would translate into altered fusion kinetics, e.g., a change in the lag time prior to the onset of fusion.
Surprisingly, we found that changes in expression of gp120/gp41 had a negligible effect on the lag time and only a small effect on the time to reach half-maximal fusion. Such expression changes did, however, determine the extent, or plateau level, of fusion. Therefore in cultures with reduced gp120/gp41 expression, a smaller number of cells ultimately fused, but the cells that fused did so at the same rate as their higher-expressing counterparts. These observations indicate that gp120/gp41 abundance is not rate limiting per se. Rather, the abundance of gp120/gp41 determines whether fusion can or cannot occur.
This relationship between expression level and fusion extent, with no obvious difference in kinetics, was observed for two envelope glycoproteins from different viral strains (HXB2 and Sf162) using different coreceptors, indicating that coreceptor choice alone is not responsible for the effect. However, we did observe a significant difference between fusion kinetics driven by the two gp120/gp41 forms: Sf162-driven fusion consistently displayed a much shorter lag time than HXB2-driven fusion (compare Fig. 7 and 8C). The reason for the difference is not clear.
Implications for models of gp120/gp41 function.
Our findings are consistent with the view that a certain threshold of gp120/gp41 expression is required to permit fusion. This conclusion is reminiscent of the threshold model of CCR5 function in HIV infectivity proposed by Kabat and coworkers (14, 24). They found that in the context of a fixed cellular CD4 level and gp120/gp41 density (on a population of virions), a threshold level of CCR5 expression is required to permit HIV infectivity. Further, they showed that low expression of one target cell component (e.g., CD4) can be compensated by overexpression of another (e.g., CCR5) (24). A number of studies support the idea that the extent of gp120/gp41:CD4:CoR complex formation is correlated with fusogenicity (10, 13, 18, 35, 36). The identification of preexisting complexes of CD4 and CCR5 indicates that in some cases gp120 need not be present to bring CD4 and coreceptor together (37), though in other cases gp120 participation does seem to be necessary (15). Collectively, these observations are consistent with a model in which complexes of CD4 and coreceptor (with or without the participation of gp120) form by mass action (24). Our findings indicate that the abundance of gp120/gp41 on the cell surface represents a third variable in the mass action equation.
Precisely defining the number of gp120/gp41:CD4:CoR complexes required to initiate membrane fusion is an essential but difficult goal. In addition to manipulating the absolute expression levels of individual components, it should also be possible to modulate the availability of individual components pharmacologically, e.g., by titrating in CCR5 inhibitors. By simultaneously measuring fusion kinetics, CCR5 receptor inhibitor occupancy, and surface expression levels of CD4 and gp120/gp41 (e.g., by quantitative immunofluorescence analysis), it may be possible to extend and strengthen the kind of mathematical relationships between CCR5 expression and fusion pioneered by Kabat and coworkers.
Acknowledgments
We thank Kathleen Sullivan and Lyndon Mitnaul for sharing information on cell-cell fusion, members of the Biological Chemistry Department for providing helpful suggestions during the course of this work, and Jeff Campbell and Carey Hauer for help with graphics.
REFERENCES
- 1.Bleul, C. C., M. Farzan, H. Choe, C. Parolin, I. Clark-Lewis, J. Sodroski, and T. A. Springer. 1996. The lymphocyte chemoattractant SDF-1 is a ligand for LESTR/fusin and blocks HIV-1 entry. Nature 382:829-833. [DOI] [PubMed] [Google Scholar]
- 2.Chan, D. C., and P. S. Kim. 1998. HIV entry and its inhibition. Cell 93:681-684. [DOI] [PubMed] [Google Scholar]
- 3.Cheng-Mayer, C., M. Quiroga, J. W. Tung, D. Dina, and J. A. Levy. 1990. Viral determinants of human immunodeficiency virus type 1 T-cell or macrophage tropism, cytopathogenicity, and CD4 antigen modulation. J. Virol. 64:4390-4398. [DOI] [PMC free article] [PubMed] [Google Scholar]
- 4.Ciminale, V., B. K. Felber, M. Campbell, and G. N. Pavlakis. 1990. A bioassay for HIV-1 based on Env-CD4 interaction. AIDS Res. Hum. Retrovir. 6:1281-1287. [DOI] [PubMed] [Google Scholar]
- 5.Clague, M. J., C. Schoch, and R. Blumenthal. 1991. Delay time for influenza virus hemagglutinin-induced membrane fusion depends on hemagglutinin surface density. J. Virol. 65:2402-2407. [DOI] [PMC free article] [PubMed] [Google Scholar]
- 6.Colby, C., C. Jurale, and J. R. Kates. 1971. Mechanism of synthesis of vaccinia virus double-stranded ribonucleic acid in vivo and in vitro. J. Virol. 7:71-76. [DOI] [PMC free article] [PubMed] [Google Scholar]
- 7.Cooper, N., P. L. Earl, O. Elroy-Stein, and B. Moss. 1994. Expression of proteins in mammalian cells using vaccinia viral vectors, p. 16.15.1-16.19.9. In F. M. Ausubel, R. Brent, R. E. Kingston, D. D. Moore, J. G. Seidman, J. A. Smith, and K. Struhl (ed.), Current protocols in molecular biology, vol. 2. John Wiley & Sons, New York, N.Y. [Google Scholar]
- 8.Danieli, T., S. L. Pelletier, Y. I. Henis, and J. M. White. 1996. Membrane fusion mediated by the influenza virus hemagglutinin requires the concerted action of at least three hemagglutinin trimers. J. Cell Biol. 133:559-569. [DOI] [PMC free article] [PubMed] [Google Scholar]
- 9.Dimitrov, D. S., H. Golding, and R. Blumenthal. 1991. Initial stages of HIV-1 envelope glycoprotein-mediated cell fusion monitored by a new assay based on redistribution of fluorescent dyes. AIDS Res. Hum. Retrovir. 7:799-805. [DOI] [PubMed] [Google Scholar]
- 10.Dimitrov, D. S., D. Norwood, T. S. Stantchev, Y. Feng, X. Xiao, and C. C. Broder. 1999. A mechanism of resistance to HIV-1 entry: inefficient interactions of CXCR4 with CD4 and gp120 in macrophages. Virology 259:1-6. [DOI] [PubMed] [Google Scholar]
- 11.Feng, Y., C. C. Broder, P. E. Kennedy, and E. A. Berger. 1996. HIV-1 entry cofactor: functional cDNA cloning of a seven-transmembrane, G protein-coupled receptor. Science 272:872-877. [DOI] [PubMed] [Google Scholar]
- 12.Frey, S., M. Marsh, S. Gunther, A. Pelchen-Matthews, P. Stephens, S. Ortlepp, and T. Stegmann. 1995. Temperature dependence of cell-cell fusion induced by the envelope glycoprotein of human immunodeficiency virus type 1. J. Virol. 69:1462-1472. [DOI] [PMC free article] [PubMed] [Google Scholar]
- 13.Golding, H., J. Ouyang, M. Zaitseva, C. C. Broder, D. S. Dimitrov, and C. Lapham. 1999. Increased association of glycoprotein 120-CD4 with HIV type 1 coreceptors in the presence of complex-enhanced anti-CD4 monoclonal antibodies. AIDS Res. Hum. Retrovir. 15:149-159. [DOI] [PubMed] [Google Scholar]
- 14.Kuhmann, S. E., E. J. Platt, S. L. Kozak, and D. Kabat. 2000. Cooperation of multiple CCR5 coreceptors is required for infections by human immunodeficiency virus type 1. J. Virol. 74:7005-7015. [DOI] [PMC free article] [PubMed] [Google Scholar]
- 15.Lapham, C. K., J. Ouyang, B. Chandrasekhar, N. Y. Nguyen, D. S. Dimitrov, and H. Golding. 1996. Evidence for cell-surface association between fusin and the CD4-gp120 complex in human cell lines. Science 274:602-605. [DOI] [PubMed] [Google Scholar]
- 16.Lee, B., M. Sharron, C. Blanpain, B. J. Doranz, J. Vakili, P. Setoh, E. Berg, G. Liu, H. R. Guy, S. R. Durell, M. Parmentier, C. N. Chang, K. Price, M. Tsang, and R. W. Doms. 1999. Epitope mapping of CCR5 reveals multiple conformational states and distinct but overlapping structures involved in chemokine and coreceptor function. J. Biol. Chem. 274:9617-9626. [DOI] [PubMed] [Google Scholar]
- 17.Lee, S., C. K. Lapham, H. Chen, L. King, J. Manischewitz, T. Romantseva, H. Mostowski, T. S. Stantchev, C. C. Broder, and H. Golding. 2000. Coreceptor competition for association with CD4 may change the susceptibility of human cells to infection with T-tropic and macrophagetropic isolates of human immunodeficiency virus type 1. J. Virol. 74:5016-5023. [DOI] [PMC free article] [PubMed] [Google Scholar]
- 18.Lee, S., K. Peden, D. S. Dimitrov, C. C. Broder, J. Manischewitz, G. Denisova, J. M. Gershoni, and H. Golding. 1997. Enhancement of human immunodeficiency virus type 1 envelope-mediated fusion by a CD4-gp120 complex-specific monoclonal antibody. J. Virol. 71:6037-6043. [DOI] [PMC free article] [PubMed] [Google Scholar]
- 19.Litwin, V., K. A. Nagashima, A. M. Ryder, C. H. Chang, J. M. Carver, W. C. Olson, M. Alizon, K. W. Hasel, P. J. Maddon, and G. P. Allaway. 1996. Human immunodeficiency virus type 1 membrane fusion mediated by a laboratory-adapted strain and a primary isolate analyzed by resonance energy transfer. J. Virol. 70:6437-6441. [DOI] [PMC free article] [PubMed] [Google Scholar]
- 20.Munoz-Barroso, I., S. Durell, K. Sakaguchi, E. Appella, and R. Blumenthal. 1998. Dilation of the human immunodeficiency virus-1 envelope glycoprotein fusion pore revealed by the inhibitory action of a synthetic peptide from gp41. J. Cell Biol. 140:315-323. [DOI] [PMC free article] [PubMed] [Google Scholar]
- 21.Nussbaum, O., C. C. Broder, and E. A. Berger. 1994. Fusogenic mechanisms of enveloped-virus glycoproteins analyzed by a novel recombinant vaccinia virus-based assay quantitating cell fusion-dependent reporter gene activation. J. Virol. 68:5411-5422. [DOI] [PMC free article] [PubMed] [Google Scholar]
- 22.Oberlin, E., A. Amara, F. Bachelerie, C. Bessia, J. L. Virelizier, F. Arenzana-Seisdedos, O. Schwartz, J. M. Heard, I. Clark-Lewis, D. F. Legler, M. Loetscher, M. Baggiolini, and B. Moser. 1996. The CXC chemokine SDF-1 is the ligand for LESTR/fusin and prevents infection by T-cell-line-adapted HIV-1. Nature 382:833-835. (Erratum, 384:288, 1996.) [DOI] [PubMed] [Google Scholar]
- 23.Pine, P. S., J. L. Weaver, T. Oravecz, M. Pall, M. Ussery, and A. Aszalos. 1998. A semiautomated fluorescence-based cell-to-cell fusion assay for gp120-gp41 and CD4 expressing cells. Exp. Cell Res. 240:49-57. [DOI] [PubMed] [Google Scholar]
- 24.Platt, E. J., K. Wehrly, S. E. Kuhmann, B. Chesebro, and D. Kabat. 1998. Effects of CCR5 and CD4 cell surface concentrations on infections by macrophagetropic isolates of human immunodeficiency virus type 1. J. Virol. 72:2855-2864. [DOI] [PMC free article] [PubMed] [Google Scholar]
- 25.Ratner, L., A. Fisher, L. L. Jagodzinski, H. Mitsuya, R. S. Liou, R. C. Gallo, and F. Wong-Staal. 1987. Complete nucleotide sequences of functional clones of the AIDS virus. AIDS Res. Hum. Retrovir. 3:57-69. [DOI] [PubMed] [Google Scholar]
- 26.Siciliano, S. J., S. E. Kuhmann, Y. Weng, N. Madani, M. S. Springer, J. E. Lineberger, R. Danzeisen, M. D. Miller, M. P. Kavanaugh, J. A. DeMartino, and D. Kabat. 1999. A critical site in the core of the CCR5 chemokine receptor required for binding and infectivity of human immunodeficiency virus type 1. J. Biol. Chem. 274:1905-1913. [DOI] [PubMed] [Google Scholar]
- 27.Simmons, G., P. R. Clapham, L. Picard, R. E. Offord, M. M. Rosenkilde, T. W. Schwartz, R. Buser, T. N. C. Wells, and A. E. Proudfoot. 1997. Potent inhibition of HIV-1 infectivity in macrophages and lymphocytes by a novel CCR5 antagonist. Science 276:276-279. [DOI] [PubMed] [Google Scholar]
- 28.Simmons, G., D. Wilkinson, J. D. Reeves, M. T. Dittmar, S. Beddows, J. Weber, G. Carnegie, U. Desselberger, P. W. Gray, R. A. Weiss, and P. R. Clapham. 1996. Primary, syncytium-inducing human immunodeficiency virus type 1 isolates are dual-tropic and most can use either Lestr or CCR5 as coreceptors for virus entry. J. Virol. 70:8355-8360. [DOI] [PMC free article] [PubMed] [Google Scholar]
- 29.Smith, S. D., M. Shatsky, P. S. Cohen, R. Warnke, M. P. Link, and B. E. Glader. 1984. Monoclonal antibody and enzymatic profiles of human malignant T-lymphoid cells and derived cell lines. Cancer Res. 44:5657-5660. [PubMed] [Google Scholar]
- 30.Vila-Coro, A. J., M. Mellado, A. Martin de Ana, P. Lucas, G. del Real, A. C. Martinez, and J. M. Rodriguez-Frade. 2000. HIV-1 infection through the CCR5 receptor is blocked by receptor dimerization. Proc. Natl. Acad. Sci. USA 97:3388-3393. [DOI] [PMC free article] [PubMed] [Google Scholar]
- 31.Weiss, C. D., S. W. Barnett, N. Cacalano, N. Killeen, D. R. Littman, and J. M. White. 1996. Studies of HIV-1 envelope glycoprotein-mediated fusion using a simple fluorescence assay. AIDS 10:241-246. [DOI] [PubMed] [Google Scholar]
- 32.Whitney, M., E. Rockenstein, G. Cantin, T. Knapp, G. Zlokarnik, P. Sanders, K. Durick, F. F. Craig, and P. A. Negulescu. 1998. A genome-wide functional assay of signal transduction in living mammalian cells. Nat. Biotechnol. 16:1329-1333. [DOI] [PubMed] [Google Scholar]
- 33.Wild, C. T., D. C. Shugars, T. K. Greenwell, C. B. McDanal, and T. J. Matthews. 1994. Peptides corresponding to a predictive alpha-helical domain of human immunodeficiency virus type 1 gp41 are potent inhibitors of virus infection. Proc. Natl. Acad. Sci. USA 91:9770-9774. [DOI] [PMC free article] [PubMed] [Google Scholar]
- 34.Wyatt, R., and J. Sodroski. 1998. The HIV-1 envelope glycoproteins: fusogens, antigens, and immunogens. Science 280:1884-1888. [DOI] [PubMed] [Google Scholar]
- 35.Xiao, X., A. Kinter, C. C. Broder, and D. S. Dimitrov. 2000. Interactions of CCR5 and CXCR4 with CD4 and gp120 in human blood monocyte-derived dendritic cells. Exp. Mol. Pathol. 68:133-138. [DOI] [PubMed] [Google Scholar]
- 36.Xiao, X., D. Norwood, Y. R. Feng, M. Moriuchi, A. Jones-Trower, T. S. Stantchev, H. Moriuchi, C. C. Broder, and D. S. Dimitrov. 2000. Inefficient formation of a complex among CXCR4, CD4 and gp120 in U937 clones resistant to X4 gp120-gp41-mediated fusion. Exp. Mol. Pathol. 68:139-146. [DOI] [PubMed] [Google Scholar]
- 37.Xiao, X., L. Wu, T. S. Stantchev, Y. R. Feng, S. Ugolini, H. Chen, Z. Shen, J. L. Riley, C. C. Broder, Q. J. Sattentau, and D. S. Dimitrov. 1999. Constitutive cell surface association between CD4 and CCR5. Proc. Natl. Acad. Sci. USA 96:7496-7501. [DOI] [PMC free article] [PubMed] [Google Scholar]
- 38.Zlokarnik, G., P. A. Negulescu, T. E. Knapp, L. Mere, N. Burres, L. Feng, M. Whitney, K. Roemer, and R. Y. Tsien. 1998. Quantitation of transcription and clonal selection of single living cells with beta-lactamase as reporter. Science 279:84-88. [DOI] [PubMed] [Google Scholar]


