

Abstract
Leukocyte rolling on the endothelium via selectin molecules is an important step in the adhesion cascade, which allows leukocytes in the bloodstream to reach sites of infection. We improve upon Adhesive Dynamics simulations by incorporating deformable microvilli on which adhesion molecules are clustered. As determined in micropipette experiments, microvilli deform like an elastic spring at small forces and a combination of yield and viscous dissipation at high forces. First, we create a modified version of the state diagram for adhesion which includes microvillus deformation, and find four adhesion states—firmly bound; landing; rolling; and no-adhesion. Then, we simulate the effects of receptor clustering on the tips of microvilli, number of adhesion molecules on the cell, and the spring constant of the bonds, within the context of deformable microvilli. We also explore how the microvillus rheology itself controls the dynamics of adhesion. A minimum in rolling velocity occurs at an intermediate value of the microvillus membrane viscosity, remarkably close to the reported physiological value, suggesting that the mechanics of microvilli have evolved ideally for rolling and adhesion of leukocytes. We find that a larger degree of association between the membrane and cytoskeleton leads to slower rolling, and stiffer microvilli result in faster rolling. Decreasing the overall deformability of the microvilli greatly reduces a simulated cell's ability to roll. A comparison to experimental results of in vitro cell rolling agrees with the simulation at low shear rates. Furthermore, simulated rolling trajectories of cells with deformable microvilli display periods of rolling interdispersed with pauses, consistent with that seen in experiments where microvilli were observed to stretch.
INTRODUCTION
Cell adhesion in the vasculature is important in many biological processes from neutrophil recruitment to sites of inflammation (1,2) to cancer metastasis (3). In these processes and others, cells are first captured from the bloodstream to the blood vessel wall by molecular interactions. This initial tethering is followed by rolling on the endothelial cells of the vessel and then firm adhesion, allowing cells to migrate to their intended location in the tissue (1,4,5). In neutrophils, the rolling is mediated largely by selectins, and firm adhesion is mediated by integrins. We are interested in the mechanisms leukocytes use to tether and roll via selectins on the vascular wall.
To identify the important molecular parameters of cell rolling, our lab has developed a computational tool called Adhesive Dynamics (6). In Adhesive Dynamics, bonds stochastically form and break according to probabilities determined by the forward and reverse reaction rates of the bonding molecules. A variety of rate laws are available to characterize the coupling of force and dissociation. A force balance is required to determine the net motion of the particle and molecular positions are updated from the particle kinematics. Thus, Adhesive Dynamics is an ideal method to couple mechanical and chemical effects in adhesion.
In the original version of Adhesive Dynamics, the cell was idealized as a hard sphere with rigid microvilli (6). With the advent of cell-free rolling, in which rolling can be recreated with molecules attached to hard spheres, many of the recent versions of Adhesive Dynamics have simulated rolling with molecularly-coated hard spheres (7–12). For example, Adhesive Dynamics has successfully been used to map out a state diagram for a hard sphere model of the cell with adhesion molecules randomly distributed about its surface, linking different dynamics of adhesion to mechanochemical properties of the adhesion molecules. It was determined that experimentally measured values of the mechanochemical properties of selectins self-consistently fell within the rolling regime of the state diagram (9). Furthermore, Adhesive Dynamics with rigid spheres could simulate the transition from rolling to firm adhesion by including both selectins and integrins, which mediate firm adhesion, on the model cell surface (7).
Although these versions of Adhesive Dynamics have been adequate to recreate cell-free rolling, it has been a limitation that the deformation of microvilli has been omitted, specifically for simulating leukocyte motion. Microvilli have several important effects on adhesion. First, they promote molecular presentation because they are long and protrude from the cell surface. Immunogold-labeling has shown that L-selectin and P-selectin glycoprotein ligand-1 (PSGL-1), which mediate the initial tethering and rolling in an adhesion event, are predominantly clustered on the microvilli tips to facilitate adhesive contact with the surface (13,14).
Secondly, the microvilli are known to stretch and tether under force, as observed (15,16) and measured by Shao and co-workers. They studied the deformation of microvilli under force by micropipette aspiration techniques and developed equations to describe the rheology of microvilli under a given force. They found that a microvillus can exist in two distinct regimes. First, under small pulling forces, microvilli stretch as Hookean springs as the axial actin within the protrusions stretches. Beyond a threshold level of force, the cell membrane pulls away from the cytoskeleton allowing the microvilli to form long cylindrical membrane tethers with viscous properties. The deformation of the microvilli can be quite substantial, easily on the order of cell diameters, as differential interference contrast videomicroscopy has shown in tethering experiments of neutrophils on P-selectin-coated glass (17). A long lever arm made possible by a stretched microvillus allows a greater component of the bond force to resist shear flow (see Fig. 2). This means a smaller total bond force is required to maintain adhesion, and that bonds can last longer. Thus, microvillus deformation may play a considerable role in controlling the dynamics of adhesion, as anticipated, but not fully investigated, by Shao and co-workers (15) using static mechanical energy balances.
FIGURE 2.
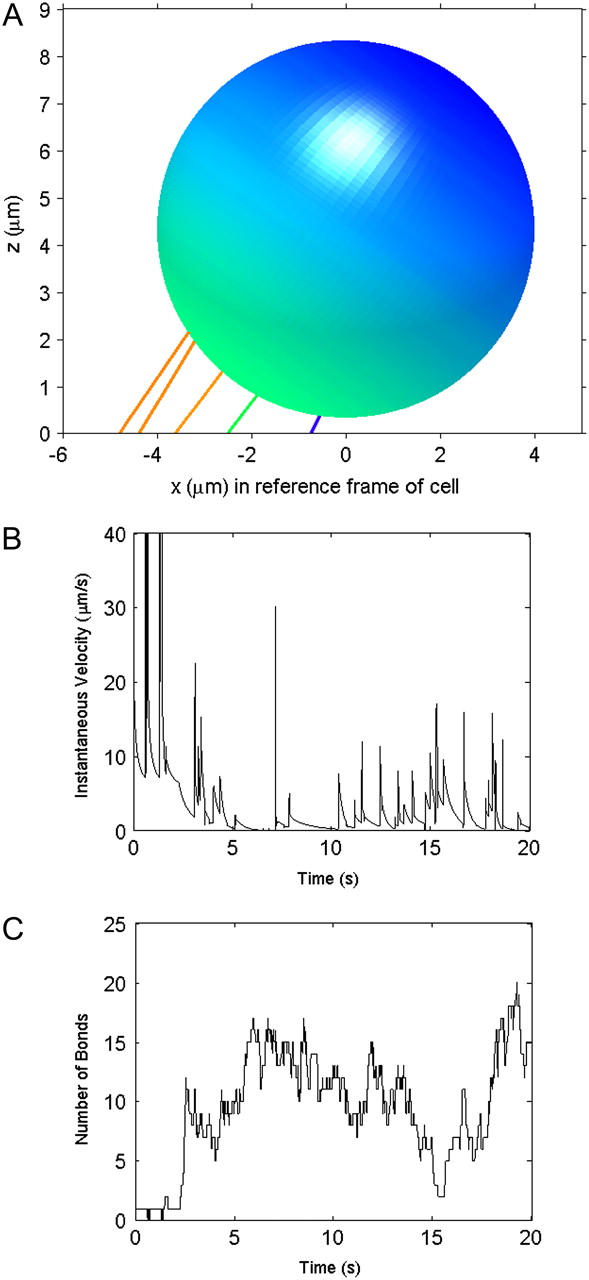
Representative rolling cell. (A) Snapshot of a rolling cell during a simulation. The colored lines stand for microvilli and bonds that are bound to the surface, with the color corresponding to the level of force on the microvillus. From red to blue, the force goes from >55 pN to 0 pN. (B) The instantaneous velocity during the entire 20-s simulation. (C) The total number of bonds between the cell and surface. The number fluctuates over the course of the simulation.
In this article, we improve Adhesive Dynamics by equipping cells with deformable microvilli and clustering adhesion molecules on their tips. We show how the state diagram for adhesion is altered due to microvilli. The results indicate how deformation can induce improved adhesiveness of cells, joining a chorus of recent studies addressing the role of macroscopic cell deformation in leukocyte rolling and adhesion (16,18–23). By exploring the effect of microvillus deformability on adhesion, we remarkably find that microvillus rheology is ideally suited to leukocyte rolling dynamics, being adequately, but not overly, compliant to support neutrophil rolling.
MODEL
The Adhesive Dynamics method used in this study is a natural extension of previous Adhesive Dynamics models. The reader is directed to previous articles on Adhesive Dynamics for details of the method (6,24). The novel addition is to allow the microvilli to deform. As illustrated in Fig. 1, the cell is represented by a hard sphere with deformable cylindrical protrusions representing the microvilli. The microvilli are randomly distributed and their density can be varied. Although the microvillus lengths are heterogeneous on real cells (13), this model assumes a homogeneous population of microvilli with equivalent equilibrium lengths of 0.3 μm (15).
FIGURE 1.

Schematic diagram of the model. A hard sphere of radius R, representing the cell, is covered by a random distribution of cylindrical protrusions of length Λ and tip area Amv. Receptor molecules, modeled as Hookean springs, are localized to the tips of the cylindrical “microvilli” in a Poisson distribution. The molecules in the contact area and molecules on already-bound microvilli are considered close enough to bind to the uniformly reactive planar surface. The force and torque of the bonds on the cell can slow the cell to significantly below the hydrodynamic velocity expected for an unencumbered cell in a given uniform shear flow.
Adhesion molecules are localized to the microvillus tips and can bind with the uniformly reactive planar surface. Uniform reactivity is a good assumption for the case where the density of molecules on the surface is high compared to the density on the cell. The number of adhesion molecules on each microvillus tip is assumed to follow a Poisson distribution about the mean (6). Measurements of the density of PSGL-1 molecules or P-selectin binding sites on neutrophils range from 48 PSGL-1/μm2 to 124 P-selectin binding sites/μm2 (25–28). Several authors have noted that the effective density of adhesion molecules is smaller than the total, owing to crowding or orientational effects (29,30). Thus, the number we use is the effective total number per microvillus tip.
Properties of bonds
We model the bonds between adhesion molecules on the cell and substrate as Hookean springs, so the chemical force on the cell due to each bond, f, is calculated by
 |
(1) |
where σ is the bond spring constant, z is the stressed length of the bond, and λ is the equilibrium length of the bond. In this model, the unstressed bond length is 0.1 μm, equal to the sum of the extracellular lengths of P-selectin and PSGL-1, two adhesion molecules that mediate rolling (31).
The dissociation rate, kr, is force-dependent according to the following model from Bell (32),
 |
(2) |
where  is the unstressed dissociation rate constant, γ is the reactive compliance, and kBT is the thermal energy. The reactive compliance is a parameter with units of length that describes the degree to which force facilitates bond breakage—a smaller value of reactive compliance means that the bond is less susceptible to breakage by force. To satisfy the Boltzmann distribution at equilibrium (33), the forward rate, kf, must depend on separation distance according to
 |
(3) |
where z would be the length of the possible new bond and  is the unstressed association rate, i.e., the forward reaction rate in the case that the new bond would be of its equilibrium length (z = λ).
Cell motion
To simulate cell rolling, motion was discretized and integrated forward in time with the Euler method using a time-step of 10−7 s. This time-step allowed us to capture the fast motions of the springlike bonds and microvilli, but a smaller time-step did not significantly alter the results. However, in checking for bond formation and breakage, the time-step required for accuracy in the results was only 10−6 s. The use of two different time-steps maintained accuracy in the program while also permitting shorter run times. At each time-step for cell motion, the following steps were performed:
Step I. Calculate the external forces acting on the cell.
Step II. Check for bond formation and breakage (if appropriate according to the time-step for this process).
Step III. Update the position of the cell in flow.
Step IV. Update lengths of the microvilli.
External forces on the cell include: 1), gravity and buoyancy; 2), a generic repulsive force; and 3), chemical forces and torques. Because the cell is slightly denser than the fluid in the simulation, gravity promotes close apposition of the cell to the surface to allow bonding. The generic repulsive force was derived from a phenomenological potential that represents the effects of electrostatic repulsion, solvent exclusion, and polymer compression when the cell and surface approach each other (34). It takes the form
 |
(4) |
where Frep is a constant that measures the ease of glycocalyx compression and gives the magnitude of the repulsive force, s is the separation distance between the plane and the cell, and τ is the length scale of the repulsive force on the order of the glycocalyx thickness. Because the length scale is small compared to the separation distance between the plane surface and cell body, the protruding microvilli in the contact area are the predominant cell structures responsible for the repulsion that prevents the cell from going through the planar surface in the simulation. Finally, the chemical forces due to all bonds are calculated from Eq. 1.
In Step II of the simulation, bonds are checked for formation and breakage according to their respective probabilities, Pf and Pr, given by
 |
(5) |
and
 |
(6) |
where kf and kr are the forward and reverse reaction rates and Δt is the time-step for checking for bond formation and breakage used in the simulation (6,24).
When checking for bond formation, only molecules of a reasonable proximity to the reactive surface are considered. The contact area, shown in the closeup in Fig. 1, is defined as the area of the cell closest to the substrate where molecules have a practical probability to bind. For molecules outside of the contact area, the probability of bond formation is vanishingly small, so it is assumed to be zero and not checked. At each time-step, unbound molecules on all microvilli in the contact area are tested for bond formation. Any free molecules on bound microvilli, which may be outside of the contact area, are checked as well. Also, all bound molecules are tested for bond breakage. The positions of only the bound microvilli are stored from step to step, saving memory and computational time. The positions of unbound microvilli in the contact area are randomly assigned to check for bond formation at each time-step.
A Monte Carlo technique is used to determine the formation and breakage of each molecule to be tested. A random number is chosen between 0 and 1, and this number is compared to the probabilities given in Eqs. 5 and 6. If the random number is less than the probability, the event will happen.
As has been shown by Chang and Hammer (35), the unstressed forward rate is a function of the relative motion of the cell with respect to the substrate and the density of ligand on the substrate surface. Since the relative motion of the cell is significant only when the cell is unbound, this amounts to two distinct on-rates—i.e., the on-rate in the convective limit,  when the cell is unbound; and the on-rate in the diffusive limit,
  when the cell is bound by at least one bond. The values of these two unstressed association rates are estimated from the following expressions, which were adapted from the derivations of Chang and Hammer (35):
 |
(7) |
 |
(8) |
In Eqs. 7 and 8, D is the relative diffusion coefficient of the bonding molecules, a is the encounter radius, kin is the intrinsic forward reaction rate constant, and ρligand is the surface density of ligand on the substrate. Also, b is half of the mean distance between ligands on the substrate and Pe = |ν|a/D is the Peclet number based on the relative velocity, |ν|, between the cell and substrate surfaces.
After all the appropriate molecules are checked for bond formation or breakage at a given time-step, the position of the cell is updated for the motion that occurred during that time-step in Step III of the simulation. In this model, Stokes flow is assumed since the Reynolds number for the flow and particle is small. Furthermore, since the microvilli are small compared to the sphere radius and sparse compared to their diameter, we have ignored their effect on the hydrodynamic force (36). Therefore, Goldman and co-workers' (37) solution to the problem of a sphere translating and rotating near a planar wall in shear flow is used to predict the translational and rotational velocities of the cell under the external forces calculated in Step I of the simulation method by constructing a mobility matrix for the motion of the particle. This matrix has been explicitly stated in previous Adhesive Dynamics articles (see, for example, (6) and (24)). It is assumed that these velocities hold for the duration of the time-step, so the position of the cell and all of the bound microvilli on its surface are appropriately updated.
Finally, in Step IV, knowing the positions of the microvilli on the cell surface (updated in the previous step) and the bond on the planar surface (fixed in time), the lengths of the bound microvilli are updated. It is assumed that 1), the microvilli are free to bend at their attachment to the cell surface so a microvillus and its bonds are always in a straight line (38); and 2), there is force balance between the bonds and microvillus. As mentioned in the Introduction, the micropipette experiments revealed a biphasic behavior for the microvilli (15)—an extension regime with an elastic response to force at small forces and a tether regime with a plastic response at larger forces, as follows:
 |
(9) |
 |
(10) |
Here, F is the total force due to all bonds on a given microvillus. In Eq. 9, σmv is the microvillus spring constant and Λ is the equilibrium length of the homogeneous microvilli. The value Ftrans is the force at which a microvillus transitions from the extension regime to the tether regime. Experiments have shown that microvilli transition over a range of forces, depending on the degree of association between the membrane and cytoskeleton. However, in this model, one value in the middle of the range is assumed. In Eq. 10, F0 is the yield force related to the degree of association of the cytoskeleton and membrane. The parameter kteth is an effective surface viscosity of the membrane and dL/dt is the rate of elongation of the microvillus tether. Thus, when the cell is moving slowly and the microvillus is growing very slowly in the tether regime, the force transmitted to the bond will be small, approaching F0, allowing bonds to last longer.
When a microvillus is in the extension regime, the position of the microvillus tip at the next time-step is determined by balancing the forces of springs in series. When a microvillus is in the tether regime, however, the Euler method is used with Eq. 10 to determine the new microvillus length that will balance the bond force on that microvillus. With the end of Step IV, the time is updated and the process is repeated until the end of the simulation.
RESULTS
We first use the model to create a state diagram of rolling, addressing the question of how microvillus deformability affects rolling. Then, at a constant set of Bell model parameters, we explore some of the basic properties of the model. After these preliminary studies, we study the effects of microvillus rheology on rolling velocity and compare the results with the base case parameters to experimental results. Table 1 lists the model parameters along with the values used in the simulations.
TABLE 1.
Model parameters
| Parameter | Definition | Value* |
|---|---|---|
| R | Cell radius | 4 μm |
| μ | Fluid viscosity | 1 cP |
| Ġ | Shear rate | 180 s−1 |
| τ | Length scale of repulsive force | 0.01 μm |
| Frep | Repulsive force constant | 10 pN |
| Amv | Area of microvillus tip | 0.02 μm2 |
| λ | Equilibrium bond length | 0.1 μm |
| Λ | Equilibrium microvillus length | 0.3 μm |
| σ | Bond spring constant | 105; 5 × 10⁴ pN/μm |
| σmv | Microvillus spring constant | 43 pN/μm |
 |
Unstressed dissociation rate | 0.9 s−1 |
| γ | Reactive compliance | 0.3 Å |
 |
Unstressed on rate (convective limit) | 116 s−1 |
 |
Unstressed on rate (diffusion limit) | 2; 3 s−1 |
| Ftrans | Transition force | 45 pN |
| F0 | Yield force | 45 pN |
| kteth | Effective viscosity of tether | 11 pN-s/μm |
| ρmv | Density of microvilli on cell | 6; 4 sites/μm2 |
| ρselect | Density of receptors on cell | 24; 16 sites/μm2 |
When two values are listed, the first was used in creating the state diagram and the basic parameter exploration and the second was used in studying microvillus rheology and comparison to experiments unless otherwise noted.
Basic results
A snapshot of a rolling cell with its stretched microvilli and bonds is shown in Fig. 2. Microvilli at the back edge of the cell are highly stretched, which allows a large component of the bond force to act in a direction to resist shear force. After the first few seconds, the total number of bonds fluctuates at an average of ∼12, never dropping below one bond, so this cell is always bound to the surface. The velocity, therefore, is consistently below the hydrodynamic free-stream velocity, Vh. However, spikes in velocity occur as bonds at the back-edge of the cell, which provide much of the resistance to the shear forces, break.
State diagram
Hammer and co-workers showed that the dynamic state of adhesion is controlled by the Bell model parameters of dissociation rate and reactive compliance (9). Using the parameters listed in Table 1, we simulated a number of cells while varying the Bell model parameters at a fixed microvillus compliance. Each run started with the cell close enough to the plane to initiate bonding and continued for 20 s. At each set of parameters, 5–15 cells were simulated—more at lower velocities, where rolling velocity fluctuated relatively more—to determine an average rolling velocity. The behavior of the cell was observed and four states were defined as follows:
Firmly bound—average velocity is <1% Vh.
Landing—traveling at significantly different velocities during the 20-s simulation was considered “landing” since the cell started out traveling very fast but suddenly became firmly bound.
Rolling—traveling at a consistent velocity whose average is between 1 and 33% Vh.
No adhesion—average velocity is >33% Vh.
Fig. 3 exemplifies trajectories of each state. It should be noted that the landing state is distinguished from the firmly bound state, since landing cells reach an apparent steady state that would qualify as no-adhesion before switching to the firmly bound state. The switch is sudden on the timescale of the simulation.
FIGURE 3.

Representative trajectories of the four adhesion states. The Bell model parameters, γ and  respectively, for each of the states are A, 0.5 Å and 0.4 s−1; B, 1.0 Å and 0.4 s−1; C, 0.3 Å and 1.1 s−1; and D, 0.3 Å and 8.0 s−1 (see Fig. 4). The hydrodynamic velocity is shown for reference.
An exploration of Bell model parameter space allowed us to map out a state diagram for the parameters listed in Table 1. Fig. 4 shows the borders between the four different states. The state diagram illustrates that at small reactive compliance, the unstressed dissociation rate determines the rolling velocity since force does not have a large effect on bond breakage. For smaller  bonds last longer, allowing the cell to be more intimately bound to the surface, hence the firmly bound region at lower values of the dissociation rate.
FIGURE 4.

The adhesion state diagram in Bell model parameter space. Other parameters of the simulation are given in Table 1. Lines show the borders between the four states as defined in the text. Symbols point to the locations in γ − parameter space from which the representative trajectories of Fig. 3 were taken.
However, at large values of reactive compliance, it is difficult to get rolling for any value of  Instead, simulations at these large values show either a firmly bound cell, a fast moving cell, or a landing cell—a cell that suddenly switches from traveling near Vh to being firmly bound. This behavior occurs because the large reactive compliance gives rise to bonds that are very susceptible to breakage by force. Therefore, if a bond forms, it usually breaks before a second bond can form to sustain rolling. However, if the dissociation rate is low enough, it is possible for a second bond to form before the first one breaks. Once a second bond forms, the force per bond is reduced so that the bonds do not break. But, since the dissociation rate has to be low for the second bond to form, even more bonds form and the cell becomes firmly adherent. At higher
  this “landing” never occurs.
Finally, at a small range of intermediate values of the reactive compliance, rolling behavior is tunable by varying either the reactive compliance or the dissociation rate. It is in this range where most experimental values of the Bell model parameters for adhesion molecule pairs that mediate rolling lie (9). However, this intermediate area of the state diagram is not as prominent in this study as it was for the nondeformable model of Chang and co-workers (9). In contrast to what was previously observed for hard sphere rolling, the state diagram of Fig. 4 is dominated by a region where rolling behavior is determined primarily by dissociation rate.
Fig. 5 illustrates how the rolling velocity varies with the unstressed dissociation rate. Each line represents a different value of the reactive compliance. The larger reactive compliances (to the left in Fig. 5) show a sharp transition from firmly adherent to no-adhesion. As reactive compliance decreases, the curves show a more moderate transition from low to high velocity as dissociation rate increases. For small reactive compliances, the curves collapse onto each other, which is seen in the state diagram as the region where  alone determines rolling behavior. At γ = 0 Å, bonds are considered ideal, i.e., force does not influence the rate of bond breakage. As reactive compliance becomes very small and close to zero, further decreasing of γ does not significantly change a bond's response to applied force.
FIGURE 5.

Average velocity is plotted against the unstressed dissociation rate for values of the reactive compliance as given in the figure. Simulations with a large reactive compliance show a sharp transition from low to high velocity as  increases, seen as landing behavior in the state diagram. For smaller reactive compliances, the curves collapse onto each other, showing that, of the Bell model parameters, dissociation rate alone determines rolling behavior for these values of reactive compliance.
Basic properties of the model
The base case parameters were chosen from a combination of literature values as mentioned in the text and values determined by preliminary simulations when experimental numbers were not well-known. It is worth exploring the effect of some basic parameters on rolling velocity at a constant set of Bell parameters ( and γ = 0.3 Å). These Bell model parameters fall within the rolling regime on the state diagram. Also, they are similar to values for the P-selectin-PSGL-1 bond, which is known to support rolling, as determined by tethering experiments (16,39–42).
In the following section, the average velocity of an individual cell is calculated as the total distance traveled during the last half of the simulation divided by that length of time to ensure that a steady-state velocity is calculated. The average rolling velocity at a given set of parameters is determined by averaging the velocities of a number (5–15) of cells. The average velocity as a function of shear rate is compared for different parameters.
Simulations of cell detachment have shown that the membrane peeling velocity decreases if receptors on the membrane are clustered (43). To explore the effect of receptor clustering in our model, the total number of selectin molecules on the cell surface was kept constant whereas the density of microvilli was adjusted. Since the receptors are localized to the microvillus tips, this changed the number of molecules per microvillus, or the clustering, which had a significant effect on rolling velocity. Fig. 6 A shows that cells with more highly clustered molecules tend to roll more slowly and are more likely to become firmly bound. When there are more molecules on a microvillus tip, more will bind on average and rebinding can occur (44). It is difficult for a given microvillus with many bonds to detach since all of the bonds must be broken at once. So, even though the more highly clustered case has a smaller surface density of microvilli, the much higher propensity for a given microvillus to stay attached by at least one bond leads to slower rolling.
FIGURE 6.
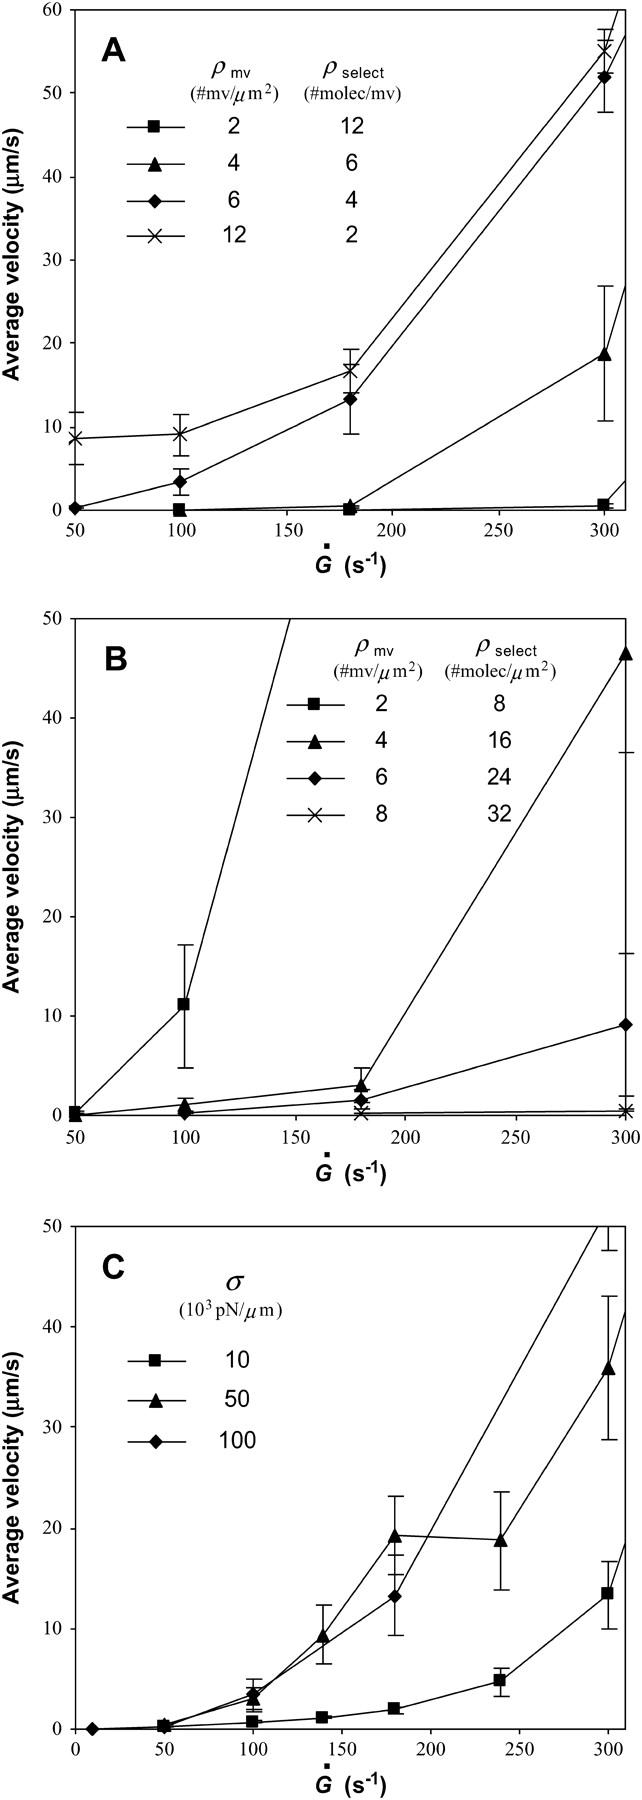
Average velocity versus shear rate parameterized as listed in the figures. Unless otherwise noted, the remaining parameters are as documented in Table 1. (A) Different degrees of clustering. In all four cases, the number of receptor molecules on the cell surface is the same at ρselect = 24 sites/μm2. Each line has a different microvillus density and, since receptors are localized to the microvillus tips, a different number of selectin molecules per microvillus as indicated in the figure. Cells with more highly clustered receptors roll more slowly. (B) Different numbers of receptors. All four cases have the same number of selectin molecules per microvillus tip (4 sites/mv), but different microvillus densities and total numbers of selectin molecules as given in the figure. For this set of calculations, the unstressed association rate in the diffusion limit is  The fewer receptors a cell has, the more quickly it rolls and the lower the shear rate at which the cell flies away from the substrate surface. (C) Different values of the bond spring constant, σ. Stiffer bonds lead to faster rolling.
We also looked at rolling behavior for different densities of receptors on the cell. The density of microvilli was varied accordingly to keep the same number of receptors per microvillus tip. In this case, the association rate in the diffusion limit was 3 s−1. Fig. 6 B reveals, as expected, that a larger number of receptors on the cell surface leads to slower rolling since more bonds can form. Furthermore, as the total number of receptors decreases, the shear rate at which the cell “flies away”—at which there is a large increase in velocity with shear rate—also decreases.
Since recent simulations have used a spring constant of σ = 105 pN/μm (7,10,12), we used that value for the base case simulations (see Table 1). However, values of a general bond spring constant estimated by various groups span orders of magnitude from 10 to 106 pN/μm (34,45). Atomic force microscopy has yielded more precise values of a bond spring constant on the order of 104 pN/μm for the P-selectin/PSGL-1 bond (46) and BSA/Ab-BSA bond (47). Accordingly, we explored the effect of bond spring constant in the range of 104−105 pN/μm on rolling velocity. Fig. 6 C shows that smaller values of the spring constant, i.e., more compliant bonds, lead to slower rolling. At Ġ = 700 s−1, the highest shear rate tested (data not shown), the largest bond strain was ∼7% for σ = 105 pN/μm and ∼71% for σ = 104 pN/μm. A bond strain of 71% is reasonable, considering that the extended conformation of a residue in a selectin ligand molecule is ∼90% longer than the relaxed conformation (48). Not only are the more compliant bonds more easily stretched, which creates a longer lever arm to resist flow and allows new bonds to form in the meantime, but the association and dissociation rates are affected through their force-dependence.
Additionally, we looked at details of the rolling behavior of cells with different microvillus densities and the same number of selectin molecules on each microvillus tip, as in Fig. 6 B. At a shear rate of 180 s−1, we compared the variance in rolling velocity and pause times of cells with microvillus densities of 4, 6, and 8 μm−2. We found, as expected, that the variance in rolling velocity decreases as the number of microvilli increases. This trend is shown in Fig. 7 A, where the variance averaged over all cells with a given microvillus density is plotted as a function of the average number of microvilli bound at that density. The average velocity of the cells also decreases as the number of microvilli increases (Fig. 7 A, inset). Note that the prescribed microvillus density represented by each point increases as the number of bound microvilli increases.
FIGURE 7.

Variance in rolling velocity and pause times for cells with different microvillus densities (4, 6, and 8 μm−2) but the same number of adhesion molecules on each microvillus. Studies were done at a shear rate of 180 s−1. (A) Variance in rolling velocity averaged over all cells at a given microvillus density versus the average number of bound microvilli at that density. Each data point represents a different microvillus density with higher densities at larger values of the number of bound microvilli. The inset shows the corresponding average rolling velocities. Both variance and rolling velocity decrease with the number of microvilli. (B) Average over cells of the average duration of a pause and number of pauses as a function of microvillus density. Pauses are defined as time spent below a threshold velocity of 0.5 μm/s. Pause duration is nearly constant, whereas the number of pauses increases with microvillus density. (C) Pause-time distributions at the different microvillus densities. Distributions are similar, but there are fewer pauses for lower microvillus densities.
Fig. 7 B shows the average pause-time and average number of pauses per cell, with a pause defined as a period of time during which the cell remains under a threshold velocity of 0.5 μm/s, assuming a frame rate of ∼33 frames/s. It is interesting that the average duration of pauses does not significantly change with microvillus density, suggesting that it is a property of the microvilli themselves determining the pause time. However, the number of pauses per cell increases as the microvillus density increases, which leads to a larger fraction of time spent paused and therefore a smaller rolling velocity. Pause-time distributions for each microvillus density are given in Fig. 7 C. These histograms reveal that the distributions of pause times are similar, with a small number of long pauses lasting nearly 6 s, yet there are fewer total pauses at lower microvillus densities.
Microvillus parameter exploration
For the analysis of microvillus rheology, the parameters describing the deformation of the microvilli were varied. The base case model parameter values used in this study are listed in Table 1, and were estimated from micropipette measurements of microvillus stretching performed by Shao and colleagues (15,49).
Surface viscosity of the membrane
From Eq. 10, kteth is the effective surface viscosity of the membrane tether that occurs because of slip between the membrane and cytoskeleton, slip between membrane bilayers, and membrane flow (50,51). We varied kteth over three orders of magnitude to study the role of tether viscosity on rolling velocity. Fig. 8 illustrates that kteth has a large effect on the magnitude of rolling velocity as a function of shear rate. At low shear rates (Fig. 8 A), the velocity of cells with less viscous tethers rises more sharply with shear rate than that of cells with more viscous tethers. However, at high shear rates, the opposite is true. Shown in Fig. 8 B, less viscous tethers lead to a more moderate rise in velocity with shear rate than more viscous tethers.
FIGURE 8.
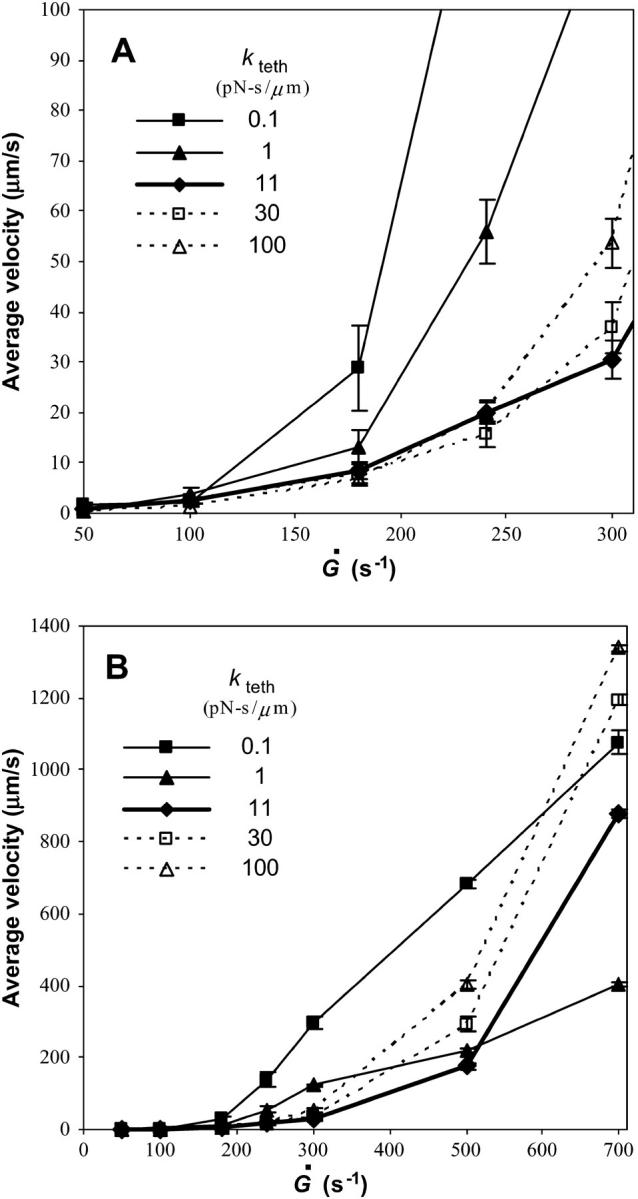
Average velocity versus shear rate for different values of kteth. The remaining parameters are as listed in Table 1. The base case is shown by the bold line. (A) A closeup of low shear rates. At low shear rates, less viscous microvilli lead to a sharp increase in velocity with shear rate to a value larger than velocities of cells with more viscous microvilli. (B) Data over the full range of shear rates tested. At high shear rates, the increase in velocity is more modest when the microvillus viscosity is lower than in the base case.
As these opposing results suggest, there is a minimum in the rolling velocity at intermediate values of kteth, which can be seen more clearly in Fig. 9. At very small viscosities, tethers can elongate very easily so they do not provide much resistance to the force of flow, resulting in larger rolling velocities. Still, low viscosity tethers are able to stretch to be very long, creating a large lever arm and leaving enough time for new bonds to form in the contact area, so these cells display a less dramatic increase in velocity with shear rate. On the other hand, more viscous tethers stretch slowly at low shear rates and resist the force of flow. When the viscosity gets very large or the shear rate gets very high, however, the tether force gets very large. Bonds cannot persist long enough for new bonds to form leading to a higher rolling velocity. We find it very surprising that the minimum in rolling velocity occurs at a value of kteth ∼10 pN s/μm, very close to the physiological value of kteth of 11 pN s/μm measured by Shao and co-workers (15).
FIGURE 9.

Average velocity normalized by Vh versus microvillus viscosity parameterized by shear rate. A minimum in velocity at an intermediate value of kteth is evident. The value of kteth at which the minimum occurs decreases with increasing shear rate.
The tether behavior's dependence on membrane viscosity manifests itself in trajectories of cell motion. For two representative cells rolling at Ġ = 180 s−1, Fig. 10 gives the cell displacement, instantaneous velocity, and number of bonds as functions of time for kteth = 0.1 and 100 pN s/μm. In each case, the number of bonds is similar (Fig. 10, C and F), but the cell motion differs. The trajectory of the cell with low-viscosity tethers in Fig. 10 A (average velocity ∼25 μm/s) has periods of fast, yet still hindered, motion, seen as segments of large slope. These fast motions occur as the microvilli stretch rapidly. The trajectory also has periods of little motion when the lever arms reach sufficient lengths to balance the force of flow. The instantaneous velocity in Fig. 10 B correspondingly has long periods of high velocity with some pauses in between. The trajectory of the cell with high-viscosity tethers in Fig. 10 D (average velocity ∼6 μm/s) is very different. There are brief periods of fast motion as microvilli at the back edge of the cell break, but generally the motion is slow since the viscous microvilli stretch slowly, as demonstrated by the instantaneous velocity in Fig. 10 E. Thus, the fluctuation in rolling velocity can be affected by the microvillus dynamics.
FIGURE 10.

Displacement, instantaneous velocity, and number of bonds as functions of time for two representative cells rolling at a shear rate of 180 s−1. (A–C) kteth = 0.1 pN s/μm. The cell has an average velocity ∼25 μm/s and shows periods of relatively large, yet encumbered velocity as the low-viscosity tethers stretch rapidly. (D–F) kteth = 100 pN s/μm. The cell rolls with an average velocity ∼6 μm/s since the viscous tethers stretch slowly.
Membrane-cytoskeleton association
F0 is the yield force of a microvillus tether and Ftrans is the force at which a microvillus switches regimes from springlike extension to viscous tethering. It has been suggested that both of these parameters depend on the degree of association of the cell membrane to the cytoskeleton so that both are larger if the association is stronger (15,51,52). Accordingly, we examined effects of varying both F0 and Ftrans on rolling velocity as a function of shear rate.
At high shear rates, it is clear from Fig. 11 A that a higher degree of association of the membrane and cytoskeleton, which makes it more difficult to pull a tether, leads to slower rolling. This may contradict intuition that tethering allows cells to roll more slowly. Instead, regardless of the parameter values, the microvilli still stretch as springs in the extension regime so the benefits of a long lever arm are still apparent. However, when the microvillus force reaches Ftrans, it suddenly tethers and, since the microvillus length is changing at that time, the force jumps up by the term kteth × dL/dt in Eq. 10. When Ftrans is small, tethering happens earlier and the jump in force is felt earlier, causing bonds to break faster, which results in faster rolling.
FIGURE 11.
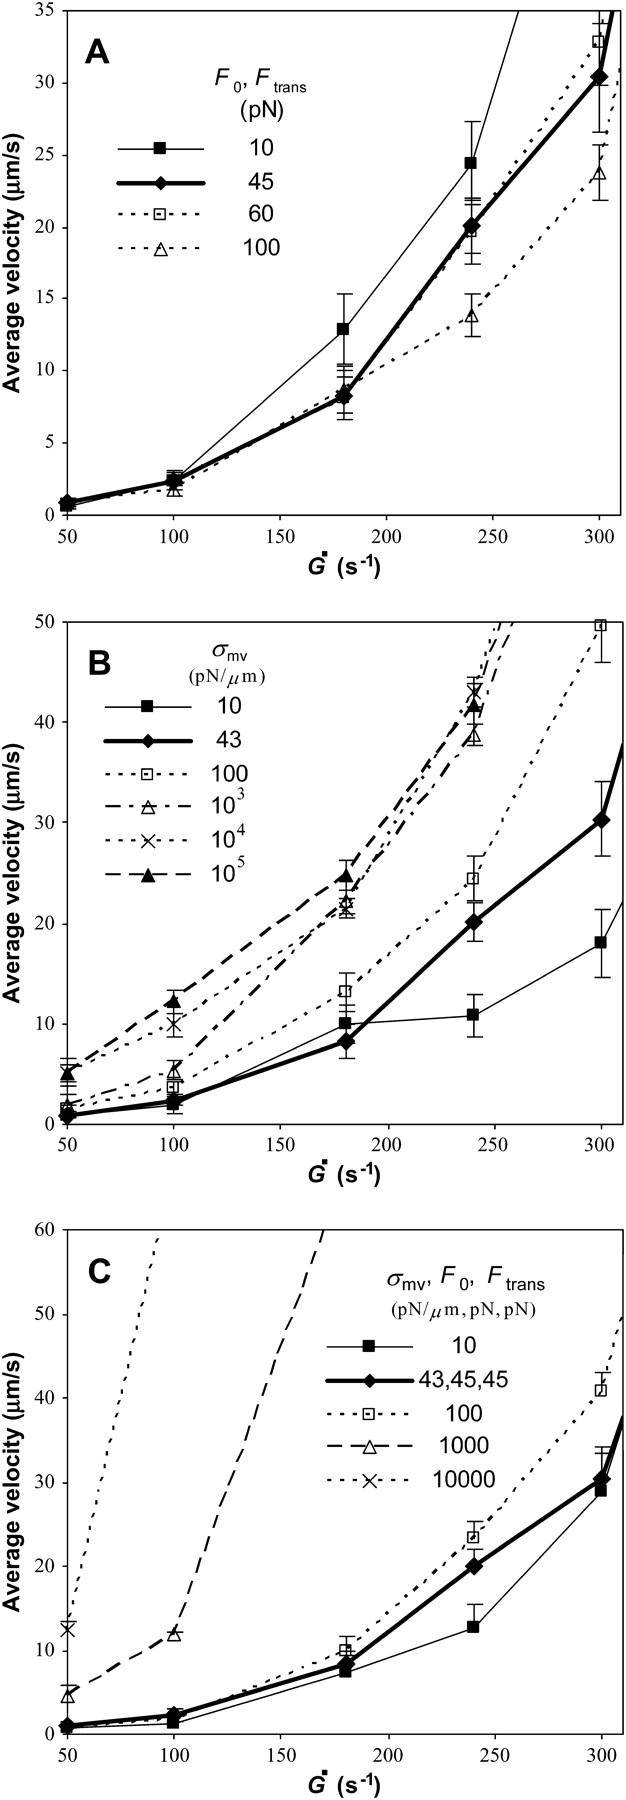
Average velocity versus shear rate over the range of microvillus rheological parameters given in each figure. All other parameters are as listed in Table 1. The base case is shown in bold. (A) Different degrees of association between the cell membrane and cytoskeleton, i.e., different values of F0 and Ftrans. Results show that a weaker membrane-cytoskeleton association leads to faster rolling. (B) Different values of the microvillus spring constant. Cells with stiffer microvilli have larger velocities, but a limit in velocity is reached as σmv becomes large. (C) Different degrees of microvillus deformability. Each line has different values for the three parameters σmv, F0, and Ftrans as given in the figure. When three numbers are listed, they correspond to each of the three parameters. When only one number is given, all three parameters have the same value with their respective units. Clearly, making the microvilli less deformable by changing σmv, F0, and Ftrans greatly increases the velocity of the cell.
Microvillus stiffness
The spring constant of a microvillus, σmv, is important when the microvillus is in the extension regime (under smaller forces). Fig. 11 B makes it apparent that stiffer microvilli lead to faster rolling. This is an expected outcome since stiffer microvilli do not stretch as much, resulting in shorter lever arms and bonds that cannot resist the force of flow as well.
Although it is clear that increasing the microvillus spring constant increases rolling velocity, it is interesting that a two-order-of-magnitude increase in the spring constant results in only a severalfold increase in rolling velocity. Despite the fact that microvilli with a larger σmv cannot stretch as much in the extension regime, they can still tether. Microvilli at the back edge of the cell, where most resistance to flow is localized, moderate the effect of stiffer microvilli as they are more likely to be in the tether regime.
Microvillus deformability
As discussed in the last sections, stiffer microvilli lead to somewhat faster rolling. Also, increasing the degree of association between the membrane and cytoskeleton was found to actually decrease the rolling velocity. However, it has been hypothesized that deformation of microvilli greatly stabilizes rolling. To study the effects of microvillus deformation in general, three parameters were adjusted. To reduce the deformability of the microvilli, the microvillus spring constant was increased to make the microvilli stiffer in the extension regime. In addition, these stiffer microvilli were assigned larger values of the parameters F0 and Ftrans to ensure that stiffer microvilli also had a reduced ability to tether, thereby rendering them less deformable overall. The base case uses σmv = 43 pN/μm, F0 = 45 pN, and Ftrans = 45 pN. For simplicity, the values of all three parameters were set to the same numerical value (with different units). The simulation results in Fig. 11 C for different sets of the three parameters show that microvillus deformation is in fact important to a cell's ability to roll slowly in shear flow. Clearly, more compliant microvilli lead to slower rolling, as has been postulated (15).
Comparison to experiment
Finally, we were interested in the ability of the new model with microvillus deformability to recreate experimental data of in vitro cell rolling. In Fig. 12, rolling velocity versus shear rate for the model using the base case parameters is plotted against published rolling velocity data from various labs (1,27,39,42,53–55). The comparison demonstrates that the model matches experimental data at low shear rates, Ġ < 200 s−1, both showing a nearly linear increase in velocity with shear rate. Since the model does not include deformability of the whole cell body, it is not expected to be accurate at high shear rates where the cell deforms enough to affect rolling velocity (18,19,22,55).
FIGURE 12.

A comparison of average velocity versus shear rate between simulation from the current study and experimental results from other studies is given in the figure. Simulation results are for the base case listed in Table 1 and are shown in bold. The density of ligand on the substrate over which cells were perfused is given in the figure. All experiments were performed using P-selectin-coated surfaces. Simulations agree with cell experiments at low shear rates, but begin to diverge as the shear rate increases.
In addition to showing the correct trend for rolling velocity increase with shear rate at low shear rates, the model also produces trajectories similar to those seen in experiments. For example, Schmidtke and Diamond (17) reported the position of a neutrophil as a function of time as it rolled on a surface of 10 sites/μm2 P-selectin at a shear rate of 150 s−1. The trajectory is characterized by periods of motion intermixed with pauses, which appear as plateaus in the distance versus time. Chen and Springer (48) show a similar trajectory for a neutrophil rolling on 200 sites/μm2 E-selectin at a shear rate of 100 s−1. A closeup of the distance-versus-time trajectory of a representative rolling cell from Adhesive Dynamics is shown in Fig. 13 along with the experimental trajectories of Schmidtke and Diamond. Trajectories from both sources show repeated plateaus characteristic of rolling with microvillus stretching. Initially, when a microvillus is short, the lever arm is small and the force of flow is not resisted well, so the cell moves relatively quickly. As the microvillus stretches, its angle allows a larger resistance to the fluid force and the cell moves more slowly, and the displacement is independent of time. As bonds break, this process is repeated. Thus, the inclusion of deformable microvilli in Adhesive Dynamics leads to the characteristic pause dynamics of neutrophil rolling seen in experiments.
FIGURE 13.

A comparison of characteristic trajectories in a simulation to experimental trajectories of a cell tethering and rolling on ∼10 sites/μm2 P-selectin at a shear rate of 150 s−1 (17). Parameters of the simulation are given in Table 1 at a shear rate of 180 s−1. Trajectories from each source show a similar shape with multiple plateaus characteristic of microvillus stretching.
DISCUSSION
To begin to understand cellular contributions to leukocyte rolling, we improved upon Adhesive Dynamics by adding deformable microvilli on which adhesion molecules are clustered. Microvilli deformed according to rheology determined in micropipette experiments by Shao and co-workers (15). We created a state diagram for adhesion in Bell parameter space and found four adhesion states—firmly bound, landing, rolling, and no-adhesion. Landing was observed only for large reactive compliance.
We also explored properties of the model by observing rolling velocity versus shear rate as we varied parameters. Beginning with some basic model properties, we simulated the effects of receptor clustering, the total number of receptors on the cell, and the bond spring constant, and found anticipated results. We were surprised by two effects of the tether viscosity on adhesion. First, rolling velocity showed a minimum at an intermediate value of the tether viscosity (see Fig. 9) of 10 pN s/μm, very close to the actual reported value of this parameter (11 pN s/μm; see (15)). This result suggests neutrophil rheology has evolved to the most efficient mechanics to sustain rolling. Second, we found that kteth can affect the fluctuations in the rolling velocity. Since fluctuations may be a method for the cell to control ligation times and signaling dynamics, the control of fluctuations by cell mechanics suggests a more complex mechanochemical control of cell response.
Finally, we compared our simulation results to published experiments and found that the rolling velocities agreed for shear rates <200 s−1. Furthermore, simulation trajectories had a shape characteristic of microvillus stretching, as seen in high-resolution experiments (17,48), where plateaus in motion suggest regions in which the microvilli are being stretched.
Our results indicate that the deformation of microvilli significantly influences the rolling behavior of leukocytes, an observation also seen in experiments (16). First, a comparison of the state diagram generated in this article to that for an Adhesive Dynamics model without microvilli (9) suggests that deformable microvilli decrease the impact of the reactive compliance on adhesion at small values of the reactive compliance. We reason that this is due to the decreased force required from the bonds when the microvilli can stretch and tether. Since reactive compliance is a measure of the sensitivity of bonds to applied force, it has a smaller influence on rolling when the force felt by the bonds is smaller. In addition, the previous Adhesive Dynamics model by Chang and co-workers (9) required a greater density (∼80 mol/μm2 versus ∼16 mol/μm2 in this study) of bonding molecules on the cell surface and a larger unstressed on-rate (84 s−1 versus 3 s−1 in the diffusion limit in this study) to achieve rolling behavior. As discussed, Fig. 11 C shows that as microvilli become less deformable, the cell's ability to roll diminishes. Therefore, microvillus deformability contributes to the stability of leukocyte rolling.
Results in this article indicate that a cell could tune its rolling behavior by modulating its mechanics. For example, as seen in Fig. 9, the minimum in rolling velocity at a given shear rate occurs at a smaller value of kteth as the shear rate increases. This suggests that a cell could employ a shear-thinning effect to help stabilize its rolling velocity over a range of shear rates. In fact, it has been reported that tethers pulled from passive neutrophils at a force >100 pN, and therefore larger velocity, are nearly threefold less viscous than tethers pulled at a smaller force and smaller velocity (50). Furthermore, Drury and Dembo (56) reported that a model of micropipette aspiration of neutrophils required shear-thinning to reproduce experimental data over a range of conditions. Another adjustable feature that may ideally modify cell rolling is the adhesion energy between the membrane and cytoskeleton. Once a neutrophil is activated, the membrane becomes more tightly bound to the cytoskeleton due to an increased number of integral membrane proteins, thereby increasing F0 and Ftrans (57). In support of this idea, tether rheology measurements performed on activated neutrophils show that the yield force, F0, is nearly twice that of a passive neutrophil (50,51). The increase in adhesion energy is a possible mechanism to slow down a cell once it becomes activated to promote firm adhesion. More subtly, through controlling microvillus mechanics, the cell may be able to control the dynamics of receptor ligation and the resulting signaling from receptors, which may influence the probability that a cell would stop at a site of inflammation.
In the Adhesive Dynamics model outlined in this article, we used the Bell model to represent the effect of force on the rate of bond breakage. It has been determined that the Bell model holds for the P-selectin/PSGL-1 bond at high rates of force loading (>100 pN/s) on the bond (58), and others have reported that physiological loading rates on adhesion molecules are ∼100–10,000 pN/s (59). It may apparently be concluded that the Bell model is acceptable for an analysis of leukocyte rolling (9,60). However, the tethering experiments often used to determine the Bell model parameters require a number of approximations. Considering the deformation of the microvilli, it is likely that there are errors in estimating the force on a bond and the lever arm. In addition, the viscous deformation of the microvilli, which gives a diminishing force on the bonds as the stretching rate slows, may result in a small loading rate on the bonds for which the Bell model is not appropriate. Instead, the P-selectin/PSGL-1 bond could have biphasic breakage properties. Marshall and co-workers found catch-bond behavior at low forces and slip-bond behavior at higher forces (61). Their plots of bond lifetime versus force suggest that Bell parameters fit to high forces only would predict bond lifetimes significantly longer than those measured experimentally. In addition, Evans and co-workers have reported that there may be two dissociation pathways for the P-selectin/PSGL-1 bond, and one of the pathways appears to allow bonds to break faster at low forces (62). We hypothesize that incorporating a biphasic model for bond breakage by force into Adhesive Dynamics, and including microvillus deformation, could possibly explain the dynamics of tethering seen in pause-time experiments. Conversely, the inability to account for microvillus deformation when using tethering measurements to determine Bell model parameters for individual molecules may lead to spurious values for the molecular constants themselves. The model presented above should be used to interpret tethering results and determine accurate parameters for adhesion molecules.
Though the model in this article is useful to predict the effects of microvillus deformability on leukocyte rolling, there are a number of features still missing from the model that may improve the overall accuracy of simulations. First of all, some details of the microvilli were neglected in this model. Microvillus lengths are heterogeneous (13), so it could be predominantly the longest microvilli that interact and bind with the substrate (36). Furthermore, tether length may be limited by the excess membrane on the cell available for elongation. Once the membrane reservoir is exhausted, there is an abrupt exponential increase in force (52), which could cause bonds to break, thereby restricting tether lengths to reasonable values. Features to consider in future models include the possibility that receptors may be extracted from the membrane (32). Although cells would retain enough adhesion molecules to sustain rolling (1), it is possible that some tethers may detach by receptor extraction since the cytoskeleton is not present to anchor the molecules (49).
Finally, larger-scale considerations would help make a more complete model of cell rolling. In addition to the deformability of microvilli, the entire body of the cell is deformable under the force of flow, which allows the cell to take on a more hydrodynamic form when subjected to high shear rates. This deformation also increases the contact area, so more adhesion molecules can bind to the substrate and slow the cell down as the shear rate increases. The incorporation of cell deformability into Adhesive Dynamics could elucidate the role of cellular features in the plateau of rolling velocity with shear rate. Several other groups have begun to address these macroscopic effects, largely omitting microvilli and using simplified versions of the cell's macrorheology (19–21,23). The final model of leukocyte rolling would be one that combines all of these features.
Acknowledgments
We are grateful for support from the National Institutes of Health (No. HL18208) to D.A.H. and a National Science Foundation Graduate Researchers Fellowship to K.E.C.
References
- 1.Lawrence, M. B., and T. A. Springer. 1991. Leukocytes roll on a selectin at physiologic flow rates: distinction from and prerequisite for adhesion through integrins. Cell. 65:859–873. [DOI] [PubMed] [Google Scholar]
- 2.von Andrian, U. H., J. D. Chambers, L. M. McEvoy, R. F. Bargatze, K. E. Arfors, and E. C. Butcher. 1991. Two-step model of leukocyte-endothelial cell interaction in inflammation: distinct roles for LECAM-1 and the leukocyte beta 2 integrins in vivo. Proc. Natl. Acad. Sci. USA. 88:7538–7542. [DOI] [PMC free article] [PubMed] [Google Scholar]
- 3.Nicolson, G. L. 1988. Organ specificity of tumor metastasis: role of preferential adhesion, invasion and growth of malignant cells at specific secondary sites. Cancer Metastasis Rev. 7:143–188. [DOI] [PubMed] [Google Scholar]
- 4.Butcher, E. C. 1991. Leukocyte-endothelial cell recognition: three (or more) steps to specificity and diversity. Cell. 67:1033–1036. [DOI] [PubMed] [Google Scholar]
- 5.Springer, T. A. 1994. Traffic signals for lymphocyte recirculation and leukocyte emigration: the multistep paradigm. Cell. 76:301–314. [DOI] [PubMed] [Google Scholar]
- 6.Hammer, D. A., and S. M. Apte. 1992. Simulation of cell rolling and adhesion on surfaces in shear flow: general results and analysis of selectin-mediated neutrophil adhesion. Biophys. J. 63:35–57. [DOI] [PMC free article] [PubMed] [Google Scholar]
- 7.Bhatia, S. K., M. R. King, and D. A. Hammer. 2003. The state diagram for cell adhesion mediated by two receptors. Biophys. J. 84:2671–2690. [DOI] [PMC free article] [PubMed] [Google Scholar]
- 8.Chang, K. C., and D. A. Hammer. 2000. Adhesive dynamics simulations of sialyl-Lewis(x)/E-selectin-mediated rolling in a cell-free system. Biophys. J. 79:1891–1902. [DOI] [PMC free article] [PubMed] [Google Scholar]
- 9.Chang, K. C., D. F. Tees, and D. A. Hammer. 2000. The state diagram for cell adhesion under flow: leukocyte rolling and firm adhesion. Proc. Natl. Acad. Sci. USA. 97:11262–11267. [DOI] [PMC free article] [PubMed] [Google Scholar]
- 10.King, M. R., and D. A. Hammer. 2001. Multiparticle adhesive dynamics. Interactions between stably rolling cells. Biophys. J. 81:799–813. [DOI] [PMC free article] [PubMed] [Google Scholar]
- 11.King, M. R., and D. A. Hammer. 2001. Multiparticle adhesive dynamics: hydrodynamic recruitment of rolling leukocytes. Proc. Natl. Acad. Sci. USA. 98:14919–14924. [DOI] [PMC free article] [PubMed] [Google Scholar]
- 12.King, M. R., S. D. Rodgers, and D. A. Hammer. 2001. Hydrodynamic collisions suppress fluctuations in the rolling velocity of adhesive blood cells. Langmuir. 17:4139–4143. [Google Scholar]
- 13.Bruehl, R. E., T. A. Springer, and D. F. Bainton. 1996. Quantitation of L-selectin distribution on human leukocyte microvilli by immunogold labeling and electron microscopy. J. Histochem. Cytochem. 44:835–844. [DOI] [PubMed] [Google Scholar]
- 14.Moore, K. L., K. D. Patel, R. E. Bruehl, F. Li, D. A. Johnson, H. S. Lichenstein, R. D. Cummings, D. F. Bainton, and R. P. McEver. 1995. P-selectin glycoprotein ligand-1 mediates rolling of human neutrophils on P-selectin. J. Cell Biol. 128:661–671. [DOI] [PMC free article] [PubMed] [Google Scholar]
- 15.Shao, J. Y., H. P. Ting-Beall, and R. M. Hochmuth. 1998. Static and dynamic lengths of neutrophil microvilli. Proc. Natl. Acad. Sci. USA. 95:6797–6802. [DOI] [PMC free article] [PubMed] [Google Scholar]
- 16.Park, E. Y., M. J. Smith, E. S. Stropp, K. R. Snapp, J. A. DiVietro, W. F. Walker, D. W. Schmidtke, S. L. Diamond, and M. B. Lawrence. 2002. Comparison of PSGL-1 microbead and neutrophil rolling: microvillus elongation stabilizes P-selectin bond clusters. Biophys. J. 82:1835–1847. [DOI] [PMC free article] [PubMed] [Google Scholar]
- 17.Schmidtke, D. W., and S. L. Diamond. 2000. Direct observation of membrane tethers formed during neutrophil attachment to platelets or P-selectin under physiological flow. J. Cell Biol. 149:719–730. [DOI] [PMC free article] [PubMed] [Google Scholar]
- 18.Cao, J., B. Donell, D. R. Deaver, M. B. Lawrence, and C. Dong. 1998. In vitro side-view imaging technique and analysis of human T-leukemic cell adhesion to ICAM-1 in shear flow. Microvasc. Res. 55:124–137. [DOI] [PubMed] [Google Scholar]
- 19.Dong, C., J. Cao, E. J. Struble, and H. H. Lipowsky. 1999. Mechanics of leukocyte deformation and adhesion to endothelium in shear flow. Ann. Biomed. Eng. 27:298–312. [DOI] [PubMed] [Google Scholar]
- 20.Dong, C., and X. X. Lei. 2000. Biomechanics of cell rolling: shear flow, cell-surface adhesion, and cell deformability. J. Biomech. 33:35–43. [DOI] [PubMed] [Google Scholar]
- 21.Jadhav, S., C. D. Eggleton, and K. Konstantopoulos. 2005. A 3-D computational model predicts that cell deformation affects selectin-mediated leukocyte rolling. Biophys. J. 88:96–104. [DOI] [PMC free article] [PubMed] [Google Scholar]
- 22.Lei, X., M. B. Lawrence, and C. Dong. 1999. Influence of cell deformation on leukocyte rolling adhesion in shear flow. J. Biomech. Eng. 121:636–643. [DOI] [PubMed] [Google Scholar]
- 23.N'Dri, N. A., W. Shyy, and R. Tran-Son-Tay. 2003. Computational modeling of cell adhesion and movement using a continuum-kinetics approach. Biophys. J. 85:2273–2286. [DOI] [PMC free article] [PubMed] [Google Scholar]
- 24.Chang, K. C., and D. A. Hammer. 1996. Influence of direction and type of applied force on the detachment of macromolecularly-bound particles from surfaces. Langmuir. 12:2271–2282. [Google Scholar]
- 25.Moore, K. L., A. Varki, and R. P. McEver. 1991. GMP-140 binds to a glycoprotein receptor on human neutrophils: evidence for a lectin-like interaction. J. Cell Biol. 112:491–499. [DOI] [PMC free article] [PubMed] [Google Scholar]
- 26.Norman, K. E., A. G. Katopodis, G. Thoma, F. Kolbinger, A. E. Hicks, M. J. Cotter, A. G. Pockley, and P. G. Hellewell. 2000. P-selectin glycoprotein ligand-1 supports rolling on E- and P-selectin in vivo. Blood. 96:3585–3591. [PubMed] [Google Scholar]
- 27.Rodgers, S. D., R. T. Camphausen, and D. A. Hammer. 2000. Sialyl Lewis(x)-mediated, PSGL-1-independent rolling adhesion on P-selectin. Biophys. J. 79:694–706. [DOI] [PMC free article] [PubMed] [Google Scholar]
- 28.Ushiyama, S., T. M. Laue, K. L. Moore, H. P. Erickson, and R. P. McEver. 1993. Structural and functional characterization of monomeric soluble P-selectin and comparison with membrane P-selectin. J. Biol. Chem. 268:15229–15237. [PubMed] [Google Scholar]
- 29.Chesla, S. E., P. Selvaraj, and C. Zhu. 1998. Measuring two-dimensional receptor-ligand binding kinetics by micropipette. Biophys. J. 75:1553–1572. [DOI] [PMC free article] [PubMed] [Google Scholar]
- 30.Picker, L. J., R. A. Warnock, A. R. Burns, C. M. Doerschuk, E. L. Berg, and E. C. Butcher. 1991. The neutrophil selectin LECAM-1 presents carbohydrate ligands to the vascular selectins ELAM-1 and GMP-140. Cell. 66:921–933. [DOI] [PubMed] [Google Scholar]
- 31.Patel, K. D., M. U. Nollert, and R. P. McEver. 1995. P-selectin must extend a sufficient length from the plasma membrane to mediate rolling of neutrophils. J. Cell Biol. 131:1893–1902. [DOI] [PMC free article] [PubMed] [Google Scholar]
- 32.Bell, G. I. 1978. Models for the specific adhesion of cells to cells. Science. 200:618–627. [DOI] [PubMed] [Google Scholar]
- 33.Dembo, M., D. C. Torney, K. Saxman, and D. Hammer. 1988. The reaction-limited kinetics of membrane-to-surface adhesion and detachment. Proc. R. Soc. Lond. B. Biol. Sci. 234:55–83. [DOI] [PubMed] [Google Scholar]
- 34.Bell, G. I., M. Dembo, and P. Bongrand. 1984. Cell adhesion. Competition between nonspecific repulsion and specific bonding. Biophys. J. 45:1051–1064. [DOI] [PMC free article] [PubMed] [Google Scholar]
- 35.Chang, K. C., and D. A. Hammer. 1999. The forward rate of binding of surface-tethered reactants: effect of relative motion between two surfaces. Biophys. J. 76:1280–1292. [DOI] [PMC free article] [PubMed] [Google Scholar]
- 36.Zhao, Y., S. Chien, and S. Weinbaum. 2001. Dynamic contact forces on leukocyte microvilli and their penetration of the endothelial glycocalyx. Biophys. J. 80:1124–1140. [DOI] [PMC free article] [PubMed] [Google Scholar]
- 37.Goldman, A. J., R. G. Cox, and H. Brenner. 1967. Slow viscous motion of a sphere parallel to a plane wall. II. Couette flow. Chem. Eng. Sci. 22:653–660. [Google Scholar]
- 38.Lauffenburger, D. A., and J. J. Linderman. 1993. Receptors: Models for Binding, Trafficking, and Signaling. Oxford University Press, New York.
- 39.Alon, R., D. A. Hammer, and T. A. Springer. 1995. Lifetime of the P-selectin-carbohydrate bond and its response to tensile force in hydrodynamic flow. Nature. 374:539–542. [DOI] [PubMed] [Google Scholar]
- 40.Ramachandran, V., M. U. Nollert, H. Qiu, W. J. Liu, R. D. Cummings, C. Zhu, and R. P. McEver. 1999. Tyrosine replacement in P-selectin glycoprotein ligand-1 affects distinct kinetic and mechanical properties of bonds with P- and L-selectin. Proc. Natl. Acad. Sci. USA. 96:13771–13776. [DOI] [PMC free article] [PubMed] [Google Scholar]
- 41.Ramachandran, V., T. Yago, T. K. Epperson, M. M. Kobzdej, M. U. Nollert, R. D. Cummings, C. Zhu, and R. P. McEver. 2001. Dimerization of a selectin and its ligand stabilizes cell rolling and enhances tether strength in shear flow. Proc. Natl. Acad. Sci. USA. 98:10166–10171. [DOI] [PMC free article] [PubMed] [Google Scholar]
- 42.Smith, M. J., E. L. Berg, and M. B. Lawrence. 1999. A direct comparison of selectin-mediated transient, adhesive events using high temporal resolution. Biophys. J. 77:3371–3383. [DOI] [PMC free article] [PubMed] [Google Scholar]
- 43.Ward, M. D., M. Dembo, and D. A. Hammer. 1994. Kinetics of cell detachment: peeling of discrete receptor clusters. Biophys. J. 67:2522–2534. [DOI] [PMC free article] [PubMed] [Google Scholar]
- 44.Erdmann, T., and U. S. Schwarz. 2004. Stability of adhesion clusters under constant force. Phys. Rev. Lett. 92:108102. [DOI] [PubMed] [Google Scholar]
- 45.Morozov, V. N., and T. Y. Morozova. 1990. What does a protein molecule look like? Com. Mol. Cell Biophys. 6:249–270. [Google Scholar]
- 46.Fritz, J., A. G. Katopodis, F. Kolbinger, and D. Anselmetti. 1998. Force-mediated kinetics of single P-selectin/ligand complexes observed by atomic force microscopy. Proc. Natl. Acad. Sci. USA. 95:12283–12288. [DOI] [PMC free article] [PubMed] [Google Scholar]
- 47.Chtcheglova, L. A., G. T. Shubeita, S. K. Sekatskii, and G. Dietler. 2004. Force spectroscopy with a small dithering of AFM tip: a method of direct and continuous measurement of the spring constant of single molecules and molecular complexes. Biophys. J. 86:1177–1184. [DOI] [PMC free article] [PubMed] [Google Scholar]
- 48.Chen, S., and T. A. Springer. 1999. An automatic braking system that stabilizes leukocyte rolling by an increase in selectin bond number with shear. J. Cell Biol. 144:185–200. [DOI] [PMC free article] [PubMed] [Google Scholar]
- 49.Shao, J. Y., and R. M. Hochmuth. 1996. Micropipette suction for measuring picoNewton forces of adhesion and tether formation from neutrophil membranes. Biophys. J. 71:2892–2901. [DOI] [PMC free article] [PubMed] [Google Scholar]
- 50.Marcus, W. D., and R. M. Hochmuth. 2002. Experimental studies of membrane tethers formed from human neutrophils. Ann. Biomed. Eng. 30:1273–1280. [DOI] [PubMed] [Google Scholar]
- 51.Shao, J. Y., and J. Xu. 2002. A modified micropipette aspiration technique and its application to tether formation from human neutrophils. J. Biomech. Eng. 124:388–396. [DOI] [PubMed] [Google Scholar]
- 52.Raucher, D., and M. P. Sheetz. 1999. Characteristics of a membrane reservoir buffering membrane tension. Biophys. J. 77:1992–2002. [DOI] [PMC free article] [PubMed] [Google Scholar]
- 53.Puri, K. D., E. B. Finger, and T. A. Springer. 1997. The faster kinetics of L-selectin than of E-selectin and P-selectin rolling at comparable binding strength. J. Immunol. 158:405–413. [PubMed] [Google Scholar]
- 54.Smith, M. L., M. J. Smith, M. B. Lawrence, and K. Ley. 2002. Viscosity-independent velocity of neutrophils rolling on P-selectin in vitro or in vivo. Microcirculation. 9:523–536. [DOI] [PubMed] [Google Scholar]
- 55.Yago, T., A. Leppanen, H. Qiu, W. D. Marcus, M. U. Nollert, C. Zhu, R. D. Cummings, and R. P. McEver. 2002. Distinct molecular and cellular contributions to stabilizing selectin-mediated rolling under flow. J. Cell Biol. 158:787–799. [DOI] [PMC free article] [PubMed] [Google Scholar]
- 56.Drury, J. L., and M. Dembo. 2001. Aspiration of human neutrophils: effects of shear thinning and cortical dissipation. Biophys. J. 81:3166–3177. [DOI] [PMC free article] [PubMed] [Google Scholar]
- 57.Molad, Y., K. A. Haines, D. C. Anderson, J. P. Buyon, and B. N. Cronstein. 1994. Immunocomplexes stimulate different signalling events to chemoattractants in the neutrophil and regulate L-selectin and beta 2-integrin expression differently. Biochem. J. 299:881–887. [DOI] [PMC free article] [PubMed] [Google Scholar]
- 58.Hanley, W., O. McCarty, S. Jadhav, Y. Tseng, D. Wirtz, and K. Konstantopoulos. 2003. Single molecule characterization of P-selectin/ligand binding. J. Biol. Chem. 278:10556–10561. [DOI] [PubMed] [Google Scholar]
- 59.Tees, D. F., R. E. Waugh, and D. A. Hammer. 2001. A microcantilever device to assess the effect of force on the lifetime of selectin-carbohydrate bonds. Biophys. J. 80:668–682. [DOI] [PMC free article] [PubMed] [Google Scholar]
- 60.Chen, S., and T. A. Springer. 2001. Selectin receptor-ligand bonds: formation limited by shear rate and dissociation governed by the Bell model. Proc. Natl. Acad. Sci. USA. 98:950–955. [DOI] [PMC free article] [PubMed] [Google Scholar]
- 61.Marshall, B. T., M. Long, J. W. Piper, T. Yago, R. P. McEver, and C. Zhu. 2003. Direct observation of catch bonds involving cell-adhesion molecules. Nature. 423:190–193. [DOI] [PubMed] [Google Scholar]
- 62.Evans, E., A. Leung, V. Heinrich, and C. Zhu. 2004. Mechanical switching and coupling between two dissociation pathways in a P-selectin adhesion bond. Proc. Natl. Acad. Sci. USA. 101:11281–11286. [DOI] [PMC free article] [PubMed] [Google Scholar]