

Abstract
The GABA transporter GAT1 removes the neurotransmitter GABA from the synaptic cleft by coupling of GABA uptake to the co-transport of two sodium ions and one chloride ion. The aim of this work was to investigate the individual reaction steps of GAT1 after a GABA concentration jump. GAT1 was transiently expressed in HEK293 cells and its pre-steady-state kinetics were studied by combining the patch-clamp technique with the laser-pulse photolysis of caged GABA, which allowed us to generate GABA concentration jumps within <100 μs. Recordings of transport currents generated by GAT1, both in forward and exchange transport modes, showed multiple charge movements that can be separated along the time axis. The individual reactions associated with these charge movements differ from the well-characterized electrogenic “sodium-occlusion” reaction by GAT1. One of the observed electrogenic reactions is shown to be associated with the GABA-translocating half-cycle of the transporter, in contradiction to previous studies that showed no charge movements associated with these reactions. Interestingly, reactions of the GABA-bound transporter were not affected by the absence of extracellular chloride, suggesting that Cl− may not be co-translocated with GABA. Based on the results, a new alternating access sequential-binding model is proposed for GAT1's transport cycle that describes the results presented here and those by others.
INTRODUCTION
During synaptic transmission, high-affinity neurotransmitter transporters are thought to play a fundamental role in regulating the concentration of neurotransmitter present in the synaptic cleft as a function of space and time (1–4). At GABAergic synapses, reuptake of the inhibitory neurotransmitter γ-aminobutyric acid (GABA) is performed by specific high-affinity secondary transporters, which are expressed in neurons, presynaptic terminals, and glial cells surrounding the synapse (5). Active GABA transport by GAT1 (GABA transporter 1) is driven electrochemically by the concentration gradient of the co-transported ions across the cell membrane and the transmembrane potential. It is generally assumed that GABA uptake is accompanied by the co-transport of two sodium ions and one chloride ion per GABA molecule transported (6–10). However, both the stoichiometry of transport and the involvement of chloride in substrate translocation are still controversial. Although experiments under steady-state conditions showed that extracellular Cl− is not absolutely required for the transport of GABA by GAT1 (11,12), it was also observed that the presence of chloride increases the turnover rate of GAT1 and increases the apparent affinities for the other two co-substrates (13–15). In particular, Loo et al. (12) established a stoichiometry of 1GABA:2Na+ in the presence and absence of chloride that led to the proposal of a Cl−/Cl− exchange mechanism during the GAT1 transport cycle.
Independent of the stoichiometry of chloride co-transport, GABA transport is electrogenic and, thus, associated with inwardly-directed transport currents, which can be studied by using electrophysiological techniques (16). Transport currents can be used as a highly sensitive assay for the function of secondary transporters in general, allowing one to elucidate individual steps in the transport cycle caused by ion binding, ion translocation, and/or associated protein configuration changes that produce electrical signals (see, for example, 16–22).
In the past, transient currents mediated by GAT1 have been detected in response to steps of the transmembrane potential (13,16,20,23) and were attributed to specific partial reactions of the transport cycle. One of these reactions, which was observed in the absence of transported substrates such as GABA, was found to be dependent on the extracellular sodium concentration and has been linked to the binding of sodium ion(s) to an extracellular binding site on GAT1, or conformational changes of the transporter protein linked to Na+ binding. Sodium ions were proposed to bind to the empty transporter, before the interaction with GABA (13,16,20). This Na+-binding reaction is associated with the inward movement of 0.8–1 apparent positive charge, and it is characterized by a time constant in the range of 10–100 ms, its value being strongly dependent on the membrane potential (10,20,24). Therefore, it was proposed that electrogenic Na+ binding accounts for most of the total charge of +1 moved inwardly during a transport cycle and that Na+ binding governs the voltage-dependence of GABA transport at positive and intermediate negative membrane potentials. Additionally, measurements of current relaxations after voltage jumps, applied to giant membrane patches from Xenopus oocytes expressing GAT1 in the nominal absence of substrates on both sides of the membrane, have revealed distinct fast transient currents (<1 ms). It was suggested that these transient currents are generated by the reorientation of the empty transporter substrate binding sites to the outside to allow the rebinding of sodium ions from the extracellular side (20,25). These reactions are inhibited by cytoplasmic chloride and presumably never become rate-limiting for GABA transport.
So far, little is known about the electrogenic properties of reactions that follow GABA binding, such as GABA translocation. Attempts were made by Lu and Hilgemann (20) to restrict GAT1 reactions to the GABA-translocating limb of the transport cycle by applying equilibrium conditions with all three substrates in saturating concentrations present on both sides of the membrane (the so-called exchange transport mode; see Refs. 26 and 27). However, Lu and Hilgemann (20) failed to detect transient currents under these conditions after applying voltage jumps to giant patches of membrane from GAT1-expressing Xenopus oocytes. Accordingly, they postulated an electroneutral reaction for the translocation of substrates across the membrane.
The aims of this work were to investigate in detail individual reaction steps of the transport cycle of GAT1, such as GABA binding and translocation, and ionic movements triggered by or associated with these reactions, and to elucidate the role of chloride in GABA transport by GAT1. To achieve these aims, we applied GABA concentration jumps to the transporter within <100 μs, thus perturbing the pre-existing steady-state, and we analyzed the currents associated with the subsequent relaxations to a new steady-state. Rapid GABA concentration jumps were generated by photolytic release of GABA from α-carboxy-o-nitrobenzyl (αCNB)-caged GABA (28), a nontransportable precursor of GABA. These were combined with patch-clamp measurements to obtain new kinetic information about GABA-induced individual reaction steps in GAT1's transport cycle not yet detected by means of voltage-jump methods (13,14,16). The application of this technique allowed us to detect two GABA-induced steps of the transport cycle and to investigate possible reactions corresponding to the translocation of substrates across the membrane. Using this approach, we demonstrate that the GABA-induced reactions are fast and contribute no more than ∼10% of the charge moved per transport cycle. The results obtained, together with data from voltage-jump experiments, are well described by a sequential alternating access model in which sodium ions and GABA are transported across the membrane without the participation of chloride. It is proposed that Cl− is transported through a different mechanism that simultaneously involves the relocation of the empty binding sites for sodium and GABA of the transporter across the membrane.
MATERIALS AND METHODS
Transient expression of GAT1 and electrophysiological recording
Mouse brain GAT1 (23) subcloned into pcDNA3.1 (Invitrogen, Carlsbad, CA) or pBK-CMV-Δ-(1098–1300) lacking the T3 promoter preceding the multiple cloning site (a kind gift by Dr. Thomas Rauen, from Westfälische-Wilhelms-Universität, Münster, Germany) were used for transient transfection of subconfluent human embryonic kidney cells (HEK293, ATCC No. CRL 1573) with the Effectene transfection method (Qiagen, Hilden, Germany), or the calcium phosphate transfection method, respectively. Both constructs contain the CMV promoter necessary for efficient expression in mammalian cells. Green fluorescent protein (pGreenLantern, Life Technologies, Gaithersburg, MD), was coexpressed for positive selection of transfected cells. The Effectene transfection method was performed with modifications from the supplied protocol: The DNA complexes were formed with 1.8 μg GAT1 cDNA, 0.15 μg green fluorescent protein cDNA, 20 μl enhancer, 50 μl buffer EC, and 25 μl Effectene, total incubation time of 2 h. The calcium phosphate-mediated transfection was performed as described previously (21,29). Electrophysiological recordings were performed 24 h after transfection, for 6–8 h, with an Adams and List EPC7 amplifier (Instrutech, Port Washington, NY) under voltage-clamp conditions in the whole-cell current recording configuration (30). Cells were typically held at −40 or 0 mV during photolysis experiments in the forward or the exchange transport modes, respectively. Recording electrodes were pulled from Clark borosilicate glass and had typical open-tip resistances of 2–4 MΩ. For the study of the sodium-dependent transient currents, voltage jumps with a duration of 300 ms were applied to the cells from a holding potential of 0 mV to transmembrane potentials ranging from −120 to +90 mV (30 mV increments) and back to the holding potential. Data were recorded with a digitizer board, which was controlled by the pClamp6 software (Axon Instruments, Foster City, CA), digitized with a sampling rate of 1 kHz (solution exchange) or 25 kHz (laser-pulse photolysis), and lowpass-filtered at 250 Hz or 3–10 kHz, respectively.
Composition of solutions in the different transport modes employed
Unless stated otherwise, typical bath solutions contained 140 mM NaCl, 2 mM MgCl2, 2 mM CaCl2, and 30 mM HEPES (pH 7.4/NaOH). For ion substitution experiments sodium was replaced by N-methyl-D-glucamine (NMG) or tetramethylammonium (TMA), and chloride was replaced with methanesulfonic acid (MES) or gluconate. Voltage-jump experiments were performed in a bath solution containing 60 mM NaCl, 90 mM TMA-Cl, 2 mM MgCl2, 2 mM CaCl2, and 5 mM MOPS (pH 7.4/NaOH). The blocker SKF-89976A was kindly provided by SmithKline Beecham (Munich, Germany). All the experiments were performed at room temperature.
An illustration of the three transport modes used in this study, namely forward transport, inward exchange mode, and outward exchange mode, is shown in Scheme 1. For the study of the forward transport mode (Scheme 1, left panel), recording pipettes were filled typically with 140 mM KAspartate, 1 mM MgCl2, 10 mM EGTA, and 10 mM HEPES (pH 7.2/KOH, zero-trans conditions). The voltage dependence of the currents was studied with a CsMES-based solution to avoid the activation of HEK293-native ionic channels by voltage (31); under both conditions the currents showed the same general characteristics and similar apparent affinity for GABA. For the electrophysiological investigation of the inward exchange mode the pipette solution contained 140 mM NaCl, 20 mM GABA, 1 mM MgCl2, 10 mM EGTA, and 20 mM HEPES (pH 7.2/NaOH). The bath solution contained 140 mM NaCl, 2 mM MgCl2, 2 mM CaCl2, 30 mM HEPES, and 1 mM caged GABA (pH 7.4/NaOH). In this transport mode, similar concentrations of Na+ were used on both sides of the membrane, and concentrations of GABA were used on the intra- and extracellular side that saturate their respective binding site, thus preventing substrate dissociation on the intracellular side of the membrane. The affinity of GAT1 for cytoplasmic GABA is 2 mM (14). Therefore, we used 20 mM cytoplasmic GABA to ensure saturation of the intracellular binding site (10-fold Km). In contrast, the affinity for extracellular GABA is ∼12 μM (see Results) and 100–200 μM extracellular GABA is sufficient for saturation of this binding site. Initially, GABA was omitted from the extracellular solution. Under these conditions, the high intracellular Na+ and GABA concentrations will drive the majority of GABA binding sites to face the extracellular side, ready to accept extracellular GABA. Subsequently, rapid application of extracellular GABA resulted in a redistribution of these binding sites to reach a new steady state. According to the nature of the inward exchange mode it is not associated with steady-state transport current. However, inwardly-directed transient transport currents were observed when GABA was applied to the extracellular side of the membrane, due to the electrogenic redistribution of Na+ and GABA binding sites within the membrane (shaded arrow in Scheme 1, middle panel). Experiments in the inward exchange mode were also performed in the total absence of chloride on either side of the membrane (replacement with MES).
SCHEME 1.

Illustration of the transport modes employed in this study. A and B represent GAT1 with the substrate binding sites exposed to the extracellular and intracellular side, respectively. G represents GABA and N a sodium ion. Chloride has been neglected for clarity. The shaded arrows show the major direction of the reaction in each transport mode.
Alternatively, in the outward exchange mode, GABA was initially omitted from the cytoplasmic solution, in the presence of saturating concentrations of extracellular GABA and Na+. The majority of the binding sites for GABA will be driven to face the cytoplasm under these conditions. Rapid application of GABA by photolysis of 5 mM αCNB-caged GABA (Molecular Probes, Karlsruhe, Germany) (28) in the intracellular solution (intracellular photolytic release) leads again to a redistribution of the translocation equilibrium, but this time in the opposite direction (Scheme 1, right panel). In this case, the pipette solution contained 140 mM NaCl, 5 mM caged GABA, 1 mM MgCl2, 10 mM EGTA, and 20 mM HEPES (pH 7.2/NaOH). The bath solution contained 140 mM NaCl, 0.5 mM GABA, 2 mM MgCl2, 2 mM CaCl2, and 30 mM HEPES (pH 7.4/NaOH).
Solution exchange and laser-pulse photolysis
Rapid solution exchange and delivery of substrates was performed by means of a quartz tube (350 μm I.D.) positioned at ≈0.2 mm away from the cell with a linear flow rate of 5–10 cm/s. Laser-pulse photolysis experiments were performed as described previously (21,32). Briefly, 1.2 mM αCNB-caged GABA was delivered to the cells in the bath solution and the photolysis of the caged GABA was initiated with a light flash (340 nm, 15-ns pulse duration, excimer laser pumped dye laser, Lambda Physik, Göttingen, Germany) 3 s after cell equilibration with the caged compound. For the ion substitution experiments the concentration of caged GABA was increased to 5 mM to account for the decreased GABA affinity of GAT1 in the presence of low Na+ or Cl− concentrations. For intracellular photolytic release experiments, photolysis was performed after a 15-min waiting period, after establishing the whole-cell configuration to allow complete diffusive equilibration of caged GABA between the recording pipette and the cell interior. The waiting period between photolysis trials was 3 min. The laser light was coupled into a quartz fiber (365 μm in diameter) positioned at ∼200 μm distance from the cell. The laser energy (maximum of 400 mJ/cm2) was adjusted with neutral density filters (Andover, Salem, MA). The released GABA concentration was estimated by comparison of the steady-state current with that generated by rapid perfusion of the same cell with 200 μM GABA (inward transport mode), by using the known GABA dose response curve (see Fig. 1 B). In exchange mode experiments the concentration of photolytically released GABA was saturating, as compared to the forward currents from another cell.
FIGURE 1.
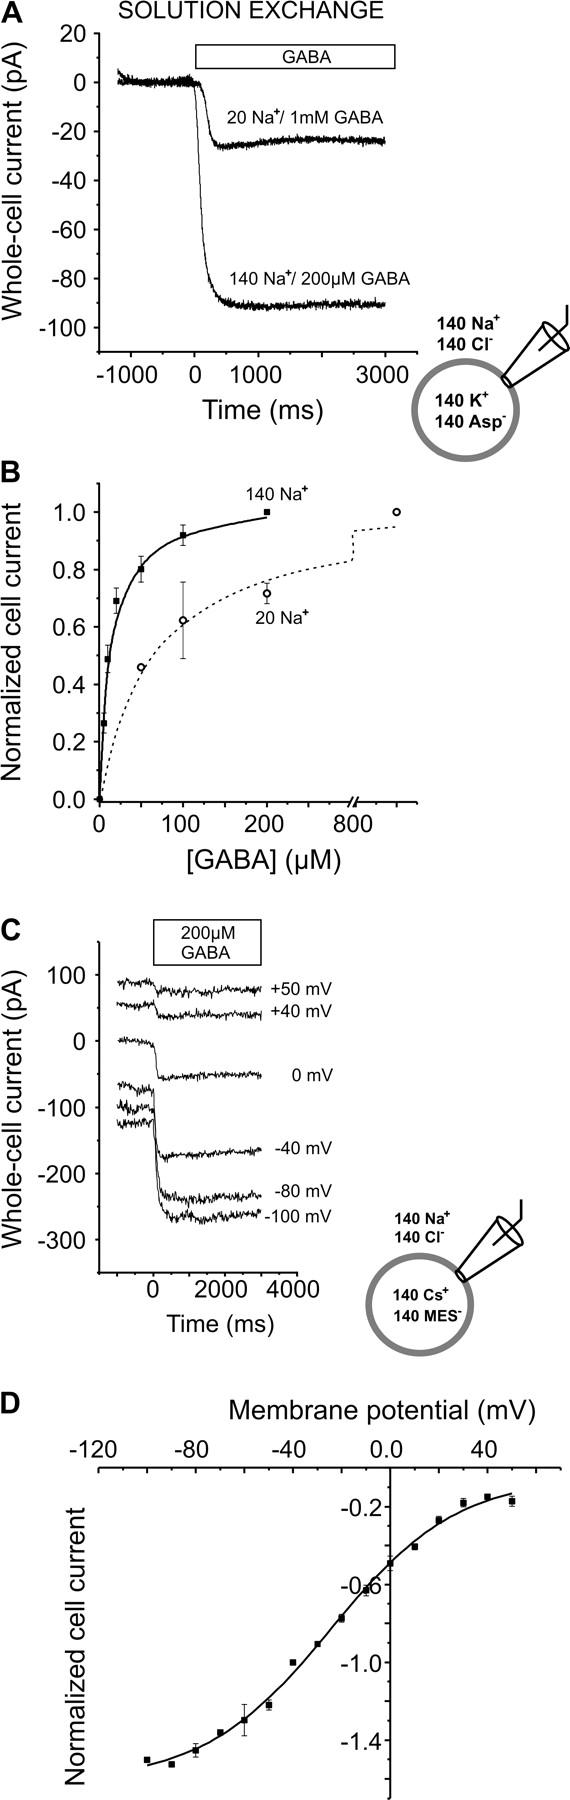
Typical steady-state whole-cell currents induced by application of GABA to HEK293 cells expressing GAT1 in the forward transport mode. (A) Inward currents invoked in the same cell by saturating concentrations of GABA in the presence of 140 or 20 mM external sodium, at −40 mV; the bar indicates the application of external GABA (rapid solution exchange). Leak current was subtracted. The currents were measured with 140 mM intracellular KAsp. (B) [GABA]-dependence of the current in the presence of 140 mM (▪) or 20 mM (○) external sodium; currents were normalized to the amplitude at 200 μM or 1 mM GABA, respectively. Values are means ± SE. The lines are best fits to the data according to the Michaelis-Menten equation, and the apparent Km values found were 12.1 ± 1.1 μM (n = 7 cells) and 66.4 ± 12.7 μM (n = 4 cells) for 140 mM and 20 mM external Na+, respectively. (C) Voltage dependence of the steady-state currents. Typical inward currents obtained from the same cell measured in response to 200 μM extracellular GABA at different transmembrane potentials. The currents were measured with extracellular NaCl and intracellular CsMES and the bar indicates the application period of GABA. (D) Current/voltage relationship of GABA-induced forward transport currents (200 μM), normalized to the current at −40 mV (n = 5 cells); the solid line was calculated according to a Boltzmann function with I1 = −1.61, I2 = −0.047, VI = −24.4 mV, and zI = 0.97. The holding potential in between experiments was −40 mV. Values are means ± SE.
Data evaluation
The forward transport pre-steady-state currents were fitted with a sum of three exponential functions and a steady-state current component (Iss): I(t) = I1* exp (−t/τ1) + I2* exp (−t/τ2) + I3 (−t/τ3) + Iss. Under exchange conditions the transient currents were fitted with one exponential function (characterized by the time constant τH when elicited by extracellular, or τHI by intracellular [GABA]-jumps, respectively) and Iss became zero. Transient currents obtained after voltage jumps were fitted with a single exponential function that decayed with a characteristic time constant of τVM. Experimental values obtained for the voltage dependence of the maximum moved charge were fitted with the Boltzmann-like relationship Q(Vm) = Q1 + Q2 [1 + e(zQ(Vm–VQ) F/(RT))]−1, respectively, where F, R, and T have their usual meaning, VQ is the midpoint potential of the charge movement, zQ is the apparent valence, and Q1 and Q2 are the minimum and the maximum values of the charge movement, respectively. The moved charge was calculated by integrating the transient components of the measured currents. The intrinsic inhibition constant for caged GABA, Ki, was estimated from the competitive inhibition curve (Fig. 3 B) by taking into account that the Km for GABA in the presence of the inhibitor, I, is increased by a factor (1 + [I]/[Ki]); a value of the fractional inhibition, i, can be calculated by using the formula i = [I]/{[I] + Ki(1+[S]/Km)} (e.g., 33). The apparent rate k*GABA of GABA binding to GAT1 was obtained from the slope of the linear dependence of 1/τ3 versus [GABA] at low GABA concentrations where binding is rate-limiting for transport (<10 μM). The intrinsic binding rate of GABA to the transporter, kGABA, was determined assuming a rapid pre-equilibrium approach (34) according to the expression k*GABA = kGABA · {Ki/(Ki + [I])}. Linear and nonlinear regression fits of experimental data were performed with Origin (Microcal, Northampton, MA) or Clampfit (Axon Instruments, Foster City, CA) software. When indicated, the data shown are mean ± SE (n), where n is the number of cells used for a particular experiment.
FIGURE 3.

Electrophysiological characterization of the pharmacological properties of the αCNB-caged GABA. (A) Effect of 1.2 mM caged GABA on steady-state currents induced by 200 μM GABA (n = 2 cells). (B) Inhibitory effect of 5 mM caged GABA on GABA-induced steady-state currents (indicated by the bars); the solid line represents a Michaelis-Menten plot of GAT1 currents in the presence of 5-mM caged GABA. The values are mean values obtained from five cells and the error bars are mean ± SE. (C) Pre-steady-state currents obtained from the same cell with two different CNB-caged GABA concentrations (1 and 0.5 mM) at two different laser energies (165 and 244 mJ/cm2, respectively); the released GABA concentration (∼80 μM) was estimated by comparison of Iss with that generated by rapid perfusion of the same cell with 200 μM external GABA, by using the GABA dose response curve of Fig. 1 B. (D) GAT1 currents induced by a supersaturating GABA concentration jump (50 mM GABA) delivered in the bath solution by means of a rapid solution exchange system. The inset shows the typical 200 μM GABA-induced current from the same cell.
Simulations
Simulations of steady-state and pre-steady-state currents were performed similar to the kinetic analysis by Parent et al. (35) for the sodium/glucose transporter, as pioneered by Läuger and co-workers (36). The transitions occurring between states were modeled according to the Eyring transition-state theory (37) assuming symmetrical energy barriers for each transition. For any given transition between states i and j involving an apparent valence zij, the first-order forward and backward rate constants are given by kij = k°ij · exp (−zijFV/2RT) and kji = k°ji · exp (zijFV/2RT), respectively. The values k°ij and k°ji are the forward and backward rate constants at 0 mV, and V is the membrane potential; F, V, and T have their usual meaning. For transitions involving substrate binding the pseudo-first order rate constants were scaled by the concentration of reactants to the power of the number of molecules involved in the binding reaction. The time-dependent, net transmembrane current in response to GABA is given by the sum of all charge movements that occur within the transmembrane electrical field, which depends on the population of transporter states as a function of time. Accordingly, the current was calculated using the equation I = −F Σ zij · (Pikij – Pjkji), where kij and kji are the forward and the backward reaction rate constants for the transition between any two given states with the fractional population Pi and Pj. The variation of the population of each carrier state as a function of time was calculated by numerically integrating the set of differential equations describing the cyclic reaction scheme (see Fig. 8). For numerical integration of the set of differential equations the Berkeley Madonna software (University of California at Berkeley, CA) was used.
FIGURE 8.

State diagram for an ordered kinetic model that can account for the kinetic properties deduced for GAT1. A and B represent transporter states with the binding sites for GABA and sodium facing the extracellular or the intracellular side, respectively. The extracellular binding of the first sodium to the empty transporter (A ↔ AN) is assumed to increase the apparent affinity for GABA. This reaction accounts for most of the charge transported per forward cycle, it is strongly voltage-dependent and responsible for the voltage-dependence of the steady-state currents at intermediate negative and positive membrane potentials. Under forward transport conditions, the transport cycle proceeds clockwise around the loop with the binding of the second sodium ion (AN ↔ AN2). After the rapid and almost electroneutral binding of one GABA molecule (AN2 ↔ AN2G), the loaded transporter is able to translocate across the membrane to expose sodium and GABA binding sites to the intracellular side (AN2G ↔ BN2G). The results do not provide information about the sequence of intracellular release/binding of substrates; a simplification of these reactions was made in which they were lumped together as a single transition that includes the release/binding of two sodium ions and one GABA molecule to the cytosol (BN2G ↔ B). At very negative potentials this reaction is assumed to become rate-limiting for the steady-state turnover. The transport cycle proceeds via two different pathways: through the reactions leading to the fast translocation of chloride across the membrane (BC ↔ AC) and/or by the slow reorientation of the empty carrier (B ↔ A). In the presence of extracellular chloride the equilibrium (A ↔ B ↔ BC) is rapidly shifted to form the intermediate BC. In the absence of extracellular chloride, with saturating GABA and sodium concentrations, the reorientation of the empty transporter in the membrane is assumed to become the rate-limiting step for forward transport. The translocation of chloride to the intracellular side of the membrane occurs via a reaction independent of the GABA- and Na+-induced reactions (BC ↔ AC) that simultaneously exposes the biding sites for sodium and GABA to the extracellular side. It is here proposed that chloride binds to the transporter before the other substrates. In this interpretation chloride is not directly involved in the reaction steps that the protein undergoes to translocate the substrate across the membrane, but the external binding of a chloride ion facilitates the relocation of the empty transporter and increases the number of proteins ready to bind sodium (and subsequently GABA), increasing in this way the apparent affinity of GAT1 for sodium and GABA. k12, k21…, are the rate constants for the different transitions; z12, z23…, are the corresponding apparent valence values. The experimental data could be well described with the following set of parameters: k120 = 0.5 M−1 ms−1, k210 = 0.01 ms−1, z12 = 0.9, k230 = 10 M−1 ms−1, k320 = 0.1 ms−1, z23 = 0.1, k340 = 10,000 M−1 ms−1, k430 = 1 ms−1, z34 = 0, k450 = 1 ms−1, k540 = 1 ms−1, z45 = 0.2, k560 = 0.3 ms−1, k650 = 1e+6 M−3 ms−1, z56 = 0.2, k160 = 0.02 ms−1, k610 = 0.005 ms−1, z61 = −0.215, k670 = 200 M−1 ms−1, k760 = 10 ms−1, z67 = 0.01, k780 = 0.4 ms−1, k870 = 0.02 ms−1, z78 = 0.005, k810 = 50 ms−1, k180 = 150 M−1 ms−1, and z81 = −0.2. The total concentration of the transporter in the membrane was considered constant (A + AN + ANG + AN2G + BN2G + B + AC + BC = 1) and as starting conditions it was assumed that A = AN = AC = 0.33 (for both forward and inward exchange transport modes). However, to achieve a real pre-steady-state, the populations of A, AN, and AC were allowed to equilibrate before the virtual GABA concentration jump was applied.
RESULTS
Steady-state GAT1 currents in the forward transport mode
Steady-state currents of the GABA transporter GAT1 were studied by means of a rapid solution exchange method. Although nontransfected cells showed no current signals in response to the application of extracellular GABA, GAT1 transfected cells exhibited GABA-induced currents as shown in Fig. 1 A, which could be fully inhibited by co-application of 100 μM SKF-89976A, a specific GAT1 blocker (38). In the presence of infinite concentration gradients of the substrates across the membrane (forward transport mode, zero-trans conditions) these currents were inwardly directed, as expected from the proposed GAT1 stoichiometry (2Na+:1Cl−:1GABA) (7,8). The currents were dependent on the GABA concentration and saturated with an apparent Km value of 12.1 ± 1.1 μM (n = 7, Fig. 1 B), an indication that GABA is transported by GAT1 with high affinity. This Km value is in the same range as those previously described for GAT1 by others (4.7, 3, 15 μM) (8,9,12). Reducing the external sodium concentration from 140 to 20 mM caused a decrease in the apparent affinity of the transporter for GABA, the apparent Km value becoming 66.4 ± 12.7 μM (n = 4, Fig. 1 B). This effect of the Na+ concentration on GABA affinity has been previously reported by others (12,16). In addition, the reduced extracellular sodium concentration resulted in a reduction of the maximum current amplitude at saturating GABA concentrations (1 mM, Fig. 1 A).
Next, we determined the steady-state current-voltage (Iss/Vm) relationship of GAT1 in the forward transport mode. The averaged data from five cells are shown in Fig. 1 D. The steady-state current increases with increasingly negative membrane potential and does not reverse at positive potentials, as expected for the zero-trans conditions applied here. At the most negative membrane potentials used (Vm < −100 mV), the Iss curve begins to level off, as previously observed for GAT1 expressed in Xenopus oocytes (8,20). Taken together, the data obtained at steady-state conditions agree well with data previously published for GAT1 expressed in other expression systems, such as Xenopus oocytes and HeLa cells.
Pre-steady-state GAT1 currents in the forward transport mode
GABA-induced pre-steady-state currents catalyzed by GAT1 were studied by means of GABA concentration jumps generated within 100 μs via the laser-induced photolysis of αCNB-caged GABA. The photolysis reaction that generates free GABA with a time constant of 28 μs is shown in the top panel of Fig. 2 (28). The photolytic release of GABA from 1.2 mM caged GABA generates a whole-cell current of the same steady-state amplitude as that activated by flow application of 200 μM GABA (Fig. 2, A and B), suggesting that saturating substrate concentration jumps can be generated by using this method. Due to the at-least 100-fold higher time-resolution compared to the flow method (21,28) and the presence of a competing nontransported substrate (caged GABA), the photolysis-induced current shows a different time dependence and reveals additional information not seen in the solution exchange experiment, in particular the early reactions of the transport cycle initiated by GABA binding to the transporter (notice the different timescales in Fig. 2, A and B). The effects of caged GABA competition on the time dependence of the transport currents will be discussed in the next section. The pre-steady-state currents show a very fast outward transient current component (phase a), which is not resolved by the method's time resolution, followed by a rapid inwardly-directed phase (phase b). Finally, a slower relaxation process (phase c) to a new steady-state level (Iss) of the current is observed, that is characterized by a current rise. The time course of the pre-steady-state currents of the transporter (corresponding to the currents assigned to phases b and c) could be well described by a sum of three exponential functions and a steady-state current component (see Materials and Methods) and the values found for the respective time constants were τ1 = 0.27 ± 0.1 ms, τ2 = 2.8 ± 0.4 ms, and τ3 = 11.4 ± 0.8 ms (n = 9) at −40 mV transmembrane potential and at saturating GABA concentration.
FIGURE 2.

Typical whole-cell currents induced by GABA in HEK293 cells expressing GAT1, at Vm = −40 mV in the forward transport mode. (A) Steady-state currents measured in response to the application of 200 μM external GABA (rapid solution exchange) at t = 0. Currents were measured with internal 140 mM KAsp and external 140 mM NaCl buffers. (B) Typical pre-steady-state currents induced by the photolytic release of GABA (170 μM, t = 0) from 1.2 mM αCNB-GABA (hν, arrowhead) triggered a fast outward transient current (a), followed by a rapid inwardly directed component (b), and a slow relaxation component (c) to the steady-state level of current (Iss). The time constants τ1, τ2, and τ3 indicated were obtained from fitting the data relative to b and c with a sum of three exponential functions (τ1 = 0.27 ± 0.1 ms, τ2 = 2.8 ± 0.4, and τ3 = 11.4 ± 0.8, n = 9 cells, solid line). The upper panel shows the photolytic release reaction of GABA from its caged precursor. The laser energy was ∼400 mJ/cm2. The cells were equilibrated for 3 s with the αCNB-GABA bath solution before the laser flash. The leak current was subtracted. (C) Photolysis control experiments. Effect of a laser flash on the activation of the pre-steady-state currents in a nontransfected cell (in the presence of αCNB-GABA, upper trace) and in transfected cells in the absence of αCNB-GABA (control), and in the presence of 1 mM GABA or 100 μM SKF-89976A (co-delivered with the αCNB-GABA), as compared with a positive control (three lower traces).
To exclude the possibility that the electrical signal obtained upon photolysis of caged GABA could be due to an unspecific response of the cell to the caged substrate or photolysis by-products, control photolysis experiments were performed on nontransfected cells in the presence of caged GABA (n = 2), without any currents being elicited (Fig. 2 C, upper trace). To further eliminate possible artifacts due to the interaction of the transporter molecule itself with the light flash, the transfected cells were submitted to laser flashes in the absence of caged GABA, and did not show a light-induced signal (n = 6, Fig. 2 C). Furthermore, both laser flash-induced transient currents and Iss were fully inhibited by pre-applying 100 μM of the specific GAT1 inhibitor SKF-89976A (38) together with caged GABA, as expected from the competitive inhibition mechanism (n = 4, Fig. 2 C). A similar experiment was performed by pre-equilibrating the cell with a super-saturating concentration of GABA (1 mM) together with the caged-GABA (n = 2, Fig. 2 C). Again, photolysis-induced currents were completely abolished. This result is in agreement with the idea that under these experimental conditions most GAT1 molecules have their GABA-binding sites occupied by substrate and should not respond to an additional release of GABA after photolysis. Together, the results presented in Fig. 2 C demonstrate that the observed pre-steady-state currents are due to the presence of GAT1 transporters in the membrane of the HEK293 cells.
Biological properties of αCNB-caged-GABA
The αCNB-caged GABA was used in this study for the first time to investigate GAT1 reactions elicited by GABA concentration jumps generated by a laser flash. There are several examples reported of competitive inhibition of the biological system under investigation by the respective caged compound (39–41). In particular, αCNB-GABA is known to inhibit ionotropic GABA receptors (42). For this reason, the possibility that caged GABA binds to GAT1, thus acting as a competitive inhibitor, was investigated. The application of 200 μM GABA in either the absence or the presence of 1.2 mM caged GABA (a typical concentration used in the experiments) elicited the same steady-state current amplitude (Fig. 3 A). To test whether the absence of an inhibitory effect under these conditions may be due to the high concentration of free GABA (200 μM) preventing caged GABA from binding to GAT1, steady-state experiments were performed in which the concentration of caged compound was increased and the free GABA concentration was varied. A bath solution containing 5 mM caged GABA was co-applied with free GABA at different concentrations, ranging from 100 to 500 μM. Under these conditions, an inhibitory effect by the caged compound on the currents was observed, in particular in the presence of lower concentrations of free GABA. An inhibition curve is shown in Fig. 3 B. The data (n = 5) were fitted with a Michaelis-Menten function from which the Km for GABA in the presence of inhibitor,  for competitive inhibition was found. An intrinsic inhibition constant, Ki, of 225 μM for caged αCNB-GABA (in the absence of free GABA) was estimated from these data (see Materials and Methods). The thermodynamic constants for GABA binding and caged GABA binding to GAT1 are summarized in Table 1. According to a competitive inhibition mechanism it is expected to have populations of transporter molecules before the photolytic release of GABA with and without caged compound bound to the substrate binding site, in the presence of inhibitory concentrations of caged GABA. Accordingly, values of fractional inhibition can be calculated (see Materials and Methods). With a Ki of 225 μM, ∼84% of the transporters are bound to the inhibitor (1.2 mM caged GABA) before a laser pulse. After equilibration after a ∼200 μM GABA concentration jump only 23% of the transporters are expected to be in the inhibitor-bound form. This estimation shows that under the experimental conditions used here most of the caged compound is removed from the binding site after photolysis. At any fixed nonsaturating concentration of inhibitor (caged-GABA) it should be possible to drive all the transporter molecules to the GABA-bound form by applying higher GABA concentrations and to achieve the same current as in the absence of the inhibitor. It is expected that the released GABA concentration is large enough to compete off the inhibitory effect of the caged GABA to obtain saturated transporter steady-state current. This idea holds even in the presence of high caged GABA concentrations (5 mM) when the estimated concentrations of photolytically released GABA are ∼0.5–1 mM.
TABLE 1.
Thermodynamic and kinetic constants derived for GABA binding and caged GABA binding to GAT1
| Km [μM] Apparent affinity for GABA |
 Apparent affinity for GABA in presence of 5 mM caged GABA Apparent affinity for GABA in presence of 5 mM caged GABA |
Ki [μM] Intrinsic affinity for caged GABA | k*GABA [μM−1 s−1] Apparent rate of GABA binding | kGABA [μM−1 s−1] Intrinsic rate of GABA binding |
|---|---|---|---|---|
| 12.1 ± 1.1 | 278 ± 150 | 225 | 0.9 ± 0.1 | 5.9 |
Although dissociation of caged GABA from the transporter is most likely fast, because of its relatively low affinity, the data presented so far do not exclude the possibility that caged GABA dissociates slowly, thus retarding GABA binding to GAT1 after photolytic release. Therefore, it was tested whether the displacement of the caged GABA molecules from the GAT1-caged GABA complex by free GABA causes a delay of the current rise, thus influencing the shape of the observed pre-steady-state currents as a function of time. The interaction of αCNB-caged GABA with GAT1 and its effect on the transient currents was studied by comparing the currents obtained from cells to which two different concentrations of caged GABA (1 and 0.5 mM) were applied and the laser light intensity was varied by means of different neutral density filters in such a way as to cause the release of similar concentrations of free GABA (∼80 μM). Under these conditions, it would be expected that the time course of the current rise would be slowed when the same concentration of GABA is released from a higher concentration of caged precursor. In contrast to this expectation, there were no observable differences between the time courses of the pre-steady-state currents generated by release from 0.5 or 1 mM αCNB-GABA, indicating that they depend only on the amount of available free GABA. With 250 μM αCNB-GABA and using the light energy levels tolerated by GAT1-HEK293 cells without losing the giga-seal, smaller amounts of free GABA were released but all transient current steps were present (n = 4, not shown). Together, these experiments demonstrate that, although the αCNB-GABA acts as a competitive inhibitor of GAT1 activity, the released GABA concentrations rapidly displace caged GABA from its binding site. Therefore, this caged compound can be used for the study of GAT1's GABA-induced pre-steady-state kinetics. In agreement with this conclusion, pre-steady-state currents with the same characteristics and time dependency were obtained after the photolysis of a newly developed caged GABA derivative, α,4-DCNB (α,4-dicarboxy-o-nitrobenzyl) caged-GABA (K. Schaper, S. Madani Mobarekeh, P. Doro, A. Bicho, and C. Grewer, unpublished results). α,4-DCNB-caged GABA does not inhibit GABA-induced GAT1 currents.
Additional control experiments were performed by generating rapid GABA concentration jumps by means of a fast perfusion system. By flowing a supersaturating concentration of GABA (50 mM ∼4200 × Km) over the cell it is possible to reduce the apparent time necessary to apply a saturating concentration to the GABA transporters in the cell membrane, thus increasing the apparent time resolution of the flow system. A similar approach was detailed by Dilger and co-workers (43) for studying the kinetics of acetylcholine receptor activation. After jumping the GABA concentration to 50 mM a rapid rise of the current was observed, followed by a minor transient current that decays exponentially with a time constant >100 ms to the steady-state current level (n = 3, Fig. 3 D). This minor transient current was absent in the experiments with the lower GABA concentration of 200 μM (Fig. 3 D, inset). An important feature of the current trace obtained with 50 mM GABA by means of fast solution exchange methods is that the transient current is not much larger than the steady-state current, the maximum peak current being ∼20% bigger than the maximum steady-state current level (n = 3 cells). This result is in agreement with the photolysis experiments, indicating that no large transient component, which may have been missed in the photolysis experiments because of inhibition by the caged compound, is induced in GAT1 in response to the GABA concentration jump.
[GABA]-dependence of the pre-steady-state currents
Next, we investigated the effect of the concentration of photolytically released GABA on the different phases of the GAT1 current. The concentration of released neurotransmitter was controlled by using different laser energies for photolysis, adjusted with neutral density filters, and the released GABA concentration was subsequently estimated by comparison of the steady-state current induced by photolysis with that generated by the rapid perfusion of the same cell with 200 μM saturating external GABA, and by using the known GABA dose-response curve of Fig. 1 B (see Materials and Methods). The pre-steady-state currents of a typical cell induced by the photolytic release of different concentrations of GABA are shown in Fig. 4 A. Rapid application of a GABA concentration of 4 μM, which is at the low end of the range of concentrations investigated, resulted in a slow rise of the current to a steady-state level characterized by a time constant of ∼25–20 ms (data from five cells), whereas the two fast phases were absent. This result indicates that GABA binding becomes rate-limiting at these low extracellular GABA concentrations. The dependence of the decay time constants of the pre-steady-state currents on the GABA concentration is shown in Fig. 4 B. In contrast to τ3, which displayed a pronounced GABA concentration-dependence, τ2 was practically unchanged by increasing the GABA concentration. The Michaelis-Menten-like saturation behavior of τ3 is indicative of a two-step process underlying this apparent time constant: a rapid GABA binding process followed by a rate-limiting reaction, possibly a conformational change. Assuming that GABA binding is rate-limiting at low GABA concentrations, the slope of the linear-dependence of τ3 versus [GABA] < 10 μM gives an estimation of the apparent rate constant for the binding of GABA to the transporter, k*GABA. A value of 0.9 ± 0.1 μM−1 s−1 (n = 5 lower concentrations) at −40 mV was found. As shown above (Fig. 3), caged GABA is a competitive inhibitor of GABA-induced transport by GAT1. Therefore, the value found for k*GABA is a lower limit and the GABA binding reaction to the transporter and the intrinsic rate constant for GABA binding to the free transporter is expected to be faster. After the laser flash, caged GABA has to first dissociate from its binding site before GABA can bind to the empty transporter to allow further reactions in the transport cycle to take place, as illustrated in Scheme 2:
FIGURE 4.

[GABA]-dependence of GAT1 pre-steady-state currents in the forward transport mode. (A) Typical whole-cell current recordings of GAT1 after the photolytic release of different concentrations of GABA from 1.2 mM caged GABA (t = 0), with internal 140 mM KAsp and external 140 mM NaCl buffers. The leak current was subtracted. (B) [GABA]-dependence of the relaxation time constants τ2 and τ3. The solid lines represent the fit with a function with the form τ =1/[k1 · [GABA]/([GABA] + Km)+k2] (τ3, with Km = 20 μM GABA) and the results of a linear regression analysis (τ2). The values are mean values obtained from 11 cells and the error bars are means ± SE. (C) [GABA]-dependence of the maximum values of I2, I3, and Iss: the current values were normalized to Iss at 100 μM [GABA]. The solid lines represent the fit of a Michaelis-Menten relationship to the data referring to I3 (•) and Iss (▴), with apparent Km values of 8.1 ± 1.7 μM and 12.1 ± 1.1 μM for I3 and Iss, respectively. The dotted line shows a Michaelis-Menten relationship representing I2 (□). I2 and I3 do not correspond to fitted values, but to the maximum current amplitudes of the different phases. The released GABA concentration was estimated by comparison of Iss with that generated by rapid perfusion of the same cell with 200 μM external GABA, by using the known GABA dose response curve of Fig. 1 B.
SCHEME 2.

Assuming that caged GABA (cGABA) is in rapid equilibrium with the transporter, the apparent rate of GABA binding can be expressed as k*GABA = kGABA Ki/([caged GABA] + Ki).
A similar rapid pre-equilibrium approach was used by Fendler and co-workers (34) to account for the inhibitory effect of caged-ATP on ATP-induced NaK-ATPase currents. Using the known value of Ki (see above), an intrinsic bimolecular rate constant (kGABA) of 5.9 μM−1 s−1 for the binding of GABA to the transporter was calculated (Table 1).
The concentration-dependence of the maximum current amplitudes of the different phases is shown in Fig. 4 C. The values Iss and I3 saturate with comparable apparent Km values of 12.1 ± 1.1 μM (n = 7) and 8.1 ± 1.1 μM (n = 11), respectively. In contrast, I2 is associated with a higher apparent Km of 245 ± 53 μM (n = 11 cells). This result suggests that the Km determined at steady state may not be a good measure of the real affinity of the transporter for GABA, which is most likely lower than previously assumed.
Voltage jump-induced pre-steady-state currents
To estimate the amount of charge moved in the GABA-induced reactions, the charge was calibrated in parallel experiments by using the voltage-dependent Na+ binding reaction to the GABA-free form of GAT1, a process that has been well established and is associated with the inward movement of 0.8–1 apparent positive charge (10,20,24,44). Applying rectangular voltage jumps from a holding potential of 0 mV to −90 and +90 and back to 0 mV to GAT1-expressing HEK293 cells generates transient currents that can be inhibited by 100 μM SKF-89976A delivered in the bath solution. The current traces recorded in the presence of SKF-89976A were subtracted from those in the absence of the drug to isolate GAT1-specific currents. Fig. 5 A shows the difference current obtained from a typical GAT1-expressing cell in the presence and in the absence of inhibitor. To obtain the corresponding amount of charge moved, the OFF transient currents (which exhibited a better signal/noise ratio than the ON signals) were fitted to a single exponential decaying function to obtain the rate constant for the current decay and were subsequently integrated over time to obtain the amount of moved charge. Since the transient current was shown to be capacitive in nature (13), the current integral of the OFF should be identical to that of the ON signal. Although the membranes of GAT1-transfected HEK293 cells became slightly unstable at jumps to +90 mV, as evident by the noisy steady-state component of the current, the current integrals of the ON and OFF signals were generally similar after correcting for the steady-state component. The voltage dependence of the charge movement is shown in Fig. 5 B. It follows a Boltzmann-like charge-voltage relationship, as expected for the Na+-binding reaction (24). The experiments were performed in the presence of 60 mM external sodium. In this way, it was possible to attain an almost symmetric charge distribution with respect to the holding potential of 0 mV, as indicated by the midpoint potential value (VQ) of −9.9 mV found, and the saturation behavior at both hyper- and depolarizing extremes of the Q versus Vm curve. The maximum normalized charge Qmax can be estimated as 79 fC/pA steady-state current. The estimated apparent valence, zQ, is 0.94, which is in good agreement with previous results (20). In the presence of 140 mM external sodium and at a transmembrane potential of 0 mV the first sodium binding site is close to being saturated (13,15,45), as was noticed from the absence of transient currents within the experimental membrane potential range applicable to HEK293 cells. Using the value of Qmax from the Na+ binding reaction for calibration, values for the ratio Q/Qmax of 3 · 10−3 ± 1 · 10−3 for the inwardly-directed phase (I2) and 3 · 10−2 ± 4 · 10−3 for the rising phase of the GABA-induced transient current signal (I3) were calculated (n = 3, Fig. 5 C). These values demonstrate that the GABA-induced charge movements detected here with saturating GABA concentration jumps are small compared to those found for the Na+ occlusion reaction.
FIGURE 5.

Voltage jump-induced pre-steady-state currents. (A) Difference between whole-cell current recordings obtained from one HEK293 cell with +90 and −90 mV voltage jumps in the absence and presence of SKF-89976A. The charge moved in this process was 778 and −259 fC, respectively. The solid lines represent the exponential time course of the currents. The inset represents the correspondent voltage protocol. (B) Voltage dependence of the moved charge in response to a voltage jump, Q(Vm), normalized to Iss evoked by 200 μM GABA (n = 3 cells, values are means ± SE). The solid line was calculated according to a Boltzmann equation (see Materials and Methods) with VQ = −9.9 mV and zQ = 0.94, Q1 = −24 fC/pA and Q2 = 54 fC/pA. (C) Normalized maximum charge movement associated with voltage (QVm) or GABA concentration (Qτ2 and Qτ3) jumps. QVm was calculated by subtraction of the extreme points of the Boltzmann relationship, Q1 and Q2. For the GABA concentration jumps maximum charge movement was estimated at saturating GABA concentrations. The experiments in A and B were performed with external 60 mM NaCl (Na+ substituted with TMA) and with KAsp as internal solution.
[Na+]- and voltage-dependence of the pre-steady-state currents
The sodium concentration-dependence of the GABA-induced pre-steady-state currents was studied by performing photolysis experiments in the forward transport mode at three different extracellular sodium concentrations (140, 20, and 5 mM, NMG-substitution), as shown in Fig. 6 A. At low sodium concentrations, saturating concentrations of GABA (500 μM, Ref. 12) were photolytically released from 5-mM caged GABA, instead of the typical 1.2 mM used in the control experiments in the presence of 140 mM extracellular Na+. At 20-mM external sodium, the GABA-induced pre-steady-state currents are similar to the control currents (at 140 mM Na+), with all the three phases present, albeit with reduced amplitude. A value of 0.45 ± 0.03 and 0.34 ± 0.07 was found for I2 and I3, respectively (n = 4 cells), relative to the control currents at 140 mM Na+. In the presence of 5 mM external sodium (n = 4 cells) and in a nominally sodium-free bath solution (n = 2 cells, not shown) no observable currents were evoked by the photolytic release of GABA. The [Na+]-dependence of the amplitude of the steady-state component of the currents follows the same trend, showing a reduction at low external sodium concentration and being abolished in the absence of Na+. The time constants of the three phases of the pre-steady-state current were quantified in the presence of 20 mM extracellular sodium. No significant changes compared to the time constants observed at 140 mM Na+ were observed for τ1 and τ2 (τ1 = 0.27 ± 0.1 ms, n = 4, and τ2 = 3.4 ± 1.3 ms, eight trials from three cells). In contrast, the reaction step characterized by τ3 became slower. Values ranging from 20 to 98 ms were determined for this time constant from three cells.
FIGURE 6.

Effect of co-transported ions and the membrane potential on transport currents in the forward transport mode. (A) Effect of the extracellular sodium concentration on the GABA-induced pre-steady-state currents. Three typical trials obtained from the same cell at different extracellular sodium concentrations are shown. The currents were measured with internal KAsp and external NaCl (NMG-substitution at low [sodium]). (B) Voltage-dependence of GAT1 pre-steady-state currents. Typical currents from one cell at different membrane potentials; the currents were measured in the presence of internal CsMES and external NaCl solutions. (C) Rate constants (k2 = 1/τ2 and k3 = 1/τ3) as a function of membrane potential. The solid lines are linear fits to the data (log k versus Vm) with slopes of 2.4 × 10⁻³ ± 8 × 10⁻⁴ mV−1 and −2.0 × 10⁻³ ± 9 × 10⁻⁴ mV−1 (for k2 and k3, respectively). The values were obtained from 10 cells and are means ± SE. (D) Effect of chloride substitution on GAT1 pre-steady-state currents. Two trials obtained from the same cell in the presence or nominal absence of extracellular chloride. The currents were measured in the presence of internal KAsp and external NaCl or NaMES solution. In A and D the currents were measured at −40 mV. GABA was released from 1.2 mM (140 mM Na+, Cl− and inset, voltage-dependence) or 5 mM caged GABA (low Na+, 0 mM Cl−) by laser photolysis at t = 0. The leak current was subtracted.
Additional relevant information about the electrogenic reactions of transporter proteins can be obtained by comparing the characteristics of these reactions at different transmembrane potentials (17,21,22,35,46). Therefore, the effect of voltage on GAT1 pre-steady-state currents was investigated in the forward transport mode. Fig. 6 B shows typical currents obtained after the photolytic release of GABA as a function of the transmembrane potential. Although the amplitude of the steady-state component (Iss) of the GABA-induced currents is still increasing with hyperpolarization between −40 and −60 mV (compare also with Fig. 1 D), the values for the time constants show little variation over the entire range of negative potentials. At positive potentials the currents become too small (or alternatively too slow), to be fitted with accuracy. The relaxation rate constants 1/τ2 and 1/τ3 are shown at different membrane potentials in Fig. 6 C. The voltage dependence of the logarithm of these rate constants can be quantitatively described by linear regression analysis with slopes of 2.4 × 10⁻³/mV and −2.0 × 10⁻³/mV for 1/τ2 and 1/τ3, respectively. This demonstrates that the electrogenic reactions causing the respective currents are either only very weakly electrogenic (consistent with the respective moved charge found above from the calibration with the Na+ binding transient) or that they may be rate-limited by an electroneutral reaction. The corresponding fraction of the transmembrane electric field sensed by these processes, if a total of +1 charge was moved, is 0.29 (1/τ2) and 0.24 (1/τ3). Additionally, as can be seen in Fig. 6 B, the peak current value I2 corresponding to the individual reaction characterized by τ2, reaches its maximum absolute value at potentials less negative than the steady-state current (n = 4; compare also with Fig. 1 D). This result, together with the weak voltage-dependence of the corresponding time constant, indicates that, even when increasing the rate of sodium binding by changing the membrane potential to more negative values, this individual reaction would be unlikely to become slow enough to be rate-limiting for the transport cycle.
Pre-steady-state currents in the absence of extracellular chloride
It has been proposed previously that extracellular chloride is required for GABA transport by GAT1 and that translocation of one GABA molecule is linked to the co-transport of one Cl− ion (8–10). In contrast, in another report it was observed that no net inward transport of Cl− takes place when GAT1 is activated by GABA, but that chloride is transported in a Cl−/Cl− exchange mechanism (12). In an attempt to understand the requirement of chloride for GABA transport, the effect of the extracellular chloride concentration on the GABA-induced pre-steady-state currents was investigated. In analogy to the experiments at low sodium concentration described above, GABA was photolytically released from 5 mM caged GABA, instead of the typical 1.2 mM to counterbalance the decrease of GAT1's affinity for GABA in the absence of external chloride (12). The results are presented in Fig. 6 D, which shows the currents obtained in nominally Cl−-free bath solution after the photolytic release of GABA in comparison with the signal in the presence of chloride (140 mM external Cl−). Unexpectedly, in the nominal absence of external chloride GABA can still bind to the transporter and evoke transient current. In contrast, the steady-state (Iss) component of the current is negligible, as expected in the absence of chloride (11,12), and the slow rise to the steady-state characterized by τ3 is no longer detectable, being either slowed down or absent (n = 5). Furthermore, the inset in Fig. 6 D shows that the photolytic release of nonsaturating GABA concentrations (∼25 μM) does not evoke pre-steady-state currents (n = 3). These experiments show that GABA can bind to the transporter in the absence of extracellular chloride but that chloride modulates GAT1's responses to GABA concentration jumps.
Pre-steady-state currents in the inward and outward exchange transport modes
To assign the GABA-induced transient currents to specific reactions in the GAT1 transport cycle, photolysis experiments were performed in the inward exchange transport mode. In this transport mode, the population of transporter states can be restricted to the substrate-translocation limb of the transport cycle. Before photolysis, Na+ and Cl− were present on both the intracellular and extracellular sides at concentrations of 140 mM, and 20 mM GABA was present at only the intracellular side, saturating the cytosolic GABA binding site of GAT1. Under these conditions, the absence of extracellular GABA should result in a translocation equilibrium and a GABA binding equilibrium shifted to a form in which the majority of GABA binding sites are exposed to the extracellular side, due to the law of mass action (Scheme 1, middle panel). Subsequently, the cells were equilibrated with extracellular caged-GABA and an external GABA concentration jump by photolysis initiated the re-equilibration of the GABA binding sites to face either the extracellular side or the intracellular side of the membrane without completing a full transport cycle. While this re-equilibration takes place, it is possible to observe charge movements that are associated with the GABA translocation branch of the transport cycle. The results from this experimental strategy are shown in Fig. 7 A. In HEK293 cells expressing GAT1, the photolytic release of ∼100 μM GABA at 0 mV (calibrated from the forward transport currents measured from another cell at the same conditions) induced an inwardly-directed transient current, which was inhibited by 100 μM SKF-89976A (n = 2), and which decayed with a single-exponential behavior with a characteristic time constant of τH = 2.9 ± 0.6 ms (n = 7, Fig. 7 A). As expected from the inward exchange conditions, there is no directional cycling of the transporter (Scheme 1, middle panel) and, therefore, no steady-state (Iss) current was observed. Accordingly, the slow rising phase (I3) observed in the forward transport mode (see Fig. 2 B) was absent from the recordings under exchange conditions. To test whether true exchange conditions were established, we repeated the experiment shown in Fig. 7 A, but in the sole presence of 20 mM GABA at the intracellular side (0 mM NaCl internal, replaced with NMG-MES). It had been shown by Lu and Hilgemann (14) that internal GABA does not trans-inhibit forward GABA transport in the absence of cytosolic sodium. Consistently, application of 100 μM GABA to GAT1 under these conditions resulted in a current signal with large steady-state component (41 ± 20 pA, n = 6) and a time-course indistinguishable from that observed under forward transport conditions in the absence of intracellular GABA, demonstrating that the sole presence of GABA at the intracellular side is not sufficient to attain exchange conditions.
FIGURE 7.

Pre-steady-state currents recorded in the exchange transport modes. Typical whole-cell transient currents elicited at t = 0 by the photolytic release of GABA from the extracellular (A, inward exchange mode, 140 mM NaCl and 20 mM GABA internal, 140 mM NaCl external) or intracellular (B, outward exchange mode, 140 mM NaCl and 0.5 mM GABA external, 140 mM NaCl internal) sides, respectively. The corresponding time constants τH = 2.98 ± 0.6 ms (n = 7, solid line) and τHI = 5.8 ± 1.0 ms (n = 5, solid line) were obtained from the best single-exponential fit to the data in A and B. (C) [GABA]-dependence of currents recorded in the inward exchange mode: two trials from the same cell with extracellular release of 100 or 40 μM GABA. (D) Effect of extracellular chloride concentration on currents in the inward exchange mode: two trials from the same cell in the presence or nominal absence of external Cl− (the internal solution was Cl−-free). (E) Effect of [Na+] and membrane potential on inward exchange currents. Several trials from the same cell with external sodium concentrations of 20 mM and 140 mM are shown. The membrane potential was typically held at 0 mV and with low [sodium] it was varied between 0 and −80 mV. The pipette solution was chloride-free (MES substitution) and contained 20 mM GABA. (F) Ratio Q20 (20 mM Na+)/Q140 (140 mM Na+) at different transmembrane potentials (data from five cells, shaded bars) in the inward exchange mode. The dotted line marks the ratio value at 0 mV in comparison with the charge obtained with 140 mM external Na+ at the same transmembrane potential (0 mV, white bar). (G) Voltage-dependence of the normalized charge with 140 mM (▪) (n = 5 cells) or 20 mM extracellular Na+ (○) (n = 7 cells) in the inward exchange mode. All values were normalized to the charge obtained with 140 Na+ at 0 mV. The error bars are means ± SE. The internal solution contained 140 mM NaCl (or MES as Cl− substitute in D) and 20 mM GABA. The external NaCl solution (NMG-substitution at low sodium) contained 500 μM GABA. GABA was typically released from 1.2 mM caged GABA or from 5 mM caged GABA (intracellular GABA, 20 Na+, 0 Cl−). The concentration of photolytically released GABA was saturating (300–400 mJ/cm2, as compared to the forward transport currents from another cell). Unless otherwise indicated, the membrane potential was 0 mV.
The transient currents observed after extracellular GABA application in the inward exchange transport mode were further investigated by varying the concentrations of the substrates GABA, Na+ and Cl−. Lowering the extracellular GABA concentration from 140 μM to a concentration of 40 μM caused a reduction of the amplitude of the transient currents without a clear effect on τH (n = 2). Two trials from the same cell are shown in Fig. 7 C; the amplitude of the currents obtained with 40 μM released GABA were decreased approximately threefold when compared to those with 140 μM GABA. This result is consistent with the one found in the forward transport mode for the GABA concentration dependence of I2 and τ2, where the amplitude of the peak current was dependent of the GABA concentration but not the time constant. The currents recorded in the inward exchange transport mode were also investigated in the nominal absence of extra- and intracellular chloride (MES substitution). Fig. 7 D compares two traces from the same cell in the presence and in the absence of chloride. The time constant found in the nominal absence of chloride, 3.5 ± 0.9 ms (n = 5 cells), was similar to the one found in its presence, indicating that chloride is not directly involved in generating the electrogenic steps associated with the translocation branch of the GAT1 transport cycle. The currents observed in the absence of chloride were also completely inhibited by 100 μM SKF-89976A (n = 2, data not shown).
The effect of the extracellular Na+ concentration on the pre-steady-state currents in the inward exchange transport mode is shown in the two upper traces of Fig. 7 E. With saturating release of GABA, lowering the typical 140 mM extracellular Na+ concentration to 20 mM (n = 8) caused a reduction of the amplitude and the charge associated with the inward transient current (Q20/Q140 = 0.49 ± 0.01 at 0 mV, n = 4 cells, Fig. 7 F), without an apparent modification of the time constant τH. Furthermore, the voltage dependence of the pre-steady-state currents in the inward exchange transport mode in the presence of 140 mM extracellular sodium was investigated and compared to the voltage dependence of Ips in the forward transport mode. Within the range of potentials investigated (−40 to + 40 mV), no effects of the membrane potential were observed on either the amplitude or the time constant (τH) of the pre-steady-state currents. This result is consistent with the absence of an effect of the membrane potential on the moved charge, as shown in Fig. 7 G (solid squares).
Since the GABA-induced pre-steady-state current was dependent on the Na+ concentration, the possibility was considered that the equilibrium of the electrogenic reaction generating this current is shifted at all potentials toward a fully sodium-bound state, thus making it impossible to observe any voltage dependence of the charge movement. If this is the case, one would expect to shift the voltage dependence of the reaction by reducing the extracellular sodium concentration. To test this hypothesis, the voltage dependence of the currents was investigated in the presence of 20 mM extracellular Na+. The result of this approach is shown in the three lower traces in Fig. 7 E. After photolytic release of saturating external GABA concentrations (∼150 μM GABA), holding the cell membrane at increasingly negative potentials caused a significant increase of the maximum amplitude of the inward transient current, without causing a variation of the respective time constant, τH. Consistently, the moved charge increased with increasingly negative potentials as shown in Fig. 7 G (open circles). At positive membrane potentials GABA-induced transient currents were not detected (n = 3). This behavior of the transient transporter currents can be explained by the [Na+]-dependent availability of transporters that can bind GABA, which is determined by the relative population of sodium-bound GAT1 molecules before photolysis. As shown above, sodium ion binding to GAT1 is a strongly membrane-potential dependent process that favors the Na+-bound states at negative membrane potentials. Supporting this suggestion is the increase of the ratio of the charge measured with 20 mM and 140 mM extracellular sodium (Q20/Q140) with increasingly negative potentials (Fig. 7 F).
Finally, to determine charge movement induced by GABA outward translocation, transient currents were elicited by applying a GABA concentration jump to the intracellular side of the membrane in the presence of 500 μM GABA in the extracellular bath solution (Fig. 7 B). Taking into account the discrepancy between the apparent affinities of GAT1 for extra- and intracellular GABA (14), these experiments were performed with an external GABA concentration of 500 μM, and 5 mM caged GABA was included in the NaCl-containing intracellular pipette solution. In the absence of intracellular free GABA it is expected that most of the transporter molecules are exposing their binding site for GABA to the intracellular side before the light flash. Accordingly, the transient current observed was outwardly directed and relaxed exponentially with a time constant τHi = 5.8 ± 1.0 ms (n = 5), at 0 mV membrane potential. The specific GAT1 inhibitor SKF-89976A, when applied in micromolar concentrations to the bath solution, produced a complete inhibitory effect on these currents (100 μM, n = 2). The inhibition mechanism from the trans (extracellular) side of the membrane is in agreement with a competitive inhibition mechanism. This locks the transporter in a configuration with the binding sites facing the extracellular side of the membrane, and consequently the transporter is not available to bind intracellular GABA.
DISCUSSION
This report highlights two novel findings regarding the molecular mechanism of GABA transport by GAT1. First, our data provide evidence that the substrate-induced GABA transporter reaction consists of multiple individual reaction steps. The laser-pulse photolysis method applied here to GAT1 allowed us to detect these partial reactions with high accuracy and to determine the associated rate constants. Two rapid reactions were identified that are induced by GABA binding to GAT1. These reactions are only weakly electrogenic. A third, slower, but strongly electrogenic reaction, which is inhibited by GABA binding and only observed in voltage-jump experiments, was already characterized in previous reports and is associated with the formation of GAT1/Na+ complex (Na+-occlusion) in the absence of GABA (10,20,24). This complex formation is believed to generate a high-affinity binding site for GABA on the transporter (24). Second, our data suggest that the presence of extracellular chloride is not required for GABA translocation, leading us to the proposal of a revised mechanistic scheme for Cl− co-transport by GAT1 (see below).
Assignment of the transient transport currents to partial reactions in the transport cycle
Several lines of evidence suggest that the partial reactions detected here are different from the well-characterized Na+-occlusion reaction that appears to be responsible for the majority of the GAT1 electrogenicity (10,20,24). First, the rate constants of the GABA-induced reactions reported here are faster than those observed for Na+-occlusion (20). At −40 mV we find a rate of 40 s−1 for the Na+-occlusion reaction, whereas the GABA-induced reactions show rate constants of 90 s−1 and faster. Second, the rapid substrate-induced charge movements are considerably smaller in magnitude than the ones associated with Na+-binding. We have estimated that <10% of the total charge transported in one transport cycle is moved in these reactions (Figs. 5 and 6), whereas Na+ occlusion has an apparent valence of 0.8–1.0 (Fig. 5) (13,16). Third, at an extracellular Na+ concentration of 140 mM and at −40 mV transmembrane potential the Na+ binding equilibrium should be shifted predominantly to the Na+-bound form of the transporter. Thus, unless the extracellular Na+ concentration is lowered, GABA binding is not expected to affect this equilibrium and induce major charge movements associated with Na+ occlusion.
We suggest that the rapid GABA-induced inward charge movement occurring in the millisecond time range (characterized by τ2) is caused by an electrogenic partial reaction associated with the translocation limb of the transport cycle. The main experimental evidence for this assignment is based on the existence of this rapid charge movement when the transporter is restricted to populate states in the GABA translocation branch of the cycle, as established under inward exchange conditions. Accordingly, a similar transient current in the opposite direction can be induced by applying a GABA-concentration jump, under similar experimental conditions, to the intracellular side of the membrane in the outward exchange mode, inducing the movement of the same charge in the outward direction.
Note also that the magnitude of the GABA-induced inward charge movement is modulated by the extracellular Na+ concentration, but only under conditions under which the first extracellular Na+ binding site is not saturated. Taking these data together, it appears likely that the inwardly-directed rapid charge movement is caused by the actual translocation of the GABA-loaded carrier across the membrane to expose the binding sites for the substrate and Na+ to the intracellular side, whereas the outward charge movement initiated by GABA application to the intracellular side represents the same process in the opposite direction. How does this assignment compare to previous results obtained by other groups? Up to now, only Lu and Hilgemann (20) had tried to resolve charge movements of the fully loaded transporter in giant membrane patches from Xenopus oocytes via both voltage and concentration jumps, but no clear current signal was identified in the presence of GABA. This lack of charge movement was attributed to electroneutrality of the GABA-dependent reactions of GAT1. Consistent with these observations, it was shown here that the apparent moved charge associated with the GABA translocation process is comparatively small with respect to the charge moved during the voltage-dependent sodium occlusion reaction (Fig. 5) and that this reaction shows little voltage-dependence (Fig. 6). These are probably the reasons why Lu and Hilgemann failed to observe any currents in response to voltage jumps in the exchange mode. The identification of rapid electrogenic steps in the GABA translocating branch of GAT1 is, therefore, one of the major findings of this work.
We also cannot fully exclude that the rapid charge movement is generated by GABA binding to GAT1. However, since the GABA molecule is not charged and because the concentration dependence of τ2 is not consistent with a bimolecular binding process, this interpretation is less likely.
In addition to the rapidly-decaying transient current, a slower rising phase of the current was detected in the forward transport cycle, which is characterized by the time constant τ3 = 11.4 ms. This phase of the current is strongly dependent on the extracellular concentration of GABA (Fig. 4) and sodium (Fig. 6), becoming very slow at low concentrations of either of these two substrates. At low concentrations of GABA (<10 μM), substrate binding becomes rate-limiting. Therefore, the current rising phase reflects GABA binding under these conditions. However, at higher GABA concentrations (>50 μM) substrate binding should no longer be rate-limiting for the rising phase, as shown by the leveling-off of τ3 at high GABA concentrations (Fig. 4 B). Furthermore, this current phase is almost absent in a nominally extracellular chloride-free solution (Fig. 6). One possible, straightforward interpretation of these results would be that the current rising phase is related to electrogenic chloride binding from the extracellular side induced by GABA to the transporter. However, this interpretation is not consistent with observations by others that chloride already affects the affinity of the first sodium ion binding to the transporter in the absence of GABA (20). If Cl− reacted only with the GABA-bound form of GAT1, such a modulation of Na+ affinity by the chloride concentration would not be expected.
The idea of electrogenic, GABA-induced chloride binding does not agree with the observations made in this work, namely that the translocation reaction of sodium and GABA across the membrane is independent on the extracellular chloride concentration. As shown below in the discussion of our proposed transport model, the rising phase of the current can be explained with a slower reaction step occurring when the substrate binding site is exposed to the intracellular side and corresponding to the intracellular release of substrates after the translocation reaction has taken place. This hypothesis is supported by the fact that this phase of the current is not observed in experiments under inward exchange conditions in which the intracellular binding sites for the transporter are already exposed to saturating concentrations of substrates, thus preventing the intracellular dissociation of substrates.
Turnover rate of GAT1 and rate limitation
The data presented here allow one to estimate the turnover rate, kss, of the GABA transporter. According to the equation Ips/Iss = (zps · kps)/(zss · kss) and with the known values of the apparent valence, z, of the pre-steady-state currents (index ps) and steady-state currents (index ss), the turnover rate can be calculated as ∼1.2 s−1 (from I2) and 13 s−1 (from sodium binding transient currents) at −40 mV transmembrane potential. It should be mentioned that the turnover rate estimated from I2 is associated with substantial error due to the large uncertainty in the apparent valence determined for this reaction. These values agree well with the turnover rate found by others for GAT1 expressed in Xenopus oocytes (5.8–7.6 s−1, −60 mV, Ref. 47; 6.3 s−1, −60 mV, Ref. 23; 5.8 s−1, −80 mV, Ref. 16) and HeLa cells (10 s−1, −60 mV, Ref. 9). In any case, the data show that the GABA-induced reactions observed here are too fast to pose a rate limitation for the GAT1 transport cycle at −40 mV transmembrane potential. Our results therefore directly substantiate previous speculations that substrate-dependent reactions of the GABA transporter are fast compared to extracellular Na+ binding and steady-state turnover (10,20).
In addition to determining the turnover rate, an estimation of the number of transporters expressed in the membrane of HEK293 cells was made. An average of −41 ± 6 pA was found for the steady-state currents under zero-trans conditions and at saturating concentrations of all substrates from 11 cells taken at random. Using this result, a maximum value of charge moved of 3.2 × 10⁻¹² C can be estimated from the curve of Fig. 5 B (Qmax = 78 fC for each pA of steady-state current). Assuming that the charge movements underlying Qmax and the steady-state current originate from the same number of transporters, the ratio Qmax/e (≈2 × 10⁷) is a measure of the number of transporters expressed per cell that account for the observed current, where e is the elementary charge. Assuming a hypothetical spherical cell with 20-μm diameter, the estimated density is ∼2 × 10⁴ transporters/μm2 cell membrane. This value is comparable to the ones found for oocytes (∼7 × 10³/μm2; Refs. 16,47) or GAT1-mediated currents in transfected HeLa cells (∼105/μm2; Ref. 9).
At very negative potentials, where electrogenic Na+-occlusion is accelerated, an electroneutral or voltage-independent reaction becomes rate-limiting for GAT1 steady-state turnover, as indicated by the voltage independence of the steady-state currents at these potentials (Fig. 1; see also Refs. 8,20). Lu and Hilgemann (20), failing to observe any electrogenic reaction after applying voltage jumps to the Xenopus oocyte membrane expressing GAT1 in GABA-GABA exchange conditions, attributed this almost electroneutral reaction to the translocation of the substrates across the membrane. In contrast, our data suggest that reactions associated with GABA translocation, although only weakly electrogenic, are fast (millisecond timescale; see above). Although it is unlikely that GABA translocation becomes rate-limiting, our experimental data are consistent with a reaction associated with the GABA-induced rising phase of the current being the rate-limiting step of the transport cycle at hyperpolarizing potentials. As discussed above, this rising phase was attributed to the intracellular release of substrates. Numerical analysis of the model, which explains the observed GAT1 electrical behavior, also supports this idea (see below for a discussion of the model). Furthermore, in agreement with this model the rate constant 1/τ3 (Fig. 6 C) shows little voltage dependence at negative potentials. Thus, it appears that the maximum transport rate that can be supported by GAT1 in the forward transport mode at hyperpolarizing potentials is in the range of 60–70 s−1.
The GABA binding rate and apparent affinity for GABA
From the GABA concentration dependence of the GABA-induced transient current (Fig. 4, A and B) it was possible to obtain a direct estimate for the binding rate of GABA to GAT1. A value of 5.9 × 10⁶ M−1 s−1 was calculated from the slope of the linear dependence of 1/τ3 on the GABA concentration that is observed at GABA concentrations where binding is rate-limiting ([GABA] < 10 μM). This value already takes into account the effect of the caged-GABA binding pre-equilibrium on the binding rate (see Materials and Methods). The value obtained here is one order-of-magnitude larger than previous values calculated by others (0.64 μM−1 s−1; Ref. 45; 0.5 μM−1 s−1; Ref. 16). The first group determined the forward binding rate constant for the GABA-transporter binding reaction from the steady-state transport rate at low GABA concentration (3 μM), whereas the latter calculated the GABA binding constant from the unidirectional outward and inward rate constants of the voltage-induced sodium charge movements at low external GABA concentrations. Here, the value is obtained, for the first time, directly from a GABA-induced reaction and is expected to be closer to the actual value. Additionally, the results presented in Fig. 4 C allow us to estimate a value for the intrinsic affinity of GAT1 for GABA. Previously reported Km values estimated only the apparent affinity under steady-state conditions, which may be lower than the intrinsic affinity of GAT1 for GABA. The dependence of the peak current I2 on the GABA concentration shows an apparent Km of 250 ± 50 μM which is much higher than the Km value for GABA observed for the steady-state currents (∼12 μM). This discrepancy found between the two values suggests that the Km determined at steady-state is not a good measure of the real affinity of the transporter for GABA. Most likely, the intrinsic affinity of the transporter for GABA is at least 250 μM or even higher.
The mechanism of Cl− co-transport
Our data show that, whereas the presence of extracellular chloride is required for the GABA-dependent generation of steady-state currents by GAT1, its presence is not required for GABA-induced pre-steady-state currents. This result is consistent with the previously observed complex influence of the extracellular Cl− concentration on the rate of GABA uptake and on GABA-induced steady-state currents. For example, Kanner and co-workers already observed in 1983 (26) that GABA-GABA exchange is catalyzed by GAT1 in the presence of low chloride concentrations. This result is now confirmed by our kinetic experiments, showing that pre-steady-state currents caused by the GABA exchange reaction can be detected in the presence or absence of extracellular chloride ions. Furthermore, our data suggest that intracellular chloride is also not required for the generation of currents in the inward exchange mode.
In general, two different models are discussed in the literature, which describe the mechanism of chloride co-transport. In one model, chloride is transported across the membrane in the same step as the other substrates, Na+ and GABA. In the other model, chloride is transported in a reaction step separate from the GABA translocation step (10). In light of our data the first model appears to be unlikely. If chloride was cotranslocated with Na+ and GABA, it would be expected that reactions associated with GABA translocation be inhibited in the absence of chloride. However, such an inhibition is experimentally not found. In contrast, the rate of the electrogenic reaction associated with the GABA translocation branch of the transport cycle is the same either in the presence, or in the absence, of extracellular chloride. This finding also excludes a model for chloride co-transport in which GABA translocation can take place in the absence of Cl−, albeit with a slower rate, thus being modulated only by the extracellular chloride concentration. Taken together, our results suggest that chloride is transported in a reaction step that is different from GABA translocation.
Two lines of evidence from previous publications also support the hypothesis of separate transport steps for chloride and GABA: 1), As mentioned above, GABA exchange was found to be catalyzed by GAT1 in the absence of extracellular chloride (26). 2), Application of extracellular GABA to GAT1 expressed in Xenopus oocytes induces a Cl−/Cl− exchange reaction, leading to efflux of chloride from the oocytes under conditions of inward transport (12).
This last behavior was explained by Cl−/Cl− exchange taking place during the GABA transport process. However, the observation of Cl−/Cl− exchange can be also explained if it is assumed that, while taking up GABA, the transporter resides a substantial amount of time in states that translocate Cl−, but not GABA and Na+. Thus, intra- and extracellular chloride could be exchanged while the transporter resides in those states, but the inward transport of GABA would still be strictly thermodynamically coupled to the inward flux of Cl−. A kinetic model that includes this type of separate Cl− transport mechanism is discussed in the next paragraph.
A general model for the GABA transport by GAT1
The transport model that we propose for GABA transport by GAT1 is shown in Fig. 8. The kinetic parameters used for the model are summarized in the legend of Fig. 8. The model is centered around the multitude of previous evidence which points to strongly voltage-dependent binding of one Na+ ion to the empty, GABA-free, transporter (apparent valence z12 = 0.9). Once the first sodium ion and, subsequently, a second sodium ion are bound, a high-affinity binding site for GABA is created on GAT1. GABA binding to the transporter is fast (the model value for k34 was 107 M−1 s−1, based on our experimental results) and assumed to be electroneutral, since the GABA molecule should be zwitterionic and, therefore, neutral at physiological pH. Furthermore, we did not detect GABA-induced charge movements in GAT1 that could be assigned kinetically to GABA binding. GABA translocation across the membrane can only take place when two Na+ ions and GABA are bound to the transporter to form the fully loaded transporter form. Our data do not allow us to further differentiate possible models regarding the sequence of binding of GABA and the two co-transported Na+ ions. However, in the model shown it was assumed that both Na+ ions bind before GABA to the transporter, based upon the previous finding by Lester and co-workers that increased extracellular Na+ concentration inhibits electrogenic dissociation of the “first” Na+ ion from the transporter (13). To account for the GABA-induced rapid inward transient current, GABA translocation was assumed to be weakly electrogenic, with an apparent valence of z45 = 0.2. The weak electrogenicity of the GABA translocation reaction is consistent with previous results obtained from voltage-jump experiments, showing that no detectable transient currents were induced by voltage-jumps to GAT1-containing membrane patches when the transporter was restricted to reside in states associated with the translocation branch of the cycle (20). The rate constant for GABA translocation at 0 mV transmembrane potential was set at 1000 s−1. Thus, the translocation reaction is fast compared to other reaction steps in the transport cycle and never becomes rate-limiting, even at extreme membrane potentials. This interpretation is in very good agreement with data from previous tracer flux experiments, which showed that extracellular GABA accelerates GABA efflux from preloaded GAT1-containing vesicles in the exchange mode (26). This result can be explained by our model since the GABA translocation reaction is very fast, leading to a fast rate of GABA efflux in the tracer flux experiment, whereas forward transport is slow because of slow Na+ binding to the extracellular side. Since Na+ does not need to dissociate in the exchange experiment, the binding reaction poses no rate limitation on exchange.
In contrast to most previously proposed models, chloride must not be bound for GABA translocation to occur. In our model, chloride is translocated to the intracellular side while the transporter rearranges its Na+ and GABA binding sites to face the extracellular side of the membrane. However, this rearrangement of binding sites can also occur in the absence of Cl−, although with a slower rate. The relocation reaction in the absence of chloride was included in the model to account for the observations of slow GABA uptake under chloride-free conditions (11,12) and for our results obtained in the forward transport mode in the absence of chloride (Fig. 6 D), which show a reduction, but not an elimination, of the GABA-induced steady-state current. Thus, according to this model the presence of chloride would strongly accelerate steady-state turnover of GAT1 in the forward direction, but it would have a negligible effect on the actual movement of GABA across the membrane. Furthermore, by strictly coupling reverse GABA transport to outward Cl− flux, the model accounts for the requirement of intracellular Cl− for reverse steady-state GABA transport determined in tracer flux studies (6) as well as in electrophysiological experiments (14). In agreement with these reports, we have also observed a requirement of intracellular Cl− for reverse GABA transport in our system (data not shown). How can our model reconcile the previously reported observation that increasing extracellular chloride concentration increases the affinity of Na+ and GABA for the transporter? The answer is that high extracellular chloride concentrations shift the AC ↔ BC equilibrium in Fig. 8 toward the AC form, thus making more transporters available for binding Na+ and, thus, GABA. In contrast, low extracellular [Cl−] would shift this equilibrium toward the BC form, thus inhibiting Na+ binding to GAT1 and decreasing its Na+ affinity. The model also explains previous results obtained by Lu and Hilgemann (20), showing that intracellular and extracellular Na+ binding are exclusive processes. In our model, cytoplasmic Cl− shifts the AC ↔ BC equilibrium toward the BC form, thus preventing extracellular Na+ from binding to the transporter.
It should be noted that an alternative explanation for the effect of [Cl−] on steady-state and transient currents would be that binding of the extracellular Cl− is required for intracellular GABA release, leading to the same electrical behavior in the forward transport mode in the absence of chloride and in the inward exchange mode, since GABA would be prevented from dissociating to the cytoplasm in both cases. We cannot experimentally distinguish between this model and the one shown in Fig. 8 because this would require performing tracer-flux experiments from a single voltage-clamped cell.
The model predicts the kinetics of GABA-induced GAT1 currents
Fig. 9 shows numeric simulations of current recordings generated by numerical integration of the rate equations pertinent to the model shown in Fig. 8. We used numerical integration because the problem includes too many coupled rate equations to be integrated analytically. Furthermore, the rate equations cannot be simplified easily by using rapid pre-equilibrium conditions, since most of the reactions are not separated well enough on the timescale. As shown in Fig. 9, A and E, the time-dependence of the GABA-induced currents, as well as their GABA and Na+ concentration-dependencies, are well reproduced by the model (see experimental data in Figs. 2 and 4). Furthermore, the model reproduces the experimentally observed voltage dependencies of the currents in both steady-state (Fig. 9 B) and pre-steady-state (Fig. 9 C) conditions. Finally, the simulations show the presence of pre-steady-state transient current and the inhibition of the steady-state current in the absence of extracellular chloride (Fig. 9 D), as found experimentally.
FIGURE 9.

Simulations of the forward transport mode [GABA]-induced pre-steady-state currents. (A) [GABA]-dependence of the pre-steady-state currents. (B) Voltage-dependence of the steady-state current (Iss/Vm). (C) Voltage-dependence of the pre-steady-state currents. (D) Effect of extracellular chloride substitution. (E) Effect of the extracellular sodium concentration. For the simulations the conditions were chosen to match the experiments shown in Figs. 5 A, 1 D, 4 B, D, and A of the results, respectively. Unless otherwise indicated, for the simulations, the holding potential was set at −40 mV. Ordinate scale is in electronic units (eu) s−1, where 1 eu = 1.602 × 10⁻¹⁹ C.
To test the model further, we simulated currents generated by GABA application to GAT1 in the inward exchange mode under conditions similar to those shown in Fig. 7. The results of these simulations are shown in Fig. 10. As expected, the simulations reproduce the transient nature of the GABA-induced currents in the absence, as well as the presence, of extracellular chloride (Fig. 10 A). Furthermore, they show the apparent lack of effect of the transmembrane potential on the rate of decay, as well as on the amplitude of the transient current, which is consistent with the experimental data. According to the model, the amplitude of the pre-steady-state current only becomes voltage-sensitive at low extracellular Na+ concentrations (20 mM, simulated in Fig. 10 C). This experimentally observed behavior is caused by the voltage- and [Na+]-sensitivity of the initial electrogenic binding to GAT1. At low extracellular Na+ concentrations this binding equilibrium is mainly shifted to the Na+-free form, which does not bind GABA. Both an increase of the extracellular [Na+] and a more negative transmembrane potential will have the effect of increasing the population of the sodium bound state, leading to an increase in the amplitude of the GABA-induced transient current. However, although the equilibrium of the electrogenic Na+-binding reaction can be shifted toward the bound form by GABA binding, this process does not generate observable GABA-induced current, since the Na+ binding is much slower than the GABA-dependent processes and rate-limiting for the transport cycle.
FIGURE 10.

Simulations of the [GABA]-induced inward exchange pre-steady-state currents. (A) Effect of the extracellular chloride concentration. Simulated currents in the presence and absence of extracellular chloride are indistinguishable. The voltage-dependence of the pre-steady-state currents in the presence of saturating intracellular and extracellular substrate concentration (B) or with 20 mM extracellular sodium (C). For the simulations in A and C the conditions were chosen to match the experiments shown in Fig. 7, D and E, of the results, respectively. Unless otherwise indicated, the holding potential was set at 0 mV. Ordinate scale is in electronic units (eu) s−1, where 1 eu = 1.602 × 10⁻¹⁹ C.
Interestingly, the model also predicts the GABA-induced efflux of chloride that was experimentally observed by Loo and co-workers (12) in GAT1-expressing oocytes that were preloaded with chloride, as shown in Fig. 11. Before GABA binding, the population of transporter states is restricted to state AN2, which does not translocate chloride (Fig. 8). After GABA-binding and translocation, once a new steady-state condition is established, states A, AC, and BC are accumulated. States AC and BC will be populated preferentially since the preloaded oocytes have a non-zero concentration of intracellular chloride (12). Because the Cl−-induced transporter relocation reaction is fast compared to extracellular Na+ binding, the transporter can shuttle back and forth multiple times between states AC and BC, before a sodium ion will finally bind to state A and drive the transport cycle forward. Thus, Cl−-Cl−-exchange can occur under conditions that normally favor directional inward transport of GABA. The model presented here is the first to provide a quantitative explanation for this—at first glance—unexpected exchange behavior.
FIGURE 11.

Predicted GABA-induced chloride efflux. The figure shows the frequency of transitions between states AC and BC, which is a measure of the rate of chloride efflux, after a jump in extracellular GABA concentration in the absence or presence of intracellular chloride.
Physiological significance
For the neurotransmitter glutamate there is evidence that synaptic transporters may be important for 1), regulating spillover of glutamate from nerve terminals to neighboring synapses (48); and 2), rapid binding of released glutamate to mediate removal of glutamate from the synapse by buffering by transporter binding sites (49,50). At present, much less is known about the physiological function of GABA transport during synaptic transmission. For example, the synaptic buffering hypothesis has not yet been proposed for GABAergic neurotransmission. However, a well-established fact is that GAT1 plays a key role in determining the time course and spatial extent of synaptic transmission by efficiently removing GABA within a few tens of milliseconds (51,52). When blockers of the GABA transporter are applied to brain slices, inhibitory postsynaptic currents (IPSCs) mediated by GABA receptors are prolonged (53,54). How can this fast effect of synaptic GAT1 be reconciled with the known slow steady-state transport rates (∼3–13 s−1, −40 mV)? The data presented here allow some comments about this inconsistency. In the model proposed here for GAT1 transport, after the “first” slow sodium-binding reaction (and most likely the second) the transporter resides mainly in the Na+-bound form, and is ready to accept GABA. Once synaptic GABA release occurs, the subsequent steps of the transport cycle associated with GABA binding and translocation can move GABA rapidly within milliseconds from the synaptic cleft to the intracellular side, even though the steady-state turnover number is slow. In this interpretation, each GABA transporter would take up only one GABA molecule during each synaptic transmission event. After GABA translocation and intracellular release, the transporters regenerate their GABA binding site to face back to the extracellular side. As proposed previously by Mager and co-workers (13), this process requires extracellular Na+ binding, which is slow compared to the timescale of synaptic transmission.
In an alternative model, rapid buffering of GABA by synaptic transporters could also explain the apparent effect of GAT1 blockers on the IPSCs. However, the apparent affinity of GAT1 for GABA determined in this work immediately after GABA release is quite low (with an intrinsic affinity of GAT1 for GABA estimated at >250 μM), but rises once the steady-state condition is reached (as indicated by the Km for GABA of 12 μM under steady-state conditions), indicating that GABA becomes trapped by the transporter after initially being bound with relatively low affinity. Such a low intrinsic affinity would make buffering of GABA by transporters in the synapse unlikely, since the GABA concentration would be buffered at values that are well above half-saturating concentrations for synaptic GABA receptors (e.g., EC50 for GABAB receptors: 2.3 μM, Ref. 55; 30.9 μM, Ref. 56; 72 μM, Ref. 57; and for GABAA receptors: 14 μM, Ref. 58; 21 and 13 μM, Ref. 59). As an alternative to this buffering effect, GAT1's rapid translocation activity may indeed be efficient in clearing the synapse of neurotransmitter.
Synaptic GABA transporter currents have recently been measured by Kinney and Spain (60). These authors found slowly rising (within several 100 ms) and long-lasting GABA release-evoked currents mediated by GABA transporters in glial neocortical astrocytes. These currents were interpreted to be generated by active uptake of GABA into the astrocytes. The slow rise of these GAT1 currents was attributed to a GABA transporter-specific current delay before the first transport cycle is completed. The results presented here for GABA-induced GAT1 currents after laser-pulse photolytic release of GABA show no such delay. Unless astrocytic GABA transporters have significantly slower kinetics than GAT1, it is unlikely that the currents measured by Kinney and Spain (60) reflect the intrinsic kinetics of the GABA transporter. However, the currents more likely reflect the concentration of GABA in the extrasynaptic space as a function of space and time. According to this interpretation, activation of astrocytic GABA transporters is delayed because of the diffusional time necessary for GABA to reach these transporters. Thus, it appears that astrocytic GABA transporters in the neocortex do not contribute to shaping IPSCs because they are spatially too far removed from the active zone of the synapse.
In conclusion, our results demonstrate the complex kinetic behavior of GABA transporters. The evidence of multiple intermediates on the transport pathway is consistent with findings for other primary and secondary transport proteins. Here, we show that individual, rapid GAT1 reactions can be resolved that depend on GABA binding to the transporter, in addition to the partial reactions that were previously found in the GABA-independent branch of the reaction cycle (20). These partial reactions are associated with rapid transmembrane charge movements. Furthermore, we have characterized the chloride dependence of the GABA-dependent partial reactions and found that chloride appears to be translocated in a step separate from GABA translocation. We propose a transport model that can account for these results. This transport model includes a rapid, but weakly electrogenic GABA translocation step, a 12-ms substrate dissociation step on the intracellular side, and rapid Cl− counterexchange.
Acknowledgments
The GAT1 cDNA and the pBK-CMV plasmid were kindly provided by Prof. Wolfgang Schwarz (Max-Planck-Institut für Biophysik, Frankfurt) and Prof. Jian Fei (Shanghai Institute of Cell Biology, Shanghai), and by Dr. Thomas Rauen (Westfälische-Wilhelms-Universität, Münster), respectively. The blocker SKF-89976A was supplied by SmithKline Beecham, Munich. The authors thank Drs. W. Schwarz, K. Fendler, and K. Hartung for helpful discussions, E. Grabsch for help in molecular biology, and E. Bamberg for constant encouragement and support.
This work was supported by a fellowship (Praxis XXI/BD/18095198) of the Fundação para a Ciência e a Tecnologia, Lisbon, Portugal, awarded to A.B., and grants by the American Heart Association (No. 0335330B), and the Florida Department of Health (No. 04NIR-07) awarded to C.G.
Ana Bicho's current address is Departamento de Química, Faculdade de Ciências e Tecnologia, Universidade Nova de Lisboa, 2829-516 Caparica, Portugal.
References
- 1.Amara, S. G., and M. J. Kuhar. 1993. Neurotransmitter transporters: recent progress. Annu. Rev. Neurosci. 16:73–93. [DOI] [PubMed] [Google Scholar]
- 2.Atwell, D., and P. Mobbs. 1994. Neurotransmitter transporters. Curr. Opin. Neurobiol. 4:353–359. [DOI] [PubMed] [Google Scholar]
- 3.Blakely, R. D., L. J. DeFelice, and H. C. Hartzell. 1994. Molecular physiology of norepinephrine and serotonin transporters. J. Exp. Biol. 196:263–281. [DOI] [PubMed] [Google Scholar]
- 4.Bergles, D. E., J. S. Diamond, and C. E. Jahr. 1999. Clearance of glutamate inside the synapse and beyond. Curr. Opin. Neurobiol. 9:293–298. [DOI] [PubMed] [Google Scholar]
- 5.Borden, L. A. 1996. GABA transporter heterogeneity: pharmacology and cellular localization. Neurochem. Int. 29:335–356. [DOI] [PubMed] [Google Scholar]
- 6.Kanner, B. I., and S. Schuldiner. 1987. Mechanism of transport and storage of neurotransmitters. Crit. Rev. Biochem. 22:1–38. [DOI] [PubMed] [Google Scholar]
- 7.Keynan, S., and B. I. Kanner. 1988. γ-Aminobutyric acid transport in reconstituted preparations from rat brain: coupled sodium and chloride fluxes. Biochemistry. 27:12–17. [DOI] [PubMed] [Google Scholar]
- 8.Kavanaugh, M. P., J. L. Arriza, R. A. North, and S. G. Amara. 1992. Electrogenic uptake of γ-aminobutyric acid by a cloned transporter expressed in Xenopus oocytes. J. Biol. Chem. 267:22007–22009. [PubMed] [Google Scholar]
- 9.Risso, S., L. J. DeFelice, and R. D. Blakely. 1996. Sodium-dependent GABA-induced currents in GAT1-transfected HeLa cells. J. Physiol. 490:691–702. [DOI] [PMC free article] [PubMed] [Google Scholar]
- 10.Hilgemann, D. W., and C.-C. Lu. 1999. GAT1 (GABA:Na+:Cl−) co-transport function. Database reconstruction with an alternating access model. J. Gen. Physiol. 114:459–475. [DOI] [PMC free article] [PubMed] [Google Scholar]
- 11.Guastella, J., N. Nelson, H. Nelson, L. Czyzyk, S. Keynan, M. C. Miedel, N. Davidson, H. A. Lester, and B. I. Kanner. 1990. Cloning and expression of a rat brain GABA transporter. Science. 249:1303–1306. [DOI] [PubMed] [Google Scholar]
- 12.Loo, D. D., S. Eskandari, K. J. Boorer, H. K. Sarkar, and E. M. Wright. 2000. Role of Cl− in electrogenic Na+-coupled co-transporters GAT1 and SGLT1. J. Biol. Chem. 275:37414–37422. [DOI] [PubMed] [Google Scholar]
- 13.Mager, S., N. Kleinberger-Doron, G. I. Keshet, N. Davidson, B. I. Kanner, and H. A. Lester. 1996. Ion binding and permeation at the GABA transporter GAT1. J. Neurosci. 16:5405–5414. [DOI] [PMC free article] [PubMed] [Google Scholar]
- 14.Lu, C. C., and D. W. Hilgemann. 1999. GAT1 (GABA:Na+:Cl−) co-transport function. Steady state studies in giant Xenopus oocyte membrane patches. J. Gen. Physiol. 114:429–444. [DOI] [PMC free article] [PubMed] [Google Scholar]
- 15.Bossi, E., S. Giovannardi, F. Binda, G. Forlani, and A. Peres. 2002. Role of anion-cation interactions on the pre-steady-state currents of the rat Na+-Cl−-dependent GABA co-transporter rGAT1. J. Physiol. 541:343–350. [DOI] [PMC free article] [PubMed] [Google Scholar]
- 16.Mager, S., J. Naeve, M. Quick, C. Labarca, N. Davidson, and H. A. Lester. 1993. Steady states, charge movements, and rates for a cloned GABA transporter expressed in Xenopus oocytes. Neuron. 10:177–188. [DOI] [PubMed] [Google Scholar]
- 17.Loo, D., A. Hazama, S. Supplisson, E. Turk, and E. M. Wright. 1993. Relaxation kinetics of the Na+/glucose co-transporter. Proc. Natl. Acad. Sci. USA. 90:5767–5771. [DOI] [PMC free article] [PubMed] [Google Scholar]
- 18.Kappl, M., and K. Hartung. 1996. Rapid charge translocation by the cardiac Na+-Ca2+ exchanger after a Ca2+ concentration jump. Biophys. J. 71:2473–2485. [DOI] [PMC free article] [PubMed] [Google Scholar]
- 19.Forster, I. C., C. A. Wagner, A. E. Busch, F. Lang, J. Biber, N. Hernando, H. Murer, and A. Werner. 1997. Electrophysiological characterization of the flounder type II Na+/Pi co-transporter (NaPi-5) expressed in Xenopus laevis oocytes. J. Membr. Biol. 160:9–25. [DOI] [PubMed] [Google Scholar]
- 20.Lu, C. C., and D. W. Hilgemann. 1999. GAT1 (GABA:Na+:Cl−) co-transport function. Kinetic studies in giant Xenopus oocyte membrane patches. J. Gen. Physiol. 114:445–457. [DOI] [PMC free article] [PubMed] [Google Scholar]
- 21.Grewer, C., N. Watzke, M. Wiessner, and T. Rauen. 2000. Glutamate translocation of the neuronal glutamate transporter EAAC1 occurs within milliseconds. Proc. Natl. Acad. Sci. USA. 97:9706–9711. [DOI] [PMC free article] [PubMed] [Google Scholar]
- 22.Watzke, N., E. Bamberg, and C. Grewer. 2001. Early intermediates in the transport cycle of the neuronal excitatory amino acid carrier EAAC1. J. Gen. Physiol. 117:547–562. [DOI] [PMC free article] [PubMed] [Google Scholar]
- 23.Liu, Y., U. Eckstein-Ludwig, J. Fei, and W. Schwarz. 1998. Effect of mutation of glycosylation sites on the Na+ dependence of steady-state and transient currents generated by the neuronal GABA transporter. Biochim. Biophys. Acta. 1415:246–254. [DOI] [PubMed] [Google Scholar]
- 24.Mager, S., Y. Cao, and H. Lester. 1998. Measurement of transient currents from neurotransmitter transporters expressed in Xenopus oocytes. Methods Enzymol. 296:551–566. [DOI] [PubMed] [Google Scholar]
- 25.Lu, C. C., A. Kabakov, V. S. Markin, S. Mager, G. A. Frazier, and D. W. Hilgemann. 1995. Membrane transport mechanisms probed by capacitance measurements with megaHertz voltage clamp. Proc. Natl. Acad. Sci. USA. 92:11220–11224. [DOI] [PMC free article] [PubMed] [Google Scholar]
- 26.Kanner, B. I., A. Bendahan, and R. Radian. 1983. Efflux and exchange of γ-aminobutyric acid and nipecotic acid catalysed by synaptic plasma membrane vesicles isolated from immature rat brain. Biochim. Biophys. Acta. 731:54–62. [DOI] [PubMed] [Google Scholar]
- 27.Keynan, S., Y.-J. Suh, B. I. Kanner, and G. Rudnick. 1992. Expression of a cloned γ-aminobutyric acid transporter in mammalian cells. Biochemistry. 31:1974–1979. [DOI] [PubMed] [Google Scholar]
- 28.Gee, K. L., R. Wieboldt, and G. P. Hess. 1994. Synthesis and photochemistry of a new photolabile derivative of GABA. Neurotransmitter release and receptor activation in the microsecond time region. J. Am. Chem. Soc. 116:8366–8367. [Google Scholar]
- 29.Chen, C., and H. Okayama. 1987. High-efficiency transformation of mammalian cells by plasmid DNA. Mol. Cell. Biol. 7:2745–2752. [DOI] [PMC free article] [PubMed] [Google Scholar]
- 30.Hamill, O. P., A. Marty, E. Neher, B. Sakmann, and F. J. Sigworth. 1981. Improved patch-clamp techniques for high-resolution current recording from cells and cell-free membrane patches. Pflugers Arch. 391:85–100. [DOI] [PubMed] [Google Scholar]
- 31.Zhu, G., Y. Zhang, H. Xu, and C. Jiang. 1998. Identification of endogenous outward currents in the human embryonic kidney (HEK 293) cell line. J. Neurosci. Methods. 81:73–83. [DOI] [PubMed] [Google Scholar]
- 32.Niu, L., C. Grewer, and G. P. Hess. 1996. Chemical kinetic investigations of neurotransmitter receptors on a cell surface in the μs time region. In Techniques in Protein Chemistry VII. D.R. Marshak, editor. Academic Press, New York.
- 33.Segel, H. I. 1975. Enzyme Kinetics. Wiley, New York. 100–105.
- 34.Fendler, K., S. Jaruschewski, A. Hobbs, W. Albers, and J. P. Froehlich. 1993. Pre-steady-state charge translocation in NaK-ATPase from eel electric organ. J. Gen. Physiol. 102:631–666. [DOI] [PMC free article] [PubMed] [Google Scholar]
- 35.Parent, L., S. Supplisson, D. D. F. Loo, and E. M. Wright. 1992. Electrogenic properties of the cloned Na+/glucose co-transporter: II. A transport model under nonrapid equilibrium conditions. J. Membr. Biol. 125:63–79. [DOI] [PubMed] [Google Scholar]
- 36.Läuger, P. 1991. Electrogenic Ion Pumps. Sinauer Associates, Sunderland, MA.
- 37.Adrian, R. H. 1978. Charge movement in the membrane of striated muscle. Annu. Rev. Biophys. Bioeng. 7:85–112. [DOI] [PubMed] [Google Scholar]
- 38.Ali, F. E., W. E. Bondinell, P. A. Dandridge, J. S. Frazee, E. Garvey, G. R. Girard, C. Kaiser, T. W. Ku, J. J. Lafferty, G. I. Moonsammy, H.-J. Oh, J. A. Rush, et al. 1985. Orally active and potent inhibitors of γ-aminobutyric acid uptake. J. Med. Chem. 28:653–660. [DOI] [PubMed] [Google Scholar]
- 39.Burzik, C., G. Kaim, P. Dimroth, E. Bamberg, and K. Fendler. 2003. Charge displacements during ATP-hydrolysis and synthesis of the Na+-transporting F0F1-ATPase of Ilyobacter tartaricus. Biophys. J. 85:2044–2054. [DOI] [PMC free article] [PubMed] [Google Scholar]
- 40.Fendler, K., S. Drose, K. Altendorf, and E. Bamberg. 1996. Electrogenic K+ transport by the Kdp-ATPase of Escherichia coli. Biochemistry. 35:8009–8017. [DOI] [PubMed] [Google Scholar]
- 41.Nagel, G., K. Fendler, E. Grell, and E. Bamberg. 1987. Na+ currents generated by the purified (Na+ + K+)-ATPase on planar lipid membranes. Biochim. Biophys. Acta. 901:239–249. [DOI] [PubMed] [Google Scholar]
- 42.Molnár, P., and V. Nadler. 2000. γ-aminobutyrate, α-carboxy-2-nitrobenzyl ester selectively blocks inhibitory synaptic transmission in rat dentate gyrus. Eur. J. Pharmacol. 391:255–262. [DOI] [PubMed] [Google Scholar]
- 43.Dilger, J. P., A. M. Vidal, H. I. Mody, and Y. Liu. 1994. Evidence for direct actions of general anesthetics on an ion channel protein. A new look at a unified mechanism of action. Anesthesiology. 81:431–442. [DOI] [PubMed] [Google Scholar]
- 44.Cammack, N. J., S. V. Rakhilin, and E. A. Schwartz. 1994. A GABA transporter operates asymmetrically and with variable stoichiometry. Neuron. 13:949–960. [DOI] [PubMed] [Google Scholar]
- 45.Fesce, R., S. Giovannardi, F. Binda, E. Bossi, and A. Peres. 2002. The relation between charge movement and transport-associated currents in the rat GABA co-transporter rGAT1. J. Physiol. 543:739–750. [DOI] [PMC free article] [PubMed] [Google Scholar]
- 46.Forster, I., K. Köhler, G. Stange, J. Biber, and H. Murer. 2002. Modulation of renal type IIa Na+/Pi co-transporter kinetics by the arginine modifier phenylglyoxal. J. Membr. Biol. 187:85–96. [DOI] [PubMed] [Google Scholar]
- 47.Eckstein-Ludwig, U., J. Fei, and W. Schwarz. 1999. Inhibition of uptake, steady-state currents, and transient charge movements generated by the neuronal GABA transporter by various anticonvulsant drugs. Br. J. Pharmacol. 128:92–102. [DOI] [PMC free article] [PubMed] [Google Scholar]
- 48.Kullmann, D. M., and F. Asztely. 1998. Extrasynaptic glutamate spillover in the hippocampus: evidence and implications. Trends Neurosci. 21:8–14. [DOI] [PubMed] [Google Scholar]
- 49.Auger, C., and D. Atwell. 2000. Fast removal of synaptic glutamate by postsynaptic transporters. Neuron. 28:547–558. [DOI] [PubMed] [Google Scholar]
- 50.Diamond, J. S., and C. E. Jahr. 1997. Transporters buffer synaptically released glutamate on a submillisecond time scale. J. Neurosci. 17:4672–4687. [DOI] [PMC free article] [PubMed] [Google Scholar]
- 51.Lester, H. A., S. Mager, M. W. Quick, and J. L. Corey. 1994. Permeation properties of neurotransmitter transporters. Annu. Rev. Pharmacol. Toxicol. 34:219–249. [DOI] [PubMed] [Google Scholar]
- 52.Frahm, C., D. Engel, and A. Draguhn. 2001. Efficacy of background GABA uptake in rat hippocampal slices. Neuroreport. 12:1593–1596. [DOI] [PubMed] [Google Scholar]
- 53.Engel, D., D. Schmitz, T. Gloveli, C. Frahm, U. Heinemann, and A. Draguhn. 1998. Laminar difference in GABA uptake and GAT-1 expression in rat CA1. J. Physiol. 512:643–649. [DOI] [PMC free article] [PubMed] [Google Scholar]
- 54.Cherubini, E., and F. Conti. 2001. Generating diversity at GABAergic synapses. Trends Neurosci. 24:155–162. [DOI] [PubMed] [Google Scholar]
- 55.Slugg, R. M., S. X. Zheng, Y. Fang, M. J. Kelly, and O. K. Ronnekleiv. 2003. Baclofen inhibits guinea pig magnocellular neurons via activation of an inwardly rectifying K+ conductance. J. Physiol. 551:295–308. [DOI] [PMC free article] [PubMed] [Google Scholar]
- 56.Zagorodnyuk, V. P., G. D'Antona, S. J. Brookes, and M. Costa. 2002. Functional GABAB receptors are present in guinea pig nodose ganglion cell bodies but not in peripheral mechanosensitive endings. Auton. Neurosci. 102:20–29. [DOI] [PubMed] [Google Scholar]
- 57.Wise, A., A. Green, M. J. Main, R. Wilson, N. Fraser, and F. H. Marshall. 1999. Calcium-sensoring properties of the GABA(B) receptor. Neuropharmacology. 38:1647–1656. [DOI] [PubMed] [Google Scholar]
- 58.Lim, M. S., C. E. Lindquist, and B. Birnir. 2003. Effects of pentobarbital on GABA-activated currents in acutely isolated rat dentate gyrus granule neurons. Neurosci. Lett. 353:139–142. [DOI] [PubMed] [Google Scholar]
- 59.Tolstykh, G., S. Belugin, O. Tolstykh, and S. Mifflin. 2003. Responses to GABA(A) receptor activation are altered in NTS neurons isolated from renal-wrap hypertensive rats. Hypertension. 42:732–736. [DOI] [PubMed] [Google Scholar]
- 60.Kinney, G. A., and W. J. Spain. 2002. Synaptically evoked GABA transporter currents in neocortical glia. J. Neurophysiol. 88:2899–2908. [DOI] [PubMed] [Google Scholar]