

Abstract
The assembly of multiprotein complexes at the membrane interface governs many signaling processes in cells. However, very few methods exist for obtaining biophysical information about protein complex formation at the membrane. We used single molecule fluorescence resonance energy transfer to study complexin and synaptotagmin interactions with the SNARE complex in deposited lipid bilayers. Using total internal reflectance microscopy, individual binding events at the membrane could be resolved despite an excess of unbound protein in solution. Fluorescence resonance energy transfer (FRET)-efficiency derived distances for the complexin-SNARE interaction were consistent with the crystal structure of the complexin-SNARE complex. The unstructured N-terminal region of complexin showed broad distributions of FRET efficiencies to the SNARE complex, suggesting that information on conformational variability can be obtained from FRET efficiency distributions. The low-affinity interaction of synaptotagmin with the SNARE complex changed dramatically upon addition of Ca2+ with high FRET efficiency interactions appearing between the C2B domain and linker domains of synaptotagmin and the membrane proximal portion of the SNARE complex. These results demonstrate that single molecule FRET can be used as a “spectroscopic ruler” to simultaneously gain structural and kinetic information about transient multiprotein complexes at the membrane interface.
INTRODUCTION
Fluorescence resonance energy transfer (FRET) has been used to study protein interactions and conformational changes in vivo and in vitro. Because of the distance dependence of energy transfer (1/r6), FRET efficiency measurements can be used as a “spectroscopic ruler” to measure distances in biological macromolecules (1). Single molecule FRET studies in vitro have proven successful in monitoring intramolecular conformational changes in proteins and oligonucleotides as well as ligand-protein binding and protein-DNA interactions. The utility of single molecule FRET to measure distances has been established using doubly-labeled DNA oligonucleotides (2) and model peptides (3), although the distance-dependence relationship was shown to break down at short interprobe distances where direct interactions occur between fluorophores (4). To date a variety of doubly-labeled macromolecules and stable macromolecular complexes have been studied (5–11).
In the resting state of a neuron, synaptic vesicles remain are stably docked to the plasma membrane by SNARE complexes (12,13). Once the action potential reaches the synapse, the opening of voltage-gated Ca2+ channels allows Ca2+ to enter, which rapidly triggers vesicle fusion (delay time of 200–300 μs) (14–17). Although SNARE proteins are sufficient to catalyze membrane fusion (18,19), additional proteins may need to interact with the SNARE complex to impart the Ca2+ dependence of vesicle release seen at the synapse.
Complexin (20) and synaptotagmin (21–23) are essential for the Ca2+-dependency of synaptic vesicle release. Complexin is a soluble protein of MW ∼15 kDa that shows rapid and high-affinity binding to the SNARE complex (24,25). Structural studies of complexin revealed an α-helical region involved in SNARE binding and an unstructured portion (26–28).
Synaptotagmin I is a type 1 transmembrane protein localized on synaptic vesicles (29). The cytosolic portion contains two conserved Ca2+-binding domains (30), C2A and C2B, which interact in a Ca2+-dependent manner with acidic lipids (31–35), SNAP-25 and syntaxin (both individually and in a binary complex), and the ternary SNARE complex (36–42). Genetic rescue experiments with mutants of synaptotagmin showed a correlation between Ca2+-dependent lipid binding and vesicle fusion in vivo (43), but the role of the synaptotagmin-SNARE interactions remains controversial (44–48).
Biochemical studies of transient protein complex formation typically cannot resolve heterogeneity in the sample since bulk measurements are averages over millions of unsynchronized interactions. Furthermore, protein interactions at the membrane have been more difficult to study due to interference from lipids with spectroscopic assays, crystallization, and nuclear-magnetic resonance relaxation rates. These complications have severely limited the ability to gain insights about transient protein complexes and interactions at membranes. This article illustrates the applicability of single molecule FRET as a method to study transient protein-protein interactions. Single molecule FRET has been previously used to study intramolecular interactions, and stable ligand-protein and protein-DNA complexes (2,49,50), but our report is the first study to extend the method to directly observe transient interprotein interactions.
We have used single molecule spectroscopy to monitor transient interactions between complexin and the cytosolic domain of synaptotagmin with the neuronal SNARE complex in deposited lipid bilayers. For the complexin-SNARE complex, FRET-efficiency derived distances were consistent with distances observed in the crystal structure of the complex (27,28) when the distances were close (within 2 nm) to the Förster radius of the particular dye pair. FRET efficiency distributions involving a label attached to the unstructured N-terminal portion of complexin were broader than those seen for the structured SNARE-binding region of complexin. Thus, information on conformational variability is contained in the width of a FRET efficiency distribution. We found high FRET efficiency interactions between the C2B domain of synaptotagmin I and the membrane-proximal portion of the SNARE complex, but only in the presence of Ca2+. Few high FRET efficiency interactions were observed to the C2A domain. These results demonstrate that single molecule FRET can be used as a spectroscopic ruler to obtain structural constraints and kinetic information about transient protein interactions at the membrane.
MATERIALS AND METHODS
Proteins: plasmids, expression, purification, and labeling
Full-length rat syntaxin-1A, full-length SNAP-25A with all cysteines mutated to serine, and the cytosolic domain of synaptobrevin-II (residues 1–96) were expressed, purified, and labeled as described earlier (10). Full-length rat synaptobrevin-II was expressed and purified as described previously (51). All mutations described herein were introduced using the QuikChange Mutagenesis Kit (Stratagene, La Jolla, CA). All cysteine residues in wild-type syntaxin-1A were mutated to serine (Cys145Ser, Cys271Ser, and Cys272Ser). Alternatively, the transmembrane cysteines in syntaxin were mutated to isoleucine (Cys271Ile and Cys272Ile) to increase transmembrane domain hydrophobicity. None of these mutations affected SNARE complex formation, reconstitution into liposomes, or complexin binding. Cysteine-free versions of syntaxin 1A were used as the template for the creation of a series of site-specific labeling mutants: Ser193Cys, Glu228Cys, and Ser249Cys.
Proteins were labeled as described earlier (10). Cy5 maleimide (Amersham Pharmacia Biosciences, Piscataway, NJ) labeling efficiencies of 47%, 66%, and 42% were achieved for Ser193Cys, Glu228Cys, and Ser249Cys, respectively. For kinetic studies of complexin binding, the Ser193Cys construct (also Cys271Ile and Cys272Ile) was labeled with Alexa647 maleimide (Molecular Probes, Eugene, OR) at 65% efficiency. Full-length synaptobrevin-II (Cys103Ser) Ser28Cys labeled with Cy5 was used in control experiments. The cytosolic domain of synaptobrevin-II Ser61Cys was used to study the kinetics of complexin binding to SNARE complexes; it was labeled with Alexa647 maleimide at 84% efficiency.
Full-length synaptotagmin I was cloned from a rat brain cDNA library (Clontech, Palo Alto, CA) using standard methodology. The sequence of the full-length clone was free of the deleterious mutations described previously (52). The cytosolic fragment (residues 96–421) was then subcloned from this construct and placed in pGex4T1. The cysteine residue in the cytosolic domain of synaptotagmin I was mutated to serine (Cys277Ser) to create a cysteine-free template for the creation of a series of site-specific labeling mutants. These mutations were Gln154Cys, Glu269Cys, and Thr383Cys. All cytosolic synaptotagmin I constructs were expressed and purified as described earlier (42). Briefly, GST-synaptotagmin was bound to glutathione agarose followed by extensive washing. This included a wash in 50 mM CaCl2 to remove impurities bound to synaptotagmin I (53). Synaptotagmin I was then cleaved off the glutathione agarose with thrombin at 4°C followed by cation exchange chromatography on a monoS column (Amersham Biosciences). Peak fractions from the monoS elution were pooled and further purified using size-exclusion chromatography on a Superdex 75 column (Amersham Biosciences) to remove high molecular weight aggregates. Synaptotagmin I was labeled with maleimide derivatives of Cy3 as described previously. Free dye was removed by size-exclusion chromatography followed by dialysis. Labeling efficiencies were typically 80–100%. Fluorescent labeling of the introduced cysteines did not affect the retention of synaptotagmin I on a Superdex 75 size-exclusion column (data not shown).
Full-length complexin I was subcloned into pet28a (Novagen, Madison, WI) using standard methodology and expressed as per manufacturer's instructions. Complexin was purified on Ni-nitrilotriacetic acid agarose (Qiagen, Germantown, MD) followed by anion exchange on monoQ resin (Amersham Biosciences). Complexin contains a native cysteine, Cys105, in the unstructured portion that was used for labeling for a set of experiments. For the introduction of a cysteine into the structured domain (Gln64Cys), Cys105 was mutated to serine to create a cysteine-free template. Complexin was labeled with maleimide derivatives of Cy3 dye (Amersham Biosciences) and purified away from free dye using gel filtration. Wild-type complexin was labeled with 60% efficiency at Cys105. The Gln64Cys mutant of complexin was labeled at 84% efficiency.
Formation of SNARE complex
Parallel SNARE complex was formed in solution as described previously (10). Briefly, thrombin was used to remove the hexahistidine tag from Cy5-labeled syntaxin 1A and SNAP-25 followed by addition of the protease inhibitor PPACK (EMD Biosciences, San Diego, CA) to inhibit residual thrombin activity. Syntaxin was mixed with SNAP-25 at a 1:2 molar ratio followed by addition of a 1:5 molar ratio of the synaptobrevin cytosolic domain, residues 1–96, fused to a hexahistidine tag. The large excess of synaptobrevin was found to maximize incorporation of syntaxin into ternary SNARE complexes by minimizing production of the 2:1 syntaxin·SNAP-25 binary complex (54). Samples were incubated at 4°C for 12–24 h to allow SNARE complex formation to occur. Samples were then bound to Ni-nitrilotriacetic acid agarose (Qiagen). To select for parallel SNARE complexes the sample was washed using buffer containing 7.5 M urea as described previously (10). The column was then extensively washed with urea-free buffer before elution using buffer containing 250 mM imidazole. The hexahistidine tag on synaptobrevin was removed with thrombin. Finally, SNARE complex was purified away from free synaptobrevin by anion exchange on monoQ resin (Amersham Biosciences). Previous results using a FRET pair that resulted in FRET = 1 for the antiparallel configuration showed that 98% of SNARE complexes prepared by this method were in the more stable parallel configuration observed in the crystal structure (see Fig. 3 B in Ref. 10). Formation of the SNARE complex was confirmed by SDS-PAGE with and without boiling (see Fig. 1 in Ref. 10).
FIGURE 3.

Distance dependence of FRET efficiency for the fluorescent probes used in this study. Theoretical FRET efficiency was calculated at different distances for the donor fluorophore Cy3 and the acceptor fluorophore Cy5 as described in Materials and Methods. A value of 5.3 nm was used as the Förster radius, Ro, for this dye pair (59,60), which includes the assumptions (described in Materials and Methods) that the dyes are freely rotating on the timescale of fluorescent emission. The distance dependence is most sensitive within 2 nm at ∼Ro.
FIGURE 1.

Positions of labeling sites in the SNARE complex, complexin and synaptotagmin. For the SNARE complex (55), synaptobrevin is colored blue, syntaxin is colored red, and SNAP-25 is colored green. Residues that were individually mutated for the purpose of site-specific labeling are shown as yellow spheres along with their corresponding residue numbers. (A) Crystal structure of complexin I (orange) bound to a truncated neuronal SNARE complex (27). Also indicated is the unstructured C-terminal domain, residues 72–134, of complexin that was not present in the crystal structure. (B) Crystal structure of the neuronal SNARE complex (55) shown along with a model of synaptotagmin I (light blue) based on synaptotagmin III (64) created using MODELLER (72). The approximate locations of the Ca2+ binding regions are indicated. The molecular graphics was generated using PyMOL (73).
Reconstitution into liposomes
Egg phosphatidylcholine (egg PC) and brain phosphatidylserine (brain PS) (both Avanti Polar Lipids, Alabaster, AL) were mixed in chloroform at ratios indicated in the text and were dried under flowing argon to a thin film in a glass tube. The tubes were then placed into vacuum for several hours. Liposomes were formed by hydration of the lipid film in TBS (20 mM Tris at pH 8.2, 200 mM NaCl, 1 mM DTT) to yield a final lipid concentration of 30 mg/ml. Liposomes were sized by extrusion using the Mini-Extruder (Avanti Polar Lipids) with 50-nm pore size filters according to manufacturer instructions.
Preformed SNARE complexes were reconstituted as described earlier (10). Briefly, protein solutions (80 nM) in TBS containing 100 mM β-d-octyl glucoside (βOG) were mixed at a 1:4 ratio with 30 mg/ml liposome samples and allowed to incubate at 4°C for 30 min. These mixtures were then diluted 1:1 with detergent-free TBS and separated from detergent and unincorporated protein using size-exclusion chromatography on a Sepharose CL4B (Amersham Biosciences) column.
Site-labeling strategy
We sought to observe real-time, individual binding events of complexin and the cytoplasmic domain of synaptotagmin to preformed neuronal SNARE complexes incorporated into planar lipid bilayers. The SNARE complex was assembled using syntaxin or synaptobrevin labeled with an acceptor dye at surface-accessible sites, based on the crystal structure of the truncated neuronal SNARE complex (55). In syntaxin, these sites were located either at the N-terminus (residue 193), near the central ionic layer (residue 228) or near the membrane anchor at the C-terminus (residue 249) (Fig. 1, A and B). These three labeling sites covered the entire length of the four-helix bundle of the SNARE complex such that an interacting acceptor-labeled protein should yield FRET > 0 for one or more of these labeling sites considering the Förster radius (5.3 nm) of the Cy3-Cy5 labeling pair. In synaptobrevin, one labeling site near the central ionic layer was used (residue 61) (Fig. 1 A). The measured FRET efficiency to the different sites was used to derive distances between the dipoles of the fluorescent probes attached to the labeling sites assuming freely rotating dyes. As such, each labeling-site pair combination represents a separate experiment. By using all labeling site pair combinations we were able to obtain structural information about the protein complex.
Fluorescence microscopy of supported lipid bilayers
Condensation of SNARE-containing proteoliposomes was used to generate supported bilayers on a quartz surface. A 10-min incubation of liposomes (3 mg/ml lipid) reconstituted with the SNARE complexes was followed by a second incubation with protein-free liposomes (15 mg/ml lipid) for 30–60 min. This additional step was found to reduce nonspecific binding of soluble proteins to the membrane. The data was collected with a total internal reflection (TIR) laser fluorescence microscope and analyzed as has been described previously (10). Lasers with emission at 532 nm and 635 nm were used to excite Cy3 and Cy5, respectively. The fluorescent image collected by a 60 × 1.2 NA water immersion objective (Nikon, Tokyo, Japan) was passed through a 550-nm longpass interference filter (Chroma Technology, Rockingham, VT) and split by a 650-nm dichroic mirror (Chroma) into a long and a short wavelength path. The two spectrally resolved images were relayed onto separate halves of a charged-coupled device detector (Pentamax, Roper Scientific, Tucson, AZ). For all observations, the longer wavelength path included an HQ700 × 75 nm bandpass emission filter (Chroma). The shorter wavelength path contained a 580 × 60 nm bandpass filter (Chroma). All observations were conducted at room temperature in TBS buffer augmented with 2% glucose and the enzymatic oxygen scavengers glucose oxidase 100 units/ml and catalase 1000 units/ml along with the triplet state quencher cyclooctatetraene (200 μM).
Integration of observed intensities and protein concentration
The point-spread function for our microchannel plate intensifier and microscope was 3.5–4 pixels across, so an approximately circular observation mask with a diameter of five pixels was used to ensure that all of the intensity present in a particular spot is integrated. Specifically, the actual area integrated was represented by the following mask of pixels centered on the brightest pixel at the center:
 |
This observation mask corresponds to an area of 0.79 mm2. Background signal levels were subtracted from the observed intensities and a Gaussian weighting matched to the instrument point-spread function was applied over the area of the mask. The values in the resulting array were summed to yield a final value that is simply referred to as the intensity of a particular spot.
The concentration of acceptor-dye labeled SNAREs in the deposited bilayer was adjusted by dilution until separation of individual complexes into optically resolved spots was achieved. This resulted in between 50 and 200 SNARE complexes per 4050 μm2 field of view. If one assumes the mean area per lipid to be 0.7 nm2 with two leaflets in the bilayer, one obtains 1.16 × 10¹⁰ lipids per field of view, which corresponds to a lipid/protein ratio on the order of 1:109.
Identification of binding events
Observations were carried out with donor-dye labeled effector (complexin or synaptotagmin) in solution and acceptor-labeled SNARE complexes reconstituted in the deposited bilayer. The view field was first illuminated with 635-nm light for 1 s to localize emission from the acceptor dye of SNARE complexes in the deposited bilayer. The spots selected at this stage of observation were monitored for effector (complexin or synaptotagmin) binding to the identified SNARE complexes during a period of illumination at 532 nm, which excites donor emission. The use of TIR was critical to reduce fluorescence from the majority of labeled protein in the bulk solution as only donor-labeled effector molecules within the evanescent field, extending 100–200 nm away from the bilayer, are excited by the laser. After 40 s of 532-nm illumination, the 635-nm light was used to probe possible photobleaching of the acceptor dye.
Potential binding of a donor-labeled effector in solution to an acceptor-labeled SNARE complex in the deposited bilayer was identified during the 40-s period of 532-nm illumination by the increase of acceptor and/or donor emission within a single timeframe (100 or 33 ms) to levels above background fluorescence for a particular spot that had been identified in the first 635-nm stage (Fig. 2). When donor-labeled effector binds to the acceptor-labeled SNARE complex, the donor dye comes into the TIR illuminated volume and acceptor emission occurs via FRET. If the molecules come close, but no binding occurs, only donor emission occurs within the particular spot. Intermediate binding events produce both acceptor and donor emission. To obtain single molecule statistics, only spots with one dye were selected as determined by the observed emission intensity (the expected emission intensity for a single dye was determined by observing steps of decreasing intensity during photobleaching and dye blinking which presumably correspond to single dye events). Stable binding was defined as the appearance of increased acceptor fluorescence for two or more consecutive time frames. Unbinding was defined as the subsequent return of the emission signal to background levels within a single frame.
FIGURE 2.

Single-molecule time traces selected for photobleaching and blinking. Background-corrected fluorescence emission intensity as a function of time for complexin and synaptotagmin binding events. (Red trace) Cy5 intensity from acceptor-labeled SNARE complex. (Green trace) Cy3 emission intensity from donor-labeled effector. Labeling pair combinations are (A) complexin-64–synaptobrevin-61; (B) complexin-105–syntaxin-249; (C) synaptotagmin-383–syntaxin-282; and (D) synaptotagmin-383–syntaxin-228. Samples are under green laser illumination, so Cy5 acceptor emission can only arise through FRET. The anticorrelated increase in Cy3 emission, when the Cy5 dye photobleaches, is a hallmark of single molecule FRET. Protein binding events were typically shorter than the half-life of photobleaching for Cy3 at this laser intensity. In the case of unbinding events, both donor and acceptor emission vanishes concurrently. Most binding events are free of photobleaching and blinking effects. For this figure, traces were specifically selected that display blinking and photobleaching to demonstrate single molecule level fluorescence detection.
Calculation of FRET
FRET efficiencies (E) were calculated from the background corrected intensities (Ĩ = Imeasured − Ibackground) of donor (Ĩdonor) and acceptor (Ĩacceptor) emission as E = Ĩacceptor/(Ĩacceptor + Ĩdonor). For events lasting two timeframes or longer, the FRET efficiency was calculated pointwise for the duration of the event (typically 0.5–1 s) and averaged to yield a single number per event. FRET efficiency values were converted to distances between the dye dipoles using
 |
where R is the distance and Ro is Förster radius (5.3 nm for the Cy3-Cy5 labeling pair) (see Fig. 3). The orientation of the fluorescent dipoles affects the relationship between FRET efficiency and distance. In the calculation of Ro, the factor (κ2) accounts for dye orientation and can range from 0 to 4. In calculating distances, we made the common assumption that κ2 = 2/3, which corresponds to freely rotating dyes.
Dynamic events faster than the 100-ms integration time of our detector were averaged on that interval by the detector. In particular, binding events initiated after the beginning of a time bin were averaged with the background level in the detector, with weighting according to the fraction of the integration time that FRET was present. Both the donor and acceptor intensities were affected equally. As FRET efficiencies were calculated as a ratio of donor and acceptor intensities, these partial frame events yielded the same FRET efficiency value as a full frame event. However, if the event was too short, the intensity did not rise above the background level and no event was detected.
Complexin binding and kinetics
We measured the duration of all binding events lasting two timeframes (200 ms) or longer as single-frame events that could not be confidently distinguished from noise. For complexin binding to the SNARE complex, the efficiency of FRET did not change significantly over the duration of an event that showed acceptor or donor emission. The average FRET efficiency values for all events (binding and nonbinding) were analyzed. The FRET efficiency values of many events for distinct spots corresponding to different SNARE complexes were assembled into histograms.
For the measurement of complexin binding kinetics, the SNARE complexes were assembled using synaptobrevin 1–96 (Ser61Cys) labeled with Cy5 and unlabeled syntaxin (Cys271Ile, Cys272Ile, and Ser193Cys). The appearance of acceptor emission within a single frame was taken as the beginning of a binding event whereas disappearance of acceptor emission within a single frame denoted unbinding. The duration of the high FRET efficiency state between complexin and the SNARE complex was taken as the dwell time in the bound state to determine koff. The majority of binding events observed were shorter than the measured half-life for Cy5 photobleaching. To measure kon, the complexin concentration was increased such that multiple binding events occurred during the 532-nm observation period for a given observation area. The time interval between consecutive high FRET efficiency events was taken as the “dwell time” in the unbound state. The higher concentration of dye-labeled complexin used in these experiments overwhelmed the Cy3 channel of the detector, so the emission of single donor dyes could not be resolved. However, this did not impede the ability to detect high FRET efficiency events in the long wavelength Cy5 channel of the detector. As such, we could observe the duration of binding events in the Cy5 channel, but the noise in the Cy3 channel prevented the calculation of individual FRET efficiency levels.
The durations of high acceptor emission events (intensities consistent with FRET = 1 from single FRET pairs) were measured and kon and koff were determined from exponential fits to histograms of the measured times (see Fig. 7). The kon rate was determined at two different concentrations (100 and 200 nM complexin, corresponding to observable concentrations of 84 nM and 168 nM when corrected for labeling efficiency); the rates were found to be similar. Likewise, the koff rate was found to be similar at 10 nM and at 100 nM. Kinetic data were acquired at frame rates of both 10 and 30 per s.
FIGURE 7.

Distribution of dwell times for individual complexin binding events. Complexin labeled at residue 64 with Cy3 (donor) was incubated at 100 nM over a bilayer containing SNARE complex labeled with Cy5 (acceptor) at residue 61 of synaptobrevin. (A) Dwell time in the bound state defined as residence time for one complete binding event. The number of molecules with a given residence time was plotted as a histogram. (B) Dwell time in the unbound state defined as time interval between the dissociation of complexin and the onset of the next binding event at the same SNARE complex. This analysis was performed on the subset of traces showing multiple binding events within a single time trace.
The complexin binding site in the SNARE complex consists of the groove formed at the interface between the parallel α-helices of syntaxin and synaptobrevin (27), so complexin would not be expected to bind to an antiparallel SNARE complex (10). To test this hypothesis, trial kinetic experiments were performed with and without urea selection for the parallel complex (data not shown). Identical results were obtained when the urea selection was omitted, so the kinetic results were collected on SNARE complexes without additional selection for the parallel configuration. Since we saw no evidence for interaction of complexin with the antiparallel complex, we tested the effect of complexin on the distribution of parallel and antiparallel complexes assembled in solution, but found that complexin had no effect on the resulting distribution (data not shown). The location of the SNARE complex labeling site, on synaptobrevin or syntaxin, also had no effect on the results (data not shown).
Synaptotagmin binding
Data collection and FRET efficiency analysis for synaptotagmin were as described for complexin. However, when synaptotagmin was incubated over the deposited Egg PC bilayer individual synaptotagmin molecules were observed to bind to and diffuse within the plane of the lipid bilayer even in the absence of phosphatidylserine (PS) and Ca2+ (data not shown). To only study interactions with the SNARE complex, transient encounters between synaptotagmin with the deposited bilayer had to be distinguished from genuine binding to the SNARE complex. Because the proteins are much smaller than the observation mask, one cannot determine with certainty if two colocalized dyes are truly in one complex. To distinguish SNARE binding from transient membrane interactions we assumed that for formation of a synaptotagmin-SNARE super-complex a jump in Cy3 emission from synaptotagmin should appear in a single timeframe at the location on the bilayer identified initially by the Cy5 emission from a SNARE complex, and that Cy3 emission from synaptotagmin should not be visible in the area surrounding the preidentified SNARE complex before it appears coincident with the SNARE complex. These two criteria also describe the binding of complexin, which does not interact with the deposited bilayer, and is characterized by observed binding events with the SNARE complex that appeared coincident within a single timeframe (Fig. 2). Synaptotagmin molecules observed to be moving laterally in the plane of the bilayer while observing the view field were thus excluded from the analysis.
RESULTS AND DISCUSSION
Random colocalization
Before investigating specific interactions between complexin and synaptotagmin with the SNARE complex it was necessary to study random encounters and possible nonspecific interactions with the deposited bilayer. First, we tested random encounters of donor (Cy3)-labeled complexin or synaptotagmin with a protein-free egg PC bilayer. These experiments were performed in the absence of Ca2+ and other divalent cations, and they lacked anionic lipids known to mediate synaptotagmin binding. Observation areas on the bilayer were chosen at random using the observation mask described in Materials and Methods. Some donor emission events were observed that fell into the particular observation areas (data not shown). On a protein-free bilayer, such random membrane encounter events occurred with a frequency of 0.003 ± 0.002 events μm−2 s−1.
Next, we examined possible interactions with a bilayer containing acceptor (Cy5)-labeled full-length synaptobrevin. Previous studies reported a lack of detectable binding between synaptobrevin and either complexin or synaptotagmin, although there are interactions involving the ternary SNARE complex (24,26,56,57). Consistent with the weak binding affinity with synaptobrevin alone, the only significant population of events exhibits FRET = 0 (Fig. 4, A and B). In our experiments, we verified the presence of an active acceptor by direct excitation with a red laser before initiation of the FRET efficiency measurements with the green laser. In contrast, some previous single molecule studies have relied on a single laser that excited only the donor dye, so colocalized dyes with FRET = 0 were not observable. In a study of FRET within doubly-labeled DNA molecules (2) a FRET = 0 population was observed that was partly attributed to the presence of nonfluorescent acceptor species. Since we excluded nonfluorescent acceptor species from our analysis, and photobleaching did not play a major role (see Fig. 6 D), the FRET = 0 peaks observed in our experiments are likely not related to these phenomena.
FIGURE 4.

Distribution of FRET efficiencies for individual binding events to a control bilayer. The control bilayer was Egg PC reconstituted with full-length synaptobrevin labeled with Cy5 (acceptor) at residue 61. (A) 20 nM complexin labeled with Cy3 (donor) at residue 64 was incubated above the control bilayer. (B) 20 nM synaptotagmin labeled with Cy3 (donor) at residue 269 was incubated above the control bilayer. Spots containing Cy5 emission were observed for colocalized Cy3 emission during the 40-s observation period at 532 nm. The number of colocalized molecules observed at a given FRET efficiency is plotted as an un-normalized histogram.
FIGURE 6.
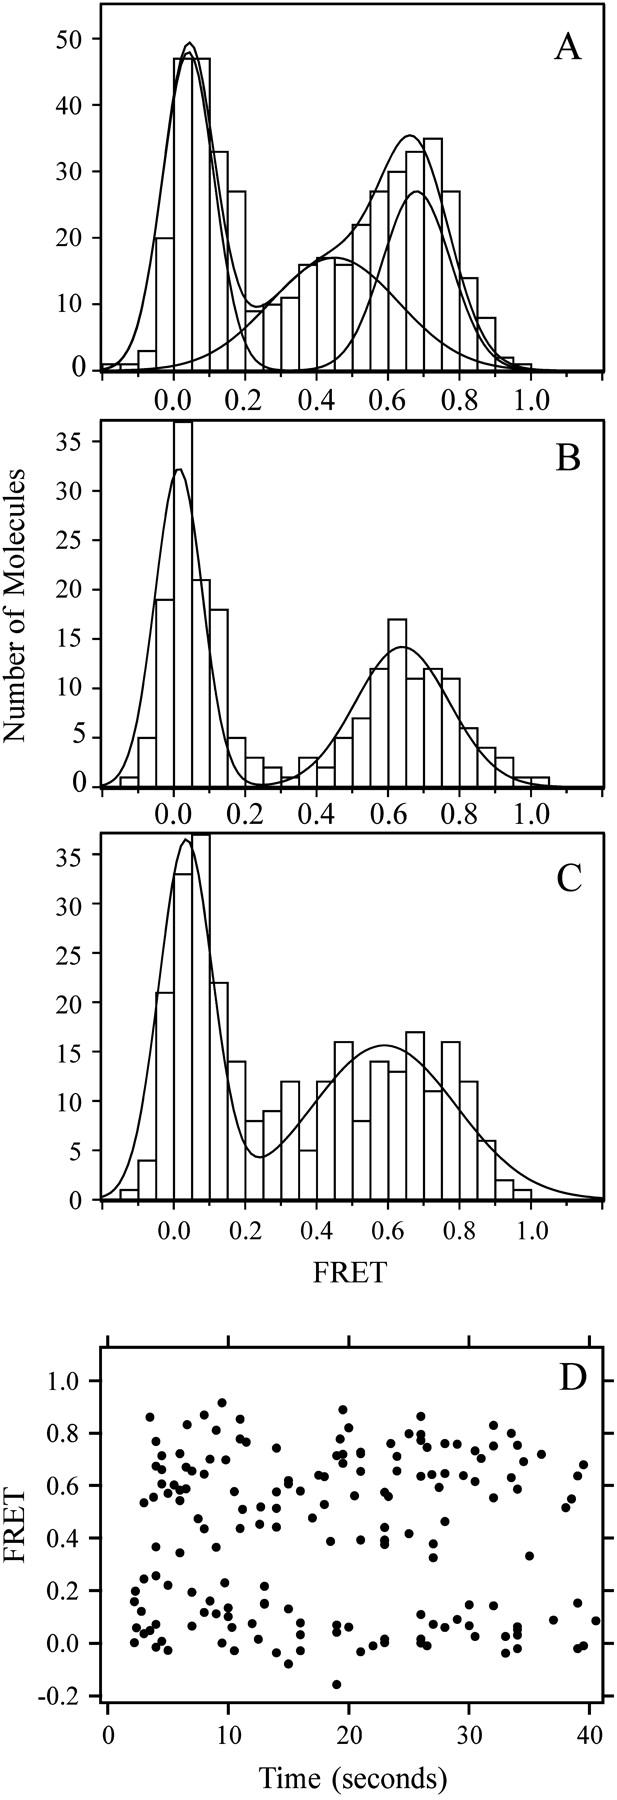
Distribution of FRET efficiency for individual binding events between complexin labeled in the unstructured region and the SNARE complex. Complexin was labeled at residue 105 with Cy3 (donor) and incubated above the bilayer at 10–20 nM. Separate experiments were performed for each SNARE complex labeling site. Colocalized Cy3 and Cy5 emission in the TIR illuminated volume was used to calculate the FRET efficiency. The number of molecules observed at a given FRET efficiency is plotted as a histogram. The main peaks in the histogram were fit to Gaussian distributions. (A) SNARE complex was labeled at residue 193 of syntaxin. Two Gaussian peaks were identified in the high FRET efficiency population. The mean efficiencies for two high FRET efficiency peaks were 0.464 ± 0.271, and 0.706 ± 0.138, respectively (χ2 = 2.18 for two peaks, whereas χ2 = 20.37 for a fitting to a single high FRET efficiency peak). (B) SNARE complex was labeled at residue 228 of syntaxin. The mean efficiency for the high FRET efficiency peak was 0.66 ± 0.182, respectively (χ2 = 2.21). (C) SNARE complex was labeled at residue 249 of syntaxin. The mean efficiency for the high FRET efficiency peak was 0.574 ± 0.336, respectively (χ2 = 11.38). (D) The FRET efficiency values from the experiment in A are plotted against the time that each event occurs during the 40-s observation period.
The FRET = 0 events in Fig. 4 occurred with a frequency of 0.003 ± 0.0009 events μm−2 s−1, which is identical to the random encounter rate to protein free bilayers described above. It should be noted that the diffusion of synaptobrevin or SNARE complexes in the deposited bilayers is limited—they are essentially stationary during the observation period. Thus, we conclude that random colocalization within the observation mask is the origin of the FRET = 0 peak in Fig. 4, A and B.
Complexin interactions with the SNARE complex
To validate the calculation of distances derived from single molecule FRET efficiency measurements, we studied the interaction of complexin with the SNARE complex for which a crystal structure is available (27,28). Full-length complexin was labeled at residue 64 with the donor Cy3, and incubated at 10–20 nM above a supported bilayer containing acceptor (Cy5)-labeled SNARE complexes. Bilayers reconstituted with SNARE complex were generally free of defects and approximately one-half of the SNARE complexes were oriented face-up (58). Despite the use of TIR to selectively illuminate the bilayer, the presence of donor dye in solution resulted in significant noise in the donor channel. This necessitated limiting the concentration of labeled protein in solution to 20 nM to allow measurement of FRET efficiency.
For ∼10% of the donor-labeled SNARE complexes that had been identified in the first illumination stage at 635 nm, a bound acceptor-labeled complexin molecule was observed at the onset of the second illumination stage at 532 nm. The emission from these persistently bound molecules disappeared on a timescale consistent with photobleaching (>10 s) under our experimental conditions. These prolonged interactions were distinct from the majority of complexin binding events that were transient and typically lasted 1 s or less. For molecules demonstrating transient binding events, the total time with a complexin molecule bound was ≪10% of the total observation time. The FRET efficiency values for persistently bound complexes were similar to those of the transient complexes. However, because of uncertainty about the nature of these complexes, this class of prolonged binding events was not included in the FRET efficiency distributions or kinetic analysis discussed below.
Binding of complexin, labeled with donor dye at residue 64, to the SNARE complex was probed with four different labels on the SNARE complex. The FRET efficiency values for all colocalized instances were determined, and compiled into a histogram for each acceptor labeling site on the SNARE complex (Fig. 5). The histograms of all four labeling site combinations were dominated by two peaks; a peak near FRET = 0 and high FRET efficiency peak. The FRET = 0 events occurred at a rate (0.002 ± 0.001 events μm−2 s−1) very similar to that observed for random encounters with control bilayers. A similar rate was observed for FRET = 0 events involving the residue 105 label of complexin (see Fig. 6). Although active acceptors were verified with 1 s of direct excitation from a red laser before the FRET efficiency measurements commenced with a green laser, photobleaching of the acceptor during the 40-s observation period could potentially have contributed to the FRET = 0 peak. To assess this possibility, we examined the FRET efficiency distributions as a function of time after the start of the green laser illumination. As can be seen in Fig. 6 D, the high FRET efficiency population was not observed to decrease with increasing observation time for complexin labeled at residue 105 and similar results were found for complexin labeled at residue 64 (not shown). By analyzing subsets of the data in Fig. 6 D grouped into early (2–13 s), intermediate (13–26 s), and late (26–40 s) times, we find that the ratio of the low FRET efficiency peak to the total number of events is 49%, 43%, and 47% for the early, intermediate, and late observation intervals, respectively. Thus, under our experimental conditions, photobleaching does not significantly contribute to the FRET = 0 population. Therefore, the FRET = 0 peak in Figs. 5 and 6 is entirely accounted for by random colocalization of labeled complexin and SNARE complex within a particular observation area.
FIGURE 5.

Distribution of FRET efficiency for individual binding events between complexin labeled in the structured region and the SNARE complex. Complexin was labeled at residue 64 with Cy3 (donor) and incubated above the bilayer at 10–20 nM. Separate experiments were performed for each SNARE complex labeling site. Colocalized Cy3 and Cy5 emission in the TIR illuminated volume was used to calculate the FRET efficiency. The number of molecules observed at a given FRET efficiency is plotted as a histogram. The high FRET efficiency peaks in the histograms were fit to Gaussian distributions. (A) SNARE complex was labeled at residue 193 of syntaxin. The mean efficiency for high FRET efficiency peak was 0.687 ± 0.081, respectively (χ2 = 1.72). (B) SNARE complex was labeled at residue 249 of syntaxin. The mean efficiency for the high FRET efficiency peak was 0.703 ± 0.158, respectively (χ2 = 2.89). (C) SNARE complex was labeled at residue 228 of syntaxin. The mean efficiency for the high FRET efficiency peak was 0.885 ± 0.079, respectively (χ2 = 0.46). (D) SNARE complex was labeled at residue 61 of synaptobrevin. The mean efficiency for the high FRET efficiency peak was 0.944 ± 0.049, respectively (χ2 = 3.86).
The high FRET efficiency peaks measured during binding of complexin, labeled at residue 64, to the N-terminal, central, and C-terminal SNARE complex labeling sites in syntaxin were fit to Gaussian distributions (Fig. 5). Unlike bulk FRET studies where only the mean is determined, a Gaussian fit to a single molecule FRET efficiency peak provides both the mean and the width of the corresponding distribution. Using the Förster radius (Ro) of 5.3 nm for the Cy3-Cy5 dye pair (59,60), which assumes isotropic dye rotation, these observed FRET efficiencies correspond to interprobe distances of 4.7, 3.8, and 4.6 nm, respectively. In the crystal structure of complexin bound to the SNARE complex, the corresponding distances between Cα atoms are 4.3, 2.0, and 4.6 nm, respectively. The uncertainty in the distance between the attachment points of the dye pair and their respective Cα atoms can be approximated as the corresponding Cα-Cα distance plus or minus twice the maximum length of the Cα-Sγ distance for a cysteine residue (±0.56 nm). Additional uncertainties arise in the position of the fluorescence dipole relative to the dye's attachment point, since a cyanine dye is nearly 1 nm in length. Considering these uncertainties, we nevertheless found close agreement between the attachment point distances derived from the crystal structure and the FRET-efficiency derived distances for the N- and C-terminal labeling sites.
The shortest distance, for the central syntaxin labeling site, was significantly overestimated (3.8 nm versus 2 nm), even considering the uncertainties in dye attachment point positions and cysteine conformations, and the width of the FRET efficiency peak. To test whether the discrepancy was due to the particular location chosen for the acceptor label, we moved the attachment point for the acceptor dye to residue 61 of synaptobrevin (Fig. 5 D). The observed FRET efficiency converts to a mean distance of 3.4 nm with a range of 2.7–3.7 nm, which still overestimates the distance of 1.6 nm observed in the crystal structure.
Reexamination of data collected on nearby labeling sites within the SNARE complex (see Figs. 2–4 in Ref. 10) also showed that the FRET efficiency resulted in overestimation of the expected distance. For example, intraprotein FRET within a SNARE complex containing synaptobrevin labeled at residue 28 and syntaxin labeled at residue 193 resulted in FRET = 0.97 ± 0.057 corresponding to a distance of 3.0 nm, which is larger than the distance of 1.2 nm found in the crystal structure (55). These short distances are at the edge of the sensitivity range for the Cy3-Cy5 dye pair (Fig. 3). Anisotropy increases, and direct ground and excited state interactions become possible when dyes are close together, further complicating the interpretation of FRET efficiencies (4,61). Thus, we conclude that a FRET-efficiency derived distance is most accurate when the distance is close (within 2 nm) to the Förster radius of the particular dye pair.
The width of the Gaussian peaks fit to the FRET efficiency distributions could be due to experimental error caused by counting statistics and background subtraction, but may also contain information about conformational variability or motional averaging. For complexin labeled at residue 64, the widths of the high FRET efficiency peaks are similar to those found earlier for labeling sites within the four-helix bundle of the SNARE complex (10). The effect of experimental error on these distribution widths should be similar since the experiments were performed using the same experimental setup. This suggests that the SNARE binding region of complexin, once bound to the SNARE complex, adopts a well-defined conformation despite the transient nature of the complexin-SNARE interaction.
Electron spin-resonance measurements of the interaction between full length complexin and the SNARE complex showed that the C-terminal portion of complexin lacked stable secondary structure while bound to the SNARE complex (25). We used single molecule FRET to obtain information about the unstructured C-terminal portion of complexin upon binding to the SNARE complex by labeling the wild-type cysteine at residue 105 with the Cy3 donor dye (Fig. 6). The width of the high FRET efficiency peaks increased relative to those seen for the complexin 64 labeling site. This is consistent with a variable conformation of the C-terminal part of complexin or motional averaging on a faster timescale than our measurement (∼100 ms), in agreement with previous findings (25).
For the N-terminal SNARE complex labeling site (syntaxin 193), the high FRET efficiency peak was not well fit by a single Gaussian, but was instead well fit by two Gaussian peaks (Fig. 6 A). These peaks correspond to mean attachment point distances of 5.5 and 4.7 nm, respectively. The difference between the mean distances is larger than the uncertainty associated with the position of the dye relative to the backbone, suggesting two distinct conformations. However, the widths associated with each distribution result in substantial overlap. For the central SNARE complex labeling site (syntaxin 228), the high FRET efficiency peak was fit by a single Gaussian that corresponds to an attachment point distance of 4.8 nm. For the C-terminal SNARE complex labeling site (syntaxin 249), the high FRET efficiency peak was very broad and the fit to a single Gaussian produced a mean attachment point distance of 5.0 nm within a range of 3.8–6.1 nm.
The FRET-efficiency derived distances can be used as constraints to position the unstructured part of complexin relative to the SNARE complex. The resulting possible positions of Cys105 indicate that the flexible 33 C-terminal residues of complexin folds back upon itself toward the membrane with Cys105 positioned near the central ionic layer of the SNARE complex, 2–3 nm away from the SNARE surface (depicted schematically in Fig. 1 A). The structured region of complexin binds the SNARE complex in the groove between the helices of syntaxin and synaptobrevin. The distance constraints are compatible with the unstructured C-terminus of complexin positioned on either side of this groove, which could account for the two mean conformations with respect to the N-terminal SNARE complex labeling site.
Kinetics of complexin binding
In addition to measuring FRET efficiency values, we also obtained kinetic information about the duration of individual binding events and the time between binding events. The duration, or dwell time, of all observed binding events was measured and compiled into a histogram showing the number of events that occurred with a given duration. The distribution of the observed dwell times in the bound state could be fit to a single exponential to yield a value for koff of 2.5 s−1 independent of protein concentration (Fig. 7 A). To obtain kon for complexin binding to the SNARE complex, we measured the length of time between consecutive complexin binding events (i.e., the dwell time in the unbound state). To collect a sufficient number of time traces showing multiple binding events, we had to use higher concentrations of donor (Cy3)-labeled complexin (100–200 nM). The distribution of dwell times in the unbound state was fit to a single exponential to yield a value for kon of 3.6 × 10⁶ M−1 s−1 (Fig. 7 B). Based on the observed binding and unbinding constants at 100 nM concentration, we obtained an equilibrium binding constant KD of 670 nM. At 200 nM concentration, we obtained kon = 3.1 × 10⁶ M−1 s−1, which results in a slightly higher estimate for KD of 800 nM.
A previous study, using stopped-flow fluorescence, reported a KD of 10 nM, which was confirmed with isothermal titration calorimetry, and values for koff of 0.31 s−1 and kon of 3.1 × 10⁷ M−1 s−1 (25). Compared to these measurements, our single molecule experiments produced a slower kon and a faster koff (both by an order of magnitude). However, the stopped-flow and isothermal titration calorimetry studies used a soluble protease-resistant core of SNARE complex in solution to study binding, whereas here we used a SNARE complex containing full-length syntaxin and SNAP-25 reconstituted into a lipid bilayer. Thus, the differences between the two studies might have affected the energetics of binding (62), and as such, the binding constants cannot be directly compared. Both studies relied on fluorescently tagged proteins, so, although our particular choices of labeling sites and dyes could have slightly affected the energetics of the interaction, the presence of a fluorescent dye is not an obvious difference between the two studies. Indeed, using native gel electrophoresis we examined the effect of dye labeling on the binding of complexin to the cytoplasmic portion of the SNARE complex. We found that both labeled and unlabeled complexin resulted in identical electrophoretic shifts of a soluble SNARE complex (data not shown).
Ca2+-dependent synaptotagmin interactions with PS/PC deposited bilayers
Synaptotagmin probably acts in exocytosis through its ability to bind membranes (44). This activity is dependent on both Ca2+ and the presence of acidic phospholipids such as phosphatidylserine and phosphatidylinositol in the membrane (29,31,33,35). To test the specific activity of fluorescently labeled synaptotagmin we characterized the Ca2+-dependence of phospholipid binding (Fig. 8). For these experiments, 10 nM Cy3-labeled synaptotagmin was incubated above a planar-deposited bilayer composed of 70% egg PC and 30% brain PS in the presence of varying Ca2+ concentrations. After a 10-min incubation, the bilayer was rinsed briefly and the mean intensity of the bilayer was measured in several areas. Maximal binding to the membrane was reached at 50 μM Ca2+, in agreement with previous studies using co-sedimentation (31,33). This effect was blocked by EGTA and dependent on the concentration of PS in the deposited bilayer (Fig. 8, points off axis). Binding was reduced by an order of magnitude when the PS concentration was dropped from 30% to 10%. Although 1 mM Mg2+ stimulated binding slightly, the effect was nearly three orders-of-magnitude less than membrane binding stimulated by 1 mM Ca2+. It should be noted that the sensitivity of single molecule detection revealed low levels of synaptotagmin binding to PS free bilayers (Fig. 8). These bound molecules were visible as rapidly diffusing point sources in the plane of the membrane (data not shown).
FIGURE 8.

Ca2+ and phosphatidylserine dependence of synaptotagmin binding to deposited planar bilayers. Synaptotagmin labeled at residue 269 with Cy3 was incubated at 10 nM over a bilayer composed of 70% egg PC and 30% brain PS for 10 min and rinsed away. To assess binding, the average intensity of the field of view was determined at each condition indicated. Results for single point determinations of control binding are shown at the right of the panel: 30% PS bilayers in the presence of 1 mM EGTA (star), 10% PS bilayers in the presence of 1 mM Ca2+ (square), 0% PS bilayer in the presence of 1 mM Ca2+ (triangle), and 30% PS bilayer in the presence of 1 mM Mg2+ (circle). Error bars show the standard deviation of the average of sampling 10 view-fields of the bilayer.
Synaptotagmin interactions with the SNARE complex
Unlike complexin, no structural information is available for synaptotagmin bound to the SNARE complex. In biochemical assays, synaptotagmin has been shown to bind to both the full-length and truncated SNARE complex, the binary syntaxin-SNAP-25 complex, as well as the isolated SNAREs, syntaxin and SNAP-25 (38–42,56,63). Both Ca2+-dependent and independent interactions have been observed. Because previous biophysical studies have focused on the interaction of synaptotagmin with detergent solubilized or truncated SNARE complexes, we sought to characterize the Ca2+-dependency of the interaction of the cytoplasmic domain of synaptotagmin I with the neuronal SNARE complex incorporated into lipid bilayers, which is an important step toward an accurate representation of the physiological environment of this interaction. It should be noted that synaptotagmin has been postulated to interact with a partially folded trans SNARE complex that bridges two opposing membranes, a topology that will be studied in the future.
The cytoplasmic domain of synaptotagmin I is composed of two C2 domains connected by a short unstructured linker (30,64). To probe interactions with the SNARE complex, we created a series of point mutations in the cytoplasmic domain by placing fluorescent labeling sites in the C2A domain (Gln154Cys), the interdomain linker (Glu269Cys), and the C2B domain (Thr383Cys) (Fig. 1 B). These three mutants all behaved identically to wild-type in size-exclusion chromatography, lipid binding, and SNARE complex interactions as assessed by native gel shifts (data not shown). As mentioned above, in experiments with protein-free bilayers, synaptotagmin displayed Ca2+-dependent membrane binding that was dependent on the presence on PS lipids, so we used an egg PC bilayer in an attempt to deconvolve membrane binding from synaptotagmin-SNARE interactions.
The affinity of synaptotagmin for the SNARE complex is much lower than that of complexin. First, unlike complexin, synaptotagmin fails to co-migrate with the SNARE complex during size-exclusion chromatography (data not shown). Second, a concentration of at least 10 μM was required to achieve a Ca2+-dependent effect for synaptotagmin in reconstituted fusion experiments, which is suggestive of a low affinity interaction (48).
In 18 separate experiments, the three labeling sites in synaptotagmin were screened for interactions with each of the three SNARE complex labeling sites both in the presence and absence of 1 mM Ca2+ (Fig. 9). As synaptotagmin showed low levels of interaction with the egg PC bilayer, only those events showing a donor emission increase above baseline within a single frame were selected for FRET efficiency analysis. This is in contrast to membrane-bound synaptotagmin molecules that were visibly diffusing in the plane of the membrane, which gave rise to an increase in donor (but not acceptor) emission over several frames. All histograms were dominated by a peak close to FRET = 0 that accumulated at a rate (without Ca2+, 0.0014 ± 0.00095 events μm−2 s−1 and with Ca2+, 0.002 ± 0.0006 events μm−2 s−1) consistent with random colocalization with SNARE complexes in the deposited bilayer within the observation area (Fig. 9). Few FRET > 0 events were seen, presumably due to the rapid off-rate observed for the interaction of synaptotagmin with the SNARE complex.
FIGURE 9.

Ca2+-dependence of the distribution of FRET efficiency for individual binding events with synaptotagmin. The deposited bilayer was reconstituted with SNARE complexes containing a Cy5 (acceptor) label on one of three sites on syntaxin. The cytoplasmic domain of synaptotagmin 1 was labeled at one of three sites with Cy3 (donor) and incubated over the bilayer at 10–20 nM. Eighteen separate experiments were performed. The specific labeling-site combination used is indicated in each panel. Colocalized Cy3 and Cy5 emission in the TIR illuminated volume was used to calculate the FRET efficiency. The number of molecules observed at a given FRET efficiency is plotted as a histogram. Panels are arranged in paired columns of histograms. Empty bars denote events in the absence of Ca2+. Solid bars denote events in the presence of 1 mM calcium chloride. The histograms are organized in three rows according to the SNARE complex labeling site. (Top row) SNARE complex was labeled at residue 193 of syntaxin. (Middle row) SNARE complex was labeled at residue 228 of syntaxin. (Bottom row) SNARE complex was labeled at residue 249 of syntaxin. Histograms are further divided into three blocks of paired columns according to the synaptotagmin labeling site. (Left two columns) Synaptotagmin was labeled at residue 154 in the C2A domain. (Central two columns) Synaptotagmin was labeled at residue 269 in the interdomain linker. (Right two columns) Synaptotagmin was labeled at residue 383 in the C2B domain. In each histogram, SFC refers to the labeling site position in the SNARE complex whereas SYT refers to the labeling site in synaptotagmin.
In the presence of Ca2+, a dramatic increase in the frequency of high FRET efficiency events was observed for several labeling-site combinations. Despite the low protein concentrations used and membranes lacking negatively charged lipids, residual membrane binding by synaptotagmin gave rise to background fluorescence, which complicated background subtraction. This highlights the importance of finding a truly inert surface, free from nonspecific interaction, to allow accurate determination of FRET efficiency. Thus, we did not attempt to derive distances between dye attachment-points in the synaptotagmin-SNARE complex. However, the observation of FRET between selected labeling sites allowed structural constraints to be placed on the complex.
For the complete cytoplasmic fragment of synaptotagmin studied here, the C2A domain showed the fewest high FRET efficiency interactions with the SNARE complex for all labeling-site combinations both in the presence and absence of added Ca2+ (Fig. 9). The synaptotagmin linker labeling-site showed the most dramatic change in the FRET efficiency distributions upon the addition of Ca2+: high FRET efficiency interactions between the linker and the central and C-terminal SNARE labeling sites increased five- to sixfold. Slight increases in intermediate FRET efficiency interactions were seen for the N-terminal and central SNARE labeling sites.
The Ca2+ dependency of the FRET efficiency distributions for the C2B domain was similar to that seen for the linker, although less pronounced: a two- to threefold increase in high FRET efficiency interactions was seen to the central and C-terminal SNARE labeling sites (Fig. 9). Similar to the synaptotagmin linker, slight increases in intermediate FRET efficiency interactions were seen to the N-terminal and central sites along with minimal change to the C-terminal site. The interdomain linker and the C2B domain showed the largest populations of high FRET efficiency interactions with the central and C-terminal portions of the SNARE complex.
The durations of the high FRET efficiency events were compiled into a histogram and fit to a single exponential to yield an approximate value for koff of 9.4 s−1. This rate is approximately fourfold faster than the value obtained for complexin. However, this rate is close to the frame-rate of the camera. As such, this value is likely a lower bound for the off-rate since many events are shorter than the two-timeframe criterion used to select binding events.
Implications for the synaptotagmin-SNARE complex
Binding to the regulatory N-terminal domain of syntaxin has been reported that should result in low FRET efficiency events (approaching FRET = 0) depending on the conformation of that domain (65). However, the FRET = 0 events for synaptotagmin are fully accounted for as false colocalizations. Furthermore, native gel shift experiments did not reveal a difference in synaptotagmin binding in the absence of presence of the N-terminal syntaxin domain. Thus, we conclude that synaptotagmin binding occurs primarily to the core of the SNARE complex.
Biochemical studies using bead-based pulldown and native gel shift assays suggested Ca2+-independent interactions between synaptotagmin and with detergent-solubilized or truncated cis SNARE complexes (41,64), although Ca2+-dependent interactions have also been reported (56). Our single molecule experiments revealed Ca2+ dependence of FRET efficiencies between several labeling pairs, confirming the Ca2+-dependence of the synaptotagmin-SNARE interaction. Perhaps the confinement in beads or gels produces the apparent Ca2+-independence of the synaptotagmin-SNARE interaction in gel shift and pulldown experiments (66).
The labeling-site combinations with high FRET efficiency in the presence of Ca2+ places structural constraints on the synaptotagmin-SNARE super-complex. The labeling sites of the SNARE complex involved in such high FRET efficiency interactions are near the ionic layer and the membrane proximal region, in qualitative agreement with biochemical studies that implied the membrane proximal region of the SNARE complex in synaptotagmin binding (38-40,56,67). A C2 domain of synaptotagmin consists of an eight-stranded β-sandwich with the Ca2+ binding sites formed by loops at one end of the molecule (34,68,69). From end to end, the C2 domains are >4.5 nm in length. Since the fluorescent probes are in a loop distal to the Ca2+-binding sites, the appearance of high FRET efficiency between the SNARE complex and C2B is more consistent with the Ca2+-binding sites oriented away from the SNARE complex rather than in direct contact. This would leave the Ca2+-binding sites accessible for phospholipid binding, allowing concurrent binding of both SNAREs and membrane although the presence of 30% PS in the membrane appears to interfere with the SNARE interaction (46). This raises the question as to how synaptotagmin can have a Ca2+-dependent interaction with SNAREs that does not utilize the Ca2+-binding loops. Previous studies have shown that the stability of the C2B domain is coupled to Ca2+ binding (34). Thus, it may be possible that the more stable state induced by Ca2+ also serves to stabilize the SNARE binding sites in the distal end of the C2 domain.
Previous analysis of synaptotagmin deletion mutants in vivo as well as recombinant protein binding studies have alternatively suggested that only the C2A domain or both C2 domains are necessary for SNARE binding (39,67,70,71). However, we found very few high FRET efficiency interactions between C2A and the SNARE complex. Thus, the low number of FRET events observed between C2A and the SNARE labeling sites suggests that the C2A domain does not closely interact with the SNARE core complex.
CONCLUSIONS
Transient protein-protein interactions are difficult to study using bulk biophysical and biochemical methods due to the resulting heterogeneity in the sample. Furthermore, few methods exist to study protein interactions near or at the membrane surface. In this work we illustrate that single molecule spectroscopy is capable of simultaneously revealing kinetic and structural details of transient binding events between proteins localized to membranes. We have characterized the binding of complexin and synaptotagmin to SNARE complexes reconstituted into supported lipid bilayers. For complexin bound to the SNARE complex, we found that distances derived from single molecule FRET efficiency measurements agree favorably with those observed in the x-ray crystal structure of the complex. Kinetic data were obtained for complexin-SNARE interactions at the membrane surface.
We also obtained structural information about the low affinity interaction between synaptotagmin and the SNARE complex. The Ca2+-dependent interactions between pairwise-labeling combinations confirm biochemical data that suggested a Ca2+-dependent interaction between synaptotagmin and the membrane-proximal half of the SNARE core complex, but they contradict reports on Ca2+-independent interactions (41,44,56). We expect the techniques used in this work to be useful in general for revealing structural and kinetic details for other transient protein-protein complexes.
Acknowledgments
We thank Jennifer Alyono, Anton Rosenbaum, Mark Breidenbach, and Barry Wilk for technical assistance, and Marius Clore, Timothy D. Fenn, and Marija Vrljic for critical reading.
This work was supported in part by National Institutes of Health grant No. 1-RO1-MH63105-01 to A.T.B., and National Science Foundation, Air Force Office of Scientific Research, and National Aeronautics and Space Administration grants to S.C. The research of K.W. is supported in part by a Career Award at the Scientific Interface from the Burroughs Wellcome Fund.
Mark E. Bowen and Keith Weninger contributed equally to this work.
Keith Weninger's present address is Physics Department, North Carolina State University, Raleigh, NC 27695.
James Ernst's present address is Genentech Inc., Protein Chemistry Department, 1 DNA Way, South San Francisco, CA 94080.
Steven Chu's present address is Lawrence Berkeley National Lab, 1 Cyclotron Road, Mail Stop 50A-4119, Berkeley, CA 94720.
References
- 1.Stryer, L., and R. P. Haugland. 1967. Energy transfer: a spectroscopic ruler. Proc. Natl. Acad. Sci. USA. 58:719–726. [DOI] [PMC free article] [PubMed] [Google Scholar]
- 2.Deniz, A. A., M. Dahan, J. R. Grunwell, T. Ha, A. E. Faulhaber, D. S. Chemla, S. Weiss, and P. G. Schultz. 1999. Single-pair fluorescence resonance energy transfer on freely diffusing molecules: observation of Förster distance dependence and subpopulations. Proc. Natl. Acad. Sci. USA. 96:3670–3675. [DOI] [PMC free article] [PubMed] [Google Scholar]
- 3.Schuler, B., E. A. Lipman, P. J. Steinbach, M. Kumke, and W. A. Eaton. 2005. Polyproline and the “spectroscopic ruler” revisited with single-molecule fluorescence. Proc. Natl. Acad. Sci. USA. 102:2754–2759. [DOI] [PMC free article] [PubMed] [Google Scholar]
- 4.Dietrich, A., V. Buschmann, C. Muller, and M. Sauer. 2002. Fluorescence resonance energy transfer (FRET) and competing processes in donor-acceptor substituted DNA strands: a comparative study of ensemble and single-molecule data. Rev. Mol. Biotechnol. 82:211–231. [DOI] [PubMed] [Google Scholar]
- 5.Deniz, A. A., T. A. Laurence, G. S. Beligere, M. Dahan, A. B. Martin, D. S. Chemla, P. E. Dawson, P. G. Schultz, and S. Weiss. 2000. Single-molecule protein folding: diffusion fluorescence resonance energy transfer studies of the denaturation of chymotrypsin inhibitor 2. Proc. Natl. Acad. Sci. USA. 97:5179–5184. [DOI] [PMC free article] [PubMed] [Google Scholar]
- 6.Ha, T., A. Y. Ting, J. Liang, W. B. Caldwell, A. A. Deniz, D. S. Chemla, P. G. Schultz, and S. Weiss. 1999. Single-molecule fluorescence spectroscopy of enzyme conformational dynamics and cleavage mechanism. Proc. Natl. Acad. Sci. USA. 96:893–898. [DOI] [PMC free article] [PubMed] [Google Scholar]
- 7.Hu, D., and H. P. Lu. 2004. Placing single-molecule T4 lysozyme enzymes on a bacterial cell surface: toward probing single-molecule enzymatic reaction in living cells. Biophys. J. 87:656–661. [DOI] [PMC free article] [PubMed] [Google Scholar]
- 8.Margittai, M., J. Widengren, E. Schweinberger, G. F. Schroder, S. Felekyan, E. Haustein, M. Konig, D. Fasshauer, H. Grubmuller, R. Jahn, and C. A. Seidel. 2003. Single-molecule fluorescence resonance energy transfer reveals a dynamic equilibrium between closed and open conformations of syntaxin 1. Proc. Natl. Acad. Sci. USA. 100:15516–15521. [DOI] [PMC free article] [PubMed] [Google Scholar]
- 9.Talaga, D. S., W. L. Lau, H. Roder, J. Tang, Y. Jia, W. F. DeGrado, and R. M. Hochstrasser. 2000. Dynamics and folding of single two-stranded coiled-coil peptides studied by fluorescent energy transfer confocal microscopy. Proc. Natl. Acad. Sci. USA. 97:13021–13026. [DOI] [PMC free article] [PubMed] [Google Scholar]
- 10.Weninger, K., M. E. Bowen, S. Chu, and A. T. Brunger. 2003. Single-molecule studies of SNARE complex assembly reveal parallel and antiparallel configurations. Proc. Natl. Acad. Sci. USA. 100:14800–14805. [DOI] [PMC free article] [PubMed] [Google Scholar]
- 11.Yasuda, R., T. Masaike, K. Adachi, H. Noji, H. Itoh, and K. Kinosita, Jr. 2003. The ATP-waiting conformation of rotating F1-ATPase revealed by single-pair fluorescence resonance energy transfer. Proc. Natl. Acad. Sci. USA. 100:9314–9318. [DOI] [PMC free article] [PubMed] [Google Scholar]
- 12.Murthy, V. N., and P. De Camilli. 2003. Cell biology of the presynaptic terminal. Annu. Rev. Neurosci. 26:701–728. [DOI] [PubMed] [Google Scholar]
- 13.Jahn, R., T. Lang, and T. C. Sudhof. 2003. Membrane fusion. Cell. 112:519–533. [DOI] [PubMed] [Google Scholar]
- 14.Sabatini, B. L., and W. G. Regehr. 1996. Timing of neurotransmission at fast synapses in the mammalian brain. Nature. 384:170–172. [DOI] [PubMed] [Google Scholar]
- 15.Jahn, R., and T. C. Südhof. 1993. Synaptic vesicle traffic: rush hour in the nerve terminal. J. Neurochem. 61:12–21. [DOI] [PubMed] [Google Scholar]
- 16.Llinas, R., I. Z. Steinberg, and K. Walton. 1981. Relationship between presynaptic calcium current and postsynaptic potential in squid giant synapse. Biophys. J. 33:323–351. [DOI] [PMC free article] [PubMed] [Google Scholar]
- 17.Katz, B., and R. Miledi. 1967. The timing of calcium action during neuromuscular transmission. J. Physiol. 189:535–544. [DOI] [PMC free article] [PubMed] [Google Scholar]
- 18.Hu, C., M. Ahmed, T. J. Melia, T. H. Sollner, T. Mayer, and J. E. Rothman. 2003. Fusion of cells by flipped SNAREs. Science. 300:1745–1749. [DOI] [PubMed] [Google Scholar]
- 19.Weber, T., B. V. Zemelman, J. A. McNew, B. Westermann, M. Gmachl, F. Parlati, T. H. Sollner, and J. E. Rothman. 1998. SNAREpins: minimal machinery for membrane fusion. Cell. 92:759–772. [DOI] [PubMed] [Google Scholar]
- 20.Marz, K. E., and P. I. Hanson. 2002. Sealed with a twist: complexin and the synaptic SNARE complex. Trends Neurosci. 25:381–383. [DOI] [PubMed] [Google Scholar]
- 21.Südhof, T. C., and J. Rizo. 1996. Synaptotagmins: C2-domain proteins that regulate membrane traffic. Neuron. 17:379–388. [DOI] [PubMed] [Google Scholar]
- 22.Koh, T. W., and H. J. Bellen. 2003. Synaptotagmin I, a Ca2+ sensor for neurotransmitter release. Trends Neurosci. 26:413–422. [DOI] [PubMed] [Google Scholar]
- 23.Bai, J., and E. R. Chapman. 2004. The C2 domains of synaptotagmin—partners in exocytosis. Trends Biochem. Sci. 29:143–151. [DOI] [PubMed] [Google Scholar]
- 24.McMahon, H. T., M. Missler, C. Li, and T. C. Südhof. 1995. Complexins: cytosolic proteins that regulate SNAP receptor function. Cell. 83:111–119. [DOI] [PubMed] [Google Scholar]
- 25.Pabst, S., M. Margittai, D. Vainius, R. Langen, R. Jahn, and D. Fasshauer. 2002. Rapid and selective binding to the synaptic SNARE complex suggests a modulatory role of complexins in neuroexocytosis. J. Biol. Chem. 277:7838–7848. [DOI] [PubMed] [Google Scholar]
- 26.Pabst, S., J. W. Hazzard, W. Antonin, T. C. Südhof, R. Jahn, J. Rizo, and D. Fasshauer. 2000. Selective interaction of complexin with the neuronal SNARE complex. Determination of the binding regions. J. Biol. Chem. 275:19808–19818. [DOI] [PubMed] [Google Scholar]
- 27.Chen, X., D. R. Tomchick, E. Kovrigin, D. Arac, M. Machius, T. C. Südhof, and J. Rizo. 2002. Three-dimensional structure of the complexin/SNARE complex. Neuron. 33:397–409. [DOI] [PubMed] [Google Scholar]
- 28.Bracher, A., J. Kadlec, H. Betz, and W. Weissenhorn. 2002. X-ray structure of a neuronal complexin-SNARE complex from squid. J. Biol. Chem. 277:26517–26523. [DOI] [PubMed] [Google Scholar]
- 29.Perin, M. S., V. A. Fried, G. A. Mignery, R. Jahn, and T. C. Südhof. 1990. Phospholipid binding by a synaptic vesicle protein homologous to the regulatory region of protein kinase C. Nature. 345:260–263. [DOI] [PubMed] [Google Scholar]
- 30.Perin, M. S., N. Brose, R. Jahn, and T. C. Südhof. 1991. Domain structure of synaptotagmin (p65). J. Biol. Chem. 266:623–629. [PubMed] [Google Scholar]
- 31.Brose, N., A. G. Petrenko, T. C. Südhof, and R. Jahn. 1992. Synaptotagmin: a calcium sensor on the synaptic vesicle surface. Science. 256:1021–1025. [DOI] [PubMed] [Google Scholar]
- 32.Davletov, B. A., and T. C. Sudhof. 1993. A single C2 domain from synaptotagmin I is sufficient for high affinity Ca2+/phospholipid binding. J. Biol. Chem. 268:26386–26390. [PubMed] [Google Scholar]
- 33.Chapman, E. R., and R. Jahn. 1994. Calcium-dependent interaction of the cytoplasmic region of synaptotagmin with membranes. Autonomous function of a single C2-homologous domain. J. Biol. Chem. 269:5735–5741. [PubMed] [Google Scholar]
- 34.Fernandez, I., D. Arac, J. Ubach, S. H. Gerber, O. Shin, Y. Gao, R. G. Anderson, T. C. Südhof, and J. Rizo. 2001. Three-dimensional structure of the synaptotagmin I C2B-domain: synaptotagmin I as a phospholipid binding machine. Neuron. 32:1057–1069. [DOI] [PubMed] [Google Scholar]
- 35.Bai, J., W. C. Tucker, and E. R. Chapman. 2004. PIP2 increases the speed of response of synaptotagmin and steers its membrane-penetration activity toward the plasma membrane. Nat. Struct. Mol. Biol. 11:36–44. [DOI] [PubMed] [Google Scholar]
- 36.Bennett, M. K., N. Calakos, and R. H. Scheller. 1992. Syntaxin: a synaptic protein implicated in docking of synaptic vesicles at presynaptic active zones. Science. 257:255–259. [DOI] [PubMed] [Google Scholar]
- 37.Söllner, T., M. K. Bennett, S. W. Whiteheart, R. H. Scheller, and J. E. Rothman. 1993. A protein assembly-disassembly pathway in vitro that may correspond to sequential steps of synaptic vesicle docking, activation, and fusion. Cell. 75:409–418. [DOI] [PubMed] [Google Scholar]
- 38.Chapman, E. R., P. I. Hanson, S. An, and R. Jahn. 1995. Ca2+ regulates the interaction between synaptotagmin and syntaxin 1. J. Biol. Chem. 270:23667–23671. [DOI] [PubMed] [Google Scholar]
- 39.Kee, Y., and R. H. Scheller. 1996. Localization of synaptotagmin-binding domains on syntaxin. J. Neurosci. 16:1975–1981. [DOI] [PMC free article] [PubMed] [Google Scholar]
- 40.Schiavo, G., G. Stenbeck, J. E. Rothman, and T. H. Söllner. 1997. Binding of the synaptic vesicle v-SNARE, synaptotagmin, to the plasma membrane t-SNARE, SNAP-25, can explain docked vesicles at neurotoxin-treated synapses. Proc. Natl. Acad. Sci. USA. 94:997–1001. [DOI] [PMC free article] [PubMed] [Google Scholar]
- 41.Rickman, C., and B. Davletov. 2003. Mechanism of calcium-independent synaptotagmin binding to target SNAREs. J. Biol. Chem. 278:5501–5504. [DOI] [PubMed] [Google Scholar]
- 42.Ernst, J. A., and A. T. Brunger. 2003. High resolution structure, stability, and synaptotagmin binding of a truncated neuronal SNARE complex. J. Biol. Chem. 278:8630–8636. [DOI] [PubMed] [Google Scholar]
- 43.Fernandez-Chacon, R., A. Konigstorfer, S. H. Gerber, J. Garcia, M. F. Matos, C. F. Stevens, N. Brose, J. Rizo, C. Rosenmund, and T. C. Südhof. 2001. Synaptotagmin I functions as a calcium regulator of release probability. Nature. 410:41–49. [DOI] [PubMed] [Google Scholar]
- 44.Shin, O. H., J. S. Rhee, J. Tang, S. Sugita, C. Rosenmund, and T. C. Südhof. 2003. Sr2+ binding to the Ca2+ binding site of the synaptotagmin 1 C2B domain triggers fast exocytosis without stimulating SNARE interactions. Neuron. 37:99–108. [DOI] [PubMed] [Google Scholar]
- 45.Weimer, R. M., and E. M. Jorgensen. 2003. Controversies in synaptic vesicle exocytosis. J. Cell Sci. 116:3661–3666. [DOI] [PubMed] [Google Scholar]
- 46.Arac, D., T. Murphy, and J. Rizo. 2003. Facile detection of protein-protein interactions by one-dimensional NMR spectroscopy. Biochemistry. 42:2774–2780. [DOI] [PubMed] [Google Scholar]
- 47.Bai, J., C. T. Wang, D. A. Richards, M. B. Jackson, and E. R. Chapman. 2004. Fusion pore dynamics are regulated by synaptotagmin*t-SNARE interactions. Neuron. 41:929–942. [DOI] [PubMed] [Google Scholar]
- 48.Tucker, W. C., T. Weber, and E. R. Chapman. 2004. Reconstitution of Ca2+-regulated membrane fusion by synaptotagmin and SNAREs. Science. 304:435–438. [DOI] [PubMed] [Google Scholar]
- 49.Blanchard, S. C., R. L. Gonzalez, H. D. Kim, S. Chu, and J. D. Puglisi. 2004. tRNA selection and kinetic proofreading in translation. Nat. Struct. Mol. Biol. 11:1008–1014. [DOI] [PubMed] [Google Scholar]
- 50.Zhuang, X., H. Kim, M. J. Pereira, H. P. Babcock, N. G. Walter, and S. Chu. 2002. Correlating structural dynamics and function in single ribozyme molecules. Science. 296:1473–1476. [DOI] [PubMed] [Google Scholar]
- 51.Bowen, M. E., D. M. Engelman, and A. T. Brunger. 2002. Mutational analysis of synaptobrevin transmembrane domain oligomerization. Biochemistry. 41:15861–15866. [DOI] [PubMed] [Google Scholar]
- 52.Desai, R. C., B. Vyas, C. A. Earles, J. T. Littleton, J. A. Kowalchyck, T. F. Martin, and E. R. Chapman. 2000. The C2B domain of synaptotagmin is a Ca2+-sensing module essential for exocytosis. J. Cell Biol. 150:1125–1136. [DOI] [PMC free article] [PubMed] [Google Scholar]
- 53.Ubach, J., Y. Lao, I. Fernandez, D. Arac, T. C. Südhof, and J. Rizo. 2001. The C2B domain of synaptotagmin I is a Ca2+-binding module. Biochemistry. 40:5854–5860. [DOI] [PubMed] [Google Scholar]
- 54.Fasshauer, D., W. K. Eliason, A. T. Brunger, and R. Jahn. 1998. Identification of a minimal core of the synaptic SNARE complex sufficient for reversible assembly and disassembly. Biochemistry. 37:10354–10362. [DOI] [PubMed] [Google Scholar]
- 55.Sutton, R. B., D. Fasshauer, R. Jahn, and A. T. Brunger. 1998. Crystal structure of a SNARE complex involved in synaptic exocytosis at 2.4 Å resolution. Nature. 395:347–353. [DOI] [PubMed] [Google Scholar]
- 56.Gerona, R. R., E. C. Larsen, J. A. Kowalchyk, and T. F. Martin. 2000. The C-terminus of SNAP25 is essential for Ca2+-dependent binding of synaptotagmin to SNARE complexes. J. Biol. Chem. 275:6328–6336. [DOI] [PubMed] [Google Scholar]
- 57.Fukuda, M. 2002. Vesicle-associated membrane protein-2/synaptobrevin binding to synaptotagmin I promotes O-glycosylation of synaptotagmin I. J. Biol. Chem. 277:30351–30358. [DOI] [PubMed] [Google Scholar]
- 58.Bowen, M. E., K. Weninger, A. T. Brunger, and S. Chu. 2004. Single molecule observation of liposome-bilayer fusion thermally induced by SNAREs. Biophys. J. 87:3569–3585. [DOI] [PMC free article] [PubMed] [Google Scholar]
- 59.Ishii, Y., T. Yoshida, T. Funatsu, T. Wazawa, and T. Yanagida. 1999. Fluorescence resonance energy transfer between single fluorophores attached to a coiled-coil protein in aqueous solution. Chem. Phys. 247:163–173. [Google Scholar]
- 60.Ha, T., X. Zhuang, H. D. Kim, J. W. Orr, J. R. Williamson, and S. Chu. 1999. Ligand-induced conformational changes observed in single RNA molecules. Proc. Natl. Acad. Sci. USA. 96:9077–9082. [DOI] [PMC free article] [PubMed] [Google Scholar]
- 61.Marras, S. A., F. R. Kramer, and S. Tyagi. 2002. Efficiencies of fluorescence resonance energy transfer and contact-mediated quenching in oligonucleotide probes. Nucleic Acids Res. 30:e122. [DOI] [PMC free article] [PubMed] [Google Scholar]
- 62.Yang, T., O. K. Baryshnikova, H. Mao, M. A. Holden, and P. S. Cremer. 2003. Investigations of bivalent antibody binding on fluid-supported phospholipid membranes: the effect of hapten density. J. Am. Chem. Soc. 125:4779–4784. [DOI] [PubMed] [Google Scholar]
- 63.Yoshida, A., C. Oho, A. Omori, R. Kuwahara, T. Ito, and M. Takahashi. 1992. HPC-1 is associated with synaptotagmin and Ω-conotoxin receptor. J. Biol. Chem. 267:24925–24928. [PubMed] [Google Scholar]
- 64.Sutton, R. B., J. A. Ernst, and A. T. Brunger. 1999. Crystal structure of the cytosolic C2A-C2B domains of synaptotagmin III. Implications for Ca+2-independent snare complex interaction. J. Cell Biol. 147:589–598. [DOI] [PMC free article] [PubMed] [Google Scholar]
- 65.Shao, X., C. Li, I. Fernandez, X. Zhang, T. C. Südhof, and J. Rizo. 1997. Synaptotagmin-syntaxin interaction: the C2 domain as a Ca2+-dependent electrostatic switch. Neuron. 18:133–142. [DOI] [PubMed] [Google Scholar]
- 66.Cann, J. R. 1989. Phenomenological theory of gel electrophoresis of protein-nucleic acid complexes. J. Biol. Chem. 264:17032–17040. [PubMed] [Google Scholar]
- 67.Davis, A. F., J. Bai, D. Fasshauer, M. J. Wolowick, J. L. Lewis, and E. R. Chapman. 1999. Kinetics of synaptotagmin responses to Ca2+ and assembly with the core SNARE complex onto membranes. Neuron. 24:363–376. [DOI] [PubMed] [Google Scholar]
- 68.Sutton, R. B., B. A. Davletov, A. M. Berghuis, T. C. Sudhof, and S. R. Sprang. 1995. Structure of the first C2 domain of synaptotagmin I: a novel Ca2+/phospholipid-binding fold. Cell. 80:929–938. [DOI] [PubMed] [Google Scholar]
- 69.Shao, X., I. Fernandez, T. C. Südhof, and J. Rizo. 1998. Solution structures of the Ca2+-free and Ca2+-bound C2A domain of synaptotagmin I: does Ca2+ induce a conformational change? Biochemistry. 37:16106–16115. [DOI] [PubMed] [Google Scholar]
- 70.Li, C., B. Ullrich, J. Z. Zhang, R. G. Anderson, N. Brose, and T. C. Südhof. 1995. Ca2+-dependent and -independent activities of neural and non-neural synaptotagmins. Nature. 375:594–599. [DOI] [PubMed] [Google Scholar]
- 71.Littleton, J. T., T. L. Serano, G. M. Rubin, B. Ganetzky, and E. R. Chapman. 1999. Synaptic function modulated by changes in the ratio of synaptotagmin I and IV. Nature. 400:757–760. [DOI] [PubMed] [Google Scholar]
- 72.Fiser, A., and A. Sali. 2003. MODELLER: generation and refinement of homology-based protein structure models. Methods Enzymol. 374:461–491. [DOI] [PubMed] [Google Scholar]
- 73.DeLano, W. L. 2002. The PyMOL Molecular Graphics System. http://www.pymol.com.